viscous constitutive relations of solid-liquid …benh/papers/takei_jgr08a.pdfviscous constitutive...
TRANSCRIPT

Viscous constitutive relations of solid-liquid composites
in terms of grain boundary contiguity:
1. Grain boundary diffusion control model
Yasuko Takei1 and Benjamin K. Holtzman2
Received 5 June 2008; revised 24 February 2009; accepted 17 March 2009; published 25 June 2009.
[1] Viscous constitutive relations of partially molten rocks deforming in the regimeof grain boundary (GB) diffusion creep are derived theoretically on the basis ofmicrostructural processes at the grain scale. The viscous constitutive relation developed inthis study is based on contiguity as an internal state variable, which enables us to takeinto account the detailed effects of grain-scale melt distribution observed in experiments.Compared to the elasticities derived previously for the same microstructural model,the viscosities are much more sensitive to the presence of melt and variations in contiguity.As explored in this series of three companion papers, this ‘‘contiguity’’ model predictsthat a very small amount of melt (f < 0.01) significantly reduces the bulk and shearviscosities. Furthermore, a large anisotropy in viscosity is produced by anisotropy incontiguity, which occurs in deforming partially molten rocks. These results have importantimplications for deformation and melt extraction at small melt fractions, as well as forshear-induced melt segregation. The viscous and elastic constitutive relations derived interms of contiguity bridge microscopic grain-scale and macroscopic continuum properties.These constitutive relations are essential for investigating melt migration dynamics in aforward sense on the basis of the basic equations of two-phase dynamics and in an inversesense on the basis of seismological observations.
Citation: Takei, Y., and B. K. Holtzman (2009), Viscous constitutive relations of solid-liquid composites in terms of grain boundary
contiguity: 1. Grain boundary diffusion control model, J. Geophys. Res., 114, B06205, doi:10.1029/2008JB005850.
1. Introduction
[2] Deformation and melt segregation dynamics of par-tially molten regions in the Earth are controlled by viscousproperties and permeability of partially molten rocks. Inten-sive experimental studies have been performed to measureshear viscosity as a function of melt fraction, shear stressamplitude, and grain size. Significant enhancement of shearstrain rate by increasing melt fraction f, described by _e /exp(lf) with l � 20–30, has been reported in both grainboundary diffusion creep and dislocation creep regimes,which are considered to be the two dominant processescontrolling upper mantle viscosity [Mei et al., 2002; Hirthand Kohlstedt, 2003; Zimmerman and Kohlstedt, 2004].Also, microstructural changes due to stress have beenobserved, demonstrating that under nonhydrostatic stressesmicrostructures can be different from the ‘‘equilibrium’’geometry at which interfacial energy is at a minimum. Theseobservations include both grain-scale melt alignment incompression [Daines and Kohlstedt, 1997], pure shear[Takei, 2005] and simple shear [Zimmerman et al., 1999],and also melt redistribution over distances greater than the
grain scale into networks of melt-rich shear zones [Holtzmanet al., 2003a, 2003b; Holtzman and Kohlstedt, 2007].[3] Stress-induced melt redistribution can have significant
consequences if it occurs in the Earth, because viscositiesand permeability of solid-liquid composite system arestrongly influenced by the geometry of the liquid phase.In order to bridge microstructural processes and macroscopicdynamics in the Earth, we develop a viscous constitutiverelation of partially molten rocks, with which the micro-structural effects on viscosities can be assessed quantita-tively. The viscous constitutive relation developed in thisstudy is based on contiguity as an internal state variable,which enables us to take into account the detailed effects ofgrain-scale melt distribution observed in the experiments.Melt fraction is a scalar value that can be related to contiguity,but alone does not sufficiently describe the melt distributionfor calculating mechanical properties. By solving this con-stitutive relation together with the mass and momentumconservation equations of a solid-liquid system, we demon-strate the significant and intriguing consequences of micro-structural processes on large-scale deformation and meltmigration dynamics in the Earth.[4] This paper (TH1) is the first of three companion
papers. Here, a granular model developed by Takei [1998]to derive the elastic constitutive relation of solid-liquidcomposite system is modified to describe solid grainsdeforming by grain boundary (GB) diffusion creep. A
JOURNAL OF GEOPHYSICAL RESEARCH, VOL. 114, B06205, doi:10.1029/2008JB005850, 2009ClickHere
for
FullArticle
1Earthquake Research Institute, University of Tokyo, Tokyo, Japan.2Lamont-Doherty Earth Observatory, Earth Institute at Columbia
University, Palisades, New York, USA.
Copyright 2009 by the American Geophysical Union.0148-0227/09/2008JB005850$09.00
B06205 1 of 19
microstructural model for the shear viscosity of partiallymolten rocks in the GB diffusion creep regime was firstdeveloped by Cooper and Kohlstedt [1984] (CK model).The present model extends the CK model by considering themicrostructure in terms of 3-D contact function or contiguityand also by exactly solving the mass conservations, mechan-ical balances, and reaction and diffusion kinetics required ateach solid grain, hereon referred to as the contiguity model.Unlike the CK model, the contiguity model predicts that avery small amount of melt (f < 0.01) significantly reducesshear and bulk viscosities. Another important result of thecontiguity model is that an anisotropy in grain-scale meltdistribution leads to a strong viscous anisotropy of the solidframework. These results show that viscosities are muchmore sensitive to contiguity than elasticities. Consequencesof these results are explored in the following two companionpapers.[5] In the second paper [Takei and Holtzman, 2009a]
(hereinafter referred to as TH2), we investigate in detail theasymptotic behavior of viscosities at small melt fractions. Onthe basis of recent geochemical studies, there is an increasingrecognition of the importance of melt segregation dynamicsat very small melt fractions. In the third paper [Takei andHoltzman, 2009b] (hereinafter referred to as TH3), weinvestigate the shear deformation of partially molten rocks,by solving the isotropic and anisotropic viscous constitutiverelations developed in this paper together with the mass andmomentum conservation equations of two-phase flow theory.
We demonstrate that viscous anisotropy due to stress-inducedmelt alignment at the grain (or micro) scale establishesconditions for larger-scale melt redistribution into mesoscaleor macroscale melt-rich channels during deformation.[6] The approach mentioned above, from micro to macro
by solving the dynamical equations including an internalstate variable, is a ‘‘forward,’’ or ab initio, approach. Inaddition, the viscous constitutive relation obtained in thispaper enables an ‘‘inverse’’ approach to investigate therheological structure of the Earth from seismological obser-vations. Prior to this study, quantitative comparison betweenelastic and viscous properties has been difficult becauseelastic and viscous properties were calculated with com-pletely different microstructural models [e.g., Mavko, 1980;O’Connell and Budiansky, 1974; Cooper et al., 1989]. Usingthe result of this paper, together with the elastic constitutiverelation also based on contiguity [Takei, 1998], we developthe beginning of the inverse approach for mapping from aseismic velocity structure to a viscosity structure in a regionof the Earth’s interior. Although dislocation creep is alsoan important process in the upper mantle, here we focus ongrain boundary diffusion creep and leave the incorporation ofthe other process for future studies.
2. General Formulation of the Contiguity Model
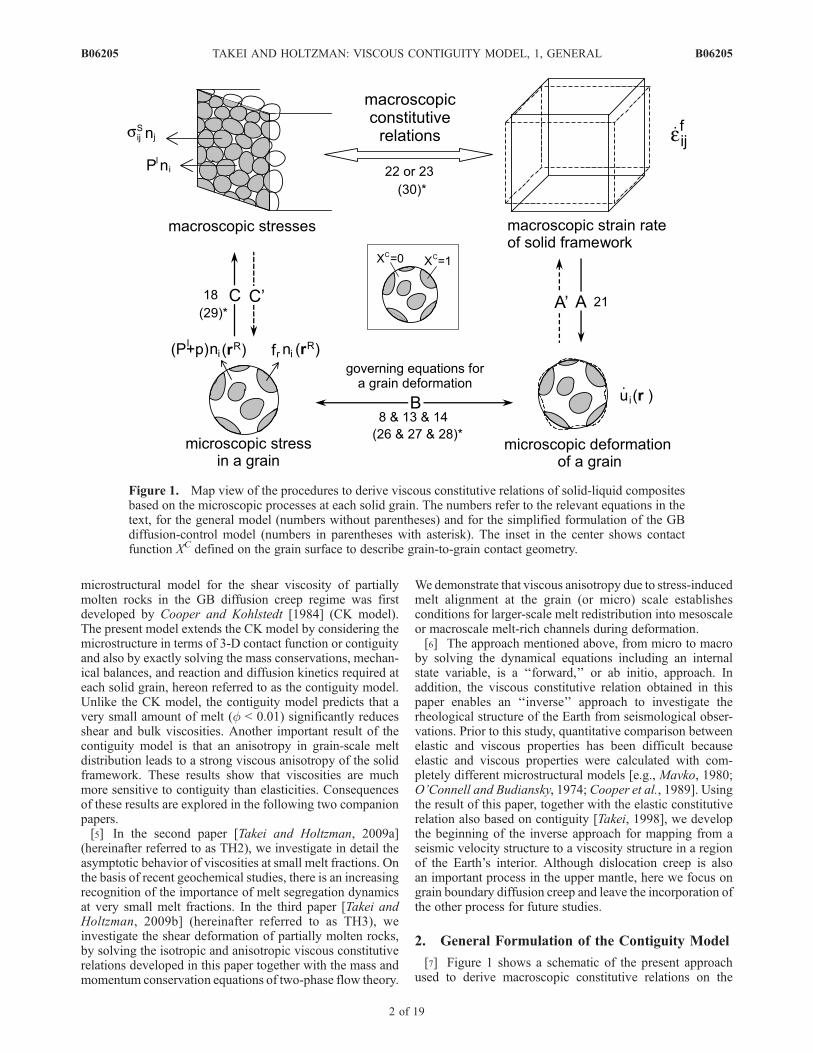
[7] Figure 1 shows a schematic of the present approachused to derive macroscopic constitutive relations on the
Figure 1. Map view of the procedures to derive viscous constitutive relations of solid-liquid compositesbased on the microscopic processes at each solid grain. The numbers refer to the relevant equations in thetext, for the general model (numbers without parentheses) and for the simplified formulation of the GBdiffusion-control model (numbers in parentheses with asterisk). The inset in the center shows contactfunction XC defined on the grain surface to describe grain-to-grain contact geometry.
B06205 TAKEI AND HOLTZMAN: VISCOUS CONTIGUITY MODEL, 1, GENERAL
2 of 19
B06205
basis of the relationships between the macroscopic and themicroscopic fields. The macroscopic variables are usuallydefined by the average over a REV (representative elemen-tary volume) containing a number of solid grains. In thepresent formulation, however, solid grains in the REV areassumed to be identical and macroscopic stress sij
S and straineijf are calculated by the average over one solid grain. In otherwords, a solid grain is taken as a microscopic unit. We also
use the term ‘‘grain unit’’ to include the liquid phasebelonging to the grain.[8] The contact geometry of each grain with the neigh-
boring grains is described by a contact function (section 2.1).Procedure A or A0 relates the macroscopic framework strainto the microscopic deformation of a grain (section 2.4).Procedure C or C0 relates the macroscopic stresses to themicroscopic stress in a grain (section 2.3). Procedure Bdescribes the physical rules governing the grain deformation(section 2.2). In this study, each grain is assumed to deformviscously due to grain boundary (GB) diffusion creep.Notations are summarized in Table 1. Subscripts i, j, k, andl are used to designate vector and tensor components in aCartesian coordinate system. For these subscripts the sum-mation convention for repeated subscripts is employedthroughout.
2.1. Geometrical Description of Solid-LiquidComposites by Contact Function and Contiguity
[9] Each solid grain of a polycrystalline aggregate isconsidered to have a polyhedral configuration, which isoften modeled by a tetrakaidekahedron or a rhombic dodeca-hedron. In this paper, a polyhedral grain shape is approxi-mated by a sphere with radius R, while the contact state ofthe grain with neighboring grains is described by a contactfunction XC(rR) defined on the grain surface as
XC rR� �
¼ 1 if the grain is in contact with solid at rR
0 if the grain is in contact with liquid at rR
�ð1Þ
(Figure 1). Microscopic coordinates r and rR for a sphericalgrain are expressed as (q, f, r) (r � R) and (q, f, R),respectively, in the spherical coordinate system (r = 0 rep-resents the grain center).[10] By using XC(rR), the contiguity tensor 8ij is defined
by
8ij ¼3
4p
Zr¼R
XC rR� �
ni nj ds; ð2Þ
where n(rR) is the exterior unit normal vector on the grainsurface and ds = sin q dq df. Scalar contiguity 8 is definedby the trace of 8ij as
8 ¼ 1
38ii ¼
1
4p
Zr¼R
XC rR� �
ds: ð3Þ
[11] In partially molten polycrystalline aggregates withdihedral angle < 60�, a connected network of the grain edgetubules separates the surface of each grain into severalcontact patches. Therefore, in this study, the area of contact(XC(rR) = 1) is considered to consist of several contactpatches which are separated from each other by the wettedarea (XC(rR) = 0). This point is of both physical andmathematical importance in formulating the viscous defor-mation of grains due to GB diffusion creep.
2.2. Governing Equations for Grain Deformation
[12] Governing equations for grain deformation describethe relationship between the microscopic deformation fieldand the microscopic stress field within each grain unit(procedure B in Figure 1). In the presence of a liquidphase, GB diffusion creep involves dissolution/precipitation
Table 1. Notation and Material Properties
Variable Description
Macroscopic VariablesuS displacement of solid phase, m.eijf, _eijf strain and strain rate, respectively,
of solid framework (extension positive),dimensionless, s�1.
sijS stress in solid phase (tension positive), Pa.
sijS0 differential solid stress defined by
equation (19) or (25), Pa.sij
B total stress on a material element,which is given by (1 � f) sijS + f Pldij, Pa.
Pl stress in liquid phase (tension positive), Pa.p normal stress discontinuity at the solid-liquid
interface due to interfacial tension(average around a grain), Pa.
f liquid volume fraction, dimensionless.8, 8ij contiguity, contiguity tensor, dimensionless.Cijkl viscosity tensor, Pa s.x bulk viscosity, Pa s.h shear viscosity, Pa s.hcc shear viscosity for Coble creep, Pa s.ksk bulk modulus of skeleton, Pa.msk shear modulus of skeleton, Pa.
Microscopic Variablesr position in a grain, m.rR position on grain surface, m.rJC position on solid-solid-liquid junction, m.n(rR) exterior unit normal on grain surface, dimensionless.XC(rR) contact function defined by equation (1), dimensionless._u(rR) velocity at grain surface relative to its center, m s�1._ur radial component of _u (outward positive), m s�1.tij(r) stress in a grain (tension positive), Pa.f(rR) traction applied on grain surface, Pa.fr radial component of f (tension positive), Pa.fr0 differential traction defined by equation (17) or (24), Pa.
J(rR) flux of component A through GB, mol m�2 s�1.Jn(r
JC) component of J normal to the solid-solid-liquid junction(toward liquid), mol m�2 s�1.
mAS, mA
L chemical potentials of component A in solidand liquid phases, respectively, J mol�1.
C fraction of component A in liquid, dimensionless.C0 equilibrium value of C for plane solid-liquid
interface, dimensionless.a activity of component A in liquid, dimensionless.a0 a when C = C0, dimensionless.p normal stress discontinuity at the solid-liquid
interface due to interfacial tension, Pa.Material and Geometrical Parameters
R grain radius, m.VS grain volume, m3.d half of the total GB thickness, m.W molar volume of component A
or vacancy, m3 mol�1.NAk Avogadro number Boltzmann
constant = Gas constant, J mol�1 K�1.T temperature, K.D diffusivity of component A through GB, m2 s�1.KJC reaction rate at solid-solid-liquid junction, mol N�1 s�1.kS intrinsic bulk modulus of solid, Pa.mS intrinsic shear modulus of solid, Pa.
B06205 TAKEI AND HOLTZMAN: VISCOUS CONTIGUITY MODEL, 1, GENERAL
3 of 19
B06205

reactions at the solid-liquid phase boundary and matterdiffusion through the liquid phase. Here, we develop ageneral formulation in which the effects of finite diffusionrates and finite reaction rates on viscosities can be investi-gated. As one of the simplest models allowing for suchgeneral formulation, we consider a binary solid-liquid systemin which the solid grains consist of pure component A and theliquid phase consists of components A (= solid component)and B. Mole fraction of component A in the liquid phase isdenoted by C. Solid-liquid interfacial tension is also takeninto account because it affects the dissolution/precipitationprocess at the pore surface.[13] Deformation of each solid grain is described by a
microscopic velocity field _u(r), which represents the velocityrelative to the grain center ( _ui = 0 at r = 0). Let tij(r) be amicroscopic stress field in a solid grain, which satisfies thecondition of mechanical equilibrium,
tij; j ¼ 0 at r < R: ð4Þ
Let f (rR) be a microscopic traction field at the grain surface,which is related to tij as
fi ¼ tij nj at r ¼ R: ð5Þ
Procedure B in Figure 1 describes the relationship between_ui and tij or fi. In this study, we are mostly concerned withsteady state creep conditions. Hence, we consider that thesystem keeps the relaxed state of grain boundary sliding andthat the tangential component of traction fi(r
R) is zero atXC(rR) = 1. This assumption is not made when consideringelasticity [Takei, 1998].[14] Resistance for creep comes from the kinetics of
diffusion processes. Let _ur and fr be radial components ofvelocity and traction, respectively; _ur = _uini and fr = fini. LetJ(rR) be the flux of component A through GB. Radialcomponent of J is zero. From the mass conservation of thesolid phase, _ur at the grain-to-grain contact faces is accom-modated by J as
�Wdr � J ¼ _ur at XC rR� �
¼ 1; ð6Þ
where W represents the molar volume of component A inthe GB and d represents the thickness of GB belonging toone grain (half of the total GB thickness). Flux J is relatedto the vacancy flux Jv driven by diffusion, J = �Jv =DvrNv, where Dv is the vacancy diffusivity in the GB andNv is number of vacancies per unit volume of GB. Nv is
related to fr as Nv = N exp(�Uv�frWNAkT
), where N (= W�1) is the
number of atoms or molecules of component A per unitvolume of GB and Uv is formation energy of vacancy atGB. Molar volume of vacancy is assumed to be equal tothat of component A. NA, k, and T are Avogadro number,Boltzmann constant, and temperature, respectively. Let Dbe the diffusivity of component A through GB, which is
related to Dv as D = DvNvref/N with Nv
ref = N exp(�Uv�frefr W
NAkT),
where frref is a constant representing a reference traction.
Then, J is related to fr as
J ¼ D
NAkTrfr at XC rR
� �¼ 1: ð7Þ
From equations (6) and (7), we obtain the Poisson equation
r2fr ¼ �NAkT
DWd_ur at XC rR
� �¼ 1: ð8Þ
[15] To obtain boundary conditions for equation (8) at theperiphery of each contact patch, we consider the flux ofcomponent A through the contact periphery and considerthe kinetic condition for this flux. Let Pl be liquid stress(tension positive), which is assumed to be uniform withinthe grain unit. Let C0 be the value of liquid composition Cat which the solid and liquid phases are in contact with aplane solid-liquid interface and in chemical equilibriumunder the same stress Pl and temperature T. This conditionis written as
mSA T ;Pl� �
¼ mLA T ;Pl;C0
� �; ð9Þ
where mAS and mA
L are chemical potentials of component A inthe solid and liquid phases, respectively. Using equation (9)as a reference state, mA
S and mAL at the contact periphery are
written as [e.g., Lehner, 1995]
mSA rJC� �
¼ mSA T ;Pl� �
� fr rJC� �
� Pl� �
W
mLA rJC� �
¼ mLA T ;Pl;C0
� �þ NAkT ln
a rJC� �a0
� �;
8<: ð10Þ
where rJC represents a position on the periphery of eachcontact patch or, in other words, a position on the solid-solid-liquid junction, and a represents the activity of com-ponent A in the liquid phase, which generally is a nonlinearfunction of C. From equations (9) and (10), we obtain
mSA rJC� �
� mLA rJC� �
¼ � fr rJC� �
� Pl� �
W� NAkT lna rJC� �a0
� �;
ð11Þ
where a0 represents a when C = C0. Let Jn(rJC) be a
component of J outward normal to the contact periphery. Thesign convention for Jn is defined such that Jn is positivewhen component A flows from solid to liquid. Then, theproduct (mA
S � mAL)Jnd gives the work per unit length of
periphery dissipated by the irreversible processes as thematerial passes through the phase boundary [e.g., Lehner,1995]. In other words, mA
S � mAL gives the driving force for
the dissolution/precipitation reaction through the solid-solid-liquid junction. The flux Jn is assumed to be proportional tothe driving force,
Jn rJC� �
¼ KJCW�1 mSA rJC� �
� mLA rJC� �� �
; ð12Þ
whereKJC represents the reaction rate at the solid-solid-liquidjunction. From equations (11) and (12), we obtain
fr rJC� �
¼ Pl �Jn rJC� �KJC
� NAkT
Wln
a rJC� �a0
� �; ð13Þ
which gives the boundary condition for equation (8).
B06205 TAKEI AND HOLTZMAN: VISCOUS CONTIGUITY MODEL, 1, GENERAL
4 of 19
B06205

[16] Traction fi(rR) at the grain surface in contact with
liquid is written as
fi ¼ Pl þ p� �
ni at XC rR� �
¼ 0; ð14Þ
where p represents the normal stress discontinuity at thesolid-liquid interface due to interfacial tension.[17] The procedure labeled B in Figure 1 is given by
equations (8), (13), and (14). The equations are not closedyet. Activity a(rJC) included in equation (13) is a functionof liquid composition C. The equations governing thebehavior of C are discussed in detail in section 2.5 andare not derived here.
2.3. Relation Between Macroscopic Stressesand Microscopic Stress Field
[18] Macroscopic solid stress sijS is defined by the volume
integration of microscopic stress tij(r) over a solid grain
sSij ¼
1
VS
Zr�R
tij rð Þ dV ; ð15Þ
where VS (= 4pR3/3) is the grain volume and dV = R2 sin qdq df dr. Under equation (4), the volume integration inequation (15) is given by the surface integration of fi(r
R) as
sSij ¼
1
2VS
Zr¼R
fi rRj þ fjr
Ri
�dS; ð16Þ
where dS = R2 sin q dq df. Traction fi(rR) at XC(rR) = 0 is
given by equation (14). Although Pl can be assumed to beuniform within each grain unit, p is not necessarily uniform,as shown by TH2. Let �p be the average of p over the wettedsurface of the grain. By introducing the differential tractionfr0 defined by
f 0r ¼ fr � Pl þ �p� �
; ð17Þ
fi can be expressed as fi = XC fr0ni + (1 � XC) (p � �p) ni +
(Pl + �p)ni. Because Pl + �p is uniform within each grainunit, equation (16) is rewritten as
sS0
ij ¼ R
VS
Zr¼R
XCf 0r þ 1� XC� �
p� �pð Þ�
ninjdS; ð18Þ
where sijS0 is the differential solid stress defined by
sS0
ij ¼ sSij � Pl þ �p
� �dij: ð19Þ
Equation (18) gives the procedure labeled C in Figure 1.
2.4. Relation Between Macroscopic Framework Strainand Microscopic Grain Deformation
[19] The macroscopic framework strain eijf is defined by
the macroscopic displacement field of the solid phase uS as
efij ¼1
2
@uSi@xj
þ@uSj@xi
!: ð20Þ
Framework strain eijf involves a relative displacement
between the centers of adjacent grains. If there is no overlap,opening, nor slip between two neighboring grains, therelative displacement related to eij
f should be accommodatedby the deformation of the two grains. For elasticity, on thebasis of this consideration, the macroscopic strain eij
f isrelated to the microscopic displacement field ui(r
R) [Takei,1998, equation (11)]. Similarly, for viscosity, the macro-scopic strain rate _eij
f is related to themicroscopic velocity field_ui(r
R), as follows. Because there is no overlap nor openingbetween the two neighboring grains, the radial component ofgrain deformation _ur is related to _eij
f as
_ur rR� �
¼ _efijrRj ni at XC rR
� �¼ 1: ð21Þ
Unlike the radial component, the tangential component of_ui is not related to _eij
f , because grain boundary sliding isassumed to be possible at the contact face. This assump-tion is not made when considering elasticity [Takei, 1998].Equation (21) gives the procedure labeled A in Figure 1.
2.5. Derivation of Macroscopic Constitutive Relation:Overview
[20] The parts of the derivation discussed previously(sections 2.2–2.4) must now be brought together to derivethe macroscopic constitutive relations. The derivation ismade by following procedures A–C in Figure 1 in clockwiseorder. Under a given _eij
f , microscopic velocity _ur at XC = 1 is
given by equation (21). Then, microscopic traction fr atXC = 1 is obtained by solving equations (8) and (13). Also,fr at X
C = 0 is given by equation (14). By substituting theseresults into equation (18), the macroscopic constitutiverelations can be derived in the form of
sSij � Pl þ �p
� �dij ¼ Cijkl _e
fkl; ð22Þ
where Cijkl represents a viscosity tensor. In Appendix A, webriefly discuss the importance of the clockwise approachused in this study.[21] By using the total stress in the material element
defined by sijB = (1 � f)sij
S + fPldij with liquid volumefraction f, constitutive relation (22) is written as
sBij � Pl þ 1� fð Þ�p
� �dij ¼ CB
ijkl _efkl; ð23Þ
where CijklB and Cijkl are related by Cijkl
B = (1 � f)Cijkl. Theviscosities defined by equation (22) are used in this paper.This simplifies the subsequent discussion, because Cijkl isdetermined only by the contact state described by XC,whereas Cijkl
B additionally depends on liquid volume fraction.[22] In solving Cijkl, we have two problems. The first
concerns geometry. In order to solve the Poisson equation (8)with boundary condition (13) in a general way that allowsfor any form of contact geometry, a numerical method mustbe used. In this study, we do not use a numerical methodbut simplify the model to derive some approximate analyt-ical solutions for Cijkl. Two types of simplified models areused. One is a two-dimensional (2-D) model, in which grainsurface is a circle and contact patches are given by severalsegments of the circle. The other is a three-dimensional(3-D) model in which each contact patch is assumed to be a
B06205 TAKEI AND HOLTZMAN: VISCOUS CONTIGUITY MODEL, 1, GENERAL
5 of 19
B06205

circular plane. In the 2-D model, analytical solutions forCijkl can be derived for all states of contiguity between8 = 0 and 8 = 1, whereas applicability of the 3-D model tolarge contiguity is limited because of the overlap of thecontact patches. Therefore, the 2-D model is useful forinvestigating the asymptotic behavior at 8 ! 1, whichcorresponds to f ! 0. The 3-D model is useful for inves-tigating the quantitative effects of grain-to-grain contactgeometry to viscosity.[23] The second problem concerns the rate-limiting
process. The activity a(rJC) included in equation (13) isdetermined by liquid composition C. C (or a) is a variableto be solved from the governing equations which are notderived in section 2. As postulated in the CK model[Cooper et al., 1989], if matter diffusion in the liquidphase and dissolution/precipitation reaction rates are muchfaster than matter diffusion through the GB, the deformationis rate limited by GB diffusion. In this regime, effects of C(or a) are negligible and Cijkl can be calculated only fromthe equations derived in sections 2.1–2.4. A simplifiedversion of the contiguity model is based on the assumptionthat liquid diffusivity and reaction rates are infinitely high;this version is hereafter referred to as the ‘‘GB diffusioncontrol model.’’ The applicability of the GB diffusion controlmodel breaks down when the effects of finite liquid diffu-sivity and finite reaction rates are not negligible. In thiscase, a more complete compositional model including thegoverning equations of C is needed (TH2).[24] Table 2 summarizes the chemical and geometrical
conditions of the models developed in the present series ofpapers. In this paper (TH1), the GB diffusion control model isdeveloped for both 2-D and 3-D configurations, and detailedeffects of microstructure on viscosities are investigated. Inthe following paper (TH2), a more complete compositionalmodel (hereafter referred to as the ‘‘compositional model’’)is developed to assess the applicability or limitation of theGB diffusion control model. As shown by TH2, the effectsof finite liquid diffusivity and finite reaction rates becomesignificant at very small melt fraction. Also because thegoverning equations for C are complicated, we solve thecompositional model in the 2-D configuration, allowing usto study the asymptotic behavior without the geometricalcomplexity of the 3-D model, including the problem ofoverlapping patches. In TH3, effects of viscous anisotropyon two-phase dynamics are investigated under 2-D boundaryconditions. Therefore, the 2-D version of the GB diffusioncontrol model is generalized by taking into account contactanisotropy.
3. Simplified Formulation for GB DiffusionControl Model
[25] The general formulation presented in section 2 issimplified to the GB diffusion control model by assuming
that the liquid diffusivity and dissolution/precipitation reac-tion rates are infinitely high and hence the deformation rateis limited by matter diffusion through GB. This assumptionwas also used in the CK model. Under this assumption, aand C are constants and do not affect the viscosities. Also,effects of interfacial tension and hence p are neglected forsimplicity. Then, because KJC = 1 and a = a0 (C = C0), thelast two terms in the right-hand side of equation (13) vanish.The differential traction and differential solid stress generallydefined by equations (17) and (19) are simplified to
f 0r ¼ fr � Pl ð24Þ
and
sS0
ij ¼ sSij � Pl dij: ð25Þ
Because Pl is a constant in the grain unit, the governingequations for grain deformation generally given byequations (8), (13), and (14) are simply given by
r2f 0r ¼ �NAkT
DWd_ur at XC rR
� �¼ 1 ð26Þ
with boundary condition at the contact periphery
f 0r rJC� �
¼ 0; ð27Þ
and
f 0r ¼ 0 at XC rR� �
¼ 0: ð28Þ
The procedure B in Figure 1 is given by equations (26)–(28). The relationship between fr
0 and sijS0 generally written
as equation (18) now becomes
sS0
ij ¼ R
VS
Zr¼R
XCf 0r ninjdS; ð29Þ
which gives the procedure C in Figure 1. The relationshipbetween _ur and _eij
f is again described by equation (21),which gives the procedure A in Figure 1. The macroscopicconstitutive relations generally written as equation (22) aresimplified to
sSij � Pldij ¼ Cijkl _e
fkl: ð30Þ
4. GB Diffusion Control Model in TwoDimensions
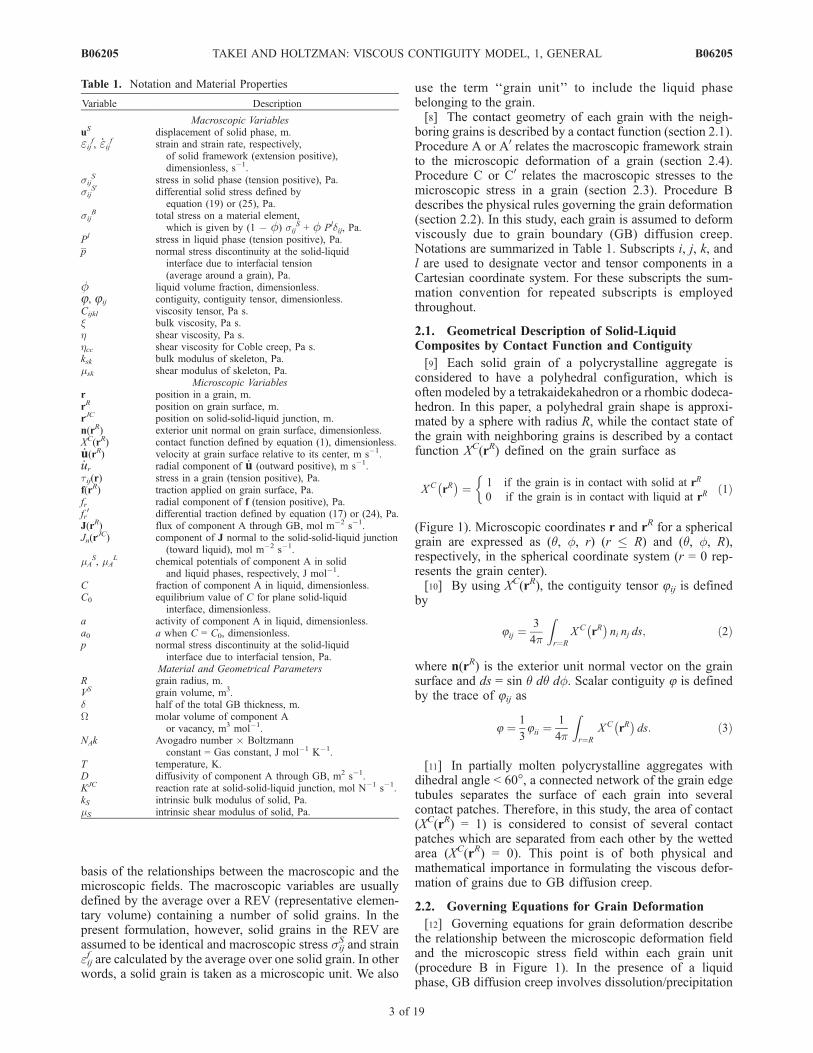
[26] In the 2-D model, the grain surface is a circle withradius R and contact patches are given by several segmentsof the circle. A domain comprising 1/4 of the circle isshown in Figure 2. We introduce a contact function XC(q)which takes a value of 1 at 0 � q � q1, q2 � q � q3, andq4 � q � p/2, where q1 = p/8 � Dq, q2 = p/8 + Dq, q3 =3p/8 � Dq, and q4 = 3p/8 + Dq, and is symmetric withrespect to x and y axes. Contiguity in two dimensions isdefined as 82D = (1 � 8Dq/p), which represents the length
Table 2. Summary of Contiguity Model Forms
Chemical Condition
Geometrical Condition
2-D 3-D
GB diffusion control model isotropic (TH1) anisotropic (TH1)anisotropic (TH3)
Compositional model isotropic (TH2)
B06205 TAKEI AND HOLTZMAN: VISCOUS CONTIGUITY MODEL, 1, GENERAL
6 of 19
B06205
of melt-free GB normalized to the total length of grainsurface. Using this isotropic configuration characterized byonly one parameter Dq (0 � Dq � p/8), the shear andbulk viscosities are derived as functions of contiguity.[27] Procedures A–C presented in section 3 are solved
analytically. Under given _eijf (i,j = x,y), differential
traction fr0(q) at each contact patch is obtained by solving
equation (26) with equation (21) and (nx, ny) = (cosq, sinq)as
f 0r qð Þ ¼ �NAkTR3
DWd1
4q2 � 1
8cos 2q
� �_efxx
�
þ 1
4q2 þ 1
8cos 2q
� �_efyy �
1
4sin 2q _efxy
�þ c1qþ c2; ð31Þ
where c1 and c2 are integral constants determined to satisfyboundary condition (27). The six integral constants for thethree contact patches at 0 � q � p/2 are determined fromthe six boundary conditions
f 0r qmð Þ ¼ 0 m ¼ 1; 2; 3; 4ð Þ ð32Þ
Jq 0ð Þ ¼ Jq p=2ð Þ ¼ 0; ð33Þ
where Jq represents the q component of J and equations (33)represent the symmetry of the problem. The 2-D version ofequation (29) to calculate differential solid stress sij
S0(i, j = x, y)from fr
0(q) is
sS0
ij ¼ 1
p
Z 2p
0
XC qð Þ f 0r qð Þninjdq: ð34Þ
[28] Shear viscosity h is derived by calculating deviatoricstress sxx
S0 � syyS0 under shear deformation: _exx
f = � _eyyf . Bulk
viscosity x is derived by calculating isotropic stress sxxS0 +
syyS0 under volumetric deformation: _exx
f = _eyyf . The viscosities
of the 2-D model are calculated as
h ¼sS0xx�sS0
yy
2
_efxx � _efyy; x ¼
sS0xxþsS0
yy
2
_efxx þ _efyy: ð35Þ
Without melt (XC(0 � q � 2p) = 1), h is obtained as
hcc ¼1
16
NAkTR3
DWd; ð36Þ
which represents the Coble creep viscosity in two dimen-sions. The viscosities in two dimensions are normalized tohcc in equation (36).
4.1. Comparison to the CK Model
[29] As an important precedent to this model, Cooperand Kohlstedt [1984] treated the deformation of partiallymolten rocks as being rate limited by GB diffusion. Forcomparison, the shear viscosity of the CK model, hCK, iscalculated for the same configuration as the contiguity model.For this purpose, the CK model needs to be reformulatedwithin the framework of this present study. The gradient ofchemical potential used byCooper et al. [1989] as the drivingforce for the GB diffusion can be identified with that oftraction fr. Therefore, we reformulate the CKmodel to satisfyequations (31) and (33). The shear viscosity of the CKmodelapproaches that of the Coble creep model at small meltfraction [Cooper et al., 1989]. This feature is reproducedby requiring monotonic potential change and unidirectionalmatter flux at 0 � q � p/2. The boundary conditions at qm(m = 1–4) consistent with this requirement are written as
f 0r qmð Þ ¼ f 0r qmþ1ð Þ; Jq qmð Þ ¼ Jq qmþ1ð Þ m ¼ 1; 3ð Þ; ð37Þ
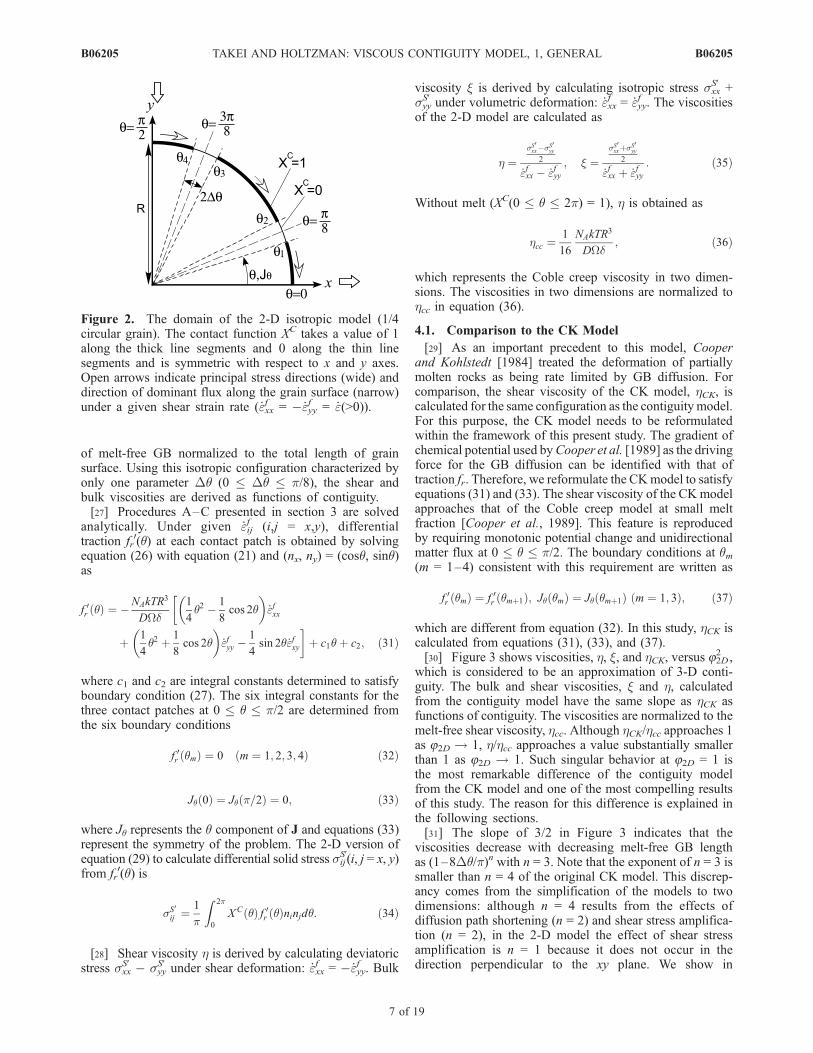
which are different from equation (32). In this study, hCK iscalculated from equations (31), (33), and (37).[30] Figure 3 shows viscosities, h, x, and hCK, versus 82D
2 ,which is considered to be an approximation of 3-D conti-guity. The bulk and shear viscosities, x and h, calculatedfrom the contiguity model have the same slope as hCK asfunctions of contiguity. The viscosities are normalized to themelt-free shear viscosity, hcc. Although hCK/hcc approaches 1as 82D ! 1, h/hcc approaches a value substantially smallerthan 1 as 82D ! 1. Such singular behavior at 82D = 1 isthe most remarkable difference of the contiguity modelfrom the CK model and one of the most compelling resultsof this study. The reason for this difference is explained inthe following sections.[31] The slope of 3/2 in Figure 3 indicates that the
viscosities decrease with decreasing melt-free GB lengthas (1–8Dq/p)n with n = 3. Note that the exponent of n = 3 issmaller than n = 4 of the original CK model. This discrep-ancy comes from the simplification of the models to twodimensions: although n = 4 results from the effects ofdiffusion path shortening (n = 2) and shear stress amplifica-tion (n = 2), in the 2-D model the effect of shear stressamplification is n = 1 because it does not occur in thedirection perpendicular to the xy plane. We show in
Figure 2. The domain of the 2-D isotropic model (1/4circular grain). The contact function XC takes a value of 1along the thick line segments and 0 along the thin linesegments and is symmetric with respect to x and y axes.Open arrows indicate principal stress directions (wide) anddirection of dominant flux along the grain surface (narrow)under a given shear strain rate ( _exx
f = � _eyyf = _e(>0)).
B06205 TAKEI AND HOLTZMAN: VISCOUS CONTIGUITY MODEL, 1, GENERAL
7 of 19
B06205
section 5 that the exponent obtained in the 3-D model agreeswith that of the original CK model.
4.2. Singularity at 82D = 1
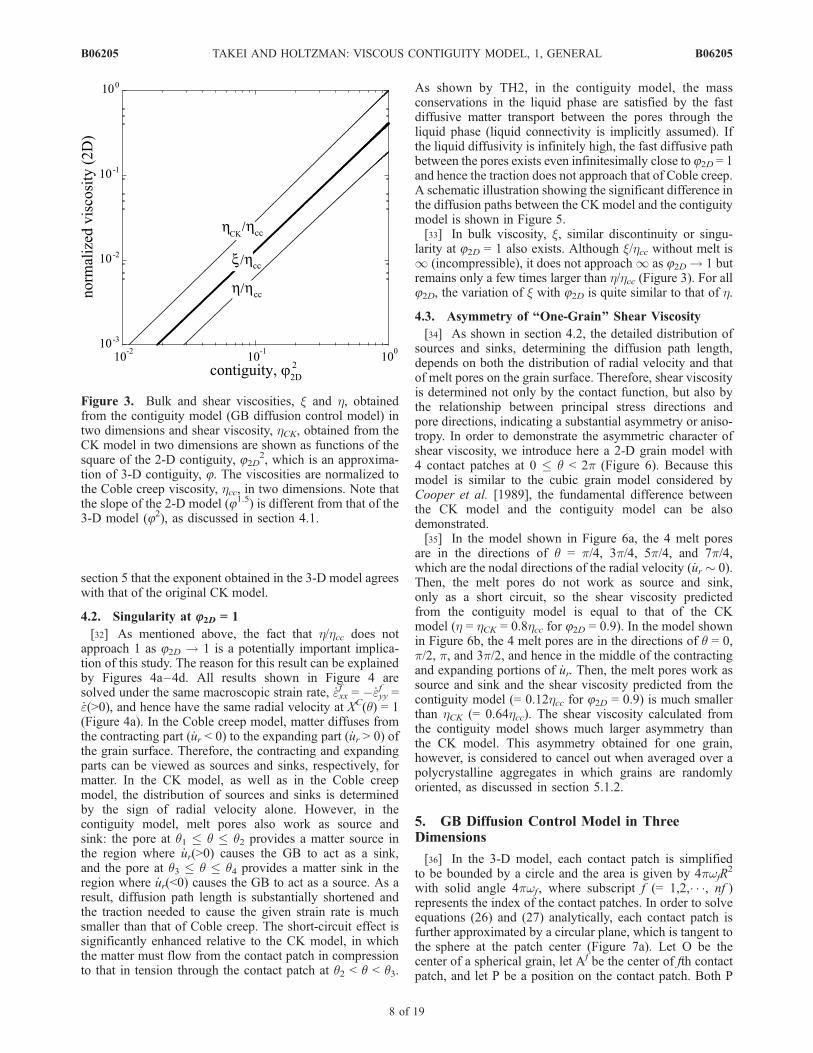
[32] As mentioned above, the fact that h/hcc does notapproach 1 as 82D ! 1 is a potentially important implica-tion of this study. The reason for this result can be explainedby Figures 4a–4d. All results shown in Figure 4 aresolved under the same macroscopic strain rate, _exx
f = � _eyyf =
_e(>0), and hence have the same radial velocity at XC(q) = 1(Figure 4a). In the Coble creep model, matter diffuses fromthe contracting part ( _ur < 0) to the expanding part ( _ur > 0) ofthe grain surface. Therefore, the contracting and expandingparts can be viewed as sources and sinks, respectively, formatter. In the CK model, as well as in the Coble creepmodel, the distribution of sources and sinks is determinedby the sign of radial velocity alone. However, in thecontiguity model, melt pores also work as source andsink: the pore at q1 � q � q2 provides a matter source inthe region where _ur(>0) causes the GB to act as a sink,and the pore at q3 � q � q4 provides a matter sink in theregion where _ur(<0) causes the GB to act as a source. As aresult, diffusion path length is substantially shortened andthe traction needed to cause the given strain rate is muchsmaller than that of Coble creep. The short-circuit effect issignificantly enhanced relative to the CK model, in whichthe matter must flow from the contact patch in compressionto that in tension through the contact patch at q2 < q < q3.
As shown by TH2, in the contiguity model, the massconservations in the liquid phase are satisfied by the fastdiffusive matter transport between the pores through theliquid phase (liquid connectivity is implicitly assumed). Ifthe liquid diffusivity is infinitely high, the fast diffusive pathbetween the pores exists even infinitesimally close to 82D = 1and hence the traction does not approach that of Coble creep.A schematic illustration showing the significant difference inthe diffusion paths between the CK model and the contiguitymodel is shown in Figure 5.[33] In bulk viscosity, x, similar discontinuity or singu-
larity at 82D = 1 also exists. Although x/hcc without melt is1 (incompressible), it does not approach1 as 82D ! 1 butremains only a few times larger than h/hcc (Figure 3). For all82D, the variation of x with 82D is quite similar to that of h.
4.3. Asymmetry of ‘‘One-Grain’’ Shear Viscosity
[34] As shown in section 4.2, the detailed distribution ofsources and sinks, determining the diffusion path length,depends on both the distribution of radial velocity and thatof melt pores on the grain surface. Therefore, shear viscosityis determined not only by the contact function, but also bythe relationship between principal stress directions andpore directions, indicating a substantial asymmetry or aniso-tropy. In order to demonstrate the asymmetric character ofshear viscosity, we introduce here a 2-D grain model with4 contact patches at 0 � q < 2p (Figure 6). Because thismodel is similar to the cubic grain model considered byCooper et al. [1989], the fundamental difference betweenthe CK model and the contiguity model can be alsodemonstrated.[35] In the model shown in Figure 6a, the 4 melt pores
are in the directions of q = p/4, 3p/4, 5p/4, and 7p/4,which are the nodal directions of the radial velocity ( _ur � 0).Then, the melt pores do not work as source and sink,only as a short circuit, so the shear viscosity predictedfrom the contiguity model is equal to that of the CKmodel (h = hCK = 0.8hcc for 82D = 0.9). In the model shownin Figure 6b, the 4 melt pores are in the directions of q = 0,p/2, p, and 3p/2, and hence in the middle of the contractingand expanding portions of _ur. Then, the melt pores work assource and sink and the shear viscosity predicted from thecontiguity model (= 0.12hcc for 82D = 0.9) is much smallerthan hCK (= 0.64hcc). The shear viscosity calculated fromthe contiguity model shows much larger asymmetry thanthe CK model. This asymmetry obtained for one grain,however, is considered to cancel out when averaged over apolycrystalline aggregates in which grains are randomlyoriented, as discussed in section 5.1.2.
5. GB Diffusion Control Model in ThreeDimensions
[36] In the 3-D model, each contact patch is simplifiedto be bounded by a circle and the area is given by 4pwfR
2
with solid angle 4pwf , where subscript f (= 1,2,� � �, nf )represents the index of the contact patches. In order to solveequations (26) and (27) analytically, each contact patch isfurther approximated by a circular plane, which is tangent tothe sphere at the patch center (Figure 7a). Let O be thecenter of a spherical grain, let Af be the center of fth contactpatch, and let P be a position on the contact patch. Both P
Figure 3. Bulk and shear viscosities, x and h, obtainedfrom the contiguity model (GB diffusion control model) intwo dimensions and shear viscosity, hCK, obtained from theCK model in two dimensions are shown as functions of thesquare of the 2-D contiguity, 82D
2, which is an approxima-tion of 3-D contiguity, 8. The viscosities are normalized tothe Coble creep viscosity, hcc, in two dimensions. Note thatthe slope of the 2-D model (81.5) is different from that of the3-D model (82), as discussed in section 4.1.
B06205 TAKEI AND HOLTZMAN: VISCOUS CONTIGUITY MODEL, 1, GENERAL
8 of 19
B06205

and Af are on the spherical grain surface. P is mapped to P0
on the circular plane, where P0 is in the same plane astriangle OAfP and the length of line segment AfP0 is takento be equal to the length of segment AfP along the greatcircle (Figure 7b). Radial velocity at the spherical surface,_ur(P), is mapped to the circular plane by _uz(P
0) = _ur(P),
where z direction is taken to be normal to the circularplane. Then, fz
0(P0) satisfying equations (26) and (27) issolved analytically on this circular plane and is againmapped to the contact patch on the spherical surface byf 0r(P) = f 0z(P
0). In this manner, at procedure B in Figure 1,fr0(rR) at XC(rR) = 1 is obtained analytically from _ur(r
R)at XC(rR) = 1.[37] Unit vectors for the spherical coordinate system
(q, f, r) at Af are written as eqf , ef
f and erf , detailed
descriptions for which are presented in Appendix B.Position P0 on the circular plane is represented by polarcoordinate (0 � r � 1, 0 � F � 2p); the length of linesegment AfP0 is represented by afr, where af represents theradius of the circular plane, and the angle between vectorsAfP0 and eq
f is represented by F. The af and wf are related byaf = R cos�1(1 � 2wf). For P
0 represented by (r, F), outwardunit normal to the spherical grain at the correspondingposition P is written as
nf r;Fð Þ ¼ cosaf rR
�e fr þ sin
af rR
�cosF e
fq þ sinF e
ff
�: ð38Þ
For areal segment rdrdF on the circular plane, thecorresponding area on the spherical grain is b(r)rdrdF,where b(r) is given by
b rð Þ ¼ R
af r
� �sin
af rR
�: ð39Þ
[38] Cijkl is obtained by following procedures A–C inFigure 1 in clockwise order. At procedure C, the integral inequation (29) over the spherical grain is converted to theintegral over the circular plane by using equations (38) and(39). Then, the solution for Cijkl can be written as
Cijkl ¼3NAkTR
3
32DWd
Xnff¼1
af
R
�4 �4
p2
Z 1
r¼0
Z 2p
F¼0
Z 1
r0¼0
Z 2p
F0¼0
nfi r;Fð Þn f
j r;Fð Þnfk r0;F0ð Þnf
l r0;F0ð ÞG r;F; r0;F0ð Þ� b rð Þ r r0 dr dF dr0 dF0; ð40Þ
Figure 4. Solutions for the 2-D model. (a) Radial velocityat the contact face (XC(q) = 1) under a given shear strain rate( _exx
f = � _eyyf = _e(>0)) versus position q along the 2-D grain
surface for 1/4 of a circle (0 � q � p/2). (b) Differentialtraction on the grain surface calculated from the CK modelat various values of 82D and from the Coble creep model at82D = 1. Arrows show the direction of matter flux. Top grayand white bars show the regions acting as matter source andsink, respectively. Positions qm (m = 1–4) are shown for thecase of 82D = 0.92. (c) Differential traction on the grainsurface calculated from the contiguity model at variousvalues of 82D (bold solid lines) and from the Coble creepmodel at 82D = 1 (dotted line). Top gray and white bars showthe regions acting as matter source and sink, respectively, forthe case of 82D = 0.92. (d) Flux of component A at thecontact face (XC(q) = 1) calculated from the contiguity model(bold lines) and from the CK model (thin lines).
B06205 TAKEI AND HOLTZMAN: VISCOUS CONTIGUITY MODEL, 1, GENERAL
9 of 19
B06205
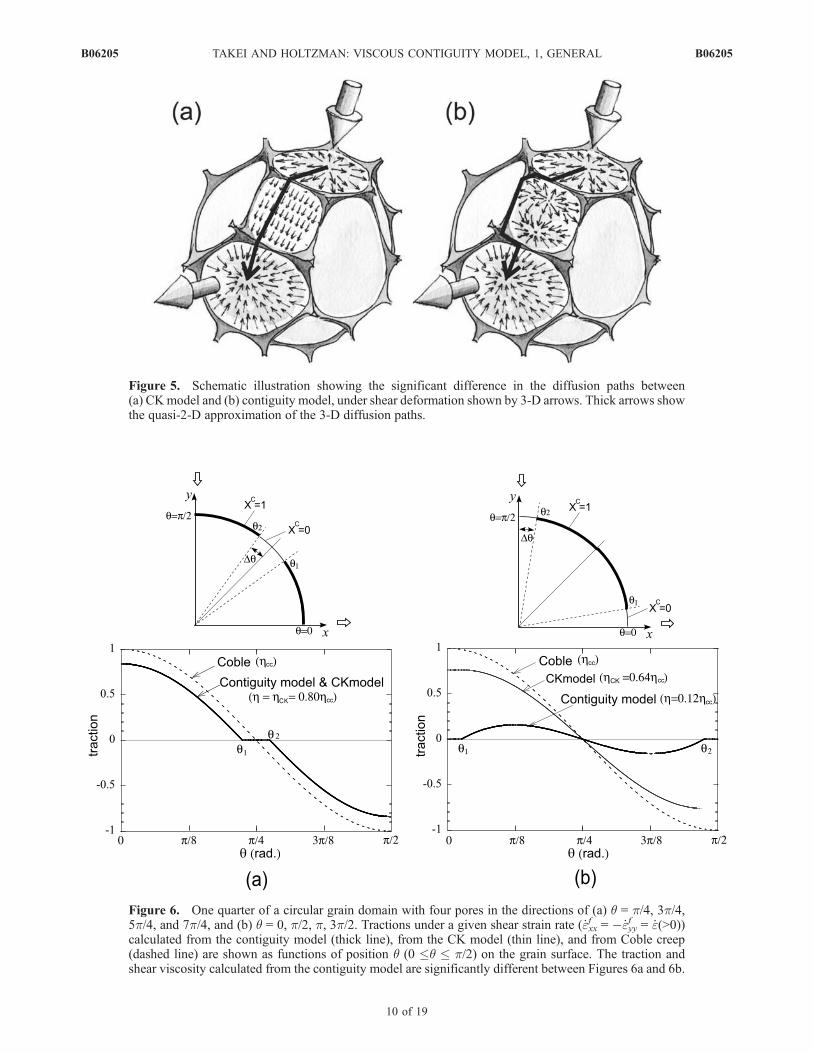
Figure 5. Schematic illustration showing the significant difference in the diffusion paths between(a) CKmodel and (b) contiguity model, under shear deformation shown by 3-D arrows. Thick arrows showthe quasi-2-D approximation of the 3-D diffusion paths.
Figure 6. One quarter of a circular grain domain with four pores in the directions of (a) q = p/4, 3p/4,5p/4, and 7p/4, and (b) q = 0, p/2, p, 3p/2. Tractions under a given shear strain rate ( _exx
f = � _eyyf = _e(>0))
calculated from the contiguity model (thick line), from the CK model (thin line), and from Coble creep(dashed line) are shown as functions of position q (0 �q � p/2) on the grain surface. The traction andshear viscosity calculated from the contiguity model are significantly different between Figures 6a and 6b.
B06205 TAKEI AND HOLTZMAN: VISCOUS CONTIGUITY MODEL, 1, GENERAL
10 of 19
B06205

where (r, F) and (r0, F0) represent the points on the circularplane, and G is the Green’s function
G r;F; r0;F0ð Þ ¼ ln
ffiffiffiffiffiffiffiffiffiffiffiffiffiffiffiffiffiffiffiffiffiffiffiffiffiffiffiffiffiffiffiffiffiffiffiffiffiffiffiffiffiffiffiffiffiffiffiffiffiffiffiffiffiffiffir2 þ r0 2 � 2rr0 cos F� F0ð Þ
pffiffiffiffiffiffiffiffiffiffiffiffiffiffiffiffiffiffiffiffiffiffiffiffiffiffiffiffiffiffiffiffiffiffiffiffiffiffiffiffiffiffiffiffiffiffiffiffiffiffiffiffiffiffiffiffiffiffir2r0 2 þ 1� 2rr0 cos F� F0ð Þ
p !
: ð41Þ
When we further approximate n f (r, F) as a constant acrosseach plane, equal to the value at the center of the patch, er
f,and also approximate b(r) as unity, equation (40) can berewritten in such a simple form as
Cijkl ¼3NAkTR
3
32DWd
Xnff¼1
af
R
�4nfi n
fj n
fkn
fl ; ð42Þ
where n f is equal to erf at the center of each contact.
[39] In the following sections, using these 3-D models,the effects of contiguity on the bulk and shear viscosities
(section 5.1), and also the effects of anisotropic contacts onthe viscous anisotropy (section 5.2) are investigated. Cijkl
are calculated from both equations (40) and (42), so thatwe can confirm the validity of the simplified formula (42).For comparison, elasticities are also calculated by usingthe 3-D elasticity model of Takei [1998].
5.1. Effects of Contiguity on Bulk and Shear Viscosities
5.1.1. Isotropic Grain Model[40] By analogy to a tetrakaidekahedral grain, each
spherical grain is considered to have 14 contact patches(nf = 14) in the same directions as the 14 faces of atetrakaidekahedral grain (Figure 8). The directions of thecenters of the 14 patches (point Af in Figure 7a) are (q, f) =(p/2, 0), (p/2, p/2), (p/2, p), (p/2, 3p/2), (p, 0), (0, 0), (q0, p/4),(q0, 3p/4), (q0, 5p/4), (q0, 7p/4), (p� q0, p/4), (p� q0, 3p/4),(p � q0, 5p/4), and (p � q0, 7p/4) with cosq0 = 1/
ffiffiffi3
p. The
former 6 and the latter 8 directions correspond to those ofsquare and hexagonal faces, respectively, of a tetrakaide-kahedron. The contact patches corresponding to the squareand hexagonal faces are hereafter referred to as index f =1–6 and f = 7–14, respectively. When values of af aretaken to be equal for f = 1–6 and also for f = 7–14, viscositytensor Cijkl calculated from equation (40) or (42) has sub-stantial cubic anisotropy. As discussed in section 4.3, theanisotropy results from the interaction between the radialvelocity field and the melt pore distribution on the grainsurface and is characteristic of the viscosity calculated forone grain. However, when af=7–14/af=1–6 is taken to be 1.03,Cijkl obtained for one grain becomes isotropic. Therefore, thetetrakaidekahedral grain model with af=7–14/af=1–6 = 1.03is hereafter referred to as the ‘‘isotropic grain model’’(Figure 8). First, in this section, effects of contiguity onviscosity are investigated on the basis of the isotropic grainmodel. Then, in section 5.1.2, the sensitivity of viscosity tothe various grain models (with packing coordination 14, 12,and 8) is checked, and the solutions for the isotropic grainmodel are shown to be robust.
Figure 7. The f th contact patch on the spherical grain(gray) is approximated by a circular plane which is tangentto the sphere at the patch center, Af. (a) Spherical coordinateat Af and polar coordinate (r,F) on the circular plane. (b) P onthe spherical plane is mapped to P0 on the circular plane, andradial component of a vector at P is mapped to z componentat P0.
Figure 8. A tetrakaidekahedral grain model with 14 circularcontact patches. The ‘‘isotropic grain model’’ is given byaf=7–14/af=1–6 = 1.03, where af=1–6 represents the radiusof the 6 patches corresponding to the square faces of atetrakaidekahedron (±x, ±y, and ±z directions), and af=7–14represents that of the other 8 patches.
B06205 TAKEI AND HOLTZMAN: VISCOUS CONTIGUITY MODEL, 1, GENERAL
11 of 19
B06205
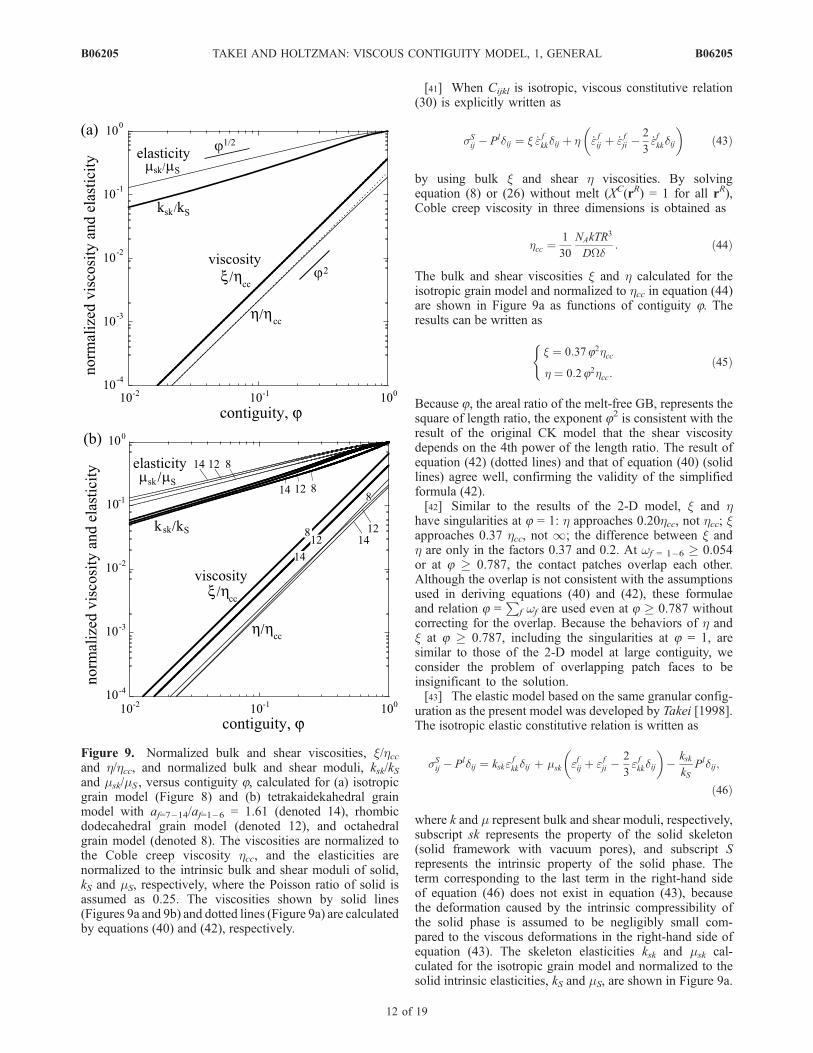
[41] When Cijkl is isotropic, viscous constitutive relation(30) is explicitly written as
sSij � Pldij ¼ x _e fkkdij þ h _e fij þ _e fji �
2
3_efkkdij
� �ð43Þ
by using bulk x and shear h viscosities. By solvingequation (8) or (26) without melt (XC(rR) = 1 for all rR),Coble creep viscosity in three dimensions is obtained as
hcc ¼1
30
NAkTR3
DWd: ð44Þ
The bulk and shear viscosities x and h calculated for theisotropic grain model and normalized to hcc in equation (44)are shown in Figure 9a as functions of contiguity 8. Theresults can be written as
x ¼ 0:3782hcc
h ¼ 0:282hcc:
(ð45Þ
Because 8, the areal ratio of the melt-free GB, represents thesquare of length ratio, the exponent 82 is consistent with theresult of the original CK model that the shear viscositydepends on the 4th power of the length ratio. The result ofequation (42) (dotted lines) and that of equation (40) (solidlines) agree well, confirming the validity of the simplifiedformula (42).[42] Similar to the results of the 2-D model, x and h
have singularities at 8 = 1: h approaches 0.20hcc, not hcc; xapproaches 0.37 hcc, not 1; the difference between x andh are only in the factors 0.37 and 0.2. At wf = 1–6 � 0.054or at 8 � 0.787, the contact patches overlap each other.Although the overlap is not consistent with the assumptionsused in deriving equations (40) and (42), these formulaeand relation 8 =
Pf wf are used even at 8 � 0.787 without
correcting for the overlap. Because the behaviors of h andx at 8 � 0.787, including the singularities at 8 = 1, aresimilar to those of the 2-D model at large contiguity, weconsider the problem of overlapping patch faces to beinsignificant to the solution.[43] The elastic model based on the same granular config-
uration as the present model was developed by Takei [1998].The isotropic elastic constitutive relation is written as
sSij � Pldij ¼ kske
fkkdij þ msk efij þ e fji �
2
3e fkkdij
� �� ksk
kSPldij;
ð46Þ
where k and m represent bulk and shear moduli, respectively,subscript sk represents the property of the solid skeleton(solid framework with vacuum pores), and subscript Srepresents the intrinsic property of the solid phase. Theterm corresponding to the last term in the right-hand sideof equation (46) does not exist in equation (43), becausethe deformation caused by the intrinsic compressibility ofthe solid phase is assumed to be negligibly small com-pared to the viscous deformations in the right-hand side ofequation (43). The skeleton elasticities ksk and msk cal-culated for the isotropic grain model and normalized to thesolid intrinsic elasticities, kS and mS, are shown in Figure 9a.
Figure 9. Normalized bulk and shear viscosities, x/hccand h/hcc, and normalized bulk and shear moduli, ksk/kSand msk/mS , versus contiguity 8, calculated for (a) isotropicgrain model (Figure 8) and (b) tetrakaidekahedral grainmodel with af=7–14/af=1–6 = 1.61 (denoted 14), rhombicdodecahedral grain model (denoted 12), and octahedralgrain model (denoted 8). The viscosities are normalized tothe Coble creep viscosity hcc, and the elasticities arenormalized to the intrinsic bulk and shear moduli of solid,kS and mS, respectively, where the Poisson ratio of solid isassumed as 0.25. The viscosities shown by solid lines(Figures 9a and 9b) and dotted lines (Figure 9a) are calculatedby equations (40) and (42), respectively.
B06205 TAKEI AND HOLTZMAN: VISCOUS CONTIGUITY MODEL, 1, GENERAL
12 of 19
B06205

The elasticities depend on contiguity as 812, whereas the
viscosities depend on contiguity as 82. This demonstratesthat viscosities are much more sensitive to contiguity thanelasticities. Unlike viscosities, elasticities do not have asingularity at 8 = 1. Hence, when melt fraction is smalland contiguity is nearly 1, melt has a small effect on theelastic properties.5.1.2. Sensitivity to the Grain Model[44] To check the sensitivity of the results of x and h
to the assumed grain model, h and x are calculatedfor a tetrakaidekahedral grain model with radius ratioaf=7–14/af=1–6 = 1.61, for a rhombic dodecahedral grainmodel with 12 contact patches of an equal radius, and foran octahedral grain model with 8 contact patches of anequal radius. When af=7–14/af=1–6 = 1.61, the areal ratio(af=7–14/af=1– 6)
2 is equal to that between hexagonal andsquare faces in the tetrakaidekahedron. In the rhombicdodecahedral grain model, the directions of the centers ofpatches (point Af in Figure 7a) are (q, f) = (p/2, p/6), (p/2,p/2), (p/2, 5p/6), (p/2, 7p/6), (p/2, 3p/2), (p/2, 11p/6),(q*, 0), (q*, 2p/3), (q*, 4p/3), (p � q*, p/3), (p � q*, p), and(p � q*, 5p/3), with sinq* =
ffiffiffiffiffiffiffiffi1=3
p. The octahedral grain
model is equal to the tetrakaidekahedral grain model withaf=1 – 6 = 0. The viscosity tensors calculated for thetetrakaidekahedral and octahedral grain models exhibitsubstantial cubic anisotropy, and those calculated for therhombic dodecahedral grain model exhibit substantial trigo-nal anisotropy. The isotropic viscosity of a polycrystallineaggregate, in which grains are randomly oriented, can beestimated by the Voigt-Reuss-Hill (VRH) average of theviscosity tensor calculated for one grain. The elasticitytensors calculated for the three grain models show muchsmaller anisotropy than viscosity tensors, because themechanism causing the anisotropic character of one-grainviscosity discussed in section 4.3 does not exist in theelastic deformation. The elasticity tensors can be approxi-mated to be isotropic without taking the VRH average.[45] As shown in Figure 9b, all the three grain models
give similar results for x and h, which are also consistentwith the results of the isotropic grain model (Figure 9a). Asthe packing coordination number increases from 8 to 14,x and h slightly decrease due to the decrease in diffusion pathlength, but ksk and msk slightly increase due to the increasein the harmonic order of grain deformation [Takei, 1998].The viscosities shown in Figure 9b are calculated byequation (40). For the tetrakaidekahedral and rhombicdodecahedral grain models, equations (40) and (42) givesimilar results. For the octahedral grain model, Reussaverage of h calculated by using equation (42) is zero,because the centers of all 8 contact patches are in thedirection of grain boundary sliding, and hence the VRHaverage of h is substantially smaller than that shown inFigure 9b. However, the average packing coordination ofthe polycrystalline aggregates is expected to be close to 14.Therefore, we can conclude that the results of the isotropicgrain model given by equations (45) are robust againstpossible variations of grain models.
5.2. Effect of Contact Anisotropy on ViscousAnisotropy
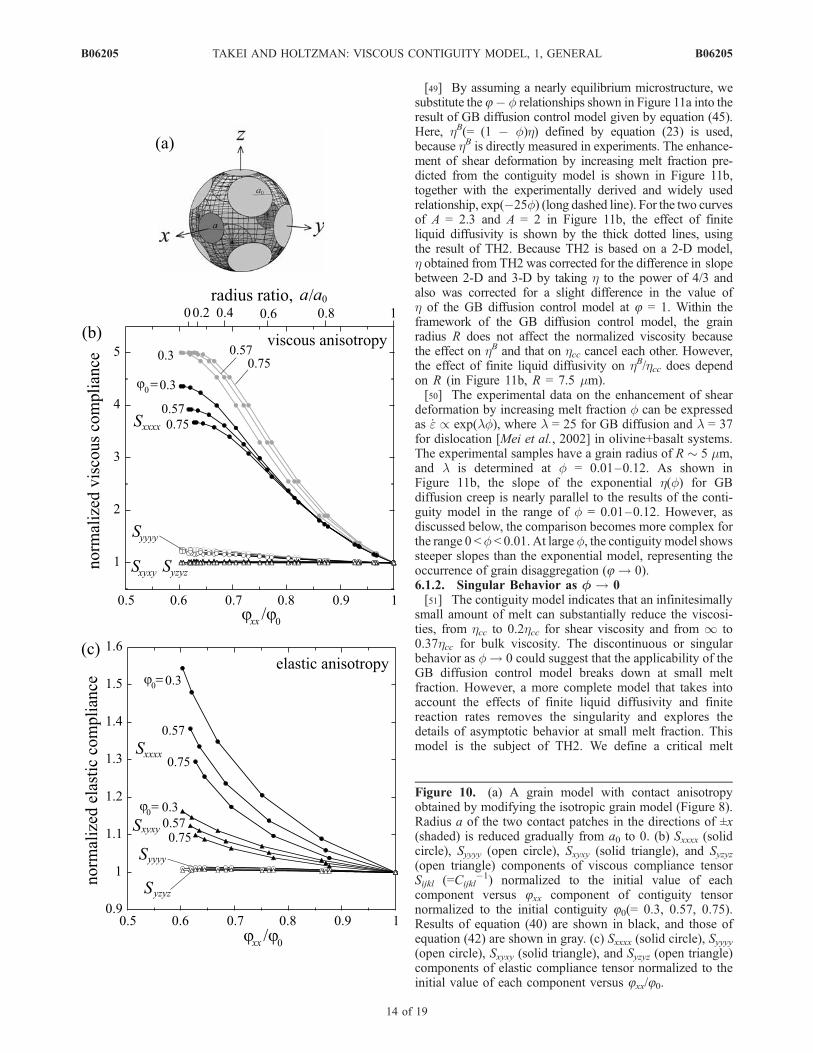
[46] The isotropic grain models with contiguities of 0.3,0.57, and 0.75 are modified to form anisotropic structures
by gradually decreasing the radius of the two contactpatches in the ±x directions, (q, f) = (p/2, 0) and (p/2, p)(Figure 10a). Effects of the contact anisotropy on theviscous anisotropy are investigated by calculating Cijkl forthis geometry. The contiguity tensor component 8xxdecreases while changes in the other components of 8ijare negligible. Figure 10b shows several components ofviscous compliance tensor Sijkl (= Cijkl
�1) normalized to theinitial value of each component versus 8xx normalized toinitial contiguity 80. The radius a of the two contact patchesrelative to the initial radius a0 is also shown in the upperhorizontal axis (for the case of 80 = 0.57). The significanteffect of contact anisotropy on viscous anisotropy is dem-onstrated by the difference between Sxxxx and Syyyy, whereSxxxx and Syyyy represent the strain rates produced byuniaxial loading under drained conditions. The results fromequation (40) (black) and those from equation (42) (gray)agree fairly well, confirming the validity of the simplifiedformula. Also shown in Figure 10c are the components ofthe elastic compliance tensor Sijkl calculated for the samecontact geometry, demonstrating that the elastic anisotropy ismuch smaller than the viscous anisotropy. When 80 = 0.57and 8xx/80 = 0.75, for example, the difference between Sxyxyand Syzyz components of the elastic compliance tensorpredicts a shear wave polarization anisotropy of about 3%(Figure 10c), whereas the viscous deformability in the xdirection is about 3 times larger than that in the y direction(Figure 10b).
6. Discussion
[47] In the following sections, we first compare viscositiespredicted from the contiguity model to experimental data toassess the validity of the model (section 6.1), which permitsgreater confidence in extrapolating results to conditions inthe Earth.We then discuss the geophysical and geodynamicalapplications of the model (sections 6.2 and 6.3). We showthat the viscous and elastic constitutive relations are essentialfor investigating melt migration dynamics in a forwardsense on the basis the basic equations of two-phase dynamics(section 6.2) and in an inverse sense on the basis ofseismological observations (section 6.3).
6.1. Comparison to Experimental Data
6.1.1. Viscosity Versus Melt Fraction[48] The bulk and shear viscosities have been derived as
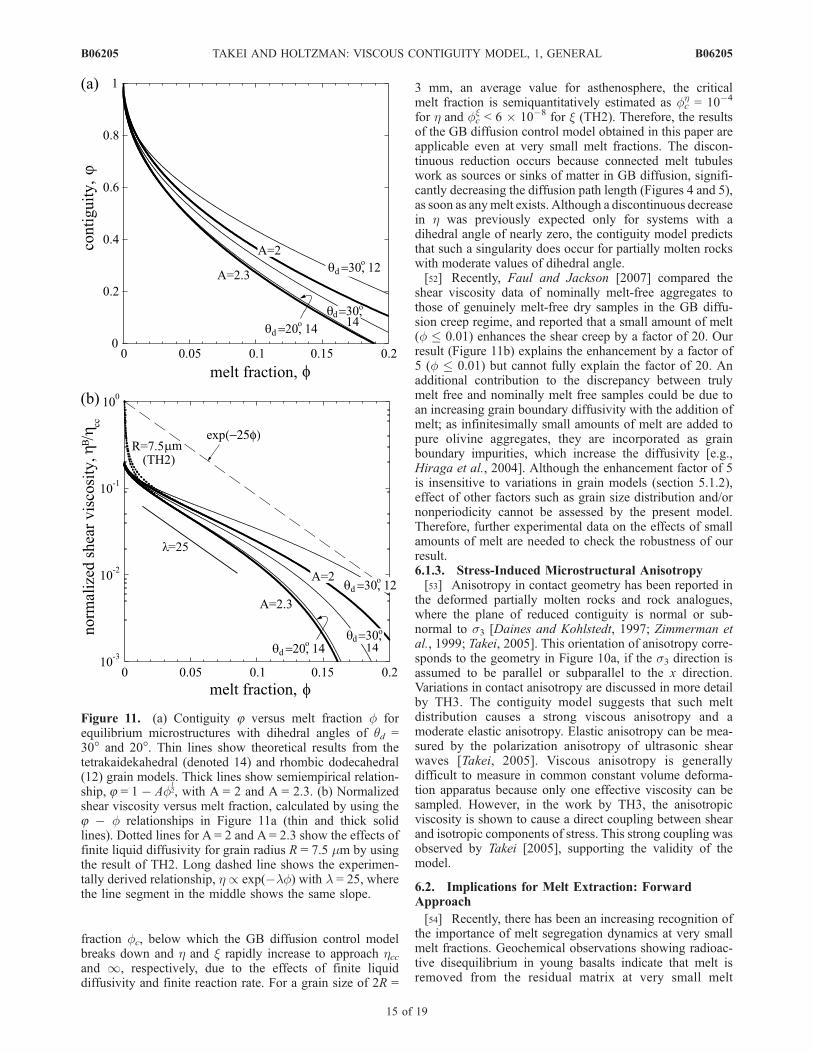
functions of contiguity, which is not as commonly measuredas melt fraction. In order to obtain the relationship betweenviscosity and melt fraction, we need to know the relation-ship between contiguity 8 and melt fraction f. When themicrostructure is in textural equilibrium, the relationshipbetween f and 8 can be determined theoretically as afunction of dihedral angle. Figure 11a shows 8 versus ffor the dihedral angles of 30� and 20� calculated for thetetrakaidekahedral (denoted 14) and rhombic dodecahedral(denoted 12) grain models [von Bargen and Waff, 1986;Takei, 2002]. Also shown in Figure 11a is the semiempiricalrelationship, 8 = 1 � Af
12, obtained by fitting the data of f
and 8 measured for texturally equilibrated partially moltenrocks [Yoshino et al., 2005]. The semiempirical curves areplotted for A = 2.3 (olivine + basalt) and A = 2.
B06205 TAKEI AND HOLTZMAN: VISCOUS CONTIGUITY MODEL, 1, GENERAL
13 of 19
B06205
[49] By assuming a nearly equilibrium microstructure, wesubstitute the 8� f relationships shown in Figure 11a into theresult of GB diffusion control model given by equation (45).Here, hB(= (1 � f)h) defined by equation (23) is used,because hB is directly measured in experiments. The enhance-ment of shear deformation by increasing melt fraction pre-dicted from the contiguity model is shown in Figure 11b,together with the experimentally derived and widely usedrelationship, exp(�25f) (long dashed line). For the two curvesof A = 2.3 and A = 2 in Figure 11b, the effect of finiteliquid diffusivity is shown by the thick dotted lines, usingthe result of TH2. Because TH2 is based on a 2-D model,h obtained from TH2 was corrected for the difference in slopebetween 2-D and 3-D by taking h to the power of 4/3 andalso was corrected for a slight difference in the value ofh of the GB diffusion control model at 8 = 1. Within theframework of the GB diffusion control model, the grainradius R does not affect the normalized viscosity becausethe effect on hB and that on hcc cancel each other. However,the effect of finite liquid diffusivity on hB/hcc does dependon R (in Figure 11b, R = 7.5 mm).[50] The experimental data on the enhancement of shear
deformation by increasing melt fraction f can be expressedas _e / exp(lf), where l = 25 for GB diffusion and l = 37for dislocation [Mei et al., 2002] in olivine+basalt systems.The experimental samples have a grain radius of R � 5 mm,and l is determined at f = 0.01–0.12. As shown inFigure 11b, the slope of the exponential h(f) for GBdiffusion creep is nearly parallel to the results of the conti-guity model in the range of f = 0.01–0.12. However, asdiscussed below, the comparison becomes more complex forthe range 0 <f < 0.01. At largef, the contiguity model showssteeper slopes than the exponential model, representing theoccurrence of grain disaggregation (8 ! 0).6.1.2. Singular Behavior as f ! 0[51] The contiguity model indicates that an infinitesimally
small amount of melt can substantially reduce the viscosi-ties, from hcc to 0.2hcc for shear viscosity and from 1 to0.37hcc for bulk viscosity. The discontinuous or singularbehavior as f! 0 could suggest that the applicability of theGB diffusion control model breaks down at small meltfraction. However, a more complete model that takes intoaccount the effects of finite liquid diffusivity and finitereaction rates removes the singularity and explores thedetails of asymptotic behavior at small melt fraction. Thismodel is the subject of TH2. We define a critical melt
Figure 10. (a) A grain model with contact anisotropyobtained by modifying the isotropic grain model (Figure 8).Radius a of the two contact patches in the directions of ±x(shaded) is reduced gradually from a0 to 0. (b) Sxxxx (solidcircle), Syyyy (open circle), Sxyxy (solid triangle), and Syzyz(open triangle) components of viscous compliance tensorSijkl (=Cijkl
�1) normalized to the initial value of eachcomponent versus 8xx component of contiguity tensornormalized to the initial contiguity 80(= 0.3, 0.57, 0.75).Results of equation (40) are shown in black, and those ofequation (42) are shown in gray. (c) Sxxxx (solid circle), Syyyy(open circle), Sxyxy (solid triangle), and Syzyz (open triangle)components of elastic compliance tensor normalized to theinitial value of each component versus 8xx/80.
B06205 TAKEI AND HOLTZMAN: VISCOUS CONTIGUITY MODEL, 1, GENERAL
14 of 19
B06205
fraction fc, below which the GB diffusion control modelbreaks down and h and x rapidly increase to approach hccand 1, respectively, due to the effects of finite liquiddiffusivity and finite reaction rate. For a grain size of 2R =
3 mm, an average value for asthenosphere, the criticalmelt fraction is semiquantitatively estimated as fc
h = 10�4
for h and fcx < 6 10�8 for x (TH2). Therefore, the results
of the GB diffusion control model obtained in this paper areapplicable even at very small melt fractions. The discon-tinuous reduction occurs because connected melt tubuleswork as sources or sinks of matter in GB diffusion, signifi-cantly decreasing the diffusion path length (Figures 4 and 5),as soon as anymelt exists. Although a discontinuous decreasein h was previously expected only for systems with adihedral angle of nearly zero, the contiguity model predictsthat such a singularity does occur for partially molten rockswith moderate values of dihedral angle.[52] Recently, Faul and Jackson [2007] compared the
shear viscosity data of nominally melt-free aggregates tothose of genuinely melt-free dry samples in the GB diffu-sion creep regime, and reported that a small amount of melt(f � 0.01) enhances the shear creep by a factor of 20. Ourresult (Figure 11b) explains the enhancement by a factor of5 (f � 0.01) but cannot fully explain the factor of 20. Anadditional contribution to the discrepancy between trulymelt free and nominally melt free samples could be due toan increasing grain boundary diffusivity with the addition ofmelt; as infinitesimally small amounts of melt are added topure olivine aggregates, they are incorporated as grainboundary impurities, which increase the diffusivity [e.g.,Hiraga et al., 2004]. Although the enhancement factor of 5is insensitive to variations in grain models (section 5.1.2),effect of other factors such as grain size distribution and/ornonperiodicity cannot be assessed by the present model.Therefore, further experimental data on the effects of smallamounts of melt are needed to check the robustness of ourresult.6.1.3. Stress-Induced Microstructural Anisotropy[53] Anisotropy in contact geometry has been reported in
the deformed partially molten rocks and rock analogues,where the plane of reduced contiguity is normal or sub-normal to s3 [Daines and Kohlstedt, 1997; Zimmerman etal., 1999; Takei, 2005]. This orientation of anisotropy corre-sponds to the geometry in Figure 10a, if the s3 direction isassumed to be parallel or subparallel to the x direction.Variations in contact anisotropy are discussed in more detailby TH3. The contiguity model suggests that such meltdistribution causes a strong viscous anisotropy and amoderate elastic anisotropy. Elastic anisotropy can be mea-sured by the polarization anisotropy of ultrasonic shearwaves [Takei, 2005]. Viscous anisotropy is generallydifficult to measure in common constant volume deforma-tion apparatus because only one effective viscosity can besampled. However, in the work by TH3, the anisotropicviscosity is shown to cause a direct coupling between shearand isotropic components of stress. This strong coupling wasobserved by Takei [2005], supporting the validity of themodel.
6.2. Implications for Melt Extraction: ForwardApproach
[54] Recently, there has been an increasing recognition ofthe importance of melt segregation dynamics at very smallmelt fractions. Geochemical observations showing radioac-tive disequilibrium in young basalts indicate that melt isremoved from the residual matrix at very small melt
Figure 11. (a) Contiguity 8 versus melt fraction f forequilibrium microstructures with dihedral angles of qd =30� and 20�. Thin lines show theoretical results from thetetrakaidekahedral (denoted 14) and rhombic dodecahedral(12) grain models. Thick lines show semiempirical relation-ship, 8 = 1 � Af
12, with A = 2 and A = 2.3. (b) Normalized
shear viscosity versus melt fraction, calculated by using the8 � f relationships in Figure 11a (thin and thick solidlines). Dotted lines for A = 2 and A = 2.3 show the effects offinite liquid diffusivity for grain radius R = 7.5 mm by usingthe result of TH2. Long dashed line shows the experimen-tally derived relationship, h / exp(�lf) with l = 25, wherethe line segment in the middle shows the same slope.
15 of 19
B06205 TAKEI AND HOLTZMAN: VISCOUS CONTIGUITY MODEL, 1, GENERAL B06205
fractions (f < 0.01) [e.g., McKenzie, 2000, Iwamori, 1994].Therefore, it must be relatively easy to extract small meltfractions f < 0.01. Mechanical and/or dynamical studies areneeded to explain these chemical constraints.[55] The behavior of bulk and shear viscosities in the
contiguity model has significant implications for under-standing melt extraction processes at small melt fractions.Melt extraction, whether driven by buoyancy force or stress,is controlled by bulk viscosity x and permeability, whereeffect of x dominates effects of permeability at length scalesshorter than the compaction length. In many theoreticalstudies, bulk viscosity x is estimated with the simplerelationship x = h/f (or x = hcc/f) [e.g., Richardson,1998; Connolly and Podladchikov, 1998]. The critical meltfractions are semiquantitatively estimated for 2R = 3 mm asfch = 10�4 and fc
x < 6 10�8 (TH2). For f = 0.001 (�fcx),
x estimated from the contiguity model is more than 3 ordersof magnitude smaller than that estimated from the simplerelationship mentioned above, meaning that compactionlength is more than 30 times larger and extracting small fover distances smaller than the compaction length is mucheasier than previously considered. However, the rapidincrease of x below the critical melt fraction also predictsthe difficulty of extracting very small melt fractions. Rheo-logical models in which the solid phase is treated as an idealNewtonian liquid give results close to the simple relationshipx = hcc/f [Sumita et al., 1996; Takei, 1998]. The presentresult demonstrates that taking into account the detailedgrain-scale processes is important for developing a quantita-tive rheological model.[56] In order to maintain radioactive disequilibrium pro-
duced at the grain scale, melt must be transported rapidly
through high-porosity, chemically isolated channels devel-oped at scales much longer than the grain scale (macroscaleor mesoscales). Several mechanisms for channel formationhave been proposed including the reaction infiltration insta-bility [e.g., Spiegelman et al., 2001] and shear-induced meltsegregation [e.g., Stevenson, 1989; Spiegelman, 2003; Katzet al., 2006]. In previous studies, formation of meltchannels has been studied for isotropic viscosity. However,stress-induced alignment of melt at the grain scale has beenshown to produce large viscous anisotropy (Figure 10). Theimplication that this viscous anisotropy can cause the forma-tion of macroscale or mesoscale channels is demonstratedusing a ‘‘forward’’ or ab initio approach of TH3, combiningthe viscous constitutive relations obtained in this paper withmass and momentum conservation equations of solid-liquidtwo-phase dynamics.
6.3. Implications for Upper Mantle RheologyStructure: Inverse Approach
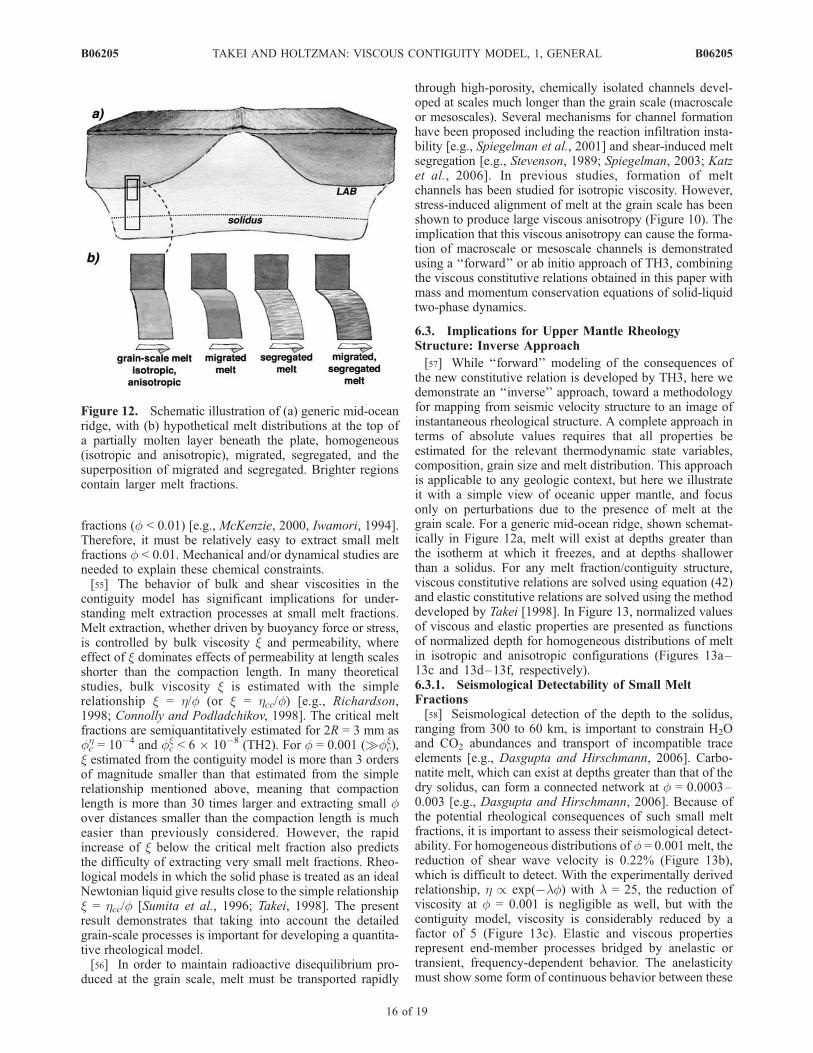
[57] While ‘‘forward’’ modeling of the consequences ofthe new constitutive relation is developed by TH3, here wedemonstrate an ‘‘inverse’’ approach, toward a methodologyfor mapping from seismic velocity structure to an image ofinstantaneous rheological structure. A complete approach interms of absolute values requires that all properties beestimated for the relevant thermodynamic state variables,composition, grain size and melt distribution. This approachis applicable to any geologic context, but here we illustrateit with a simple view of oceanic upper mantle, and focusonly on perturbations due to the presence of melt at thegrain scale. For a generic mid-ocean ridge, shown schemat-ically in Figure 12a, melt will exist at depths greater thanthe isotherm at which it freezes, and at depths shallowerthan a solidus. For any melt fraction/contiguity structure,viscous constitutive relations are solved using equation (42)and elastic constitutive relations are solved using the methoddeveloped by Takei [1998]. In Figure 13, normalized valuesof viscous and elastic properties are presented as functionsof normalized depth for homogeneous distributions of meltin isotropic and anisotropic configurations (Figures 13a–13c and 13d–13f, respectively).6.3.1. Seismological Detectability of Small MeltFractions[58] Seismological detection of the depth to the solidus,
ranging from 300 to 60 km, is important to constrain H2Oand CO2 abundances and transport of incompatible traceelements [e.g., Dasgupta and Hirschmann, 2006]. Carbo-natite melt, which can exist at depths greater than that of thedry solidus, can form a connected network at f = 0.0003–0.003 [e.g., Dasgupta and Hirschmann, 2006]. Because ofthe potential rheological consequences of such small meltfractions, it is important to assess their seismological detect-ability. For homogeneous distributions of f = 0.001 melt, thereduction of shear wave velocity is 0.22% (Figure 13b),which is difficult to detect. With the experimentally derivedrelationship, h / exp(�lf) with l = 25, the reduction ofviscosity at f = 0.001 is negligible as well, but with thecontiguity model, viscosity is considerably reduced by afactor of 5 (Figure 13c). Elastic and viscous propertiesrepresent end-member processes bridged by anelastic ortransient, frequency-dependent behavior. The anelasticitymust show some form of continuous behavior between these
Figure 12. Schematic illustration of (a) generic mid-oceanridge, with (b) hypothetical melt distributions at the top ofa partially molten layer beneath the plate, homogeneous(isotropic and anisotropic), migrated, segregated, and thesuperposition of migrated and segregated. Brighter regionscontain larger melt fractions.
B06205 TAKEI AND HOLTZMAN: VISCOUS CONTIGUITY MODEL, 1, GENERAL
16 of 19
B06205

end-members, but the wide range of processes that contributeto anelasticity are poorly understood. Although f = 0.001cannot be detected through the seismic measurement ofpurely elastic properties, if its effect on anelasticity is non-negligible, it may be detectable as a zone of high attenuationand/or low velocity. To assess the seismological detectabilityof a small amount of melt below the dry solidus, under-standing and incorporation of the effect of melt on anelas-ticity is essential.6.3.2. Quantitative Comparison Between Seismicand Rheological Anisotropies[59] To the curve for a homogeneous melt distribution
with f = 0.01, we add anisotropy by reducing the radius ofcontact patches whose normals are subparallel to the maxi-mum tension direction, as shown in the inset of Figure 13d,with the shear plane parallel to the base of the plate. With apatch reduction of a/a0 = 0.4, the shear waves propagatingridge-parallel show the polarization anisotropy of about 4%(Figure 13e). To show the effect of this anisotropy on
viscosity, we plot g, the degree of coupling between shearand isotropic components of the stress tensor resulting fromthe anisotropic constitutive relation (TH3). For a/a0 = 0.4,g almost saturates at 1 (TH3, Figure 4, for the 2-D solution).Therefore, even when the seismologically observed anisot-ropy is only 4%, viscous anisotropy is much larger inamplitude (Figure 13f).6.3.3. Importance of Multiscale Structure[60] In TH3, viscous anisotropy, or resultant coupling
between shear and isotropic components of the stress tensor,produced by grain scale contact anisotropy (Figure 13f) isshown to drive melt redistribution over distances greaterthan the grain scale, resulting in both segregation into melt-rich shear zones and melt migration up stress gradients inthe solid. The former heterogeneity develops at smallerscales than the compaction length, and the latter hetero-geneity can develop at larger scales than the compactionlength. Complex ‘‘multiscale’’ or ‘‘mesoscale’’ structuresexpected as a result of such stress-driven melt segregation
Figure 13. (top) Homogeneous isotropic melt distributions (with one profile of migrated melt, withf = 0.01), with plots of (a) melt fraction, (b) shear wave velocity, and (c) shear viscosity normalized to thosewithout melt. (bottom) Anisotropic perturbations to the homogeneous melt distribution of f = 0.01 in toprow, with plots of (d) grain-scale contact anisotropy, (e) shear wave anisotropy, and (f) viscous anisotropy interms of coupling factor g (TH3). Inset of Figure 13d shows four contact patches with reduced radii (darkestshading), and inset of Figure 13e shows the propagation and polarization directions of shear waves,relative to the direction of matrix deformation, with shear plane and sense of shear indicated by widearrows.
B06205 TAKEI AND HOLTZMAN: VISCOUS CONTIGUITY MODEL, 1, GENERAL
17 of 19
B06205

and/or melt migration up stress gradients, in addition to thebuoyancy-driven flow, are illustrated in Figure 12b. Themigration to the base of the plate could be driven by a shearstress gradient (if a vertical stress gradient exists because offorced horizontal flow) and/or buoyancy force.[61] The rheological structure of the upper mantle, espe-
cially the distribution of melt, controls the mechanicalcoupling between lithosphere and asthenosphere. InFigures 13a–13c, we show a single profile representingvertically migrating melt, with the same average melt fractionas the homogeneous profile with f = 0.01. Its peak reductionin viscosity is a factor of 13, which would lead to an effectivelubrication. Also, such a melt distribution would produce asharp gradient or contrast in elastic properties at the top ofthe partially molten region. It may have identifiable seismicsignatures, such as the efficient production of receiverfunctions [e.g., Rychert et al., 2007]. With combinationsof anisotropy, migration and segregation, it is reasonable toestimate a viscosity contrast of more than 2 orders of mag-nitude at the top of the partially molten layer (TH3). Such aviscosity reduction would have significant implications forthe dynamics of lithosphere/asthenosphere interactions,influencing the convective style and scale of the subplateasthenosphere and the degree of coupling of the plate to thelargest scale of mantle convection. Therefore, detection ofthese rheological structures from seismological observa-tions are important.[62] In this paper, as illustrated schematically in Figure 1,
the grain-scale or microscale properties are homogenizedupward to a representative elementary volume (REV), atwhich the two-phase medium can be described as a ‘‘macro-scopic’’ continuum (terminology clarified in Figure 14). The‘‘mesoscale’’ or ‘‘multiscale’’ processes and structures canbe described by a second level of homogenization to estimateeffective viscous (TH3) and elastic properties, which will bestudied in forthcoming works.
7. Conclusions
[63] A theoretical framework developed for the elasticconstitutive relations of solid-liquid composites was extendedto calculate the viscous constitutive relations of partiallymolten rocks deforming in the regime of GB diffusioncreep. A general formulation was developed and then sim-plified to the GB diffusion control model, in which liquid
diffusivity and reaction rates are assumed to be infinitelyhigh. TheGB diffusion control model was solved analyticallyin 2-D and 3-D versions.[64] The viscous and elastic constitutive relations devel-
oped in this study and by Takei [1998] are based oncontiguity as an internal state variable, which enables us totake into account the detailed effects of grain-scale meltdistribution observed in the experiments. Compared to elas-ticity, viscosity is much more sensitive to contiguity. Thedependence of the bulk and shear viscosities on contiguity 8is given by 82, whereas that of the bulk and shear moduli is81/2. A very small amount of melt significantly reduces thebulk and shear viscosities, whereas such singularity at f = 0does not exist in elasticity. In deforming partially moltenrocks, anisotropy in contiguity can produce large viscousanisotropy, whereas it produces much less elastic anisotropy.[65] The detailed behavior of viscosity at very small melt
fractions is investigated in the second companion paper(TH2). Significant consequences of microstructural anisot-ropy on macroscale or mesoscale melt migration dynamicsare investigated in the third companion paper (TH3), using‘‘forward’’ or ab initio approaches combining the aniso-tropic constitutive relation with the equations of two-phasedynamics. The beginnings of an ‘‘inverse’’ approach formapping from seismic velocity structure to rheologicalstructure are developed in this paper, on the basis thequantitative comparison between elastic and viscous proper-ties for a given melt distribution.
Appendix A: Importance of Clockwise Approach
[66] Procedures A–C in Figure 1 were followed inclockwise order in this study. The clockwise approach isimportant for deriving the viscous constitutive relation. Raj[1975] introduced the concept of steady state traction, underwhich local deformation is compatible with the macroscopicdeformation. Equation (21) gives the grain deformation com-patible with the macroscopic strain rate. Hence, the tractionat the contact face obtained at procedure B in the presentclockwise approach is equal to the steady state traction. Ifprocedures A–C in Figure 1 are followed in counterclock-wise order along the dashed arrows, traction distribution onthe grain boundary has to be assumed a priori and hencedoes not satisfy the steady state condition. Because thetraction distribution which does not satisfy the steady statecondition can exist only transiently, the clockwise approachbased on steady state traction is more preferable than thecounterclockwise approach. In the elastic problem, a coun-terclockwise approach was used for deriving the elasticconstitutive relation [Takei, 1998]. In elasticity, the effect oftraction distribution on the grain boundary is considered tobe small and the counterclockwise approach was adoptedfor mathematical simplicity. In the viscous problem, theclockwise approach is preferable both for physical andmathematical reasons.
Appendix B: Unit Vectors in SphericalCoordinates
[67] Vectors eqf, ef
f and erf represent the unit vectors for
the spherical coordinate system at point Af = (q, f, R). In the
Figure 14. Terminology for different length scales used inthis paper: (a) mathematical and (b) physical. Generalranges of seismic wavelengths studied in the Earth and ofcompaction lengths in the asthenosphere.
B06205 TAKEI AND HOLTZMAN: VISCOUS CONTIGUITY MODEL, 1, GENERAL
18 of 19
B06205
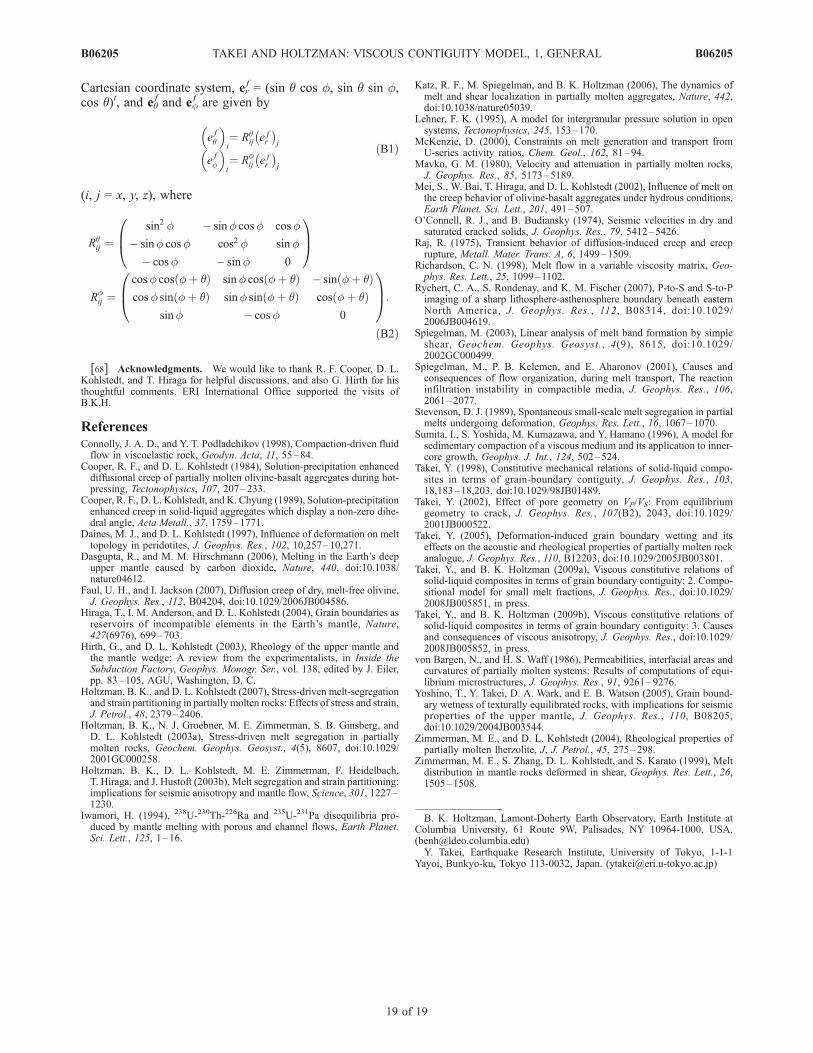
Cartesian coordinate system, erf = (sin q cos f, sin q sin f,
cos q)t, and eqf and ef
f are given by
efq
�i¼ Rq
ij efr
� �j
eff
�i¼ R
fij e f
r
� �j
ðB1Þ
(i, j = x, y, z), where
Rqij ¼
sin2 f � sinf cosf cosf
� sinf cosf cos2 f sinf
� cosf � sinf 0
0B@
1CA
Rfij ¼
cosf cos fþ qð Þ sinf cos fþ qð Þ � sin fþ qð Þcosf sin fþ qð Þ sinf sin fþ qð Þ cos fþ qð Þ
sinf � cosf 0
0B@
1CA:
ðB2Þ
[68] Acknowledgments. We would like to thank R. F. Cooper, D. L.Kohlstedt, and T. Hiraga for helpful discussions, and also G. Hirth for histhoughtful comments. ERI International Office supported the visits ofB.K.H.
ReferencesConnolly, J. A. D., and Y. T. Podladchikov (1998), Compaction-driven fluidflow in viscoelastic rock, Geodyn. Acta, 11, 55–84.
Cooper, R. F., and D. L. Kohlstedt (1984), Solution-precipitation enhanceddiffusional creep of partially molten olivine-basalt aggregates during hot-pressing, Tectonophysics, 107, 207–233.
Cooper, R. F., D. L. Kohlstedt, and K. Chyung (1989), Solution-precipitationenhanced creep in solid-liquid aggregates which display a non-zero dihe-dral angle, Acta Metall., 37, 1759–1771.
Daines, M. J., and D. L. Kohlstedt (1997), Influence of deformation on melttopology in peridotites, J. Geophys. Res., 102, 10,257–10,271.
Dasgupta, R., and M. M. Hirschmann (2006), Melting in the Earth’s deepupper mantle caused by carbon dioxide, Nature, 440, doi:10.1038/nature04612.
Faul, U. H., and I. Jackson (2007), Diffusion creep of dry, melt-free olivine,J. Geophys. Res., 112, B04204, doi:10.1029/2006JB004586.
Hiraga, T., I. M. Anderson, and D. L. Kohlstedt (2004), Grain boundaries asreservoirs of incompatible elements in the Earth’s mantle, Nature,427(6976), 699–703.
Hirth, G., and D. L. Kohlstedt (2003), Rheology of the upper mantle andthe mantle wedge: A review from the experimentalists, in Inside theSubduction Factory, Geophys. Monogr. Ser., vol. 138, edited by J. Eiler,pp. 83–105, AGU, Washington, D. C.
Holtzman, B. K., and D. L. Kohlstedt (2007), Stress-driven melt-segregationand strain partitioning in partially molten rocks: Effects of stress and strain,J. Petrol., 48, 2379–2406.
Holtzman, B. K., N. J. Groebner, M. E. Zimmerman, S. B. Ginsberg, andD. L. Kohlstedt (2003a), Stress-driven melt segregation in partiallymolten rocks, Geochem. Geophys. Geosyst., 4(5), 8607, doi:10.1029/2001GC000258.
Holtzman, B. K., D. L. Kohlstedt, M. E. Zimmerman, F. Heidelbach,T. Hiraga, and J. Hustoft (2003b), Melt segregation and strain partitioning:implications for seismic anisotropy and mantle flow, Science, 301, 1227–1230.
Iwamori, H. (1994), 238U-230Th-226Ra and 235U-231Pa disequilibria pro-duced by mantle melting with porous and channel flows, Earth Planet.Sci. Lett., 125, 1–16.
Katz, R. F., M. Spiegelman, and B. K. Holtzman (2006), The dynamics ofmelt and shear localization in partially molten aggregates, Nature, 442,doi:10.1038/nature05039.
Lehner, F. K. (1995), A model for intergranular pressure solution in opensystems, Tectonophysics, 245, 153–170.
McKenzie, D. (2000), Constraints on melt generation and transport fromU-series activity ratios, Chem. Geol., 162, 81–94.
Mavko, G. M. (1980), Velocity and attenuation in partially molten rocks,J. Geophys. Res., 85, 5173–5189.
Mei, S., W. Bai, T. Hiraga, and D. L. Kohlstedt (2002), Influence of melt onthe creep behavior of olivine-basalt aggregates under hydrous conditions,Earth Planet. Sci. Lett., 201, 491–507.
O’Connell, R. J., and B. Budiansky (1974), Seismic velocities in dry andsaturated cracked solids, J. Geophys. Res., 79, 5412–5426.
Raj, R. (1975), Transient behavior of diffusion-induced creep and creeprupture, Metall. Mater. Trans. A, 6, 1499–1509.
Richardson, C. N. (1998), Melt flow in a variable viscosity matrix, Geo-phys. Res. Lett., 25, 1099–1102.
Rychert, C. A., S. Rondenay, and K. M. Fischer (2007), P-to-S and S-to-Pimaging of a sharp lithosphere-asthenosphere boundary beneath easternNorth America, J. Geophys. Res., 112, B08314, doi:10.1029/2006JB004619.
Spiegelman, M. (2003), Linear analysis of melt band formation by simpleshear, Geochem. Geophys. Geosyst., 4(9), 8615, doi:10.1029/2002GC000499.
Spiegelman, M., P. B. Kelemen, and E. Aharonov (2001), Causes andconsequences of flow organization, during melt transport, The reactioninfiltration instability in compactible media, J. Geophys. Res., 106,2061–2077.
Stevenson, D. J. (1989), Spontaneous small-scale melt segregation in partialmelts undergoing deformation, Geophys. Res. Lett., 16, 1067–1070.
Sumita, I., S. Yoshida, M. Kumazawa, and Y. Hamano (1996), A model forsedimentary compaction of a viscous medium and its application to inner-core growth, Geophys. J. Int., 124, 502–524.
Takei, Y. (1998), Constitutive mechanical relations of solid-liquid compo-sites in terms of grain-boundary contiguity, J. Geophys. Res., 103,18,183–18,203, doi:10.1029/98JB01489.
Takei, Y. (2002), Effect of pore geometry on VP/VS: From equilibriumgeometry to crack, J. Geophys. Res., 107(B2), 2043, doi:10.1029/2001JB000522.
Takei, Y. (2005), Deformation-induced grain boundary wetting and itseffects on the acoustic and rheological properties of partially molten rockanalogue, J. Geophys. Res., 110, B12203, doi:10.1029/2005JB003801.
Takei, Y., and B. K. Holtzman (2009a), Viscous constitutive relations ofsolid-liquid composites in terms of grain boundary contiguity: 2. Compo-sitional model for small melt fractions, J. Geophys. Res., doi:10.1029/2008JB005851, in press.
Takei, Y., and B. K. Holtzman (2009b), Viscous constitutive relations ofsolid-liquid composites in terms of grain boundary contiguity: 3. Causesand consequences of viscous anisotropy, J. Geophys. Res., doi:10.1029/2008JB005852, in press.
von Bargen, N., and H. S. Waff (1986), Permeabilities, interfacial areas andcurvatures of partially molten systems: Results of computations of equi-librium microstructures, J. Geophys. Res., 91, 9261–9276.
Yoshino, T., Y. Takei, D. A. Wark, and E. B. Watson (2005), Grain bound-ary wetness of texturally equilibrated rocks, with implications for seismicproperties of the upper mantle, J. Geophys. Res., 110, B08205,doi:10.1029/2004JB003544.
Zimmerman, M. E., and D. L. Kohlstedt (2004), Rheological properties ofpartially molten lherzolite, J, J. Petrol., 45, 275–298.
Zimmerman, M. E., S. Zhang, D. L. Kohlstedt, and S. Karato (1999), Meltdistribution in mantle rocks deformed in shear, Geophys. Res. Lett., 26,1505–1508.
�����������������������B. K. Holtzman, Lamont-Doherty Earth Observatory, Earth Institute at
Columbia University, 61 Route 9W, Palisades, NY 10964-1000, USA.([email protected])Y. Takei, Earthquake Research Institute, University of Tokyo, 1-1-1
Yayoi, Bunkyo-ku, Tokyo 113-0032, Japan. ([email protected])
B06205 TAKEI AND HOLTZMAN: VISCOUS CONTIGUITY MODEL, 1, GENERAL
19 of 19
B06205