vishay intertechnology, inc.ir.vishay.com/sites/vishay.investorhq.businesswire.com/files/doc... ·...
TRANSCRIPT
UNITED STATES SECURITIES AND EXCHANGE COMMISSION
WASHINGTON, D.C. 20549
FORM 10-K
ý ANNUAL REPORT PURSUANT TO SECTION 13 OR 15(d) OF THE SECURITIES EXCHANGE ACT OF 1934 For the fiscal year ended December 31, 2014
or ☐ TRANSITION REPORT PURSUANT TO SECTION 13 OR 15(d) OF THE SECURITIES EXCHANGE ACT OF 1934
For the transition period from _______ to _______
Commission file number 1-7416
Vishay Intertechnology, Inc. (Exact name of registrant as specified in its charter)
63 Lancaster Avenue
Malvern, Pennsylvania 19355-2143 (Address of principal executive offices)
(610) 644-1300
(Registrant's telephone number, including area code)
Securities registered pursuant to Section 12(b) of the Act:
Securities registered pursuant to Section 12(g) of the Act: None
Indicate by check mark if the registrant is a well-known seasoned issuer, as defined in Rule 405 of the Securities Act. Yes ý No ☐ Indicate by check mark if the registrant is not required to file reports pursuant to Section 13 or Section 15(d) of the Act. Yes ☐ No ý Note – Checking the box above will not relieve any registrant required to file reports under Section 13 or 15(d) of the Exchange Act from their obligations under those Sections. Indicate by check mark whether the registrant (1) has filed all reports required to be filed by Section 13 or 15(d) of the Securities Exchange Act of 1934 during the preceding 12 months (or for such shorter period that the registrant was required to file such reports), and (2) has been subject to such filing requirements for the past 90 days. Yes ý No ☐ Indicate by check mark whether the registrant has submitted electronically and posted on its corporate Web site, if any, every Interactive Data File required to be submitted and posted pursuant to Rule 405 of Regulation S-T (§ 232.405 of this chapter) during the preceding 12 months (or for such shorter period that the registrant was required to submit and post such files). Yes ý No ☐ Indicate by check mark if disclosure of delinquent filers pursuant to Item 405 of Regulation S-K (§ 229.405 of this chapter) is not contained herein, and will not be contained, to the best of registrant's knowledge, in definitive proxy or information statements incorporated by reference in Part III of this Form 10-K or any amendment to this Form 10-K. ý Indicate by check mark whether the registrant is a large accelerated filer, an accelerated filer, a non-accelerated filer, or a smaller reporting company. See definitions of "large accelerated filer," "accelerated filer" and "smaller reporting company" in Rule 12b-2 of the Exchange Act. (Check one):
Indicate by checkmark whether the registrant is a shell company (as defined in Rule 12b-2 of the Act). Yes ☐ No ý The aggregate market value of the voting stock held by non-affiliates computed by reference to the price at which the common equity was last sold as of the last business day of the registrant's most recently completed second fiscal quarter ($15.22 on June 28, 2014), assuming conversion of all of its Class B common stock held by non-affiliates into common stock of the registrant, was $2,068,000,000. There is no non-voting stock outstanding. As of February 16, 2015, registrant had 135,440,811 shares of its common stock and 12,129,227 shares of its Class B common stock outstanding.
DOCUMENTS INCORPORATED BY REFERENCE
Portions of the registrant's definitive proxy statement, which will be filed within 120 days of December 31, 2014, are incorporated by reference into Part III.
Delaware 38-1686453 (State or other jurisdiction of incorporation or organization)
(IRS employer identification no.)
Common Stock, $0.10 par value New York Stock Exchange (Title of class) (Exchange on which registered)
Large accelerated filer ý= Accelerated filer ☐
Non-accelerated filer ☐ Smaller reporting company ☐

This page intentionally left blank.
2
Vishay Intertechnology, Inc. Form 10-K for the year ended December 31, 2014 CONTENTS
3
PART I Item 1. Business 5 Item 1A. Risk Factors 16 Item 1B. Unresolved Staff Comments 22 Item 2. Properties 23 Item 3. Legal Proceedings 24 Item 4. Mine Safety Disclosures 24 Executive Officers of the Registrant 25 PART II Item 5. Market for Registrant's Common Equity, Related Stockholder Matters, and Issuer Purchases of Equity Securities 26 Item 6. Selected Financial Data 28 Item 7. Management's Discussion and Analysis of Financial Condition and Results of Operations 30 Item 7A. Quantitative and Qualitative Disclosures About Market Risk 57 Item 8. Financial Statements and Supplementary Data 59 Item 9. Changes In and Disagreements With Accountants on Accounting and Financial Disclosure 59 Item 9A. Controls and Procedures 59 Item 9B. Other Information 60 PART III Item 10. Directors, Executive Officers, and Corporate Governance 60 Item 11. Executive Compensation 60 Item 12. Security Ownership of Certain Beneficial Owners and Management and Related Stockholder Matters 60 Item 13. Certain Relationships and Related Transactions, and Director Independence 60 Item 14. Principal Accounting Fees and Services 60 PART IV Item 15. Exhibits, Financial Statement Schedules 61 SIGNATURES 64 Consolidated Financial Statements Reports of Independent Registered Public Accounting Firm F-2 Consolidated Balance Sheets as of December 31, 2014 and 2013 F-4 Consolidated Statements of Operations for the years ended December 31, 2014, 2013, and 2012 F-6 Consolidated Statements of Comprehensive Income for the years ended December 31, 2014, 2013, and 2012 F-7 Consolidated Statements of Cash Flows for the years ended December 31, 2014, 2013, and 2012 F-8 Consolidated Statements of Stockholders' Equity for the years ended December 31, 2014, 2013, and 2012 F-9 Notes to the Consolidated Financial Statements F-10

This page intentionally left blank.
4

PART I
Our Business Vishay Intertechnology, Inc. ("Vishay," the "Company," "we," "us," or "our") is a leading global manufacturer and supplier of discrete semiconductors and passive components. Semiconductors include MOSFETs, diodes, and optoelectronic components. Passive components include resistive products, capacitors, and inductors. Discrete semiconductors and passive components are essential elements of virtually every type of electronic circuit. They support the microprocessor chips and other integrated circuits ("ICs") that coordinate and control the functions of electronic devices and equipment. We offer our customers "one-stop shop" access to one of the most comprehensive electronic component product lines of any manufacturer in the United States, Europe, and Asia. Our semiconductor components are used for a wide variety of functions, including power control, power conversion, power management, signal switching, signal routing, signal blocking, signal amplification, two-way data transfer, one-way remote control, and circuit isolation. Our passive components are used to restrict current flow, suppress voltage increases, store and discharge energy, control alternating current ("AC") and voltage, filter out unwanted electrical signals, and perform other functions. Our components are used in virtually every type of product that contains electronic circuitry, in the industrial, computing, automotive, consumer, telecommunications, power supplies, military, aerospace, and medical markets. The Vishay Story In the 1950's, the late Dr. Felix Zandman, Vishay's founder, was issued patents for his PhotoStress® coatings and instruments, used to reveal and measure the distribution of stresses in structures such as airplanes and cars under live load conditions. His research in this area led him to develop Bulk Metal® foil resistors – ultra-precise, ultra-stable resistors with performance far beyond any other resistor available to date. In 1962, Dr. Zandman, with a loan from the late Alfred P. Slaner, founded Vishay to develop and manufacture Bulk Metal foil resistors. Concurrently, J.E. Starr developed foil resistance strain gages, which also became part of Vishay. Throughout the 1960's and 1970's, Vishay established itself as a technical and market leader in foil resistors, PhotoStress products, and strain gages. These products were included with the measurements and foil resistor businesses that we spun off into an independent, publicly-traded company named Vishay Precision Group, Inc. ("Vishay Precision Group" or "VPG") through a tax-free stock dividend to our stockholders on July 6, 2010. In 1985, Vishay began to expand its product line through various strategic acquisitions, including the resistor companies Dale Electronics, Draloric Electronic, and Sfernice. In the early 1990's, Vishay applied its acquisition strategy to the capacitor market, with the major acquisitions of Sprague Electric, Roederstein, and Vitramon. In 2002, Vishay acquired BCcomponents, the former passive components business of Philips Electronics and Beyschlag, which greatly enhanced Vishay's global market position in passive components. Over the years, we have made several smaller passive components acquisitions to gain market share, penetrate different geographic markets, enhance new product development, round out our product lines, or grow our high margin niche businesses. These include Electro-Films, Cera-Mite, and Spectrol in 2000; Tansitor and North American Capacitor Company (Mallory) in 2001; the thin film interconnect business of Aeroflex in 2004; Phoenix do Brasil in 2006; the wet tantalum capacitor business of KEMET Corporation in 2008; the resistor businesses of Huntington Electric in 2011; HiRel Systems in 2012; MCB Industrie in 2013; and Holy Stone Polytech in 2014. In the late 1990's, Vishay began expanding its product lines to include discrete semiconductors. In 1998, Vishay acquired the Semiconductor Business Group of TEMIC, which included Telefunken and an 80.4% interest in Siliconix, producers of MOSFETs, RF transistors, diodes, optoelectronics, and power and analog switching integrated circuits. Vishay's next semiconductor acquisition came in 2001, with the purchase of the infrared components business of Infineon Technologies, which was followed the same year by Vishay's acquisition of General Semiconductor, a leading global manufacturer of rectifiers and diodes. In 2005, Vishay made a successful tender offer for the minority interest in Siliconix. In 2007, Vishay acquired the Power Control Systems business of International Rectifier, further enhancing our product offerings. These acquisitions propelled Vishay into the top ranks of discrete semiconductor manufacturers. In 2014, Vishay increased its position in optoelectronic sensors through its acquisition of Capella, a fabless IC design company specializing in optoelectronic components. We continue to implement the vision, strategy, and culture articulated by Dr. Zandman as we continue to work tirelessly to enhance value for our stockholders. Vishay was incorporated in Delaware in 1962 and maintains its principal executive offices at 63 Lancaster Avenue, Malvern, Pennsylvania 19355-2143. Our telephone number is (610) 644-1300.
5
Item 1. BUSINESS
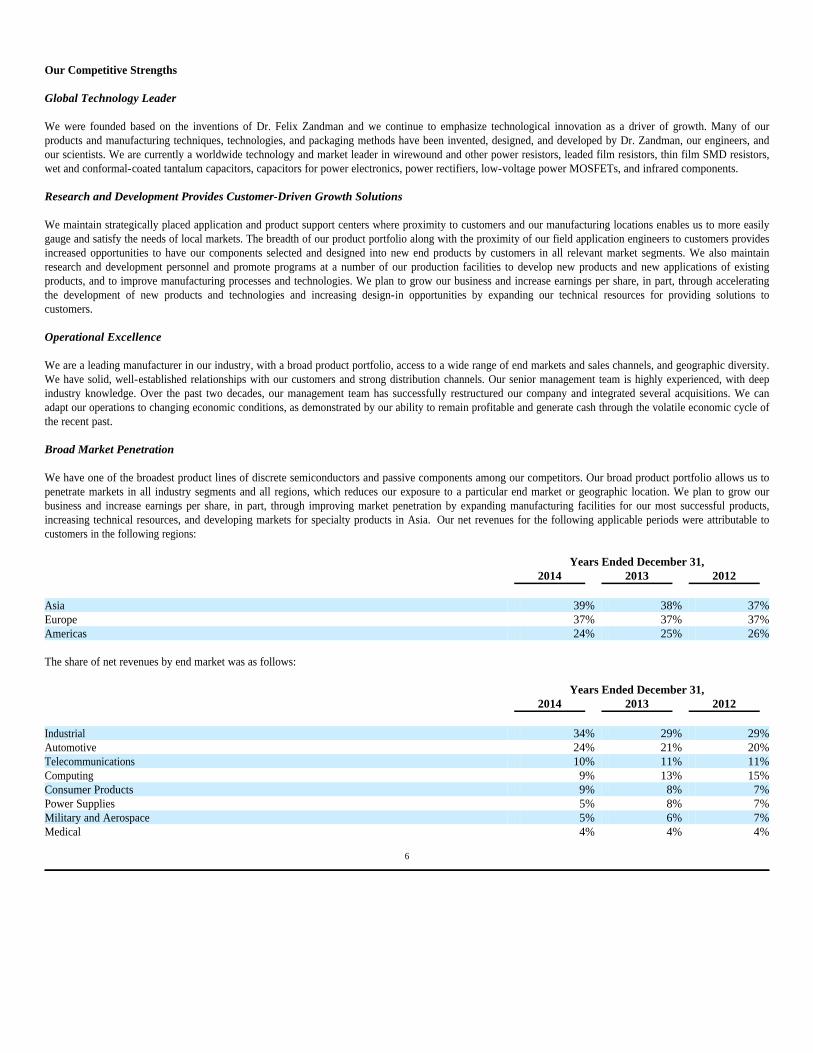
Our Competitive Strengths Global Technology Leader We were founded based on the inventions of Dr. Felix Zandman and we continue to emphasize technological innovation as a driver of growth. Many of our products and manufacturing techniques, technologies, and packaging methods have been invented, designed, and developed by Dr. Zandman, our engineers, and our scientists. We are currently a worldwide technology and market leader in wirewound and other power resistors, leaded film resistors, thin film SMD resistors, wet and conformal-coated tantalum capacitors, capacitors for power electronics, power rectifiers, low-voltage power MOSFETs, and infrared components. Research and Development Provides Customer-Driven Growth Solutions We maintain strategically placed application and product support centers where proximity to customers and our manufacturing locations enables us to more easily gauge and satisfy the needs of local markets. The breadth of our product portfolio along with the proximity of our field application engineers to customers provides increased opportunities to have our components selected and designed into new end products by customers in all relevant market segments. We also maintain research and development personnel and promote programs at a number of our production facilities to develop new products and new applications of existing products, and to improve manufacturing processes and technologies. We plan to grow our business and increase earnings per share, in part, through accelerating the development of new products and technologies and increasing design-in opportunities by expanding our technical resources for providing solutions to customers. Operational Excellence We are a leading manufacturer in our industry, with a broad product portfolio, access to a wide range of end markets and sales channels, and geographic diversity. We have solid, well-established relationships with our customers and strong distribution channels. Our senior management team is highly experienced, with deep industry knowledge. Over the past two decades, our management team has successfully restructured our company and integrated several acquisitions. We can adapt our operations to changing economic conditions, as demonstrated by our ability to remain profitable and generate cash through the volatile economic cycle of the recent past. Broad Market Penetration We have one of the broadest product lines of discrete semiconductors and passive components among our competitors. Our broad product portfolio allows us to penetrate markets in all industry segments and all regions, which reduces our exposure to a particular end market or geographic location. We plan to grow our business and increase earnings per share, in part, through improving market penetration by expanding manufacturing facilities for our most successful products, increasing technical resources, and developing markets for specialty products in Asia. Our net revenues for the following applicable periods were attributable to customers in the following regions:
The share of net revenues by end market was as follows:
6
Years Ended December 31, 2014 2013 2012 Asia 39% 38% 37%Europe 37% 37% 37%Americas 24% 25% 26%
Years Ended December 31, 2014 2013 2012 Industrial 34% 29% 29%Automotive 24% 21% 20%Telecommunications 10% 11% 11%Computing 9% 13% 15%Consumer Products 9% 8% 7%Power Supplies 5% 8% 7%Military and Aerospace 5% 6% 7%Medical 4% 4% 4%
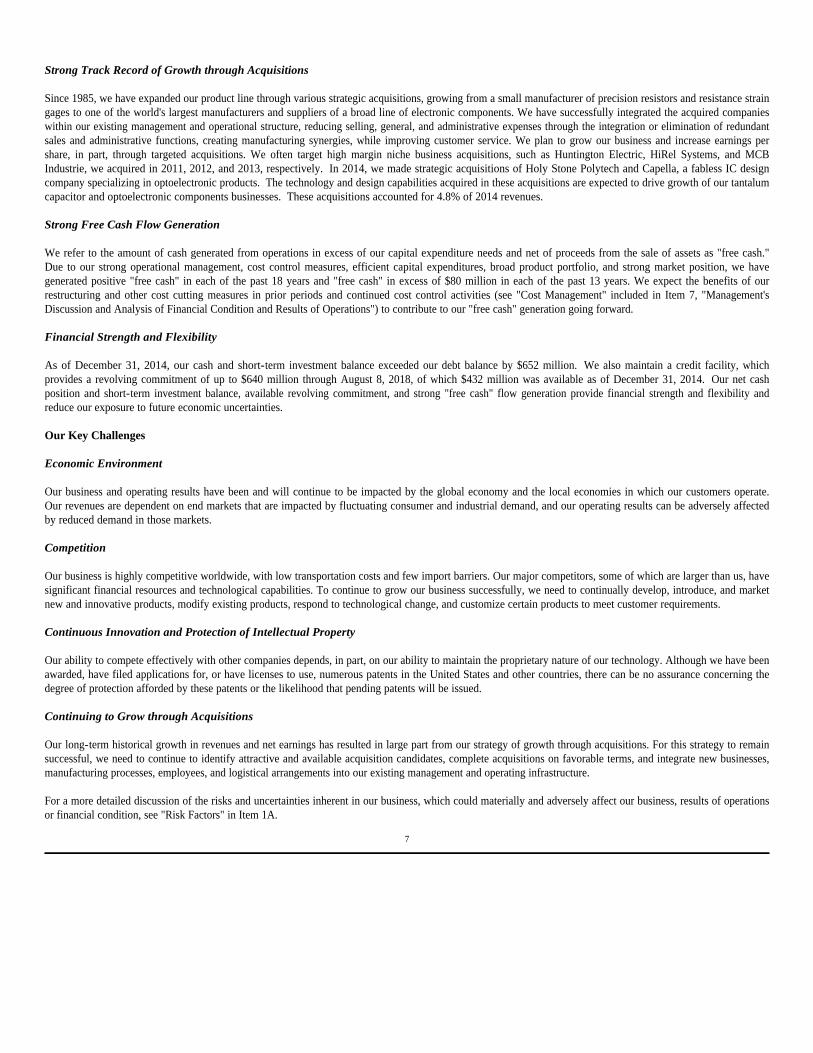
Strong Track Record of Growth through Acquisitions Since 1985, we have expanded our product line through various strategic acquisitions, growing from a small manufacturer of precision resistors and resistance strain gages to one of the world's largest manufacturers and suppliers of a broad line of electronic components. We have successfully integrated the acquired companies within our existing management and operational structure, reducing selling, general, and administrative expenses through the integration or elimination of redundant sales and administrative functions, creating manufacturing synergies, while improving customer service. We plan to grow our business and increase earnings per share, in part, through targeted acquisitions. We often target high margin niche business acquisitions, such as Huntington Electric, HiRel Systems, and MCB Industrie, we acquired in 2011, 2012, and 2013, respectively. In 2014, we made strategic acquisitions of Holy Stone Polytech and Capella, a fabless IC design company specializing in optoelectronic products. The technology and design capabilities acquired in these acquisitions are expected to drive growth of our tantalum capacitor and optoelectronic components businesses. These acquisitions accounted for 4.8% of 2014 revenues. Strong Free Cash Flow Generation We refer to the amount of cash generated from operations in excess of our capital expenditure needs and net of proceeds from the sale of assets as "free cash." Due to our strong operational management, cost control measures, efficient capital expenditures, broad product portfolio, and strong market position, we have generated positive "free cash" in each of the past 18 years and "free cash" in excess of $80 million in each of the past 13 years. We expect the benefits of our restructuring and other cost cutting measures in prior periods and continued cost control activities (see "Cost Management" included in Item 7, "Management's Discussion and Analysis of Financial Condition and Results of Operations") to contribute to our "free cash" generation going forward. Financial Strength and Flexibility As of December 31, 2014, our cash and short-term investment balance exceeded our debt balance by $652 million. We also maintain a credit facility, which provides a revolving commitment of up to $640 million through August 8, 2018, of which $432 million was available as of December 31, 2014. Our net cash position and short-term investment balance, available revolving commitment, and strong "free cash" flow generation provide financial strength and flexibility and reduce our exposure to future economic uncertainties. Our Key Challenges Economic Environment Our business and operating results have been and will continue to be impacted by the global economy and the local economies in which our customers operate. Our revenues are dependent on end markets that are impacted by fluctuating consumer and industrial demand, and our operating results can be adversely affected by reduced demand in those markets. Competition Our business is highly competitive worldwide, with low transportation costs and few import barriers. Our major competitors, some of which are larger than us, have significant financial resources and technological capabilities. To continue to grow our business successfully, we need to continually develop, introduce, and market new and innovative products, modify existing products, respond to technological change, and customize certain products to meet customer requirements. Continuous Innovation and Protection of Intellectual Property Our ability to compete effectively with other companies depends, in part, on our ability to maintain the proprietary nature of our technology. Although we have been awarded, have filed applications for, or have licenses to use, numerous patents in the United States and other countries, there can be no assurance concerning the degree of protection afforded by these patents or the likelihood that pending patents will be issued. Continuing to Grow through Acquisitions Our long-term historical growth in revenues and net earnings has resulted in large part from our strategy of growth through acquisitions. For this strategy to remain successful, we need to continue to identify attractive and available acquisition candidates, complete acquisitions on favorable terms, and integrate new businesses, manufacturing processes, employees, and logistical arrangements into our existing management and operating infrastructure. For a more detailed discussion of the risks and uncertainties inherent in our business, which could materially and adversely affect our business, results of operations or financial condition, see "Risk Factors" in Item 1A.
7

Key Business Strategies Since our first acquisition in 1985, we have pursued a business strategy that principally consists of the following elements: Invest in Innovation to Drive Growth We plan to continue to use our research and development ("R&D"), engineering, and product marketing resources to continually roll out new and innovative products. As part of our plan to foster intensified internal growth, we have increased our R&D and engineering technical staff by approximately 20% since 2009 and plan to further increase it. In addition, we are increasing our technical field sales force in Asia by about 25% to increase opportunities to design-in our products in local markets. Our ability to react to changing customer needs and industry trends will continue to be key to our success. We intend to leverage our insights into customer demand to continually develop new innovative products within our existing lines and to modify our existing core products to make them more appealing, addressing changing customer needs and industry trends. We are directing increased funding and are focusing on developing products to capitalize on the connectivity, mobility, and sustainability growth drivers of our business. Cost Management We place a strong emphasis on controlling our costs. We focus on controlling fixed costs and reducing variable costs. When our ongoing cost management activites are not adequate, we take actions to maintain our cost competitiveness including restructuring our business to realign our labor distribution. Growth through Strategic Acquisitions We plan to continue to expand within the electronic components industry, through the acquisition of other manufacturers of electronic components that have established positions in major markets, reputations for product innovation, quality, and reliability, strong customer bases, and product lines with which we have substantial marketing and technical expertise. Customer Service Excellence We maintain significant production facilities in those regions where we market the bulk of our products in order to enhance the service and responsiveness that we provide to our customers. We aim to further strengthen our relationships with customers and strategic partners by providing broad product lines that allow us to provide "one-stop shop" service, whereby they can streamline their design and purchasing processes by ordering multiple types of products. Our growth plan was designed based on the tenets of the key business strategies listed above.
8

Products We design, manufacture, and market electronic components that cover a wide range of functions and technologies. Our product portfolio includes:
We promote our ability to provide "one-stop shop" service to customers, whereby they can streamline their design and purchasing processes by ordering multiple types of products from Vishay. Our technical sales force consisting of field application engineers offers customers the complete breadth of the Vishay portfolio for their applications. We aim to use this broad portfolio to increase opportunities to have our components selected and "designed in" to new end products.
9
MOSFETs Segment Resistors & Inductors Segment MOSFETs Film Resistors • Low-Voltage TrenchFET® Power MOSFETs • Metal Film Resistors • Medium-Voltage Power MOSFETs • Thin Film Resistors • High-Voltage Planar MOSFETs • Thick Film Resistors • High-Voltage Super Junction MOSFETs • Power Thick Film Resistors • Automotive-Grade MOSFETs • Metal Oxide Film Resistors ICs • Carbon Film Resistors • Power Management and Power Control ICs Wirewound Resistors • Smart Load Switches • Vitreous, Cemented, and Housed Resistors • Analog Switches and Multiplexers • Braking and Neutral Grounding Resistors • Custom Load Banks Diodes Segment Power Metal Strip® Resistors Rectifiers Battery Management Shunts • Schottky Rectifiers Crowbar and Steel Blade Resistors • Ultra-Fast Recovery Rectifiers Thermo Fuses • Standard and Fast Recovery Rectifiers Chip Fuses • High-Power Rectifiers/Diodes Pyrotechnic Initiators / Igniters • Bridge Rectifiers Variable Resistors Small-Signal Diodes • Cermet Variable Resistors • Schottky and Switching Diodes • Wirewound Variable Resistors • Zener Diodes • Conductive Plastic Variable Resistors • Tuner/Capacitance Diodes • Contactless Potentiometers • Bandswitching Diodes • Hall Effect Position Sensors • RF PIN Diodes • Precision Magnetic Encoders Protection Diodes Networks/Arrays • TVS Diodes or TRANSZORB® (uni-directional, bi-directional) Non-Linear Resistors • ESD Protection Diodes (including arrays) • NTC Thermistors Thyristors/SCR • PTC Thermistors • Phase-Control Thyristors • Varistors • Fast Thyristors Magnetics IGBTs • Inductors Power Modules • Wireless Charging Coils • Input Modules (diodes and thyristors) • Transformers • Output & Switching Modules (contain MOSFETs, IGBTs, and diodes) Connectors • Custom Modules Capacitors Segment Optoelectronic Components Segment Tantalum Capacitors Infrared Emitters and Detectors • Molded Chip Tantalum Capacitors Optical Sensors • Molded Chip Polymer Tantalum Capacitor Infrared Remote Control Receivers • Coated Chip Tantalum Capacitors Optocouplers • Solid Through-Hole Tantalum Capacitors • Phototransistor, Photodarlington • Wet Tantalum Capacitors • Linear Ceramic Capacitors • Phototriac • Multilayer Chip Capacitors • High Speed • Multilayer Chip RF Capacitors • IGBT and MOSFET Driver • Disc Capacitors Solid-State Relays Film Capacitors LEDs and 7-Segment Displays Power Capacitors Infrared Data Transceiver Modules Heavy-Current Capacitors Custom Products Aluminum Capacitors ENYCAPTM Energy Storage Capacitors
Product Segments Our products can be divided into two general classes: semiconductors and passive components. Semiconductors are sometimes referred to as "active components" because they require power to function whereas passive components do not require power to function. Our semiconductor and passive components products are further categorized based on their functionality for financial reporting purposes. See Note 15 to our consolidated financial statements for additional information on revenues, income, and total assets by segment. Semiconductors Our semiconductor products include MOSFETs, Diodes, and Optoelectronic Components. Semiconductors are typically used to perform functions such as switching, amplifying, rectifying, routing, or transmitting electrical signals, power conversion, and power management. MOSFETs Segment Our MOSFETs business includes both the commodity and non-commodity markets in which we believe that we enjoy a good reputation and strong brand recognition (Siliconix). MOSFETs function as solid-state switches to control power in multiple applications, including mobile phones, notebook and desktop computers, tablet computers, digital cameras, televisions, DC/DC and AC/DC switch mode power supplies, solar inverters, automotive and industrial systems. We are a leader in low-voltage TrenchFET MOSFETs and also offer high-voltage MOSFETs. Our MOSFETs product line includes low- and medium-voltage TrenchFET MOSFETs, high-voltage planar MOSFETs, high voltage Super Junction MOSFETs, power integrated circuits (power ICs), and integrated function power devices. We are one of the technology leaders in MOSFETs, with a tradition of innovation in wafer design, packaging, and performance. Diodes Segment Our Diodes business is a solid business with a strong market presence in both the commodity and non-commodity markets. The products that comprise our Diodes business represent our broadest product line and include rectifiers, small signal diodes, protection diodes, thyristors/SCRs and power modules. The primary application of rectifiers, found inside the power supplies of virtually all electronic equipment, is to derive DC power from the AC supply. Vishay is the worldwide leader in rectifiers, having a broad technology base and a good position in automotive, industrial, computing and consumer markets. Our rectifier innovations include TMBS® using Trench MOS barrier Schottky rectifier technology, which reduces power loss and improves the efficiency of end systems and eSMP®, the best in class high-current density surface mount packages. Our wide selection of small signal diodes consist of the following functions: switching, tuning, band-switching, RF attenuation and voltage regulation (Zener). They are available in various glass and plastic packaging options and generally are used in electronic circuits, where small currents and high frequencies are involved. Vishay is also one of the market leaders for TVS (transient voltage suppressor) diodes. The portfolio of protection diodes includes ESD protection and EMI filter. Our thyristors or SCR (silicon-controlled rectifiers) are very popular in the industrial high-voltage AC power control applications. The fast growing markets of solar inverter and HEV/EV are the focus of our power modules business (IGBT or MOSFET modules). These modules can be customized to fit in different customer design requirements. Optoelectronic Components Segment Our Optoelectronic Components business has a strong market presence in both the commodity and non-commodity markets. Optoelectronic components emit light, detect light, or do both. Our broad range of standard and customer specific optoelectronic components includes infrared ("IR") emitters and detectors, IR remote control receivers, optocouplers, solid-state relays, optical sensors, light-emitting diodes ("LEDs"), 7-segment displays, and IR data transceiver modules (IrDA®). Our IR remote control receivers are designed for use in infrared remote control, data transmission, and light barrier applications in end products including televisions, set-top boxes, notebook computers, and audio systems. We are the leading manufacturer of IR remote control receivers. Our optocouplers electrically isolate input and output signals. Uses include switch-mode power supplies, consumer electronics, telecommunications equipment, solar inverters, and industrial systems. Our IR data transceiver modules are used for short range, two-way, high-speed, and secure wireless data transfer between electronic devices such as home medical appliances, mobile phones, industrial data loggers, and metering. Our optical sensors product line was considerably strengthened by our acquisition of Capella in 2014. Our optical sensors products include ambient light sensors, optical encoders, integrated photodiode and I/V amplifiers, proximity sensors, color sensors, and UV sensors. Applications include telecommunications, mobile phones, smartphone, handheld devices, digital cameras, laptops, desktop computers, LED backlighting, office automation equipment, household electrical appliance and automotive electronics. Our LEDs are designed for backlighting and illumination in automotive and other applications. Our LEDs include ultra-bright as well as small surface-mount packages, with products available in all standard colors including white.
10
Passive components Our passive components include resistors, capacitors, and magnetics such as inductors and transformers. Passive components are used to store electrical charges, to limit or resist electrical current, and to help in filtering, surge suppression, measurement, timing, and tuning applications. Resistors and Inductors Segment Our Resistors and Inductors business is our original business. We maintain the broadest portfolio of resistor products worldwide. The business is solid, predictable, and growing at relatively stable selling prices. We are a market leader with a strong technology base, many specialty products, and strong brand recognition (such as our Dale, Draloric, Beyschlag, Sfernice, and HiRel Systems brands). We focus on higher value markets in specialized industries, while maintaining a complete portfolio of commodity products. We do not aim to be the volume leader in commodity markets. Resistors are basic components used in all forms of electronic circuitry to adjust and regulate levels of voltage and current. They vary widely in precision and cost, and are manufactured from numerous materials and in many forms. Linear resistive components are classified as variable or fixed, depending on whether or not their resistance is adjustable. Non-linear resistors function by varying in resistance under influence of temperature (thermistors) or voltage (varistors). They can be used in temperature-measuring applications or as current or voltage-limiting devices. We manufacture virtually all types of fixed resistors, both in discrete and network forms, as well as many variable types. Vishay resistor innovations include Power Metal Strip® technology. These resistors feature very low resistance and are used to measure changes in current flow (current sensing) or divert current flow (shunting). Inductors use an internal magnetic field to change AC current phase and resist AC current. Inductor applications include controlling AC current and voltage, filtering out unwanted electrical signals, and energy storage. Vishay inductor innovations include IHLP® low-profile, high-current inductor technology with industry-leading specifications, which is patented and generates royalty revenue. Our low-profile, high-current inductors save circuit board space and power in voltage regulator module ("VRM") and DC to DC converter applications. In addition, we are a worldwide leader in custom magnetic solutions focusing on high performance and high reliability. This field has been substantially strengthened, with the 2012 acquisition of HiRel Systems, broadening our portfolio, customer, and market segment reach. Capacitors Segment Our Capacitors business consists of a broad range of reliable, high-quality products. We have a strong presence worldwide in specialty markets based on our product performance and reliability and strong brand recognition (including our Sprague, Vitramon, Roederstein, BCcomponents, and ESTA brands). We focus on higher value markets in specialized industries, while maintaining a complete portfolio of commodity products. We do not aim to be the volume leader in commodity markets. Capacitors are used in almost all electronic circuits. They store energy and discharge it when needed. Important applications for capacitors include electronic filtering for linear and switching power supplies; decoupling and bypass of electronic signals for integrated circuits and circuit boards; and frequency control, timing and conditioning of electronic signals for a broad range of applications. We manufacture products based on all major capacitor technologies: tantalum (molded chip tantalum, coated chip tantalum, solid through-hole tantalum, wet tantalum, and polymer), ceramic (multilayer chip and ceramic disc), film, power, heavy-current, and aluminum electrolytic. Our capacitors range from tiny surface-mount devices for hearing aids and mobile devices to large power correction capacitors used in renewable energy, heavy industry, and electrical power grids. We are a recognized technology leader in many product ranges, securing our strong position in military and medical markets, and in a wide range of industrial and automotive applications. Our wet tantalum and MicroTan™ technologies are market leaders.
11

Military Qualifications We have qualified certain of our products under various military specifications approved and monitored by United States government agencies, and under certain European military specifications. Qualification levels are based in part upon the rate of failure of products. In order to maintain the classification level of a product, we must continuously perform tests on the product and the results of these tests must be reported to the government agencies. If the product fails to meet the requirements for the applicable classification level, the product's classification may be reduced to a lower level. During the time that the classification level is reduced for a product with military application, net revenues and earnings attributable to that product may be adversely affected. Manufacturing Operations In order to better serve our customers, we maintain production facilities in locations where we market the bulk of our products, such as the United States, Germany, and Asia. To optimize production efficiencies, we have whenever practicable established manufacturing facilities in countries, such as the Czech Republic, Hungary, India, Israel, Malaysia, Mexico, the People's Republic of China, and the Philippines, where we can benefit from lower labor and tax costs and also benefit from various government incentives, including grants and tax relief. One of our most sophisticated manufacturing operations is the production of power semiconductor components. This manufacturing process involves two phases of production: wafer fabrication and assembly (or packaging). Wafer fabrication subjects silicon wafers to various thermal, metallurgical, and chemical process steps that change their electrical and physical properties. These process steps define cells or circuits within numerous individual devices (termed "dies" or "chips") on each wafer. Assembly is the sequence of production steps that divides the wafer into individual chips and encloses the chips in structures (termed "packages") that make them usable in a circuit. Both wafer fabrication and assembly phases incorporate wafer level and device level electrical testing to ensure that device design integrity has been achieved. In the United States, our manufacturing facilities are located in California, Minnesota, Nebraska, New Hampshire, New York, Rhode Island, South Dakota, Vermont, and Wisconsin. In Asia, our main manufacturing facilities are located in the People's Republic of China, the Republic of China (Taiwan), India, and Malaysia. In Europe, our main manufacturing facilities are located in Germany, France, and the Czech Republic. We have substantial manufacturing facilities in Israel. We also have manufacturing facilities in Austria, Dominican Republic, Japan, Hungary, Italy, Mexico, the Netherlands, Portugal, and the Philippines. Over the past several years, we have invested substantial resources to increase the efficiency of our plants, which we believe will further reduce production costs. The majority of our manufacturing operations have received ISO 9001 certification and others are actively pursuing such approval. ISO 9001 is a comprehensive set of quality program standards developed by the International Standards Organization. See Note 15 to our consolidated financial statements for financial information by geographic area. Sources of Supplies Although most materials incorporated in our products are available from a number of sources, certain materials, including plastics and metals, are available only from a relatively limited number of suppliers or are subject to significant price volatility. Silicon wafers are the most important raw material for the manufacturing of our semiconductor products. Silicon wafers are manufactured from high-purity silicon, a metalloid. There have at times been industry-wide shortages of high-purity silicon resulting primarily from growing demand of the electronic component and solar power industries, and limited growth in high-purity silicon manufacturing capacities. Shifts in demand for high-purity silicon and in turn, silicon wafers, have resulted in significant fluctuation in prices of silicon wafers. We are a major consumer of the world's annual production of tantalum, a metal used in the manufacturing of tantalum capacitors. There are few suppliers that process tantalum ore into capacitor grade tantalum powder. Certain materials, in addition to tantalum and including tin, tungsten, and gold are available only from a relatively limited number of suppliers, the source for which may be in the Democratic Republic of the Congo ("DRC") or an adjoining country. We are working toward the elimination of materials that directly or indirectly finance or benefit armed groups in the DRC or adjoining countries from our supply chain. Palladium, a metal used to produce multi-layer ceramic capacitors, is currently found primarily in South Africa and Russia. Palladium is a commodity metal that is subject to price volatility. We periodically enter into short-term commitments to purchase palladium. Certain metals used in the manufacture of our products, such as copper, are traded on active markets, and can be subject to significant price volatility. Our policy is to enter into short-term commitments to purchase defined portions of annual consumption of these metals if market prices decline below budget.
12

Inventory and Backlog We manufacture both standardized products and those designed and produced to meet customer specifications. We maintain an inventory of standardized components and monitor the backlog of outstanding orders for our products. We include in our backlog only open orders that we expect to ship in the next twelve months. Many of our customers encounter uncertain and changing demand for their products. They typically order products from us based on their forecasts. If demand falls below customers' forecasts, or if customers do not control their inventory effectively, they may cancel or reschedule the shipments included in our backlog, in many instances without the payment of any penalty. Therefore, our backlog at any point in time is not necessarily indicative of the results to be expected for future periods. Customers and Marketing We sell our products to original equipment manufacturers ("OEMs"), electronic manufacturing services ("EMS") companies, which manufacture for OEMs on an outsourcing basis, and independent distributors that maintain large inventories of electronic components for resale to OEMs and EMS companies. The distribution of sales by customer type for 2014 is shown below:
Our sales organizations are regionally based. While our sales and support procedures are typically similar across all regions, we remain flexible in our ability to offer programs tailored to our customers' specific support requirements in each local area. The aim of our sales organizations is supporting our customers across all product lines, developing new design wins, negotiating pricing and contracts, and providing general commercial support as would normally be expected of a large multi-national sales force. We have an established Strategic Global Account program, which provides each of our top customers with a dedicated Strategic Global Account Manager. Our Strategic Global Account Managers are typically highly experienced salesmen or saleswomen who are capable of providing key customers with the coordination and management visibility required in a complex multi-product business relationship. They typically coordinate the sales, pricing, contract, logistic, quality, and other aspects of the customer's business requirements. The Strategic Global Account Manager normally is the focal point of communication between Vishay and our main customers. We maintain a similar program for our strategic distributors as well. We work with our customers so that our products are incorporated into the design of electronic equipment at the earliest stages of development and to provide technical and applications support. In addition to our staff of direct field sales personnel, independent manufacturers' representatives, and distributors, our Business Development group maintains teams of dedicated Field Application Engineers ("FAEs") to assist our customers in solving technical problems and in developing products to meet specific customer application needs using our entire product portfolio to provide support for our customers' engineering needs. Organized by market segment, our Business Development FAEs bring specific knowledge of component applications in their areas of expertise in the automotive, telecommunications, computer, consumer/entertainment, industrial, peripherals, digital consumer, and other market segments. With the ultimate goal of a Vishay "design-in" – the process by which our customers specify a Vishay component in their products – this program offers our customers enhanced access to all Vishay technologies while at the same time increasing design wins, and ultimately sales, for us. Most importantly, the process is closely monitored via a proprietary database developed by our Business Development group. Our database captures specific design activities and allows for real-time measurement of new business potential for our management team. Our 2014 acquisition of Capella greatly increased our in-house design capabilities, particularly for optoelectronic components. Our top 30 customers have been relatively stable despite not having long-term commitments to purchase our products. With selected customers, we have signed longer term (greater than one year) contracts for specific products. Net revenues from our top 30 customers represent approximately 70% of our total net revenues. No single customer comprises more than 10% of our total net revenues. In certain areas we also work with sales representatives. The commission expense for these sales representatives is not material. Research and Development Many of our products and manufacturing techniques, technologies, and packaging methods have been invented, designed, and developed by Dr. Felix Zandman, our engineers, and our scientists. We maintain strategically placed design centers where proximity to customers enables us to more easily gauge and satisfy the needs of local markets. These design centers are located predominantly in the United States, Germany, Italy, Israel, the People's Republic of China, France, and the Republic of China (Taiwan). We also maintain research and development personnel and promote programs at a number of our production facilities to develop new products and new applications of existing products and to improve manufacturing processes and technologies. This decentralized system encourages product development at individual manufacturing facilities, closer to our customers.
13
Distributors 55%OEMs 39%EMS companies 6%
Competition We face strong competition in various product lines from both domestic and foreign manufacturers. Our primary competitors by product type include:
There are many other companies that produce products in the markets in which we compete. Our competitive position depends on our ability to maintain a competitive advantage on the basis of product quality, know-how, proprietary data, market knowledge, service capability, technological innovation, business reputation, and price competitiveness. Our sales and marketing programs aim to compete by offering our customers a broad range of world-class technologies and products, superior global sales and distribution support, and a secure and multi-location source of product supply. Patents and Licenses We have made a significant investment in securing intellectual property protection for our technology and products. We seek to protect our technology by, among other things, filing patent applications for technology considered important to the development of our business. We also rely upon trade secrets, unpatented know-how, continuing technological innovation, and the aggressive pursuit of licensing opportunities to help develop and maintain our competitive position. Our ability to compete effectively with other companies depends, in part, on our ability to maintain the proprietary nature of our technology. Although we have been awarded, have filed applications for, or have been licensed under, numerous patents in the United States and other countries, there can be no assurance concerning the degree of protection afforded by these patents or the likelihood that pending patents will be issued. We require all of our technical, research and development, sales and marketing, and management employees and most consultants and other advisors to execute confidentiality agreements upon the commencement of employment or consulting relationships with us. These agreements provide that all confidential information developed or made known to the entity or individual during the course of the entity's or individual's relationship with us is to be kept confidential and not disclosed to third parties except in specific circumstances. Substantially all of our technical, research and development, sales and marketing, and management employees have entered into agreements providing for the assignment to us of rights to inventions made by them while employed by us. When we believe other companies are misappropriating our intellectual property rights, we vigorously enforce those rights through legal action, and we intend to continue to do so. See Item 3, "Legal Proceedings." Although we have numerous United States and foreign patents covering certain of our products and manufacturing processes, no particular patent is considered individually material to our business. Employees As of December 31, 2014, we employed approximately 22,600 full time employees, of whom approximately 89% were located outside the United States. Our future success is substantially dependent on our ability to attract and retain highly qualified technical and administrative personnel. Some of our employees outside the United States are members of trade unions, and employees at one U.S. facility are represented by a trade union. Our relationship with our employees is generally good. However, no assurance can be given that, if we continue to restructure our operations and/or reduce employee hours in response to changing economic conditions, labor unrest or strikes will not occur.
14
· MOSFETs: Fairchild Semiconductor, Infineon, NXP Semiconductors, ON Semiconductor, Rohm, STMicroelectronics, Toshiba.
· Diodes: Diodes, Inc., Infineon, NXP Semiconductors, ON Semiconductor, STMicroelectronics.
· Optoelectronic Components: Avago, OSRAM Opto Semiconductors, Rohm, Sharp, Toshiba.
· Resistors and Inductors: KOA, Murata, Panasonic, Rohm, TDK-EPCOS, Yageo.
· Capacitors: AVX, KEMET, Murata, Nichicon, Panasonic, TDK-EPCOS, Yageo.
Environment, Health and Safety We have adopted an Environmental Health and Safety Corporate Policy that commits us to achieve and maintain compliance with applicable environmental laws, to promote proper management of hazardous materials for the safety of our employees and the protection of the environment, and to minimize the hazardous materials generated in the course of our operations. This policy is implemented with accountability directly to the Board of Directors. In addition, our manufacturing operations are subject to various federal, state, and local laws restricting discharge of materials into the environment. We are involved in environmental remediation programs at various sites currently or formerly owned by us and our subsidiaries both within and outside of the U.S., in addition to involvement as a potentially responsible party ("PRP") at Superfund sites. Certain obligations as a PRP have arisen in connection with business acquisitions. The remediation programs are on-going and the ultimate cost of site cleanup is difficult to predict given the uncertainties regarding the extent of the required cleanup, the interpretation of applicable laws and regulations and alternative cleanup methods. See Item 3, "Legal Proceedings." We are not involved in any pending or threatened proceedings that would require curtailment of our operations. We continually expend funds to ensure that our facilities comply with applicable environmental regulations. While we believe that we are in material compliance with applicable environmental laws, we cannot accurately predict future developments and do not necessarily have knowledge of all past occurrences on sites that we currently occupy. More stringent environmental regulations may be enacted in the future, and we cannot determine the modifications, if any, in our operations that any such future regulations might require, or the cost of compliance with such regulations. Moreover, the risk of environmental liability and remediation costs is inherent in the nature of our business and, therefore, there can be no assurance that material environmental costs, including remediation costs, will not arise in the future. With each acquisition, we attempt to identify potential environmental concerns and to minimize, or obtain indemnification for, the environmental matters we may be required to address. In addition, we establish reserves for specifically identified potential environmental liabilities. We believe that the reserves we have established are adequate. Nevertheless, we have in the past and may in the future inherit certain pre-existing environmental liabilities, generally based on successor liability doctrines. Although we have never been involved in any environmental matter that has had a material adverse impact on our overall operations, there can be no assurance that in connection with any past or future acquisition we will not be obligated to address environmental matters that could have a material adverse impact on our operations. Company Information and Website We file annual, quarterly, and current reports, proxy statements, and other documents with the Securities and Exchange Commission ("SEC") under the Securities Exchange Act of 1934. The public may read and copy any materials that we file with the SEC at the SEC's Public Reference Room at Station Place, 100 F Street, N.E., Washington, DC 20549. The public may obtain information on the operation of the Public Reference Room by calling the SEC at 1-800-SEC-0330. Also, the SEC maintains an Internet website that contains reports, proxy and information statements, and other information regarding issuers, including us, that file electronically with the SEC. The public can obtain any documents that we file with the SEC at http://www.sec.gov. In addition, our company website can be found on the Internet at www.vishay.com. The website contains information about us and our operations. Copies of each of our filings with the SEC on Form 10-K, Form 10-Q, and Form 8-K, and all amendments to those reports, can be viewed and downloaded free of charge as soon as reasonably practicable after the reports and amendments are electronically filed with or furnished to the SEC. To view the reports, access ir.vishay.com and click on "SEC Filings." The following corporate governance related documents are also available on our website:
To view these documents, access ir.vishay.com and click on "Corporate Governance." Any of the above documents can also be obtained in print by any stockholder upon request to our Investor Relations Department at the following address:
Corporate Investor Relations Vishay Intertechnology, Inc. 63 Lancaster Avenue Malvern, PA 19355-2143
15
· Corporate Governance Principles· Code of Business Conduct and Ethics· Code of Ethics Applicable to the Company's Chief Executive Officer, Chief Financial Officer, Principal Accounting Officer or Controller and
Financial Managers· Audit Committee Charter· Nominating and Corporate Governance Committee Charter· Compensation Committee Charter· Policy on Director Attendance at Annual Meetings· Nominating and Corporate Governance Committee Policy Regarding Qualification of Directors· Procedures for Securityholders' Submissions of Nominating Recommendations· Securityholder Communications with Directors and Interested Party Communication with Non-Management Directors· Whistleblower and Ethics Hotline Procedures· Related Party Transaction Policy

From time to time, information provided by us, including but not limited to statements in this report, or other statements made by or on our behalf, may contain "forward-looking" information within the meaning of the Private Securities Litigation Reform Act of 1995. Such statements involve a number of risks, uncertainties, and contingencies, many of which are beyond our control, which may cause actual results, performance, or achievements to differ materially from those anticipated. Set forth below are important factors that could cause our results, performance, or achievements to differ materially from those in any forward-looking statements made by us or on our behalf. You should understand that it is not possible to predict or identify all such factors. Consequently, you should not consider the following to be a complete discussion of all potential risks or uncertainties. Risks relating to our business generally Our business is cyclical and the periods of decline we recently experienced may resume and may become more pronounced. The electronic component industry is highly cyclical and experiences periods of decline from time to time. We and others in the electronic component industry have experienced these conditions in the recent past and cannot predict when we may experience such downturns in the future. While we believe that a recovery from the recent global downturn is underway, there is no assurance that the recovery will continue at its current pace or at all, or that the conditions that contributed to the recent recessionary environment have in fact abated. A decline in product demand on a global basis could result in order cancellations and deferrals, lower average selling prices, and a material and adverse impact on our results of operations. These declines in demand are driven by market conditions in the end markets for our products. Changes in the demand mix, needed technologies, and these end markets may adversely affect our ability to match our products, inventory, and capacity to meet customer demand and could adversely affect our operating results and financial condition. A slowdown in demand or recessionary trends in the global economy makes it more difficult for us to predict our future sales and manage our operations, and could adversely impact our results of operations. We have incurred and will continue to incur restructuring costs and associated asset write-downs. To remain competitive, particularly when business conditions are difficult, we sometimes attempt to reduce our cost structure by restructuring our existing businesses, where we seek to achieve synergies, eliminate redundant facilities and staff positions, and move operations, where possible, to jurisdictions with lower labor costs. In 2013, we announced various cost reduction programs as part of our continuous efforts to improve efficiency and operating performance. The programs primarily focus on a plan to enhance the competitiveness of our MOSFETs segment and a voluntary separation / early retirement offer to certain employees company-wide. We also plan to implement two other smaller cost reduction programs concerning the manufacturing of products within our Diodes segment. The expenses associated with the programs have been and will continue to be recorded as they become recognizable under generally accepted accounting principles ("GAAP"). Complete implementation of all of the programs is expected to occur before the end of the first fiscal quarter of 2016. Additionally, our long-term strategy includes growing through the integration of acquired businesses, and GAAP requires plant closure and employee termination costs that we incur in connection with our acquisition activities to be recorded as expenses in our consolidated statement of operations, as such expenses are incurred. For this reason, we expect to have some level of future restructuring expenses due to acquisitions. Our business is cyclical, and in periods of a rising economy we may experience intense demand for our products. If our restructuring activities result in us not being able to satisfy the intense demand from our customers during a rising economy and our competitors sufficiently expand production, we could lose customers and/or market share. These losses could have an adverse effect on our operations, financial condition, and results of operations. In the past we have grown through successful integration of acquired businesses, but this may not continue. Our long-term historical growth in revenues and net earnings has resulted in large part from our strategy of expansion through acquisitions. Despite our plan to continue to grow, in part, through targeted acquisitions, we may be unable to continue to identify, have the financial capabilities to acquire, or successfully complete transactions with suitable acquisition candidates. We are subject to various U.S. and foreign competition laws and regulations that may affect our ability to complete certain acquisitions. Also, if an acquired business fails to operate as anticipated, cannot be successfully integrated with our other businesses, or we cannot effectively mitigate the assumed, contingent, and unknown liabilities acquired, our results of operations, financial condition, enterprise value, market value, and prospects could all be materially adversely affected. Certain acquisitions will increase the risks inherent in our business. Our acquisition of Capella Microsystems (Taiwan) Inc. is unique compared to our past acquisitions. Most of our previous acquisitions were established businesses with substantial tangible assets. As a fabless design business, most of the assets acquired in the Capella transaction are intangible. If the acquired business does not perform as expected, we may be required to record impairment charges related to those intangible assets, with limited ability to monetize any of those assets. There are significant risks specific to the acquired business that could result in it not performing as expected. As a fabless design business, Capella is substantially dependent on independent third-party foundries and subcontractors to manufacture its products. If Capella cannot obtain sufficient capacity commitments, if Capella's foundries and subcontractors suffer financial instability, liquidity issues, or insolvency proceedings affecting their ability to manufacture our products, or if Capella's foundries and subcontractors experience production delays for other reasons, the supply of its products could be disrupted, which could adversely affect our business. If demand for its products increases significantly, we have no assurances that Capella's third-party foundries and subcontractors will be able to increase their manufacturing capacity to a level that meets our requirements, potentially preventing us from meeting our customer demand and harming our business and customer relationships. Also, even if Capella's foundries and subcontractors are able to meet our increased demand, those third-party manufacturers may decide to charge significantly higher wafer prices to us, which could reduce our gross margin or require us to offset the increased prices by increasing prices to our customers, either of which could harm our business and operating results.
16
Item 1A. RISK FACTORS

Capella's future success is substantially dependent on our ability to attract and retain highly qualified technical personnel. We could be materially adversely affected if the turnover rates for engineers and other key personnel increases significantly or we are unsuccessful in attracting, motivating and retaining qualified personnel. Should we lose one or more engineers who are key to a project's completion during the course of a particular project, the completion of such project may be delayed which could negatively affect customer relationships and goodwill and have a material adverse effect on our results of operations. Capella's historical customer base is concentrated among a few key customers, and is focused on end-users in the consumer products industry. The delay, significant reduction in, or loss of, orders from these large customers or the consumer products industry, or demands of price concessions from these customers could have a material adverse effect on our net revenues and results of operations, or could result in significant volatility in our results of operations. Significant fluctuations in interest rates could adversely affect our results of operations and financial position. We are exposed to changes in interest rates as a result of our borrowing activities and our cash balances. Our credit facility and our exchangeable unsecured notes due 2102 bear interest at variable rates based on LIBOR. A significant increase in LIBOR would significantly increase our interest expense. A general increase in interest rates would be largely offset by an increase in interest income earned on our cash and short-term investment balances, which are currently greater than our debt balances. However, there can be no assurance that the interest rate earned on cash and short-term investments will move in tandem with the interest rate paid on our variable rate debt. Our debt levels have increased and may continue to increase, which could adversely affect the perception in the financial markets of our financial condition. The recorded value of our outstanding debt increased from approximately $347 million as of December 31, 2008 to approximately $455 million as of December 31, 2014, primarily due to the issuance of convertible senior debentures, the proceeds from the sale of which we used to fund repurchases of our common stock, and borrowings to fund the Capella acquisition in 2014. The carrying value of our convertible senior debentures will continue to increase as the discount associated with the debentures is amortized. Additionally, we and our subsidiaries may incur substantial additional debt in the future, subject to the conditions contained in our existing debt instruments, some of which may be secured debt. The marketplace could react negatively to our current debt levels which in turn could affect our share price and also make it more difficult to obtain financing in the future. Future acquisitions could require us to issue additional indebtedness or equity. If we were to undertake a substantial acquisition for cash, the acquisition would likely need to be financed in part through bank borrowings or the issuance of public or private debt. This acquisition financing would likely decrease our ratio of earnings to fixed charges and adversely affect other leverage criteria. Under our existing credit facility, we are required to obtain the lenders' consent for certain additional debt financing and to comply with other covenants including the application of specific financial ratios. We cannot make any assurances that the necessary acquisition financing would be available to us on acceptable terms if and when required. If we were to undertake an acquisition for equity, the acquisition may have a dilutive effect on the interests of the holders of our common stock. Our existing credit facility restricts our current and future operations and requires compliance with certain financial covenants. Our existing credit facility includes restrictions on, among other things, incurring indebtedness, incurring liens on assets, making investments and acquisitions, making asset sales, and paying cash dividends and making other restricted payments. Our existing credit facility also requires us to comply with other covenants, including the maintenance of specific financial ratios. If we are not in compliance with all of such covenants, the credit facility could be terminated by the lenders, and all amounts outstanding pursuant to the credit facility could become immediately payable. Additionally, our exchangeable unsecured notes due 2102 and our convertible senior debentures due 2040, due 2041, and due 2042 have cross-default provisions that could accelerate repayment in the event the indebtedness under the credit facility is accelerated. To remain successful, we must continue to innovate, and our investments in new technologies may not prove successful. Our future operating results are dependent on our ability to continually develop, introduce, and market new and innovative products, to modify existing products, to respond to technological change, and to customize certain products to meet customer requirements. There are numerous risks inherent in this process, including the risks that we will be unable to anticipate the direction of technological change or that we will be unable to develop and market new products and applications in a timely fashion to satisfy customer demands. If this occurs, we could lose customers and experience adverse effects on our financial condition and results of operations. In addition to our own research and development initiatives, we periodically invest in technology start-up enterprises, in which we may acquire a controlling or noncontrolling interest but whose technology would be available to be commercialized by us. There are numerous risks in investments of this nature including the limited operating history of such start-up entities, their need for capital, and their limited or absence of production experience, as well as the risk that their technologies may prove ineffective or fail to gain acceptance in the marketplace. Certain of our historical investments in start-up companies have not succeeded, and there can be no assurance that our current and future investments in start-up enterprises will prove successful.
17

Our results are sensitive to raw material availability, quality, and cost. Many of our products require the use of raw materials that are produced in only a limited number of regions around the world or are available from only a limited number of suppliers. Our results of operations may be materially adversely affected if we have difficulty obtaining these raw materials, the quality of available raw materials deteriorates, or there are significant price increases for these raw materials. The determination that any of the raw materials used in our products are conflict minerals originating from the Democratic Republic of the Congo or adjoining countries could increase the probability that we will encounter the challenges noted above, incur additional expenses to comply with government regulations, and face public scrutiny. For periods in which the prices of these raw materials are rising, we may be unable to pass on the increased cost to our customers, which would result in decreased margins for the products in which they are used. For periods in which the prices are declining, we may be required to write down our inventory carrying cost of these raw materials, because we record our inventory at the lower of cost or market. Depending on the extent of the difference between market price and our carrying cost, this write-down could have a material adverse effect on our results of operations. From time to time there have been short-term market shortages of certain raw materials used in our products. While these shortages have not historically adversely affected our ability to increase production of products containing these materials, they have historically resulted in higher raw material costs for us. We cannot make any assurances that any of these market shortages in the future would not adversely affect our ability to increase production, particularly during periods of growing demand for our products. To assure availability of raw materials in times of shortage, we may enter into long-term supply contracts for these materials, which may prove costly, unnecessary, and burdensome when the shortage abates. We may not have adequate facilities to satisfy future increases in demand for our products. Our business is cyclical and in periods of a rising economy, we may experience intense demand for our products. During such periods, we may have difficulty expanding our manufacturing to satisfy demand. Factors which could limit such expansion include delays in procurement of manufacturing equipment, shortages of skilled personnel, and physical constraints on expansion of our facilities. If we are unable to meet our customers' requirements and our competitors sufficiently expand production, we could lose customers and/or market share. These losses could have an adverse effect on our financial condition and results of operations. Also, capacity that we add during upturns in the business cycle may result in excess capacity during periods when demand for our products recede, resulting in inefficient use of capital which could also adversely affect us. Our ability to compete effectively with other companies depends, in part, on our ability to maintain the proprietary nature of our technology. Protection of intellectual property often involves complex legal and factual issues. We will be able to protect our proprietary rights from unauthorized use by third parties only to the extent that our proprietary technologies are covered by valid and enforceable patents or are effectively maintained as trade secrets. We have applied, and will continue to apply, for patents covering our technologies and products, as we deem appropriate. However, our applications may not result in issued patents. Also, our existing patents and any future patents may not be sufficiently broad to prevent others from practicing our technologies or from developing competing products. Others may independently develop similar or alternative technologies, design around our patented technologies, or may challenge or seek to invalidate our patents. Also, the legal system in certain countries in which we operate may not provide or may not continue to provide sufficient, intellectual property legal protections and remedies. Litigation regarding patent and other intellectual property rights is prevalent in the electronic components industry, particularly the discrete semiconductor sector. We have on occasion been notified that we may be infringing on patent and other intellectual property rights of others. In addition, customers purchasing components from us have rights to indemnification under certain circumstances if such components violate the intellectual property rights of others. Further, we have observed that in the current business environment, electronic component and semiconductor companies have become more aggressive in asserting and defending patent claims against competitors. We will continue to vigorously defend our intellectual property rights, and may become party to disputes regarding patent licensing and cross patent licensing. Although licenses are generally offered in such situations and we have successfully resolved these situations in the past, there can be no assurance that we will not be subject to future litigation alleging intellectual property rights infringement, or that we will be able to obtain licenses on acceptable terms. An unfavorable outcome regarding one of these matters could have a material adverse effect on our business and results of operations. We face intense competition in our business, and we market our products to an increasingly concentrated group of customers. Our business is highly competitive worldwide, with low transportation costs and few import barriers. We compete principally on the bases of product quality and reliability, availability, customer service, technological innovation, timely delivery, and price. The electronic component industry has become increasingly concentrated and globalized in recent years and our major competitors, some of which are larger than us, have significant financial resources and technological capabilities. Our customers have become increasingly concentrated in recent years, and as a result, their buying power has increased and they have had greater ability to negotiate favorable pricing and terms. This trend has adversely affected our average selling prices, particularly for commodity components. Our backlog is subject to customer cancellation. Many of the orders that comprise our backlog may be canceled by our customers without penalty. Our customers may on occasion double and triple order components from multiple sources to ensure timely delivery when demand exceeds global supply. They often cancel orders when business is weak and inventories are excessive, a situation that we experienced during the recent period of economic slowdown. Therefore, we cannot be certain that the amount of our backlog accurately reflects the level of orders that we will ultimately deliver. Our results of operations could be adversely impacted if customers cancel a material portion of orders in our backlog.
18

Future changes in our environmental liability and compliance obligations may harm our ability to operate or increase our costs. Our operations, products and/or product packaging are subject to environmental laws and regulations governing air emissions, wastewater discharges, the handling, disposal and remediation of hazardous substances, wastes and certain chemicals used or generated in our manufacturing processes, employee health and safety labeling or other notifications with respect to the content or other aspects of our processes, products or packaging, restrictions on the use of certain materials in or on design aspects of our products or product packaging, and responsibility for disposal of products or product packaging. We establish reserves for specifically identified potential environmental liabilities. Nevertheless, we have in the past and may in the future inherit certain pre-existing environmental liabilities, generally based on successor liability doctrines, or otherwise incur environmental liabilities. We are involved in remediation programs and related litigation at various current and former properties and at third-party disposal sites both within and outside of the U.S., including involvement as a potentially responsible party at Superfund sites. Although we have never been involved in any environmental matter that has had a material adverse impact on our overall operations, there can be no assurance that in connection with any past or future acquisition, future developments, including related to our remediation programs, or otherwise, we will not be obligated to address environmental matters that could have a material adverse impact on our results of operations. In addition, more stringent environmental regulations may be enacted in the future, and we cannot presently determine the modifications, if any, in our operations that any such future regulations might require, or the cost of compliance with these regulations. In order to resolve liabilities at various sites, we have entered into various administrative orders and consent decrees, some of which may be, under certain conditions, reopened or subject to renegotiation. Our products are sold to or used in goods sold to the U.S. government and other governments. By virtue of such sales, we are subject to various regulatory requirements and risks in the event of non-compliance. We sell products under prime and subprime contracts with the U.S. government and other governments. Many of these products are used in military applications. Government contractors must comply with specific procurement regulations and other requirements. These requirements, although customary in government contracts, impact our performance and compliance costs. Failure to comply with these regulations and requirements could result in contract modifications or termination, and the assessment of penalties and fines, which could negatively impact our results of operations and financial condition. Our failure to comply with these regulations and requirements could also lead to suspension or debarment, for cause, from government contracting or subcontracting for a period of time. Among the causes for debarment are violations of various statutes, including those related to procurement integrity, export control, government security regulations, employment practices, protection of the environment, accuracy of records and the recording of costs, and foreign corruption. The termination of a government contract as a result of any of these acts could have a negative impact on our results of operations and financial condition and could have a negative impact on our reputation and ability to procure other government contracts in the future. We have qualified certain of our products under various military specifications approved and monitored by the United States Defense Electronic Supply Center and under certain European military specifications. These products are assigned certain classification levels. In order to maintain the classification level of a product, we must continuously perform tests on the products and the results of these tests must be reported to governmental agencies. If a product fails to meet the requirements of the applicable classification level, its classification may be reduced to a lower level. A decrease in the classification level for a product with a military application could have an adverse impact on the net revenues and earnings attributable to that product. Our future success is substantially dependent on our ability to attract and retain highly qualified technical, managerial, marketing, finance, and administrative personnel. Rapid changes in technologies, frequent new product introductions, and declining average selling prices over product life cycles require us to attract and retain highly qualified personnel to develop and manufacture products that feature technological innovations and bring them to market on a timely basis. Our complex operations also require us to attract and retain highly qualified administrative personnel in functions such as legal, tax, accounting, financial reporting, auditing, and treasury. The market for personnel with such qualifications is highly competitive. While we have employment agreements with certain of our executives, we have not entered into employment agreements with all of our key personnel. The loss of the services of or the failure to effectively recruit qualified personnel could have a material adverse effect on our business. Interruptions in our information technology systems could adversely affect our business. We rely on the efficient and uninterrupted operation of complex information technology systems and networks to operate our business. Any significant system or network disruption, including, but not limited to, new system implementations, computer viruses, security breaches, facility issues or energy blackouts could have a material adverse impact on our operations and results of operations. Such network disruption could result in a loss of the confidentiality of our intellectual property or the release of sensitive competitive information or customer or employee personal data. Any loss of such information could harm our competitive position, result in a loss of customer confidence, and cause us to incur significant costs to remedy the damages caused by the disruptions or security breaches. We have implemented protective measures to prevent against and limit the effects of system or network disruptions, but there can be no assurance that such measures will be sufficient to prevent or limit the damage from any future disruptions and any such disruption could have a material adverse impact on our business and results of operations. Third-party service providers, such as foundries, subcontractors, distributors, and vendors have access to certain portions of our sensitive data. In the event that these service providers do not properly safeguard our data that they hold, security breaches and loss of our data could result. Any such loss of data by our third-party service providers could have a material adverse impact on our business and results of operations.
19

Risks relating to Vishay's operations outside the United States We are subject to the risks of political, economic, and military instability in countries outside the United States in which we operate. We have substantial operations outside the United States, and approximately 76% of our revenues during 2014 were derived from sales to customers outside the United States. Certain of our assets are located, and certain of our products are produced, in countries which are subject to risks of social, political, economic, and military instability. This instability could result in wars, riots, nationalization of industry, currency fluctuation, and labor unrest. These conditions could have an adverse impact on our ability to operate in these regions and, depending on the extent and severity of these conditions, could materially and adversely affect our overall financial condition, results of operations, and our ability to access our liquidity. Our business has been in operation in Israel for 44 years, where we have substantial manufacturing operations. Although we have never experienced any material interruption in our operations attributable to these factors, in spite of several Middle East crises, including wars, our financial condition and results of operations might be adversely affected if events were to occur in the Middle East that interfered with our operations in Israel. Our global operations are subject to extensive anti-corruption laws and other regulations. The U.S. Foreign Corrupt Practices Act and similar foreign anti-corruption laws generally prohibit companies and their intermediaries from making improper payments or providing anything of value to improperly influence foreign government officials for the purpose of obtaining or retaining business, or obtaining an unfair advantage. Recent years have seen a substantial increase in the global enforcement of anti-corruption laws. Our continued operation and expansion outside the United States, including in developing countries, could increase the risk of such violations or violations under other regulations relating to limitations on or licenses required for sales made to customers located in certain countries. Violations of these laws may result in severe criminal or civil sanctions, could disrupt our business, and result in a material adverse effect on our reputation, business and results of operations or financial condition. We attempt to improve profitability by controlling labor costs, but these activities could result in labor unrest or considerable expense. Historically, our primary labor cost controlling strategy was to transfer manufacturing operations to countries with lower production costs, such as the Czech Republic, Hungary, India, Israel, Malaysia, Mexico, the People's Republic of China, and the Philippines. We believe that our manufacturing footprint is suitable to serve our customers and end markets, while maintaining lower manufacturing costs. Except for the distinct and targeted restructuring programs announced in the fourth fiscal quarter of 2013, we do not anticipate further transferring any significant existing operations to lower-labor-cost countries; however, acquired operations may be transferred to lower-labor-cost countries when integrated into Vishay. Currently, our primary labor cost controlling strategy involves reducing hours and limiting the use of subcontractors and foundries when demand for our products decreases. Shifting operations to lower-labor-cost countries, reducing hours, or limiting the use of subcontractors and foundries could result in production inefficiencies, higher costs, and/or strikes or other types of labor unrest. We are subject to foreign currency exchange rate risks which may impact our results of operations. We are exposed to foreign currency exchange rate risks, particularly due to market values of transactions in currencies other than the functional currencies of certain subsidiaries. From time to time, we utilize forward contracts to hedge a portion of projected cash flows from these exposures. Our significant foreign subsidiaries are located in Germany, Israel, and Asia. We finance our operations in Europe and certain locations in Asia in local currencies. Our operations in Israel and most significant locations in Asia are largely financed in U.S. dollars, but these subsidiaries also have significant transactions in local currencies. Our exposure to foreign currency risk is mitigated to the extent that the costs incurred and the revenues earned in a particular currency offset one another. Our exposure to foreign currency risk is more pronounced in situations where, for example, production labor costs are predominantly paid in local currencies while the sales revenue for those products is denominated in U.S. dollars. This is particularly the case for products produced in Israel, the Czech Republic, and China. A change in the mix of the currencies in which we transact our business could have a material effect on results of operations. Furthermore, the timing of cash receipts and disbursements could have a material effect on our results of operations, particularly if there are significant changes in exchange rates in a short period of time. Approximately 99% of our cash and cash equivalents and short-term investments balances were held by our non-U.S. subsidiaries. We generate a significant amount of cash and profits from our non-U.S. subsidiaries. As of December 31, 2014, $1,100 million of our cash and cash equivalents and short-term investments were held in countries outside of the United States. We expect to fund the quarterly dividend program initiated in February 2014, by, at least in part, repatriating current year income of certain non-U.S. subsidiaries and providing appropriate U.S. federal and state income taxes, incremental foreign income taxes, and withholding taxes payable on that current period non-U.S. income. At the present time, we expect that cash and profits generated by our non-U.S. subsidiaries prior to 2014, and cash generated in 2014 which is not funding the dividend program or the Capella acquisition, will continue to be reinvested outside of the United States indefinitely. Accordingly, no provision has been made for U.S. federal and state income taxes on these foreign earnings. If cash is needed to be repatriated to the United States, in addition to various foreign country laws regulating the exportation of the cash and profits, we would be subject to U.S. income taxes (subject to an adjustment for foreign tax credits), state income taxes, incremental foreign income taxes, and withholding taxes payable to various foreign countries.
20
Risks related to our capital structure The holders of our Class B common stock have effective voting control of our company. We have two classes of common stock: common stock and Class B common stock. The holders of common stock are entitled to one vote for each share held, while the holders of Class B common stock are entitled to 10 votes for each share held. At December 31, 2014, the holders of Class B common stock held approximately 47.3% of the voting power of Vishay. The ownership of Class B common stock is highly concentrated, and holders of Class B common stock effectively can cause the election of directors and approve other actions as stockholders without the approval of our other stockholders. As a result of the passing of our founder and former Executive Chairman, Dr. Felix Zandman, Mrs. Ruta Zandman (a member of our Board of Directors) controls the voting of approximately 89.4% of our Class B common stock and 42.4% of the total voting power of our capital stock as of December 31, 2014. We have a staggered board of directors which could make a takeover of Vishay difficult. Our staggered board of directors might discourage, delay, or prevent a change in control of our company by a third party and could discourage proxy contests and make it more difficult for stockholders to elect directors and take other corporate actions. Also, as a consequence of our staggered board, directors may not be removed without cause, even though a majority of stockholders may wish to do so. Our reluctance to issue substantial additional shares in order not to dilute the interests of our existing stockholders could impede growth. Our overall long-term business strategy has historically included a strong focus on acquisitions financed alternatively through cash on hand, the incurrence of indebtedness, and the issuance of equity, directly or indirectly by refinancing acquisition debt. We may in the future be presented with attractive investment or strategic opportunities that, because of their size and our financial condition at the time, would require the issuance of substantial additional amounts of our common stock. Some or all of our holders of Class B common stock may exert considerable influence over our policies, business and affairs, and in any corporate transaction or other matter, including those described above. If such opportunities were to arise, our Board of Directors may consider the potentially dilutive effect on the interests and voting power of our existing stockholders, including our Class B stockholders. Any resulting reluctance to issue additional shares could impede our future growth. Our outstanding convertible debentures and exchangeable notes may impact the trading price of our common stock. We believe that many investors in, and potential purchasers of, convertible or exchangeable debt instruments employ, or seek to employ, a convertible arbitrage strategy with respect to these instruments. Investors that employ a convertible arbitrage strategy with respect to convertible or exchangeable debt instruments typically implement that strategy by selling short the common stock underlying the convertible or exchangeable instrument and dynamically adjusting their short position while they hold the instrument. The implementation of this strategy by investors in our convertible debentures and exchangeable notes, as well as related market regulatory actions, could have a significant impact on the trading prices of our common stock, and the trading prices and liquidity of our convertible debentures and exchangeable notes. The price of our common stock and our convertible debentures and exchangeable notes could also be affected by possible sales of our common stock by investors who view our convertible debentures or exchangeable notes as more attractive means of equity participation in us.
21

Risks related to the spin-off of the Vishay Precision Group Vishay Precision Group is using the Vishay name under license from us, which could result in product and market confusion or the loss of certain of our rights to the Vishay name. VPG has a worldwide, perpetual and royalty-free license from us to use the "Vishay" mark as part of its corporate name and in connection with the manufacture, sale, and marketing of the products and services that comprise its measurements and foil resistors businesses. The license of the Vishay name to VPG is important because we anticipate that the success of VPG will depend in no small measure on the reputation of the Vishay brand for these products and services built over many years. Nonetheless, there exists the risk that the use by VPG could cause confusion in the marketplace over the products of the two companies, that any negative publicity associated with a product or service of VPG following the spin-off could be mistakenly attributed to our company or that we could lose our own rights to the "Vishay" mark if we fail to impose sufficient controls on VPG's use of the mark. General Economic and Business Risks In addition to the risks relating specifically to our business, a variety of other factors relating to general conditions could cause actual results, performance, or achievements to differ materially from those expressed in any of our forward-looking statements. These factors include:
Our common stock, traded on the New York Stock Exchange, has in the past experienced, and may continue to experience, significant fluctuations in price and volume. We believe that the financial performance and activities of other publicly traded companies in the electronic component industry could cause the price of our common stock to fluctuate substantially without regard to our operating performance. We operate in a continually changing business environment, and new factors emerge from time to time. Other unknown and unpredictable factors also could have a material adverse effect on our future financial condition and results of operations.
None.
22
· overall economic and business conditions;· competitive factors in the industries in which we conduct our business;· changes in governmental regulation;· changes in tax requirements, including tax rate changes, new tax laws, and revised tax law interpretations;· changes in GAAP or interpretations of GAAP by governmental agencies and self-regulatory groups;· interest rate fluctuations, foreign currency rate fluctuations, and other capital market conditions; and· economic and political conditions in international markets, including governmental changes and restrictions on the ability to transfer capital across borders.
Item 1B. UNRESOLVED STAFF COMMENTS

At December 31, 2014, our business had 50 manufacturing locations. Our manufacturing facilities include owned and leased locations. Some locations include both owned and leased facilities in the same location. The list of manufacturing facilities below excludes manufacturing facilities that are presently idle due to our restructuring activities. See Note 4 to our consolidated financial statements for further information related to our restructuring efforts, as well as additional information in "Cost Management" included in Item 7, "Management's Discussion and Analysis of Financial Condition and Results of Operations." In the opinion of management, our properties and equipment generally are in good operating condition and are adequate for our present needs. Owning many of our manufacturing facilities provides us meaningful financial and operating benefits, including long-term stability and a necessary buffer for economic downturns. We do not anticipate difficulty in renewing existing leases as they expire or in finding alternative facilities. The principal locations of our owned manufacturing facilities, along with available space including administrative offices, are as follows:
23
Item 2. PROPERTIES
Owned Locations Business Segment Approx. Available
Space (Square Feet)
United States Santa Clara, CA MOSFETs 227,000Columbus, NE Resistors & Inductors 158,000Yankton, SD Resistors & Inductors 58,000Warwick, RI Resistors & Inductors 55,000Bennington, VT Capacitors 54,000Niagara Falls, NY Resistors & Inductors 38,000Marshall, MN Resistors & Inductors 22,000
Non-U.S. Israel
Dimona Resistors & Inductors and Capacitors 404,000Migdal Ha'Emek Capacitors 288,000Be'er Sheva Resistors & Inductors and Capacitors 276,000
People's Republic of China Tianjin Diodes 374,000Shanghai Optoelectronic Components 195,000Xi'an MOSFETS and Diodes 121,000
Germany Selb Resistors & Inductors and Capacitors 306,000Heide Resistors & Inductors 161,000Landshut Capacitors 72,000Fichtelberg Resistors & Inductors 24,000
Czech Republic Blatna Capacitors 191,000Dolni Rychnov Resistors & Inductors and Capacitors 182,000Prachatice Resistors & Inductors 91,000Volary Resistors & Inductors 35,000
Melaka, Malaysia Optoelectronic Components 480,000Republic of China (Taiwan)
Taipei Diodes 366,000Kaohsiung MOSFETs 52,000
France Nice Resistors & Inductors 215,000Chateau Gontier Resistors & Inductors 84,000Hyeres Resistors & Inductors 65,000
Loni, India Resistors & Inductors and Capacitors 350,000Zwolle, Netherlands Capacitors 283,000Famalicao, Portugal Capacitors 167,000Miharu, Japan Capacitors 163,000Vocklabruck, Austria Diodes 153,000Manila, Philippines Diodes and Optoelectronic Components 144,000Turin, Italy Diodes 127,000Budapest, Hungary Diodes 116,000Juarez, Mexico Resistors & Inductors 57,000
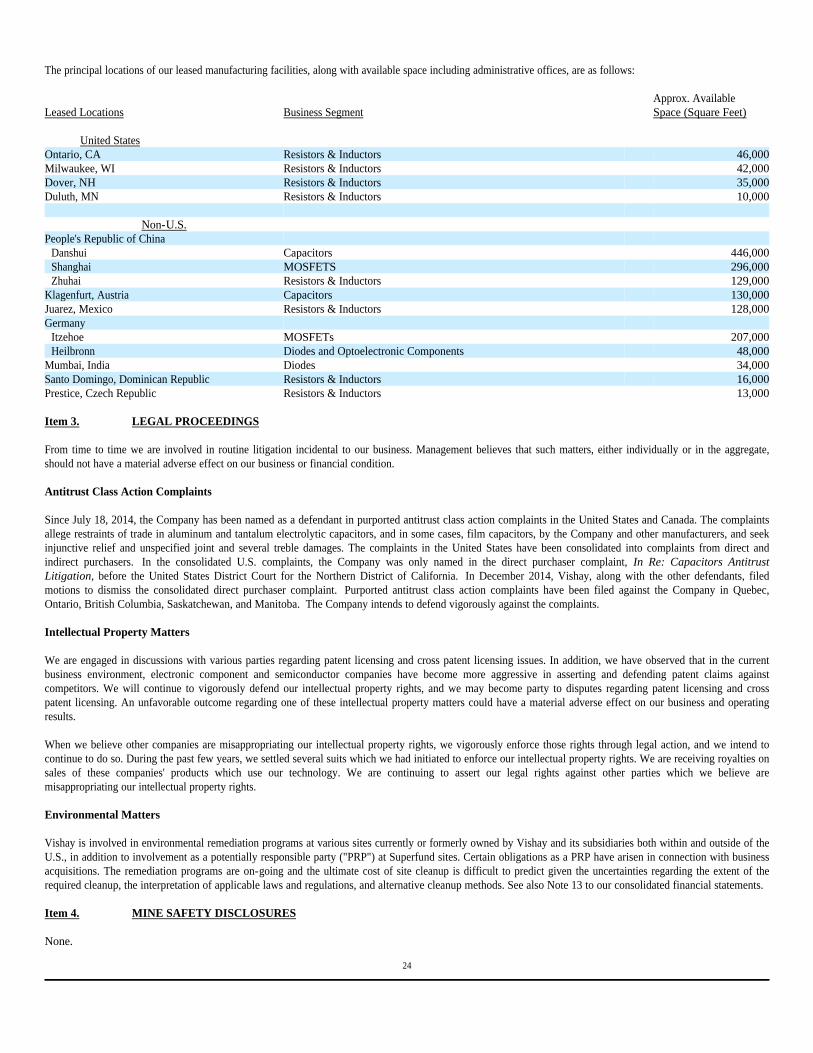
The principal locations of our leased manufacturing facilities, along with available space including administrative offices, are as follows:
From time to time we are involved in routine litigation incidental to our business. Management believes that such matters, either individually or in the aggregate, should not have a material adverse effect on our business or financial condition. Antitrust Class Action Complaints Since July 18, 2014, the Company has been named as a defendant in purported antitrust class action complaints in the United States and Canada. The complaints allege restraints of trade in aluminum and tantalum electrolytic capacitors, and in some cases, film capacitors, by the Company and other manufacturers, and seek injunctive relief and unspecified joint and several treble damages. The complaints in the United States have been consolidated into complaints from direct and indirect purchasers. In the consolidated U.S. complaints, the Company was only named in the direct purchaser complaint, In Re: Capacitors Antitrust Litigation, before the United States District Court for the Northern District of California. In December 2014, Vishay, along with the other defendants, filed motions to dismiss the consolidated direct purchaser complaint. Purported antitrust class action complaints have been filed against the Company in Quebec, Ontario, British Columbia, Saskatchewan, and Manitoba. The Company intends to defend vigorously against the complaints. Intellectual Property Matters We are engaged in discussions with various parties regarding patent licensing and cross patent licensing issues. In addition, we have observed that in the current business environment, electronic component and semiconductor companies have become more aggressive in asserting and defending patent claims against competitors. We will continue to vigorously defend our intellectual property rights, and we may become party to disputes regarding patent licensing and cross patent licensing. An unfavorable outcome regarding one of these intellectual property matters could have a material adverse effect on our business and operating results. When we believe other companies are misappropriating our intellectual property rights, we vigorously enforce those rights through legal action, and we intend to continue to do so. During the past few years, we settled several suits which we had initiated to enforce our intellectual property rights. We are receiving royalties on sales of these companies' products which use our technology. We are continuing to assert our legal rights against other parties which we believe are misappropriating our intellectual property rights. Environmental Matters Vishay is involved in environmental remediation programs at various sites currently or formerly owned by Vishay and its subsidiaries both within and outside of the U.S., in addition to involvement as a potentially responsible party ("PRP") at Superfund sites. Certain obligations as a PRP have arisen in connection with business acquisitions. The remediation programs are on-going and the ultimate cost of site cleanup is difficult to predict given the uncertainties regarding the extent of the required cleanup, the interpretation of applicable laws and regulations, and alternative cleanup methods. See also Note 13 to our consolidated financial statements.
None.
24
Leased Locations Business Segment Approx. Available
Space (Square Feet)
United States Ontario, CA Resistors & Inductors 46,000Milwaukee, WI Resistors & Inductors 42,000Dover, NH Resistors & Inductors 35,000Duluth, MN Resistors & Inductors 10,000
Non-U.S. People's Republic of China
Danshui Capacitors 446,000Shanghai MOSFETS 296,000Zhuhai Resistors & Inductors 129,000
Klagenfurt, Austria Capacitors 130,000Juarez, Mexico Resistors & Inductors 128,000Germany
Itzehoe MOSFETs 207,000Heilbronn Diodes and Optoelectronic Components 48,000
Mumbai, India Diodes 34,000Santo Domingo, Dominican Republic Resistors & Inductors 16,000Prestice, Czech Republic Resistors & Inductors 13,000
Item 3. LEGAL PROCEEDINGS
Item 4. MINE SAFETY DISCLOSURES
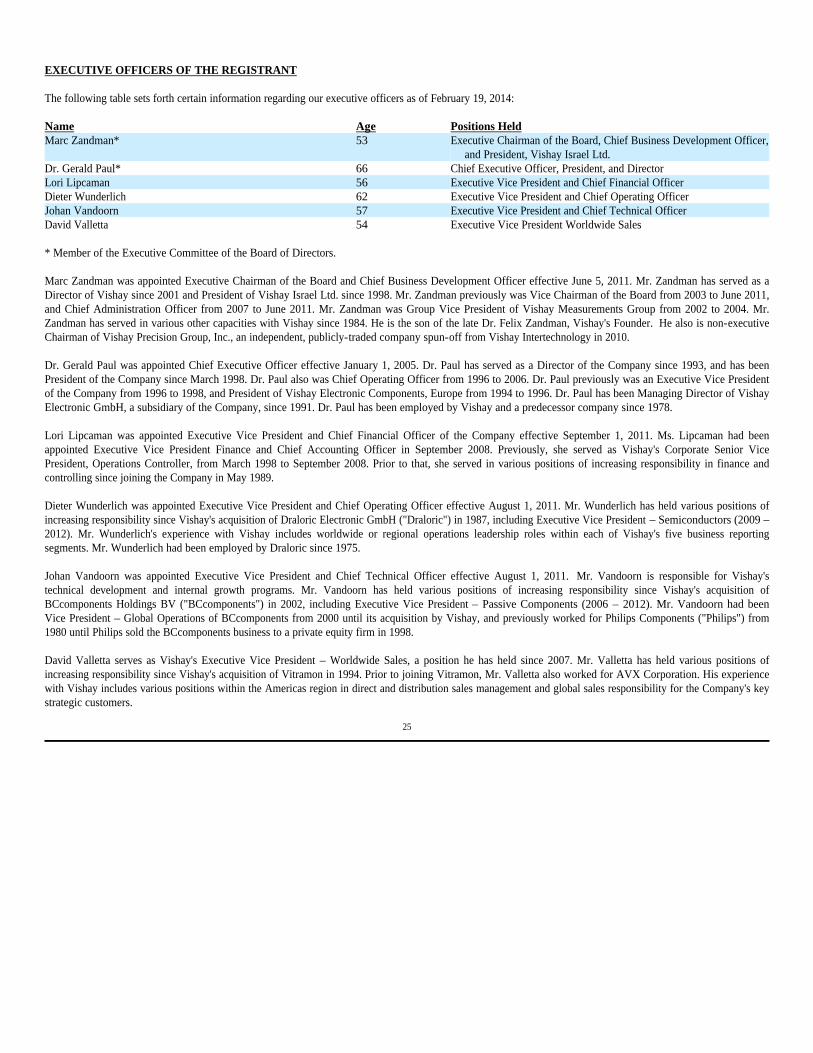
EXECUTIVE OFFICERS OF THE REGISTRANT The following table sets forth certain information regarding our executive officers as of February 19, 2014:
Marc Zandman was appointed Executive Chairman of the Board and Chief Business Development Officer effective June 5, 2011. Mr. Zandman has served as a Director of Vishay since 2001 and President of Vishay Israel Ltd. since 1998. Mr. Zandman previously was Vice Chairman of the Board from 2003 to June 2011, and Chief Administration Officer from 2007 to June 2011. Mr. Zandman was Group Vice President of Vishay Measurements Group from 2002 to 2004. Mr. Zandman has served in various other capacities with Vishay since 1984. He is the son of the late Dr. Felix Zandman, Vishay's Founder. He also is non-executive Chairman of Vishay Precision Group, Inc., an independent, publicly-traded company spun-off from Vishay Intertechnology in 2010. Dr. Gerald Paul was appointed Chief Executive Officer effective January 1, 2005. Dr. Paul has served as a Director of the Company since 1993, and has been President of the Company since March 1998. Dr. Paul also was Chief Operating Officer from 1996 to 2006. Dr. Paul previously was an Executive Vice President of the Company from 1996 to 1998, and President of Vishay Electronic Components, Europe from 1994 to 1996. Dr. Paul has been Managing Director of Vishay Electronic GmbH, a subsidiary of the Company, since 1991. Dr. Paul has been employed by Vishay and a predecessor company since 1978. Lori Lipcaman was appointed Executive Vice President and Chief Financial Officer of the Company effective September 1, 2011. Ms. Lipcaman had been appointed Executive Vice President Finance and Chief Accounting Officer in September 2008. Previously, she served as Vishay's Corporate Senior Vice President, Operations Controller, from March 1998 to September 2008. Prior to that, she served in various positions of increasing responsibility in finance and controlling since joining the Company in May 1989. Dieter Wunderlich was appointed Executive Vice President and Chief Operating Officer effective August 1, 2011. Mr. Wunderlich has held various positions of increasing responsibility since Vishay's acquisition of Draloric Electronic GmbH ("Draloric") in 1987, including Executive Vice President – Semiconductors (2009 – 2012). Mr. Wunderlich's experience with Vishay includes worldwide or regional operations leadership roles within each of Vishay's five business reporting segments. Mr. Wunderlich had been employed by Draloric since 1975. Johan Vandoorn was appointed Executive Vice President and Chief Technical Officer effective August 1, 2011. Mr. Vandoorn is responsible for Vishay's technical development and internal growth programs. Mr. Vandoorn has held various positions of increasing responsibility since Vishay's acquisition of BCcomponents Holdings BV ("BCcomponents") in 2002, including Executive Vice President – Passive Components (2006 – 2012). Mr. Vandoorn had been Vice President – Global Operations of BCcomponents from 2000 until its acquisition by Vishay, and previously worked for Philips Components ("Philips") from 1980 until Philips sold the BCcomponents business to a private equity firm in 1998. David Valletta serves as Vishay's Executive Vice President – Worldwide Sales, a position he has held since 2007. Mr. Valletta has held various positions of increasing responsibility since Vishay's acquisition of Vitramon in 1994. Prior to joining Vitramon, Mr. Valletta also worked for AVX Corporation. His experience with Vishay includes various positions within the Americas region in direct and distribution sales management and global sales responsibility for the Company's key strategic customers.
25
Name Age Positions Held Marc Zandman* 53 Executive Chairman of the Board, Chief Business Development Officer,
and President, Vishay Israel Ltd. Dr. Gerald Paul* 66 Chief Executive Officer, President, and Director Lori Lipcaman 56 Executive Vice President and Chief Financial Officer Dieter Wunderlich 62 Executive Vice President and Chief Operating Officer Johan Vandoorn 57 Executive Vice President and Chief Technical Officer David Valletta 54 Executive Vice President Worldwide Sales * Member of the Executive Committee of the Board of Directors.

PART II
Our common stock is listed on the New York Stock Exchange under the symbol VSH. The following table sets forth the high and low sales prices for our common stock as reported on the New York Stock Exchange composite tape for the indicated fiscal quarters. Holders of record of our common stock totaled approximately 1,000 at February 16, 2015. Because many of the shares of our common stock are held by brokers and other institutions on behalf of stockholders, we are unable to estimate the total number of beneficial owners represented by these stockholders of record. The following table sets forth, for the indicated periods, the high and low sales prices of our common stock.
At February 16, 2015, we had outstanding 12,129,227 shares of Class B common stock, par value $.10 per share, each of which entitles the holder to ten votes. The Class B common stock generally is not transferable except in certain very limited instances, and there is no market for those shares. The Class B common stock is convertible, at the option of the holder, into common stock on a share for share basis. As a result of the passing of our founder and former Executive Chairman, Dr. Felix Zandman, Mrs. Ruta Zandman (a member of our Board of Directors) controls the voting of approximately 89.4% of our Class B common stock and 42.4% of the total voting power of our capital stock. Dividends On February 3, 2014, the Company's Board of Directors instituted a quarterly cash dividend program and declared the first cash dividend in the history of Vishay. Cash dividends of $0.06 per share of common stock and Class B common stock were paid on March 27, 2014, June 26, 2014, September 18, 2014, and December 16, 2014 to stockholders of record at the close of business on March 3, 2014, June 12, 2014, August 28, 2014, and November 26, 2014, respectively. We expect to continue to pay quarterly dividends, although the amount and timing of any future dividends remains subject to authorization of our Board of Directors. The following table summarizes the quarterly cash dividends declared (in thousands):
Certain of our debt obligations contain restrictions as to the payment of cash dividends. See "Financial Condition, Liquidity, and Capital Resources" included in Item 7, "Management's Discussion and Analysis of Financial Condition and Results of Operations."
26
Item 5. MARKET FOR REGISTRANT'S COMMON EQUITY, RELATED STOCKHOLDER MATTERS, AND ISSUER
PURCHASES OF EQUITY SECURITIES
2014 2013 High Low High Low Fourth quarter $ 14.85 $ 12.37 Fourth quarter $ 13.55 $ 11.98 Third quarter $ 16.34 $ 14.30 Third quarter $ 15.39 $ 11.93 Second quarter $ 15.61 $ 13.98 Second quarter $ 15.14 $ 11.54 First quarter $ 15.44 $ 12.90 First quarter $ 13.98 $ 10.19
Fiscal Period Amount Month of Payment Three fiscal months ended March 29, 2014 $ 8,847 March Three fiscal months ended June 28, 2014 8,847 June Three fiscal months ended September 27, 2014 8,847 September Three fiscal months ended December 31, 2014 8,847 December
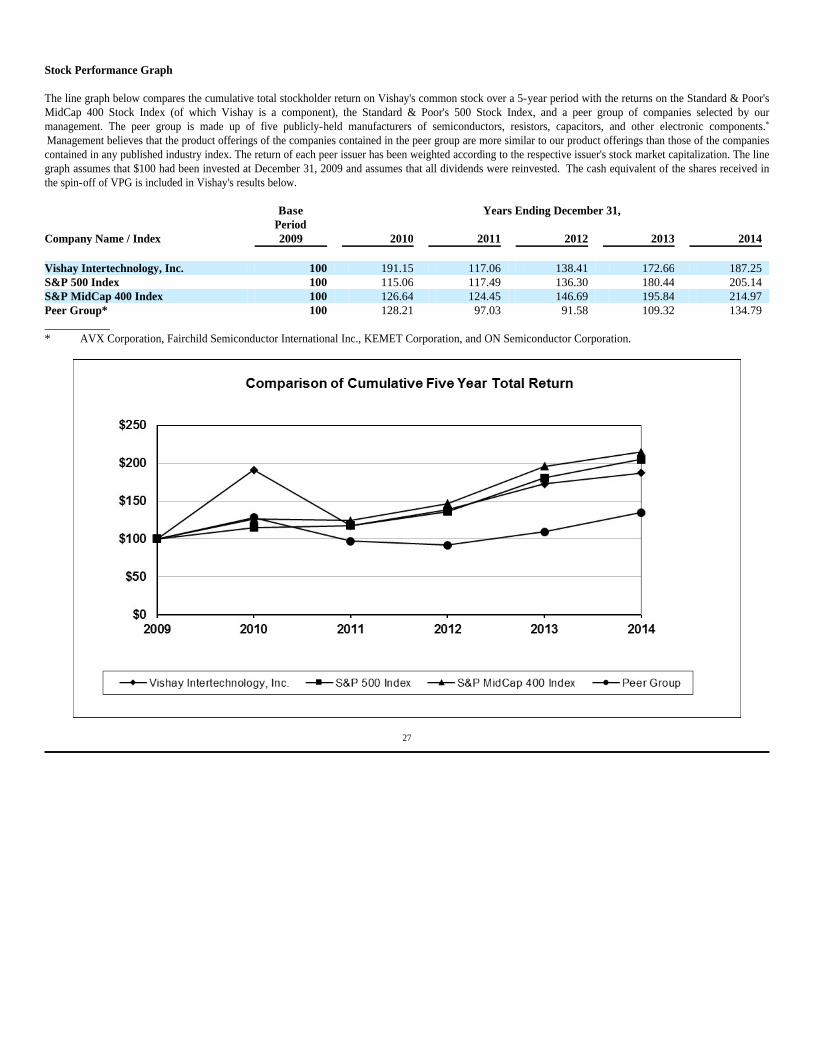
Stock Performance Graph The line graph below compares the cumulative total stockholder return on Vishay's common stock over a 5-year period with the returns on the Standard & Poor's MidCap 400 Stock Index (of which Vishay is a component), the Standard & Poor's 500 Stock Index, and a peer group of companies selected by our management. The peer group is made up of five publicly-held manufacturers of semiconductors, resistors, capacitors, and other electronic components.*
Management believes that the product offerings of the companies contained in the peer group are more similar to our product offerings than those of the companies contained in any published industry index. The return of each peer issuer has been weighted according to the respective issuer's stock market capitalization. The line graph assumes that $100 had been invested at December 31, 2009 and assumes that all dividends were reinvested. The cash equivalent of the shares received in the spin-off of VPG is included in Vishay's results below.
___________
27
Base Years Ending December 31, Period Company Name / Index 2009 2010 2011 2012 2013 2014 Vishay Intertechnology, Inc. 100 191.15 117.06 138.41 172.66 187.25 S&P 500 Index 100 115.06 117.49 136.30 180.44 205.14 S&P MidCap 400 Index 100 126.64 124.45 146.69 195.84 214.97 Peer Group* 100 128.21 97.03 91.58 109.32 134.79
* AVX Corporation, Fairchild Semiconductor International Inc., KEMET Corporation, and ON Semiconductor Corporation.

The following table sets forth selected consolidated financial information as of and for the fiscal years ended December 31, 2014, 2013, 2012, 2011, and 2010. This table should be read in conjunction with our consolidated financial statements and the related notes thereto included elsewhere in this Form 10-K (in thousands, except per share amounts):
_________________________________________________________
28
Item 6. SELECTED FINANCIAL DATA
As of and for the years ended December 31, 2014 (1) 2013 (2) 2012 (3) 2011 (4) 2010 (5) Statement of Operations Data: Net revenues $ 2,493,282 $ 2,370,979 $ 2,230,097 $ 2,594,029 $ 2,725,092 Costs of products sold 1,881,990 1,803,719 1,703,424 1,874,043 1,917,607 Gross profit 611,292 567,260 526,673 719,986 807,485 Selling, general, and administrative expenses 385,696 368,542 349,625 367,623 389,547 Restructuring and severance costs 20,897 2,814 - - - U.S. pension settlement charges 15,588 - - - - Executive compensation charges (credit) - (1,778) - 5,762 - Gain on sale of property - - (12,153) - - Operating income 189,111 197,682 189,201 346,601 417,938 Other income (expense)
Interest expense (24,457) (23,130) (22,604) (19,277) (11,036) Other 2,489 1,853 3,440 3,792 (1,369)
Total other income (expense) (21,968) (21,277) (19,164) (15,485) (12,405) Income before taxes and noncontrolling interest 167,143 176,405 170,037 331,116 405,533 Income taxes 49,300 52,636 46,506 91,119 45,240 Net earnings 117,843 123,769 123,531 239,997 360,293 Noncontrolling interest 214 789 793 1,176 1,187 Net earnings attributable to Vishay stockholders $ 117,629 $ 122,980 $ 122,738 $ 238,821 $ 359,106
Basic earnings per share attributable to Vishay stockholders: $ 0.80 $ 0.85 $ 0.82 $ 1.49 $ 1.96 Diluted earnings per share attributable to Vishay stockholders: $ 0.77 $ 0.81 $ 0.79 $ 1.42 $ 1.89 Weighted average shares outstanding – basic 147,567 144,963 149,117 160,094 183,618 Weighted average shares outstanding – diluted 153,716 151,417 155,844 168,514 190,227 Cash dividends per share $ 0.24 $ - $ - $ - $ - Balance Sheet Data: Total assets $ 3,298,773 $ 3,237,139 $ 3,016,277 $ 2,993,730 $ 2,966,093 Long-term debt, less current portion 454,922 364,911 392,931 399,054 431,682 Working capital 1,469,711 1,531,615 1,379,093 1,390,888 1,267,343 Total Vishay stockholders' equity 1,825,366 1,872,756 1,623,328 1,603,006 1,491,731

(1) Includes the results of Holy Stone Polytech, from June 11, 2014, and the results of Capella from September 1, 2014, including the noncontrolling interest for
the period before full control was obtained. Also includes $20,897,000 of restructuring and severance costs, $15,588,000 of U.S. pension plan non-cash settlement charges, and a $1,228,000 one-time tax benefit related to tax law changes. These items, net of their tax consequences, had a negative $0.15 effect on earnings per share attributable to Vishay stockholders. These items are more fully described in the notes to the consolidated financial statements.
(2) Includes the results of MCB Industrie, from June 13, 2013. Also includes a net pretax reversal of stock-based compensation expense recognized for the performance-based RSUs scheduled to vest on January 1, 2014, which were originally reported as a separate line item upon the cessation of employment of certain former executive officers in 2011 of $1,778,000, a $2,867,000 one-time tax benefit due to a new law enacted in Israel in July 2013 which effectively increases the corporate income tax rate on certain types of income earned after January 1, 2014, and, therefore, increases our deferred tax assets, and a $1,330,000 one-time tax benefit due to the retroactive enactment of the American Taxpayer Relief Act of 2012 that was signed into law on January 2, 2013, partially offset by $2,814,000 of restructuring and severance costs. These items, net of their related tax consequences, had a positive $0.02 effect on earnings per share attributable to Vishay stockholders. These items are more fully described in the notes to the consolidated financial statements.
(3) Includes the results of HiRel Systems LLC from January 13, 2012. Also includes net pretax gain on the sale of property in Belgium vacated as a result of restructuring in prior years of $12,153,000 and a $4,036,000 one-time tax benefit related to the release of deferred tax valuation allowances in Israel following a merger of several of our wholly-owned subsidiaries in Israel which will allow for the realization of these tax benefits. These items, net of their related tax consequences, had a positive $0.08 effect on earnings per share attributable to Vishay stockholders. These items are more fully described in the notes to the consolidated financial statements.
Management believes that stating the impact on net earnings of items such as businesses that have been spun off, restructuring and severance costs, material pension settlement charges, executive compensation charges (credits), material gains and losses on sales of property, special tax items, and other items is meaningful to investors because it provides insight with respect to intrinsic operating results of the Company.
29
(4) Includes the results of the resistor businesses of Huntington Electric from September 28, 2011. Also includes net pretax charges of $5,762,000 to accelerate the recognition of certain executive compensation expenses upon the passing of our founder and former Executive Chairman of the Board, Dr. Zandman, and for elements of executive compensation payable upon the resignation of our former Chief Financial Officer, Dr. Lior Yahalomi. Also includes $10,024,000 of one-time tax expense related to the write-down of deferred tax assets in Israel to reflect the lower corporate income tax rate enacted in January 2011 on certain types of income earned after December 31, 2010 and $6,538,000 of one-time tax benefits recorded in the fourth fiscal quarter primarily related to the release of deferred tax valuation allowances in various jurisdictions. These items, net of their related tax consequences, had a negative $0.04 effect on earnings per share attributable to Vishay stockholders.
(5) Includes the results of operations of VPG through the date of the spin-off, July 6, 2010. VPG contributed $101,089,000 of net revenues, $9,716,000 of income before taxes, $5,811,000 of net earnings attributable to Vishay stockholders, and $0.03 per diluted share attributable to Vishay stockholders to our results in 2010. Also includes a $59,484,000 one-time tax benefit recorded in the fourth fiscal quarter of 2010, which had a $0.31 effect on earnings per share attributable to Vishay stockholders.

Overview Vishay Intertechnology, Inc. is a global manufacturer and supplier of semiconductors and passive components, including power MOSFETs, power integrated circuits, transistors, diodes, optoelectronic components, resistors, capacitors, and inductors. Discrete semiconductors and passive components manufactured by Vishay are used in virtually all types of electronic products, including those in the industrial, computing, automotive, consumer electronic products, telecommunications, power supplies, military/aerospace, and medical industries. We operate in five product segments, MOSFETs, Diodes, Optoelectronic Components, Resistors & Inductors, and Capacitors. Since 1985, we have pursued a business strategy of growth through focused research and development and acquisitions. Through this strategy, we have grown to become one of the world's largest manufacturers of discrete semiconductors and passive components. We expect to continue our strategy of acquisitions while also maintaining a prudent capital structure. We are focused on enhancing stockholder value and improving earnings per share. In addition to our growth plan, we also have opportunistically repurchased our stock. We have repurchased 44.3 million shares of our common stock since the fourth fiscal quarter of 2010, representing 24% of our shares outstanding before we began this initiative. The exchange of $56.4 million principal amount of our exchangeable unsecured notes by a holder of the notes in the third fiscal quarter of 2013 increased the number of our common shares outstanding by 3.7 million, but did not affect the number of weighted average shares outstanding used for computing diluted earnings per share because our earnings per share computation assumes that the exchangeable unsecured notes would be converted. On February 3, 2014, our Board of Directors instituted a quarterly dividend payment program and declared the first cash dividend in the history of Vishay. The permitted capacity to repurchase shares of stock or pay cash dividends under our credit facility increases each quarter by an amount equal to 20% of net income. At December 31, 2014, our total permitted capacity to repurchase shares of stock or pay dividends under our credit facility is $192.7 million. Although we have no current plans, we will continue to evaluate attractive stock repurchase opportunities. Our business and operating results have been and will continue to be impacted by worldwide economic conditions. Our revenues are dependent on end markets that are impacted by consumer and industrial demand, and our operating results can be adversely affected by reduced demand in those global markets. We continue to monitor the current economic environment and its potential effects on our customers and the end markets that we serve. Additionally, we continue to closely monitor our costs, inventory, and capital resources to respond to changing conditions and to ensure we have the management, business processes, and resources to meet our future needs. In response to the economic environment, we began implementing a targeted cost reduction program in the fourth fiscal quarter of 2013 to support our profitability without jeopardizing our growth plan. Complete implementation of the targeted cost reduction programs is expected to occur before the end of the first fiscal quarter of 2016. See additional information regarding our competitive strengths and key challenges as disclosed in Part 1. On July 11, 2014, we entered into an agreement to acquire Capella Microsystems (Taiwan) Inc. ("Capella") for approximately NT$6,051 million or $205 million at then-current exchange rates. Capella is a fabless IC design company specializing in optoelectronic sensors. As a first step in the acquisition, we launched a tender offer for Capella's oustanding shares. A total of 38,703,705 shares of Capella, or 88.95% of outstanding shares, were tendered and accepted by us. The offer period expired on September 1, 2014. Pursuant to the terms of the tender offer, we paid NT$139 for each share tendered. The aggregate purchase price for the tendered shares was NT$5,400 million, or approximately $180 million. We acquired the remaining outstanding shares of Capella pursuant to the merger agreement on December 31, 2014. Each remaining stockholder received the same NT$139 per share as merger consideration. The acquisition is expected to strengthen our position in optoelectronic sensors, a promising growth market. (See further discussion in "Acquisition Activity.") During the third fiscal quarter of 2014, we executed two partial-settlement transactions to reduce the risk associated with our U.S. qualified pension obligations. As a result of these transactions, the projected benefit obligation, plan assets, and funded status were remeasured on the dates of the respective settlements. These transactions reduced the U.S. projected benefit obligation by approximately $59.4 million, and were funded entirely with plan assets. These transactions also resulted in the recognition of non-cash settlement charges aggregating $15.6 million, representing previously unrecognized actuarial items. These non-cash charges are presented on a separate line in the accompanying consolidated statements of operations. We continue to evaluate options to further reduce the risk associated with our pension obligations. We utilize several financial metrics, including net revenues, gross profit margin, segment operating income, end-of-period backlog, book-to-bill ratio, inventory turnover, change in average selling prices, net cash and short-term investments (debt), and free cash generation to evaluate the performance and assess the future direction of our business. (See further discussion in "Financial Metrics" and "Financial Condition, Liquidity, and Capital Resources.") Net revenues decreased in the fourth fiscal quarter of 2014 versus the prior quarter and prior year quarter. Net revenues for 2014 increased versus 2013 and operating results are close to our expectations at this relatively low revenue level. A decrease in orders in the latter part of 2014 resulted in a decrease in many key financial metrics compared to the prior quarters.
30
Item 7. MANAGEMENT'S DISCUSSION AND ANALYSIS OF FINANCIAL CONDITION AND RESULTS OF OPERATIONS

Net revenues for the year ended December 31, 2014 were $2.493 billion, compared to net revenues of $2.371 billion and $2.230 billion for the years ended December 31, 2013 and 2012, respectively. The net earnings attributable to Vishay stockholders for the year ended December 31, 2014 were $117.6 million, or $0.77 per diluted share, compared to net earnings attributable to Vishay stockholders of $123.0 million, or $0.81 per diluted share, and $122.7 million, or $0.79 per diluted share, for the years ended December 31, 2013 and 2012, respectively. The results of operations for the years ended December 31, 2014, 2013, and 2012 include items affecting comparability as listed in the reconciliation below. The reconciliation below includes certain financial measures which are not recognized in accordance with GAAP, including adjusted net earnings and adjusted earnings per share. These non-GAAP measures should not be viewed as an alternative to GAAP measures of performance. Non-GAAP measures such as adjusted net earnings and adjusted earnings per share do not have uniform definitions. These measures, as calculated by Vishay, may not be comparable to similarly titled measures used by other companies. Management believes that these measures are meaningful because they provide insight with respect to our intrinsic operating results. Reconciling items to arrive at adjusted net earnings represent significant charges or credits that are important to understanding our intrinsic operations. The items affecting comparability are (in thousands, except per share amounts):
* Includes add-back of interest on exchangeable notes in periods where the notes are dilutive. Our results for 2012 - 2014 demonstrate our ability to react quickly to changing economic environments, successfully implement cost reduction measures when necessary to sustain earnings, and organically grow our business. Despite revenues below our expected run-rate, our pre-tax results were as we would expect based on our business model.
31
Years ended December 31, 2014 2013 2012 GAAP net earnings attributable to Vishay stockholders $ 117,629 $ 122,980 $ 122,738 Reconciling items affecting operating margin: Restructuring and severance costs $ 20,897 $ 2,814 $ - U.S. pension settlement charges 15,588 - - Executive compensation charges (credit) - (1,778) - Gain on sale of property - - (12,153) Reconciling items affecting tax expense (benefit): Tax effects of items above and other one-time tax expense (benefit) $ (12,846) $ (4,552) $ 95 Adjusted net earnings $ 141,268 $ 119,464 $ 110,680
Adjusted weighted average diluted shares outstanding 153,716 151,417 155,844 Adjusted earnings per diluted share * $ 0.92 $ 0.79 $ 0.71

Financial Metrics We utilize several financial metrics to evaluate the performance and assess the future direction of our business. These key financial measures and metrics include net revenues, gross profit margin, operating margin, segment operating income, end-of-period backlog, and the book-to-bill ratio. We also monitor changes in inventory turnover and average selling prices ("ASP"). Gross profit margin is computed as gross profit as a percentage of net revenues. Gross profit is generally net revenues less costs of products sold, but also deducts certain other period costs, particularly losses on purchase commitments and inventory write-downs. Losses on purchase commitments and inventory write-downs have the impact of reducing gross profit margin in the period of the charge, but result in improved gross profit margins in subsequent periods by reducing costs of products sold as inventory is used. Gross profit margin is clearly a function of net revenues, but also reflects our cost management programs and our ability to contain fixed costs. Operating margin is computed as gross profit less operating expenses as a percentage of net revenues. We evaluate business segment performance on segment operating margin. Only dedicated, direct selling, general, and administrative expenses of the segments are included in the calculation of segment operating income. Segment operating margin is computed as operating income less items such as restructuring and severance costs, asset write-downs, goodwill and indefinite-lived intangible asset impairments, inventory write-downs, gain or losses on purchase commitments, global operations, sales and marketing, information systems, finance and administrative groups, and other items, expressed as a percentage of net revenues. We believe that evaluating segment performance excluding such items is meaningful because it provides insight with respect to intrinsic operating results of the segment. Operating margin is clearly a function of net revenues, but also reflects our cost management programs and our ability to contain fixed costs. End-of-period backlog is one indicator of future revenues. We include in our backlog only open orders that we expect to ship in the next twelve months. If demand falls below customers' forecasts, or if customers do not control their inventory effectively, they may cancel or reschedule the shipments that are included in our backlog, in many instances without the payment of any penalty. Therefore, the backlog is not necessarily indicative of the results to be expected for future periods. An important indicator of demand in our industry is the book-to-bill ratio, which is the ratio of the amount of product ordered during a period as compared with the product that we ship during that period. A book-to-bill ratio that is greater than one indicates that our backlog is building and that we are likely to see increasing revenues in future periods. Conversely, a book-to-bill ratio that is less than one is an indicator of declining demand and may foretell declining revenues. We focus on our inventory turnover as a measure of how well we are managing our inventory. We define inventory turnover for a financial reporting period as our costs of products sold for the four fiscal quarters ending on the last day of the reporting period divided by our average inventory (computed using each fiscal quarter-end balance) for this same period. A higher level of inventory turnover reflects more efficient use of our capital. Pricing in our industry can be volatile. We analyze trends and changes in average selling prices to evaluate likely future pricing. The erosion of average selling prices of established products is typical for semiconductor products. We attempt to offset this deterioration with ongoing cost reduction activities and new product introductions. Our specialty passive components are more resistant to average selling price erosion.
32
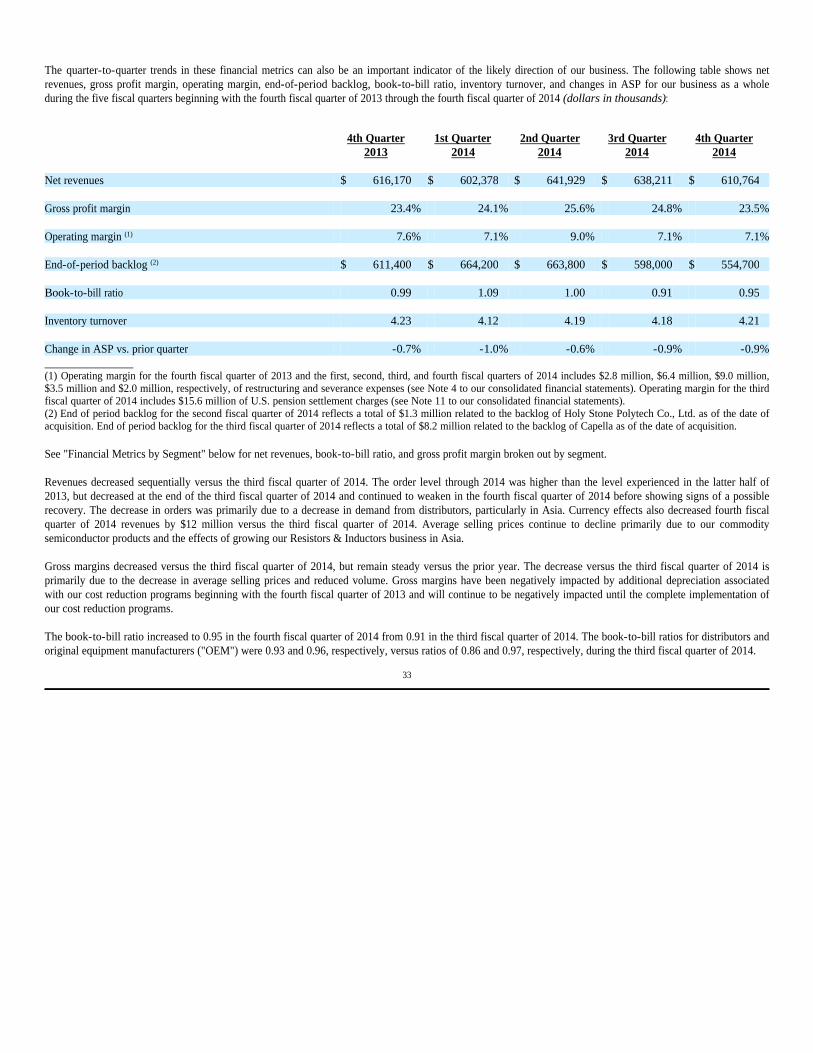
The quarter-to-quarter trends in these financial metrics can also be an important indicator of the likely direction of our business. The following table shows net revenues, gross profit margin, operating margin, end-of-period backlog, book-to-bill ratio, inventory turnover, and changes in ASP for our business as a whole during the five fiscal quarters beginning with the fourth fiscal quarter of 2013 through the fourth fiscal quarter of 2014 (dollars in thousands):
_______________ (1) Operating margin for the fourth fiscal quarter of 2013 and the first, second, third, and fourth fiscal quarters of 2014 includes $2.8 million, $6.4 million, $9.0 million, $3.5 million and $2.0 million, respectively, of restructuring and severance expenses (see Note 4 to our consolidated financial statements). Operating margin for the third fiscal quarter of 2014 includes $15.6 million of U.S. pension settlement charges (see Note 11 to our consolidated financial statements). (2) End of period backlog for the second fiscal quarter of 2014 reflects a total of $1.3 million related to the backlog of Holy Stone Polytech Co., Ltd. as of the date of acquisition. End of period backlog for the third fiscal quarter of 2014 reflects a total of $8.2 million related to the backlog of Capella as of the date of acquisition. See "Financial Metrics by Segment" below for net revenues, book-to-bill ratio, and gross profit margin broken out by segment. Revenues decreased sequentially versus the third fiscal quarter of 2014. The order level through 2014 was higher than the level experienced in the latter half of 2013, but decreased at the end of the third fiscal quarter of 2014 and continued to weaken in the fourth fiscal quarter of 2014 before showing signs of a possible recovery. The decrease in orders was primarily due to a decrease in demand from distributors, particularly in Asia. Currency effects also decreased fourth fiscal quarter of 2014 revenues by $12 million versus the third fiscal quarter of 2014. Average selling prices continue to decline primarily due to our commodity semiconductor products and the effects of growing our Resistors & Inductors business in Asia. Gross margins decreased versus the third fiscal quarter of 2014, but remain steady versus the prior year. The decrease versus the third fiscal quarter of 2014 is primarily due to the decrease in average selling prices and reduced volume. Gross margins have been negatively impacted by additional depreciation associated with our cost reduction programs beginning with the fourth fiscal quarter of 2013 and will continue to be negatively impacted until the complete implementation of our cost reduction programs. The book-to-bill ratio increased to 0.95 in the fourth fiscal quarter of 2014 from 0.91 in the third fiscal quarter of 2014. The book-to-bill ratios for distributors and original equipment manufacturers ("OEM") were 0.93 and 0.96, respectively, versus ratios of 0.86 and 0.97, respectively, during the third fiscal quarter of 2014.
33
4th Quarter
2013 1st Quarter
2014 2nd Quarter
2014 3rd Quarter
2014 4th Quarter
2014 Net revenues $ 616,170 $ 602,378 $ 641,929 $ 638,211 $ 610,764 Gross profit margin 23.4% 24.1% 25.6% 24.8% 23.5% Operating margin (1) 7.6% 7.1% 9.0% 7.1% 7.1% End-of-period backlog (2) $ 611,400 $ 664,200 $ 663,800 $ 598,000 $ 554,700 Book-to-bill ratio 0.99 1.09 1.00 0.91 0.95 Inventory turnover 4.23 4.12 4.19 4.18 4.21 Change in ASP vs. prior quarter -0.7% -1.0% -0.6% -0.9% -0.9%

Financial Metrics by Segment The following table shows net revenues, book-to-bill ratio, gross profit margin, and segment operating margin broken out by segment for the five fiscal quarters beginning with the fourth fiscal quarter of 2013 through the fourth fiscal quarter of 2014 (dollars in thousands):
__________
34
4th Quarter 2013
1st Quarter 2014
2nd Quarter 2014
3rd Quarter 2014
4th Quarter 2014
MOSFETs Net revenues $ 117,858 $ 113,141 $ 124,042 $ 121,659 $ 111,695 Book-to-bill ratio 0.96 1.13 1.05 0.83 0.95 Gross profit margin 12.1% 11.2% 15.2% 14.3% 9.6% Segment operating margin 4.5% 2.2% 7.7% 6.4% 1.2% Diodes Net revenues $ 140,739 $ 136,929 $ 149,571 $ 151,444 $ 141,344 Book-to-bill ratio 0.98 1.09 1.07 0.89 0.83 Gross profit margin 21.4% 21.7% 23.2% 23.9% 22.2% Segment operating margin 16.8% 16.8% 18.8% 19.6% 17.8% Optoelectronic Components Net revenues $ 56,775 $ 57,498 $ 63,258 $ 67,549 $ 69,943 Book-to-bill ratio 1.05 1.16 1.04 0.96 0.99 Gross profit margin 31.1% 36.9% 36.0% 36.4% 32.2% Segment operating margin 24.7% 30.3% 29.9% 30.5% 23.7% Resistors & Inductors Net revenues $ 190,874 $ 189,299 $ 193,314 $ 190,454 $ 186,549 Book-to-bill ratio 0.95 1.04 0.98 0.98 1.02 Gross profit margin 31.9% 31.8% 31.8% 31.3% 32.2% Segment operating margin 27.1% 26.6% 26.9% 26.4% 27.3% Capacitors Net revenues $ 109,924 $ 105,511 $ 111,744 $ 107,105 $ 101,233 Book-to-bill ratio 1.07 1.09 0.88 0.90 0.94 Gross profit margin 19.6% 20.4% 23.6% 19.3% 18.9% Segment operating margin 14.2% 14.5% 18.0% 13.5% 12.7%
Acquisition and Divestiture Activity As part of our growth strategy, we seek to expand through targeted acquisitions of other manufacturers of electronic components that have established positions in major markets, reputations for product quality and reliability, and product lines with which we have substantial marketing and technical expertise. This includes exploring opportunities to acquire targets to gain market share, penetrate different geographic markets, enhance new product development, round out our existing product lines, or grow our high margin niche market businesses. Acquisitions of passive components businesses would likely be made to strengthen and broaden our position as a specialty product supplier; acquisitions of discrete semiconductor businesses would be made to increase market share and to generate synergies. To limit our financial exposure, we have implemented a policy not to pursue acquisitions if our post-acquisition debt would exceed 2.5x our pro forma earnings before interest, taxes, depreciation, and amortization ("EBITDA"). For these purposes, we calculate pro forma EBITDA as the adjusted EBITDA of Vishay and the target for Vishay's four preceding fiscal quarters, with a pro forma adjustment for savings which management estimates would have been achieved had the target been acquired by Vishay at the beginning of the four fiscal quarter period. Our growth plan targets adding, through acquisitions, an average of approximately $100 million of revenues per year. Depending on the opportunities available, we might make several smaller acquisitions or a few larger acquisitions. We intend to make such acquisitions using mainly cash, rather than debt or equity, although we do have capacity under our revolving credit facility if necessary. We are not currently targeting acquisitions with a purchase price larger than $500 million. There is no assurance that we will be able to identify and acquire additional suitable acquisition candidates at price levels and on terms and conditions we consider acceptable. 2014 Activities On June 11, 2014, we acquired Holy Stone Polytech Co., Ltd. ("Holy Stone Polytech" or "Vishay Polytech Co. Ltd."), a Japanese manufacturer of tantalum capacitors and formerly a subsidiary of Holy Stone Enterprise Co. Ltd., for $20.6 million, net of cash acquired. The acquisition is expected to strengthen our position in tantalum capacitors, especially in Asia. For financial reporting purposes, the results and operations of Holy Stone Polytech have been included in the Capacitors segment since June 11, 2014. On July 11, 2014, we entered into an agreement to acquire Capella for approximately NT$6,051 million or $205 million at then-current exchange rates. Capella is a fabless IC design company specializing in optoelectronic sensors that was publicly traded in Taiwan. As a first step in the acquisition, we launched a tender offer for Capella's outstanding shares. A total of 38,703,705 shares of Capella, or 88.95% of outstanding shares, were tendered and accepted by us. The offer period expired on September 1, 2014. Pursuant to the terms of the tender offer, Vishay paid NT$139 for each share tendered. The aggregate purchase price for tendered shares was NT$5,400 million, or approximately $180 million. Capella had cash and short-term investments on hand of $50 million at the date of acquisition. The acquisition is expected to strengthen our position in optoelectronic sensors, a promising growth market. We acquired the remaining outstanding shares of Capella pursuant to the merger agreement on December 31, 2014. In connection with closing of the merger, all remaining holders of Capella common stock other than Vishay and our subsidiaries received the same consideration for their shares as the holders who tendered their shares in the tender offer, or approximately $21 million in the aggregate. Upon the close of the tender offer, we controlled Capella and began consolidating it in our financial statements. For financial reporting purposes, the results and operations of Capella have been included in the Optoelectronic Components segment. The interest of the shares not tendered are presented as noncontrolling interest in our consolidated financial statements for the period from the conclusion of the tender offer until they were acquired on December 31, 2014. We funded the acquisition mostly with cash on-hand, and borrowed $53 million on our revolving credit facility to achieve future flexibility given the legal entity and financial structure utilized for the acquisition. Subsequent to the acquisition of the noncontrolling interest in Capella on December 31, 2014, we expect to repatriate cash from current earnings of non-U.S. subsidiaries to the United States primarily to repay those borrowings on the revolving credit facility, and also to realign the acquired entity structure to have Capella's U.S. subsidiary directly owned by Vishay Intertechnology, Inc. Due to the nature of Capella's business, $74.5 million of the purchase price is allocated to definite-lived intangible assets, which will result in yearly amortization expense of the intangible assets of approximately $10 million. 2013 Activities On June 13, 2013, we acquired MCB Industrie S.A. ("MCB Industrie") in France, a well-established manufacturer of specialty resistors and sensors, for $23.0 million, net of cash acquired. The products and technology portfolio acquired is expected to enable us to expand our presence in the European industrial market. For financial reporting purposes, the results of operations for this business have been included in the Resistors & Inductors segment from June 13, 2013. 2012 Activities On January 13, 2012, we acquired HiRel Systems LLC, a leading supplier of high reliability transformers, inductors, coils, and power conversion products, for approximately $85.5 million. The products and technology portfolio acquired further enhance our inductors portfolio, particularly in the field of custom magnetics for medical, military, aerospace and aviation, and applications in the industrial and commercial field such as renewable energy and test and measurement equipment. For financial reporting purposes, the results of operations for this business have been included in the Resistors & Inductors segment from January 13, 2012.
35
Cost Management We place a strong emphasis on controlling our costs, and use various measures and metrics to evaluate our cost structure. We define variable costs as expenses that vary with respect to quantity produced. Fixed costs do not vary with respect to quantity produced over the relevant time period. Contributive margin is calculated as net revenue less variable costs. It may be expressed in dollars or as a percentage of net revenue. Management uses this measure to determine the amount of profit to be expected for any change in revenues. While these measures are typical cost accounting measures, none of these measures are recognized in accordance with GAAP. The classification of expenses as either variable or fixed is judgmental and other companies might classify such expenses differently. These measures, as calculated by Vishay, may not be comparable to similarly titled measures used by other companies. We closely monitor variable costs and seek to achieve the contributive margin in our business model. Over a period of many years, we have generally maintained a contributive margin of between 46% - 48% of revenues. The erosion of average selling prices, particularly of our semiconductor products, that is typical of our industry and inflation negatively impact contributive margin and drive us to continually seek ways to reduce our variable costs. Our variable cost reduction efforts include increasing the efficiency in our production facilities by expending capital for automation, reducing materials costs, materials substitution, increasing wafer size and shrinking dies to maximize efficiency in our semiconductor production processes, and other yield improvement activities. Our cost management strategy also includes a focus on controlling fixed costs recorded as costs of products sold or selling, general, and administrative expenses and maintaining our break-even point (adjusted for acquisitions). We seek to limit increases in selling, general, and administrative expenses to the rate of inflation, excluding foreign currency exchange effects and substantially independent of sales volume changes. At constant fixed costs, we would expect each $1 million increase in revenues to increase our operating margin by approximately $460,000 to $480,000. Sudden changes in the business conditions, however, may not allow us to quickly adapt our manufacturing capacity and cost structure. Historically, our primary cost reduction technique was through the transfer of production to the extent possible from high-labor-cost countries, such as the United States and Western Europe, to lower-labor-cost countries, such as the Czech Republic, Hungary, Israel, India, Malaysia, Mexico, the People's Republic of China, and the Philippines. Between 2001 and 2009, we recorded, in the consolidated statements of operations, restructuring and severance costs totaling $320 million and related asset write-downs totaling $89 million in order to reduce our cost structure going forward. We also incurred significant costs to restructure and integrate acquired businesses, which was included in the cost of the acquisitions under then-applicable GAAP. We did not initiate any new restructuring projects in 2010, 2011, or 2012 and thus did not record any restructuring and severance expenses during such periods. Occasionally, our ongoing cost containment activities are not adequate and we must take actions to maintain our cost competitiveness. In the fourth fiscal quarter of 2013, we announced various cost reduction programs as part of our continuous efforts to improve efficiency and operating performance. We recorded $20.9 million of restructuring and severance expenses in 2014 for the expenses that were recognizable under GAAP during the period and $23.7 million of restructuring and severance expenses since the cost reduction programs were implemented. The remaining expenses associated with the programs will be recorded as they become recognizable under GAAP. The programs primarily focus on a plan to enhance the competitiveness of our MOSFETs segment and a voluntary separation / early retirement offer to certain employees Company-wide. We also plan to implement two other smaller cost reduction programs concerning the manufacturing of products within our Diodes segment. The programs in total are expected to lower costs by approximately $36 million per year when fully implemented at expected cash costs of approximately $32 million. The project for the MOSFETs segment will extend over a period of approximately two years. The manufacture of wafers for certain critical products will be transferred into a more cost-efficient fab. As a consequence, certain other wafer manufacturing currently occurring in-house will be transferred to third-party foundries. The total cash costs associated with the MOSFETs initiatives, principally severance, are expected to be approximately $16 million. Once fully implemented, we anticipate that the MOSFETs programs will result in an annual reduction in variable and fixed manufacturing costs of approximately $23 million at current volumes. The voluntary separation / early retirement offer has been made to employees worldwide who are eligible because they have met job classification, age, and/or years-of-service criteria as of October 31, 2013. The program benefits vary by country and job classification, but generally offer a cash loyalty bonus. All eligible employees have been identified. The voluntary separation / early retirement program will not impact manufacturing operations or our growth plan. Our named executive officers (as defined in our proxy statement) and certain other key employees, generally research, development, and engineering personnel, were not eligible for the voluntary separation / early retirement program. The effective separation / retirement date for most eligible employees who accepted the offer was June 30, 2014 or earlier, with a few exceptions to allow for a transition period.
36

The total costs associated with the voluntary separation / early retirement program are approximately $13.3 million. The Company anticipates that the program will result in an annual reduction in fixed costs of approximately $10 million, split approximately 35% in manufacturing and 65% in selling, general, and administrative expenses. Two other smaller cost reduction programs relate to the transfer of production of certain products within our Diodes segment, which were initiated in the third fiscal quarter of 2014. Both programs are connected to production moves, in order to take advantage of lower labor costs in one program and from the consolidation of manufacturing locations in the other. The total cash costs associated with these production transfers are expected to be approximately $3 million, and will result in annual cost savings of approximately $3 million when fully implemented. We believe that our manufacturing footprint is suitable to serve our customers and end markets, while maintaining lower manufacturing costs. Except for the distinct and targeted programs noted above, we do not anticipate any other material restructuring activities in 2015. As we have demonstrated the past three years, we believe that we can substantially maintain our trained workforce, even at lower manufacturing activity levels, by reducing hours and limiting the use of subcontractors and foundries. However, a continued sluggish business environment for the electronics industry or the recurrence of a significant economic downturn may require us to implement additional restructuring initiatives. Our long-term strategy includes growth through the integration of acquired businesses, and GAAP requires plant closure and employee termination costs that we incur in connection with our acquisition activities to be recorded as expenses in our consolidated statement of operations, as such expenses are incurred. We have not incurred any material plant closure or employee termination costs related to our acquisitions of Huntington Electric, HiRel Systems, LLC, MCB Industrie, Holy Stone Polytech, or Capella, but we expect to have some level of future restructuring expenses due to acquisitions. Even as we seek to manage our costs, we continue to pursue our growth plans through investing in capacities for strategic product lines, and through increasing our resources for R&D, technical marketing, and field application engineering; supplemented by opportunistic acquisitions of specialty businesses.
Growth Plan
We are focused on enhancing stockholder value and improving earnings per share by growing our business and opportunistically repurchasing our stock. We plan to grow our business through intensified internal growth supplemented by opportunistic acquisitions, while at the same time maintaining a prudent capital structure. To foster intensified internal growth, we have increased our R&D and engineering technical staff by approximately 20% since 2009 and plan to further increase it; we are expanding critical manufacturing capacities; we are increasing our technical field sales force in Asia by about 25% to increase our market access to the industrial segment and increase the design-in of our products in local markets; and we are directing increased funding and focus on developing products to capitalize on the connectivity, mobility, and sustainability growth drivers of our business. These efforts as well as our broad and innovative product portfolio and strong position in distribution worldwide have us positioned very well in case of a dramatic upturn in the economy. Our growth plan also targets adding, through acquisitions, $100 million of revenues per year on average. Since 2011, we have acquired the specialty product businesses of Huntington Electric, HiRel Systems, LLC, and MCB Industrie. In 2014, we made strategic acquisitions of Holy Stone Polytech and Capella and plan to use the technology and engineering capabilities acquired to further grow our business. We continue to explore additional acquisition opportunities despite the current economic volatility.
37
Foreign Currency Translation We are exposed to foreign currency exchange rate risks, particularly due to transactions in currencies other than the functional currencies of certain subsidiaries. We occasionally use forward exchange contracts to economically hedge a portion of our projected cash flows from these exposures. GAAP requires that entities identify the "functional currency" of each of their subsidiaries and measure all elements of the financial statements in that functional currency. A subsidiary's functional currency is the currency of the primary economic environment in which it operates. In cases where a subsidiary is relatively self-contained within a particular country, the local currency is generally deemed to be the functional currency. However, a foreign subsidiary that is a direct and integral component or extension of the parent company's operations generally would have the parent company's currency as its functional currency. We have both situations among our subsidiaries. Foreign Subsidiaries which use the Local Currency as the Functional Currency We finance our operations in Europe and certain locations in Asia in local currencies, and accordingly, these subsidiaries utilize the local currency as their functional currency. For those subsidiaries where the local currency is the functional currency, assets and liabilities in the consolidated balance sheets have been translated at the rate of exchange as of the balance sheet date. Translation adjustments do not impact the results of operations and are reported as a separate component of stockholders' equity. For those subsidiaries where the local currency is the functional currency, revenues and expenses are translated at the average exchange rate for the year. While the translation of revenues and expenses into U.S. dollars does not directly impact the consolidated statement of operations, the translation effectively increases or decreases the U.S. dollar equivalent of revenues generated and expenses incurred in those foreign currencies. The dollar fluctuated versus the Euro and other foreign currencies throughout 2014, but the average exchange rate for the year ended December 31, 2014 was relatively even compared to the prior year, with the translation of foreign currency revenues and expenses into U.S. dollars having an immaterial effect on reported revenues and expenses versus the prior year. Foreign Subsidiaries which use the U.S. Dollar as the Functional Currency Our operations in Israel and most significant locations in Asia are largely financed in U.S. dollars, and accordingly, these subsidiaries utilize the U.S. dollar as their functional currency. For those foreign subsidiaries where the U.S. dollar is the functional currency, all foreign currency financial statement amounts are remeasured into U.S. dollars. Exchange gains and losses arising from remeasurement of foreign currency-denominated monetary assets and liabilities are included in the results of operations. While these subsidiaries transact most business in U.S. dollars, they may have significant costs, particularly payroll-related, which are incurred in the local currency. The cost of products sold and selling, general, and administrative expense for the year ended December 31, 2014 have been slightly unfavorably impacted (compared to the prior year) by local currency transactions of subsidiaries which use the U.S. dollar as their functional currency. See Item 7A for additional discussion of foreign currency exchange risk and forward contracts used to mitigate foreign currency risk.
38
Critical Accounting Policies and Estimates Our significant accounting policies are summarized in Note 1 to our consolidated financial statements. We identify here a number of policies that entail significant judgments or estimates. Revenue Recognition We recognize revenue on product sales during the period when the sales process is complete. This generally occurs when products are shipped to the customer in accordance with terms of an agreement of sale, title and risk of loss have been transferred, collectibility is reasonably assured, and pricing is fixed or determinable. For the portion of sales where title and risk of loss passes at point of delivery, we recognize revenue upon delivery to the customer, assuming all other criteria for revenue recognition are met. We historically have had agreements with distributors that provided limited rights of product return. We have modified these arrangements to allow distributors a limited credit for unsaleable products, which we term a "scrap allowance." Consistent with industry practice, we also have a "stock, ship and debit" program whereby we consider, and grant at our discretion, requests by distributors for credits on previously purchased products that remain in distributors' inventory, to enable the distributors to offer more competitive pricing. In addition, we have contractual arrangements whereby we provide distributors with protection against price reductions that we initiate after the sale of product to the distributor and prior to resale by the distributor. We record end of period accruals for each of the programs based upon our estimate of future credits under the programs that will be attributable to sales recorded through the end of the period. We calculate reductions of revenue attributable to each of the programs during any period by computing the change in the accruals from the prior period and adding the credits actually given to distributors during the period under the programs. These procedures require the exercise of significant judgments, but we believe they enable us to reasonably estimate future credits under the programs. Recording and monitoring of our sales accruals takes place at our subsidiaries and divisions, with input from sales and marketing personnel and review, assessment, and, if necessary, adjustment by corporate management. While our subsidiaries and divisions utilize different methodologies based on their individual experiences, all of the methodologies take into account certain elements that management considers relevant, such as sales to distributors during the relevant period, inventory levels at the distributors, current and projected market trends and conditions, recent and historical activity under the relevant programs, changes in program policies, and open requests for credits. In our judgment, the different methodologies provide us with equally reliable estimates upon which to base our accruals. We do not track the credits that we record against specific products sold from distributor inventories, so as to directly compare revenue reduction for credits recorded during any period with credits ultimately awarded in respect of products sold during that period. Nevertheless, we believe that we have an adequate basis to assess the reasonableness and reliability of our estimates. Inventories and Purchase Commitments We value our inventories at the lower of cost or market, with cost determined under the first-in, first-out method and market based upon net realizable value. The valuation of our inventories requires our management to make market estimates. For work in process goods, we are required to estimate the cost to completion of the products and the prices at which we will be able to sell the products. For finished goods, we must assess the prices at which we believe the inventory can be sold. Inventories are also adjusted for estimated obsolescence and written down to net realizable value based upon estimates of future demand, technology developments and market conditions. Certain metals used in the manufacture of our products are traded on active markets, and can be subject to significant price volatility. Our policy is to enter into short-term commitments to purchase defined portions of annual consumption of these metals if market prices decline below budget. We record losses and related liabilities when the contractually obligated purchase price under our purchase commitments exceed quoted market prices for the metals. Goodwill See Note 1 to our consolidated financial statements for a description of our annual goodwill impairment test. The determination of the fair value of the reporting units and the allocation of that value to individual assets and liabilities within those reporting units required for a quantitative goodwill impairment test requires us to make significant estimates and assumptions measured at a point in time. These estimates and assumptions primarily include, but are not limited to: the selection of appropriate peer group companies; control premiums appropriate for acquisitions in the industries in which we compete; the discount rate; terminal growth rates; and forecasts of revenue, operating income, depreciation and amortization, and capital expenditures. The allocation requires several analyses to determine fair value of assets and liabilities including, among others, completed technology, tradenames, in-process research and development, customer relationships, and certain property and equipment (valued at replacement costs). Due to the inherent uncertainty involved in making these estimates, actual financial results could differ from those estimates. In addition, changes in assumptions concerning future financial results or other underlying assumptions could have a significant impact on either the fair value of the reporting unit or the amount of the goodwill impairment charge.
39
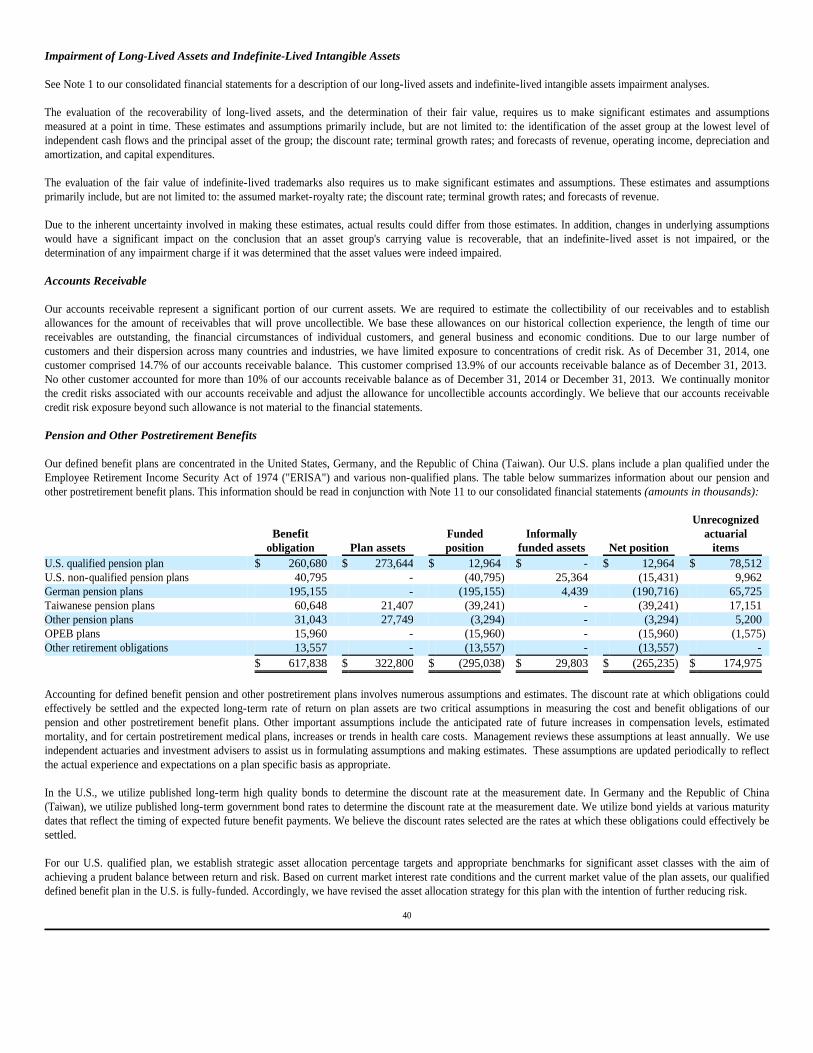
Impairment of Long-Lived Assets and Indefinite-Lived Intangible Assets See Note 1 to our consolidated financial statements for a description of our long-lived assets and indefinite-lived intangible assets impairment analyses. The evaluation of the recoverability of long-lived assets, and the determination of their fair value, requires us to make significant estimates and assumptions measured at a point in time. These estimates and assumptions primarily include, but are not limited to: the identification of the asset group at the lowest level of independent cash flows and the principal asset of the group; the discount rate; terminal growth rates; and forecasts of revenue, operating income, depreciation and amortization, and capital expenditures. The evaluation of the fair value of indefinite-lived trademarks also requires us to make significant estimates and assumptions. These estimates and assumptions primarily include, but are not limited to: the assumed market-royalty rate; the discount rate; terminal growth rates; and forecasts of revenue. Due to the inherent uncertainty involved in making these estimates, actual results could differ from those estimates. In addition, changes in underlying assumptions would have a significant impact on the conclusion that an asset group's carrying value is recoverable, that an indefinite-lived asset is not impaired, or the determination of any impairment charge if it was determined that the asset values were indeed impaired. Accounts Receivable Our accounts receivable represent a significant portion of our current assets. We are required to estimate the collectibility of our receivables and to establish allowances for the amount of receivables that will prove uncollectible. We base these allowances on our historical collection experience, the length of time our receivables are outstanding, the financial circumstances of individual customers, and general business and economic conditions. Due to our large number of customers and their dispersion across many countries and industries, we have limited exposure to concentrations of credit risk. As of December 31, 2014, one customer comprised 14.7% of our accounts receivable balance. This customer comprised 13.9% of our accounts receivable balance as of December 31, 2013. No other customer accounted for more than 10% of our accounts receivable balance as of December 31, 2014 or December 31, 2013. We continually monitor the credit risks associated with our accounts receivable and adjust the allowance for uncollectible accounts accordingly. We believe that our accounts receivable credit risk exposure beyond such allowance is not material to the financial statements. Pension and Other Postretirement Benefits Our defined benefit plans are concentrated in the United States, Germany, and the Republic of China (Taiwan). Our U.S. plans include a plan qualified under the Employee Retirement Income Security Act of 1974 ("ERISA") and various non-qualified plans. The table below summarizes information about our pension and other postretirement benefit plans. This information should be read in conjunction with Note 11 to our consolidated financial statements (amounts in thousands):
Accounting for defined benefit pension and other postretirement plans involves numerous assumptions and estimates. The discount rate at which obligations could effectively be settled and the expected long-term rate of return on plan assets are two critical assumptions in measuring the cost and benefit obligations of our pension and other postretirement benefit plans. Other important assumptions include the anticipated rate of future increases in compensation levels, estimated mortality, and for certain postretirement medical plans, increases or trends in health care costs. Management reviews these assumptions at least annually. We use independent actuaries and investment advisers to assist us in formulating assumptions and making estimates. These assumptions are updated periodically to reflect the actual experience and expectations on a plan specific basis as appropriate. In the U.S., we utilize published long-term high quality bonds to determine the discount rate at the measurement date. In Germany and the Republic of China (Taiwan), we utilize published long-term government bond rates to determine the discount rate at the measurement date. We utilize bond yields at various maturity dates that reflect the timing of expected future benefit payments. We believe the discount rates selected are the rates at which these obligations could effectively be settled. For our U.S. qualified plan, we establish strategic asset allocation percentage targets and appropriate benchmarks for significant asset classes with the aim of achieving a prudent balance between return and risk. Based on current market interest rate conditions and the current market value of the plan assets, our qualified defined benefit plan in the U.S. is fully-funded. Accordingly, we have revised the asset allocation strategy for this plan with the intention of further reducing risk.
40
Benefit
obligation Plan assets Funded position
Informally funded assets Net position
Unrecognized actuarial
items U.S. qualified pension plan $ 260,680 $ 273,644 $ 12,964 $ - $ 12,964 $ 78,512 U.S. non-qualified pension plans 40,795 - (40,795) 25,364 (15,431) 9,962 German pension plans 195,155 - (195,155) 4,439 (190,716) 65,725 Taiwanese pension plans 60,648 21,407 (39,241) - (39,241) 17,151 Other pension plans 31,043 27,749 (3,294) - (3,294) 5,200 OPEB plans 15,960 - (15,960) - (15,960) (1,575) Other retirement obligations 13,557 - (13,557) - (13,557) - $ 617,838 $ 322,800 $ (295,038) $ 29,803 $ (265,235) $ 174,975
Non-qualified plans in the U.S. are considered by law to be unfunded. However, the Company maintains assets in a rabbi trust to fund benefit payments under certain of these plans. Such assets would be subject to creditor claims under certain conditions. (See also Notes 11 and 18 to our consolidated financial statements.) Many of our non-U.S. plans are unfunded based on local laws and customs. For those non-U.S. plans that do maintain investments, their asset holdings are primarily cash and fixed income securities, based on local laws and customs. Some non-U.S. plans also informally fund their plans by holding certain available-for-sale investments. Such assets would be subject to creditor claims under certain conditions. (See also Note 18 to our consolidated financial statements.) We set the expected long-term rate of return based on the expected long-term average rates of return to be achieved by the underlying investment portfolios. In establishing this rate, we consider historical and expected returns for the asset classes in which the plans are invested, advice from pension consultants and investment advisors, and current economic and capital market conditions. The expected return on plan assets is incorporated into the computation of pension expense. The difference between this expected return and the actual return on plan assets is deferred. The net deferral of past asset losses (gains) affects the calculated value of plan assets and, ultimately, future pension expense (income). The U.S. Society of Actuaries Retirement Plans Experience Committee issued new mortality tables and a new mortality improvement scale in 2014. The new mortality tables and mortality improvement scale are based on a recent study of mortality experience in the United States and reflect improved retiree longevity. The use of the new mortality tables and mortality improvement scale increased the Company's projected benefit obligations in the United States by approximately $24 million and will increase future net periodic pension cost due to higher amortization of actuarial items. During the fourth fiscal quarter of 2008, we adopted amendments to our principal U.S. defined benefit pension plans, such that effective January 1, 2009, the plans were frozen. Pursuant to these amendments, no new employees may participate in the plans, no further participant contributions will be required or permitted, and no further benefits shall accrue after December 31, 2008. Accordingly, net periodic pension cost for U.S. plans no longer include any service cost. During the third fiscal quarter of 2014, the Company executed two partial-settlement transactions to reduce the risk associated with its U.S. qualified pension obligations. These transactions included the purchase of annuity contracts for approximately 700 participants pursuant to an arrangement inherited in a past acquisition and a special limited-time voluntary lump-sum payment offer to certain former employees who were deferred vested participants of the plan not currently receiving periodic payments of their pension benefit. A total of 800 participants accepted the voluntary lump-sum offer. The plan is no longer obligated to pay any benefits to the 1,500 participants covered by these two settlement transactions. These former participants represented approximately 23% of the total participants prior to executing these transactions. These transactions also resulted in the recognition of non-cash settlement charges aggregating $15.6 million, representing previously unrecognized actuarial items. We continue to seek to de-risk our pension exposures, especially given the frozen status of the U.S. plans and the current funded status. Such actions could result in increased net periodic pension cost due to lower expected rates of return on plan assets and/or possible additional charges to recognize unamortized actuarial items if all or a portion of the obligations were to be settled. We believe that the current assumptions used to estimate plan obligations and annual expenses are appropriate. However, if economic conditions change or if our investment strategy changes, we may be inclined to change some of our assumptions, and the resulting change could have a material impact on the consolidated statements of operations and on the consolidated balance sheet.
41

Income Taxes See Note 1 to consolidated financial statements for a description of our income tax policies. We and our subsidiaries file U.S. federal income tax returns, as well as tax returns in multiple state and foreign jurisdictions. In 2014, the U.S. Internal Revenue Service concluded its examination of our U.S. federal tax returns through the 2011 tax year. The tax returns of principal non-U.S. subsidiaries which are currently under examination include France (2012 and 2013), Germany (2009 through 2012), India (2004 through 2012), Israel (2009 through 2012), and the Republic of China (Taiwan) (2012). We and our subsidiaries also file income tax returns in other taxing jurisdictions in the U.S. and around the world, many of which are still open to examinations. We have recorded deferred tax assets representing future tax benefits, but may not be able to realize these future tax benefits in certain jurisdictions. Significant judgment is required in determining the expected future realizability of these deferred tax assets. We periodically evaluate the realizability of our deferred tax assets by assessing the valuation allowance and by adjusting the amount of such allowance, if necessary. The factors used to assess the likelihood of realization include deferred tax liabilities, our forecast of future taxable income, and available tax planning strategies that could be implemented to realize the net deferred tax assets. We have generally recognized net deferred tax assets only where there is a recent history of taxable income and forecasts of future taxable income. We generate a significant amount of cash and profits from our non-U.S. subsidiaries, and our provision for income taxes is based on various assertions regarding future use of that cash and profits. Such assertions require us to consider a wide variety of U.S. federal and foreign tax laws, and the application of such laws to our operational and strategic needs. We expect to fund the quarterly dividend program initiated in February 2014, by, at least in part, repatriating current year income of certain non-U.S. subsidiaries and providing appropriate U.S. federal and state income taxes, incremental foreign income taxes, and withholding taxes payable on that current period non-U.S. income. During 2014, we borrowed amounts on our revolving credit facility to achieve future flexibility given the legal entity and the financial structure utilized for the Capella acquisition. Subsequent to the acquisition of the noncontrolling interest in Capella on December 31, 2014, we expect to repatriate cash from current earnings of non-U.S. subsidiaries to the United States primarily to repay those borrowings on the revolving credit facility, and also to realign the acquired entity structure to have Capella's U.S. subsidiary directly owned by Vishay Intertechnology, Inc. Our tax provision for the year ended December 31, 2014 includes all U.S. federal and state income taxes, incremental foreign income taxes, and withholding taxes payable related to that anticipated transaction. Substantially all earnings generated by our non-U.S. subsidiaries prior to 2014, and cash generated in 2014 which is not funding the dividend program or the Capella acquisition, are deemed to be reinvested outside of the United States indefinitely. Accordingly, no provision has been made for U.S. federal and state income taxes on these foreign earnings. Upon distribution of those earnings in the form of dividends or otherwise, we would be subject to U.S. income taxes (subject to an adjustment for foreign tax credits), state income taxes, incremental foreign income taxes, and withholding taxes payable to various foreign countries. During 2014, certain tax examinations were completed and certain statutes of limitations lapsed. Our tax provision for the year ended December 31, 2014 includes tax benefits related to the resolution of these matters. Additional information about income taxes is included in Note 5 to our consolidated financial statements.
42

Results of Operations Statement of operations' captions as a percentage of net revenues and the effective tax rates were as follows:
Net Revenues Net revenues were as follows (dollars in thousands):
Changes in net revenues were attributable to the following:
Overall, the business conditions in 2014 were better than the 2013 conditions, but both years were below our expected run-rate. Our revenue results for 2014 were positively affected by increased demand for our products and overall higher demand compared to the prior year periods. Orders from distributors, particularly in Asia, decreased at the end of the year before showing signs of a possible recovery. We deduct, from the sales that we record to distributors, allowances for future credits that we expect to provide for returns, scrapped product, and price adjustments under various programs made available to the distributors. We make deductions corresponding to particular sales in the period in which the sales are made, although the corresponding credits may not be issued until future periods. We estimate the deductions based on sales levels to distributors, inventory levels at the distributors, current and projected market trends and conditions, recent and historical activity under the relevant programs, changes in program policies, and open requests for credits. We recorded deductions from gross sales under our distributor incentive programs of $89.6 million, $84.3 million, and $72.7 million, for the years ended December 31, 2014, 2013, and 2012, respectively, or, as a percentage of gross sales, 3.5%, 3.4%, and 3.2%, respectively. Actual credits issued under the programs for the years ended December 31, 2014, 2013, and 2012 were approximately $87.9 million, $83.2 million, and $76.9 million, respectively. Increases and decreases in these incentives are largely attributable to the then-current business climate. Royalty revenues, included in net revenues on the consolidated statements of operations, were $4.5 million, $6.4 million, and $7.1 million, for the years ended December 31, 2014, 2013, and 2012, respectively. Gross Profit and Margins Gross profit margins for the year ended December 31, 2014 were 24.5%, as compared to 23.9% for the year ended December 31, 2013. The increase was due primarily to higher volume and our cost reduction efforts partially offset by lower average selling prices. Gross profit margins for the year ended December 31, 2013 were 23.9%, as compared to 23.6% for the year ended December 31, 2012. The increase was due primarily to higher volume partially offset by lower average selling prices.
43
Years ended December 31, 2014 2013 2012 Costs of products sold 75.5% 76.1% 76.4%Gross profit 24.5% 23.9% 23.6%Selling, general, and administrative expenses 15.5% 15.5% 15.7%Operating income 7.6% 8.3% 8.5%Income before taxes and noncontrolling interest 6.7% 7.4% 7.6%Net earnings attributable to Vishay stockholders 4.7% 5.2% 5.5%________ Effective tax rate 29.5% 29.8% 27.4%
2014 2013 2012 Net revenues $ 2,493,282 $ 2,370,979 $ 2,230,097 Change versus prior year $ 122,303 $ 140,882 Percentage change versus prior year 5.2% 6.3%
2014 vs. 2013 2013 vs. 2012 Change attributable to: Increase in volume 6.6% 8.3%Decrease in average selling prices -2.5% -3.1%Foreign currency effects 0.0% 0.8%Acquisitions 1.4% 0.8%Other -0.3% -0.5%Net change 5.2% 6.3%
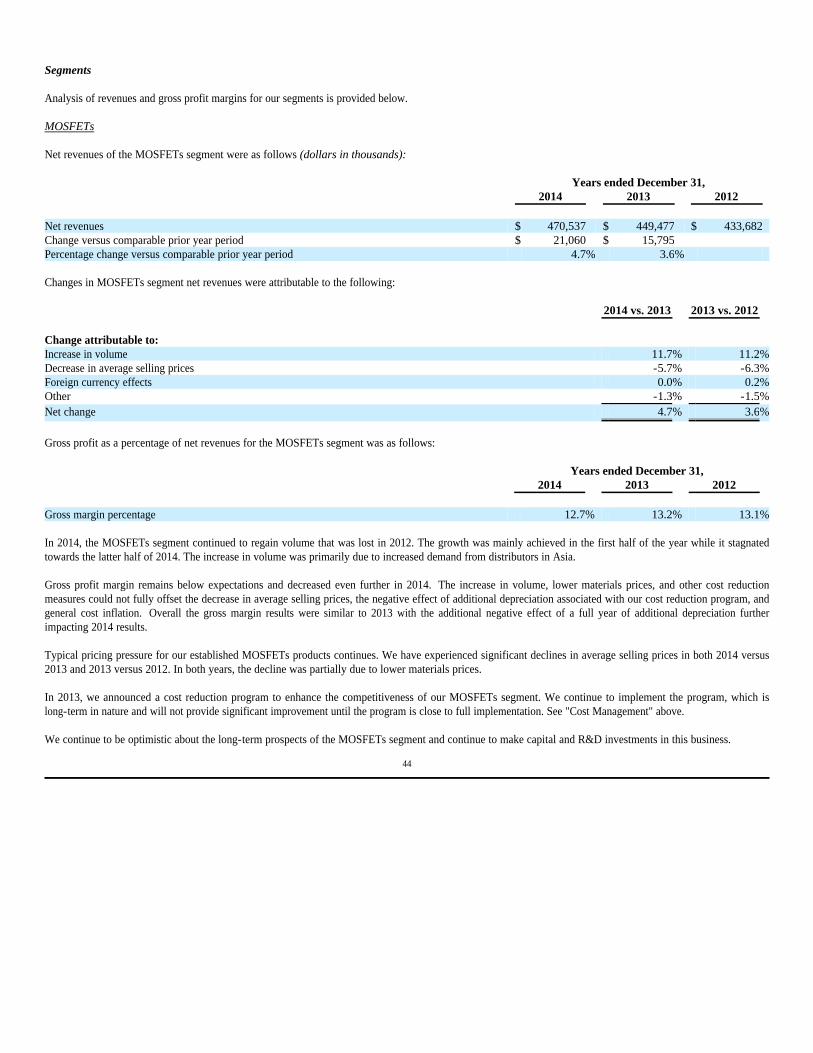
Segments Analysis of revenues and gross profit margins for our segments is provided below. MOSFETs Net revenues of the MOSFETs segment were as follows (dollars in thousands):
Changes in MOSFETs segment net revenues were attributable to the following:
Gross profit as a percentage of net revenues for the MOSFETs segment was as follows:
In 2014, the MOSFETs segment continued to regain volume that was lost in 2012. The growth was mainly achieved in the first half of the year while it stagnated towards the latter half of 2014. The increase in volume was primarily due to increased demand from distributors in Asia. Gross profit margin remains below expectations and decreased even further in 2014. The increase in volume, lower materials prices, and other cost reduction measures could not fully offset the decrease in average selling prices, the negative effect of additional depreciation associated with our cost reduction program, and general cost inflation. Overall the gross margin results were similar to 2013 with the additional negative effect of a full year of additional depreciation further impacting 2014 results. Typical pricing pressure for our established MOSFETs products continues. We have experienced significant declines in average selling prices in both 2014 versus 2013 and 2013 versus 2012. In both years, the decline was partially due to lower materials prices. In 2013, we announced a cost reduction program to enhance the competitiveness of our MOSFETs segment. We continue to implement the program, which is long-term in nature and will not provide significant improvement until the program is close to full implementation. See "Cost Management" above. We continue to be optimistic about the long-term prospects of the MOSFETs segment and continue to make capital and R&D investments in this business.
44
Years ended December 31, 2014 2013 2012 Net revenues $ 470,537 $ 449,477 $ 433,682 Change versus comparable prior year period $ 21,060 $ 15,795 Percentage change versus comparable prior year period 4.7% 3.6%
2014 vs. 2013 2013 vs. 2012 Change attributable to: Increase in volume 11.7% 11.2%Decrease in average selling prices -5.7% -6.3%Foreign currency effects 0.0% 0.2%Other -1.3% -1.5%Net change 4.7% 3.6%
Years ended December 31, 2014 2013 2012 Gross margin percentage 12.7% 13.2% 13.1%

Diodes Net revenues of the Diodes segment were as follows (dollars in thousands):
Changes in Diodes segment net revenues were attributable to the following:
Gross profit as a percentage of net revenues for the Diodes segment was as follows:
The Diodes segment was positively affected by the increased demand from distributors in Asia in both 2014 and 2013. Positive business development directly with end customers in Europe also contributed to growth of the segment in 2014. The increases in gross profit margin in 2014 and 2013 are primarily due to the increase in sales volume, manufacturing efficiencies, and lower materials prices, partially offset by decreased average selling prices and general cost inflation. Typical pricing pressure for our established Diodes products continues. We have experienced a slight price decline in 2014 versus 2013 and moderate price decline in 2013 versus 2012. The cost reduction programs announced in 2013 include two smaller projects to improve the results of the Diodes segment. These projects, which were initiated in the third fiscal quarter of 2014 and substantially implemented in the fourth fiscal quarter of 2014, demonstrate our ongoing effort to improve the results of this segment. See "Cost Management" above.
45
Years ended December 31, 2014 2013 2012 Net revenues $ 579,288 $ 547,264 $ 496,744 Change versus comparable prior year period $ 32,024 $ 50,520 Percentage change versus comparable prior year period 5.9% 10.2%
2014 vs. 2013 2013 vs. 2012 Change attributable to: Increase in volume 9.3% 13.8%Decrease in average selling prices -2.9% -3.0%Foreign currency effects 0.0% 0.2%Other -0.5% -0.8%Net change 5.9% 10.2%
Years ended December 31, 2014 2013 2012 Gross margin percentage 22.8% 22.2% 20.0%
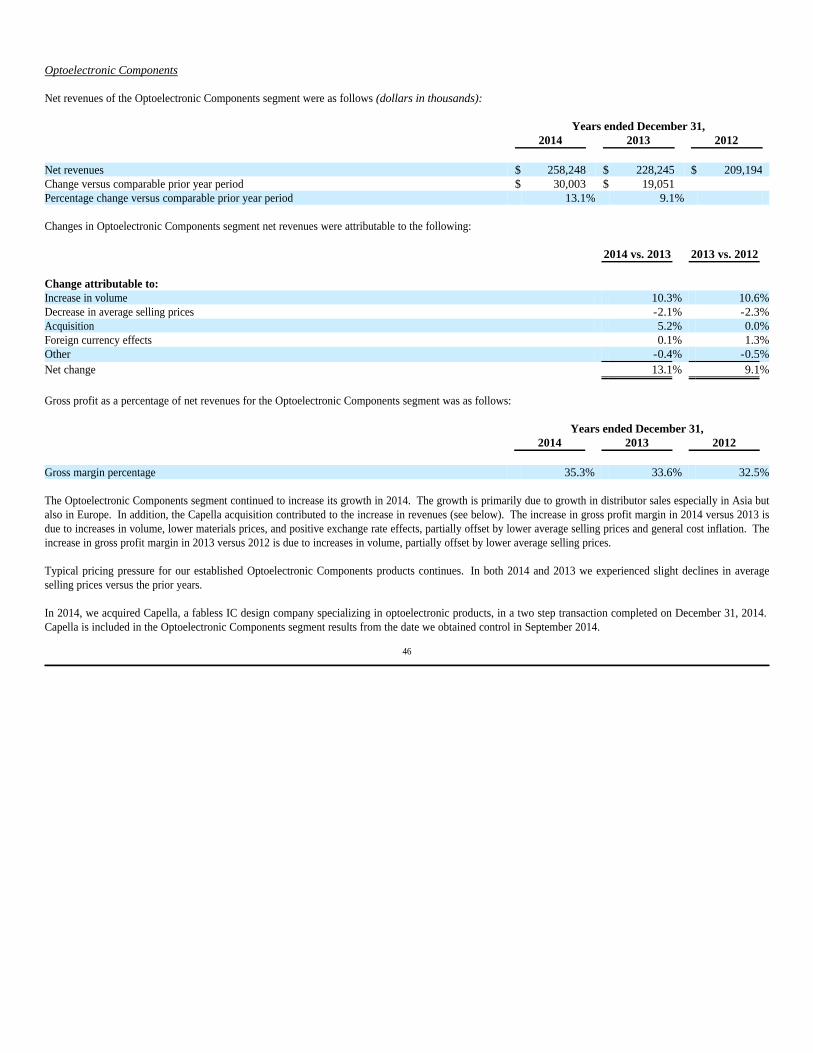
Optoelectronic Components Net revenues of the Optoelectronic Components segment were as follows (dollars in thousands):
Changes in Optoelectronic Components segment net revenues were attributable to the following:
Gross profit as a percentage of net revenues for the Optoelectronic Components segment was as follows:
The Optoelectronic Components segment continued to increase its growth in 2014. The growth is primarily due to growth in distributor sales especially in Asia but also in Europe. In addition, the Capella acquisition contributed to the increase in revenues (see below). The increase in gross profit margin in 2014 versus 2013 is due to increases in volume, lower materials prices, and positive exchange rate effects, partially offset by lower average selling prices and general cost inflation. The increase in gross profit margin in 2013 versus 2012 is due to increases in volume, partially offset by lower average selling prices. Typical pricing pressure for our established Optoelectronic Components products continues. In both 2014 and 2013 we experienced slight declines in average selling prices versus the prior years. In 2014, we acquired Capella, a fabless IC design company specializing in optoelectronic products, in a two step transaction completed on December 31, 2014. Capella is included in the Optoelectronic Components segment results from the date we obtained control in September 2014.
46
Years ended December 31, 2014 2013 2012 Net revenues $ 258,248 $ 228,245 $ 209,194 Change versus comparable prior year period $ 30,003 $ 19,051 Percentage change versus comparable prior year period 13.1% 9.1%
2014 vs. 2013 2013 vs. 2012 Change attributable to: Increase in volume 10.3% 10.6%Decrease in average selling prices -2.1% -2.3%Acquisition 5.2% 0.0%Foreign currency effects 0.1% 1.3%Other -0.4% -0.5%Net change 13.1% 9.1%
Years ended December 31, 2014 2013 2012 Gross margin percentage 35.3% 33.6% 32.5%

Resistors & Inductors Net revenues of the Resistors & Inductors segment were as follows (dollars in thousands):
Changes in Resistors & Inductors segment net revenues were attributable to the following:
Gross profit as a percentage of net revenues for the Resistors & Inductors segment was as follows:
The Resistors & Inductors segment continues to produce strong results with revenues reaching an historically high level. All regions and most end-markets have contributed to the revenue growth compared to the prior year. The biggest source of growth was from distributors, and the automotive and industrial end-use markets. Sales to distributors were particularly strong in the fourth fiscal quarter of 2014 compared to prior years which experienced declines in sales in the fourth fiscal quarters. The segment's gross margin improved versus the prior year mainly due to efficiencies related to the higher sales volume and our continued cost reduction programs, which more than offset the unfavorable impact of reduced average selling prices and inflationary effects. Our targeted acquisitions of MCB Industrie, HiRel Systems, and certain assets of Huntington Electric in 2013, 2012, and 2011, respectively, have positively contributed to the net revenues and gross margin of the Resistors & Inductors segment. Average selling prices declined slightly in both 2014 versus 2013 and 2013 versus 2012.
47
Years ended December 31, 2014 2013 2012 Net revenues $ 759,616 $ 706,248 $ 642,320 Change versus comparable prior year period $ 53,368 $ 63,928 Percentage change versus comparable prior year period 7.6% 10.0%
2014 vs. 2013 2013 vs. 2012 Change attributable to: Increase in volume 8.2% 8.0%Decrease in average selling prices -2.3% -1.6%Foreign currency effects 0.0% 1.1%Acquisitions 2.0% 2.9%Other -0.3% -0.4%Net change 7.6% 10.0%
Years ended December 31, 2014 2013 2012 Gross margin percentage 31.7% 31.4% 31.8%

Capacitors Net revenues of the Capacitors segment were as follows (dollars in thousands):
Changes in Capacitors segment net revenues were attributable to the following:
Gross profit as a percentage of net revenues for the Capacitors segment was as follows:
Net revenues in 2014 decreased moderately versus the prior year. The Capacitors segment continues to be negatively affected by low demand for renewable energies as government spending has declined. The automotive end-market has remained steady and sales increased slightly versus the prior year. The increase in gross profit margin versus the prior year is primarily due to the increase in average selling prices and cost reductions. The decrease in gross profit margin from 2012 to 2013 is primarily due to the decrease in sales volume and average selling prices. Average selling prices increased slightly versus 2013, but remain lower than 2012 prices. On June 11, 2014, we acquired Holy Stone Polytech, a Japanese manufacturer of tantalum capacitors and formerly a subsidiary of Holy Stone Enterprise Co. Ltd., for $20.6 million, net of cash acquired. The acquisition is expected to strengthen our position in tantalum capacitors, especially in Asia. We plan to use the technology acquired to develop new products and enter new product markets.
48
Years ended December 31, 2014 2013 2012 Net revenues $ 425,593 $ 439,745 $ 448,157 Change versus comparable prior year period $ (14,152) $ (8,412) Percentage change versus comparable prior year period -3.2% -1.9%
2014 vs. 2013 2013 vs. 2012 Change attributable to: Decrease in volume -5.9% -0.6%Change in average selling prices 1.1% -2.4%Acquisition 1.5% 0.0%Foreign currency effects 0.1% 1.2%Other 0.0% -0.1%Net change -3.2% -1.9%
Years ended December 31, 2014 2013 2012 Gross margin percentage 20.5% 20.0% 22.0%
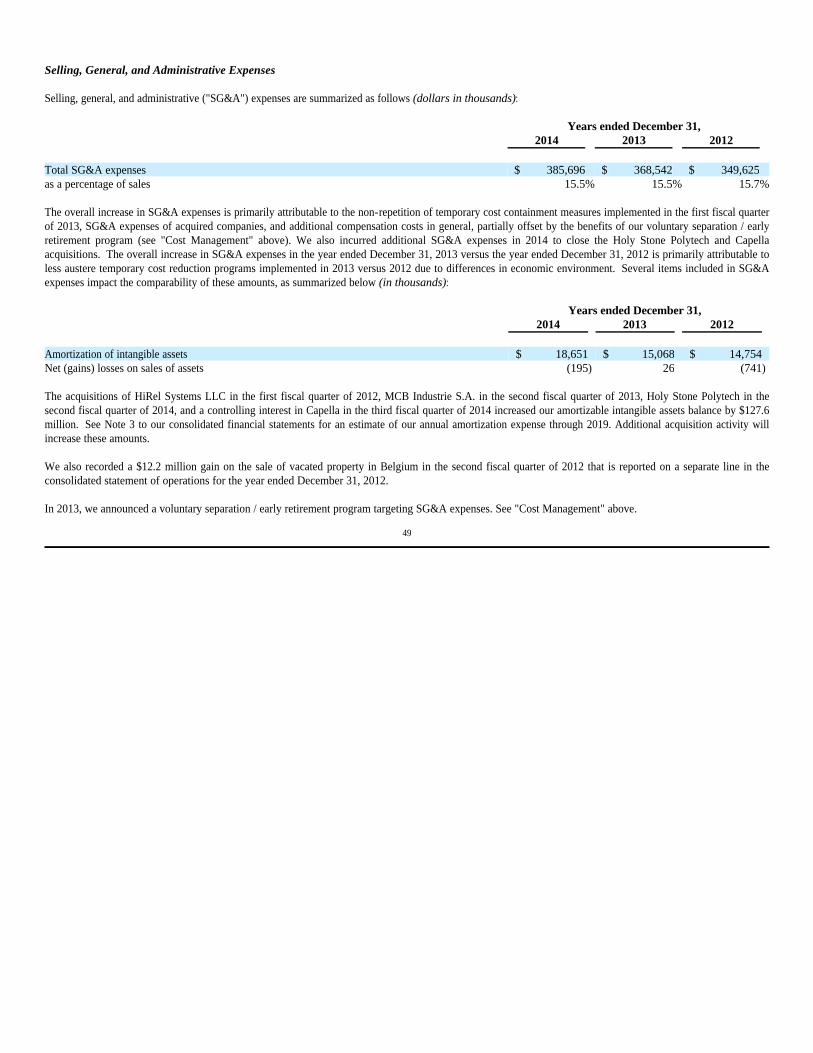
Selling, General, and Administrative Expenses Selling, general, and administrative ("SG&A") expenses are summarized as follows (dollars in thousands):
The overall increase in SG&A expenses is primarily attributable to the non-repetition of temporary cost containment measures implemented in the first fiscal quarter of 2013, SG&A expenses of acquired companies, and additional compensation costs in general, partially offset by the benefits of our voluntary separation / early retirement program (see "Cost Management" above). We also incurred additional SG&A expenses in 2014 to close the Holy Stone Polytech and Capella acquisitions. The overall increase in SG&A expenses in the year ended December 31, 2013 versus the year ended December 31, 2012 is primarily attributable to less austere temporary cost reduction programs implemented in 2013 versus 2012 due to differences in economic environment. Several items included in SG&A expenses impact the comparability of these amounts, as summarized below (in thousands):
The acquisitions of HiRel Systems LLC in the first fiscal quarter of 2012, MCB Industrie S.A. in the second fiscal quarter of 2013, Holy Stone Polytech in the second fiscal quarter of 2014, and a controlling interest in Capella in the third fiscal quarter of 2014 increased our amortizable intangible assets balance by $127.6 million. See Note 3 to our consolidated financial statements for an estimate of our annual amortization expense through 2019. Additional acquisition activity will increase these amounts. We also recorded a $12.2 million gain on the sale of vacated property in Belgium in the second fiscal quarter of 2012 that is reported on a separate line in the consolidated statement of operations for the year ended December 31, 2012. In 2013, we announced a voluntary separation / early retirement program targeting SG&A expenses. See "Cost Management" above.
49
Years ended December 31, 2014 2013 2012 Total SG&A expenses $ 385,696 $ 368,542 $ 349,625 as a percentage of sales 15.5% 15.5% 15.7%
Years ended December 31, 2014 2013 2012 Amortization of intangible assets $ 18,651 $ 15,068 $ 14,754 Net (gains) losses on sales of assets (195) 26 (741)
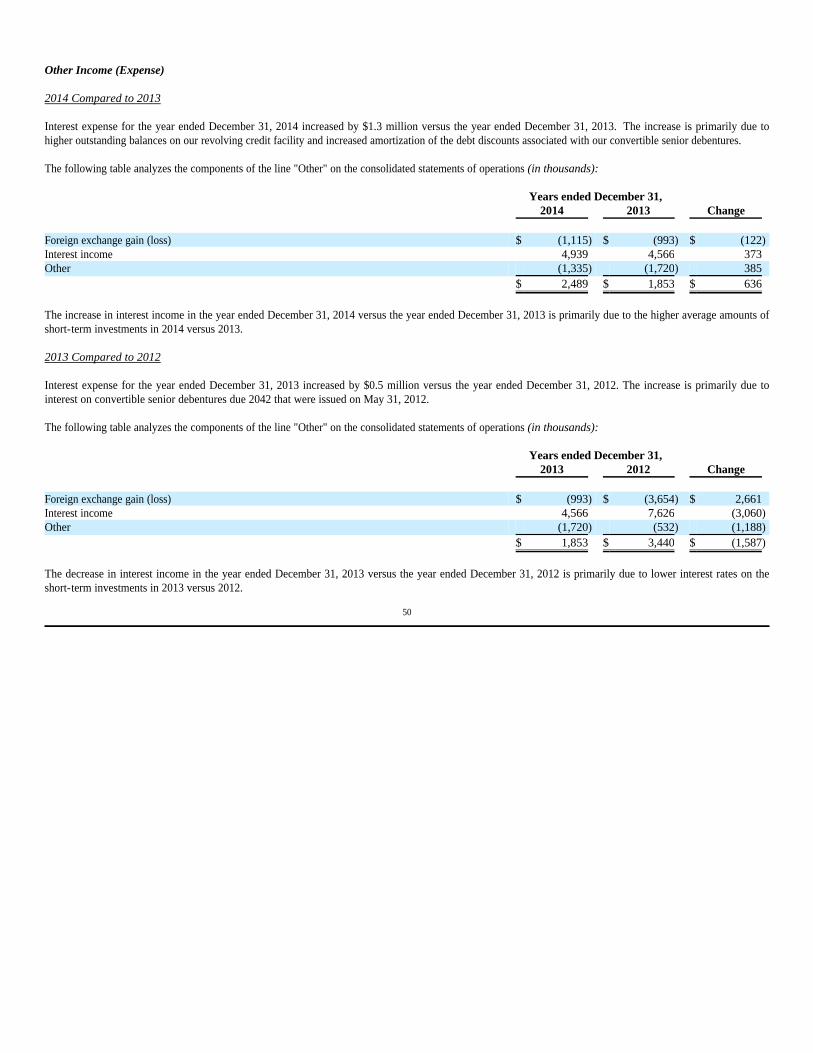
Other Income (Expense) 2014 Compared to 2013 Interest expense for the year ended December 31, 2014 increased by $1.3 million versus the year ended December 31, 2013. The increase is primarily due to higher outstanding balances on our revolving credit facility and increased amortization of the debt discounts associated with our convertible senior debentures. The following table analyzes the components of the line "Other" on the consolidated statements of operations (in thousands):
The increase in interest income in the year ended December 31, 2014 versus the year ended December 31, 2013 is primarily due to the higher average amounts of short-term investments in 2014 versus 2013. 2013 Compared to 2012 Interest expense for the year ended December 31, 2013 increased by $0.5 million versus the year ended December 31, 2012. The increase is primarily due to interest on convertible senior debentures due 2042 that were issued on May 31, 2012. The following table analyzes the components of the line "Other" on the consolidated statements of operations (in thousands):
The decrease in interest income in the year ended December 31, 2013 versus the year ended December 31, 2012 is primarily due to lower interest rates on the short-term investments in 2013 versus 2012.
50
Years ended December 31, 2014 2013 Change Foreign exchange gain (loss) $ (1,115) $ (993) $ (122) Interest income 4,939 4,566 373 Other (1,335) (1,720) 385 $ 2,489 $ 1,853 $ 636
Years ended December 31, 2013 2012 Change Foreign exchange gain (loss) $ (993) $ (3,654) $ 2,661 Interest income 4,566 7,626 (3,060) Other (1,720) (532) (1,188) $ 1,853 $ 3,440 $ (1,587)

Income Taxes For the years ended December 31, 2014, 2013, and 2012, the effective tax rates were 29.5%, 29.8%, and 27.4%, respectively. The effective tax rates are generally less than the U.S. statutory rate primarily because of earnings in foreign jurisdictions and the release of deferred tax asset valuation allowances. Income tax expense for the years ended December 31, 2014, 2013, and 2012 include certain discrete tax items for changes in uncertain tax positions, valuation allowances, tax rates, and other related items. These items were $1.2 million (tax benefit) in 2014, $4.2 million (tax benefit) in 2013, and $4.0 million (tax benefit) in 2012. For the year ended December 31, 2014, the discrete items include a $1.2 million benefit recorded in the fourth fiscal quarter due to the enactment of The Tax Increase Prevention Act of 2014 that retroactively extended certain tax benefits from January 1, 2014 to December 31, 2014. The discrete items also include benefits upon the completion of certain tax examinations and lapses in the statute of limitations, offset by additional tax expenses for expected repatriation of cash and profits of non-U.S. subsidiaries to the United States, primarily to repay amounts borrowed on the revolving credit facility to provide future flexibility given the legal entity and the financial structure utilized for the Capella acquisition. The latter two items netted to an immaterial amount. For the year ended December 31, 2013, the discrete items include a $2.9 million benefit recorded in the third fiscal quarter due to a new tax law enacted in Israel in July 2013 which effectively increases the corporate income tax rate on certain types of income earned after January 1, 2014, and, therefore, increases our deferred tax assets and a $1.3 million benefit recorded in the first fiscal quarter due to the retroactive enactment of the American Taxpayer Relief Act of 2012, signed into law on January 2, 2013. For the year ended December 31, 2012, the discrete item is the reduction of a valuation allowance on a deferred tax asset in Israel due to a merger of several of our wholly-owned subsidiaries in Israel in the fourth fiscal quarter, which will allow for the realization of these tax benefits that likely otherwise would have been forgone. We operate in a global environment with significant operations in various locations outside the United States. Accordingly, the consolidated income tax rate is a composite rate reflecting our earnings and the applicable tax rates in the various locations where we operate. Part of our strategy is to achieve cost savings through the transfer and expansion of manufacturing operations to countries where we can take advantage of lower labor costs and available tax and other government-sponsored incentives. Accordingly, our effective tax rate is generally less than the U.S. statutory tax rate. Changes in the effective tax rate are largely attributable to changes in the mix of pretax income among our various taxing jurisdictions. Additional information about income taxes is included in Note 5 to our consolidated financial statements.
51

Financial Condition, Liquidity, and Capital Resources We focus on our ability to generate cash flows from operations. The cash generated from operations is used to fund our capital expenditure plans, and cash in excess of our capital expenditure needs is available to fund our acquisition strategy, to reduce debt levels, and to pay dividends and repurchase stock. We have generated cash flows from operations in excess of $200 million in each of the past 13 years, and cash flows from operations in excess of $100 million in each of the past 20 years. We refer to the amount of cash generated from operations in excess of our capital expenditure needs and net of proceeds from the sale of assets as "free cash," a measure which management uses to evaluate our ability to fund acquisitions, repay debt, and otherwise enhance stockholder value through stock repurchases or dividends. Vishay has generated positive "free cash" in each of the past 18 years, and "free cash" in excess of $80 million in each of the past 13 years. In this volatile economic environment, we continue to focus on the generation of free cash, including an emphasis on cost controls. We continued to generate positive cash flows from operations and free cash in line with our history during the year ended December 31, 2014. There is no assurance, however, that we will be able to continue to generate cash flows from operations and free cash at the same levels, or at all, going forward if the current economic environment worsens. Beginning in the fourth fiscal quarter of 2010, we have reacted to favorable market conditions to significantly reshape the company's capital structure. We have completed three issuances of low-coupon convertible debentures since the fourth fiscal quarter of 2010, each of which matures thirty years from the date of issuance. We utilized the proceeds of those debenture offerings to repurchase 44.3 million shares of our common stock, representing approximately 24% of our outstanding stock prior to implementing these initiatives. In the third fiscal quarter of 2013, a holder of our exchangeable unsecured notes exercised its option to exchange $56.4 million principal amount of the notes for 3.7 million shares of our common stock. The exchange increased the number of our common shares outstanding, but had no effect on the calculation of the weighted average shares outstanding used for computing diluted earnings per share because our earnings per share computation assumes that the exchangeable unsecured notes would be converted, while also reducing our outstanding debt and improving our ratio of total debt to Vishay stockholders' equity. We also entered into a new, larger, revolving credit facility in 2010, which was amended and restated on August 8, 2013. The amended and restated credit facility extends the term of our available credit, secures lower interest rates than we were previously paying for the next five years, and provides us with additional financial flexibility to pursue our growth plan. The total revolving commitment of our credit facility increased to $640 million and we have the ability to request up to an additional $50 million of incremental commitments, subject to the satisfaction of certain conditions. At December 31, 2014 and 2013, $200 million and $114 million, respectively, were outstanding under our credit facility. The credit facility provides a revolving commitment through August 8, 2018. Borrowings under the credit facility bear interest at LIBOR plus an interest margin. The applicable interest margin is based on our leverage ratio. Based on our current leverage ratio, borrowings bear interest at LIBOR plus 1.75%. The interest rate on our borrowings will increase to LIBOR plus 2.00% if our leverage ratio equals or exceeds 2.50 to 1 and will decrease to LIBOR plus 1.50% if our leverage ratio decreases below 1.50 to 1. We are also required to pay facility fees on the entire commitment amount based on our leverage ratio. Based on our current leverage ratio, the facility fee is 0.35% per annum. Such facility fee will increase to 0.50% per annum if our leverage ratio equals or exceeds 2.50 to 1 and will decrease to 0.30% per annum if our leverage ratio decreases below 1.50 to 1. The amendment and restatement of the credit facility also removed certain restrictions related to the incurrence and repayment of certain intercompany indebtedness, mergers, liquidations, and transfers of ownership of wholly owned subsidiaries that were present in the original credit agreement. These changes will enable us to streamline our complex subsidiary structure and provide greater operating flexibility. The borrowings under the credit facility are secured by a lien on substantially all assets, including accounts receivable, inventory, machinery and equipment, and general intangibles (but excluding real estate, intellectual property registered or licensed for use in, or arising under the laws of, any country other than the United States, assets located outside of the United States and deposit and securities accounts), of Vishay and certain significant subsidiaries located in the United States, and pledges of stock in certain significant domestic and foreign subsidiaries; and are guaranteed by certain significant subsidiaries. Certain of our subsidiaries are permitted to borrow under the credit facility, subject to the satisfaction of specified conditions. Any borrowings by these subsidiaries under the credit facility will be guaranteed by Vishay and certain subsidiaries. The credit facility also limits or restricts us, from, among other things, incurring indebtedness, incurring liens on assets, making investments and acquisitions, and making asset sales, and making other restricted payments, and requires us to comply with other covenants, including the maintenance of specific financial ratios. The financial maintenance covenants include (a) an interest expense coverage ratio of not less than 2.00 to 1; and (b) a leverage ratio of not more than 3.25 to 1 (and a pro forma ratio of 2.75 to 1 on the date of incurrence of additional debt). The computation of these ratios is prescribed in Article VI of the Credit Agreement between Vishay Intertechnology, Inc. and JPMorgan Chase Bank, N.A., which has been filed with the SEC as Exhibit 10.1 to our current report on Form 8-K filed August 8, 2013. We were in compliance with all financial covenants under the credit facility at December 31, 2014. Our interest expense coverage ratio and leverage ratio were 13.22 to 1 and 1.89 to 1, respectively. We expect to continue to be in compliance with these covenants based on current projections. If we are not in compliance with all of the required financial covenants, the credit facility could be terminated by the lenders, and all amounts outstanding pursuant to the credit facility could become immediately payable. Additionally, our exchangeable unsecured notes due 2102 and our convertible senior debentures due 2040, due 2041, and due 2042 have cross-default provisions that could accelerate repayment in the event the indebtedness under the credit facility is accelerated.
52

Our permitted capacity to repurchase shares of our outstanding common stock or pay cash dividends under the credit facility increases each quarter by an amount equal to 20% of net income. At December 31, 2014, our credit facility allowed us to repurchase our common stock or pay cash dividends up to $192.7 million. On February 3, 2014, our Board of Directors instituted a quarterly dividend payment program and declared the first cash dividend in the history of Vishay. Cash dividends of $0.06 per share of common stock and Class B common stock were paid on March 27, 2014, June 26, 2014, September 18, 2014, and December 16, 2014 to stockholders of record at the close of business on March 3, 2014, June 12, 2014, August 28, 2014, and November 26, 2014, respectively. The amount and timing of any future stock repurchases or cash dividend payments remains subject to authorization of our Board of Directors. The balance of our revolving credit facility was $114 million at December 31, 2013. We borrowed $160 million and repaid $74 million on our credit facility during the year ended December 31, 2014. Included in the borrowings is $53 million borrowed to partially fund the Capella acquisition while achieving future flexibility given the legal entity and financial structure utilized for the acquisition. Subsequent to the acquisition of the noncontrolling interest in Capella on December 31, 2014, we expect to repatriate cash from current earnings of non-U.S. subsidiaries to the United States primarily to repay those borrowings on the revolving credit facility, and also to realign the acquired entity structure to have Capella's U.S. subsidiary directly owned by Vishay Intertechnology, Inc. The average outstanding balance on our credit facility calculated at fiscal month-ends was $152 million and the highest amount outstanding on our credit facility at a month end was $206 million during the year ended December 31, 2014. The convertible debentures due 2042 became convertible subsequent to the September 27, 2014 evaluation of the conversion criteria, due to the sale price of our common stock exceeding 130% of the conversion price for the applicable period in the third fiscal quarter of 2014. The debentures remained convertible until December 31, 2014, at which time the conversion criteria was reevaluated. The debentures due 2042 did not meet the conversion criteria as of December 31, 2014 and are not currently convertible. The conversion criteria of the debentures will continue to be evaluated and the debentures may become convertible again in the future. At the direction of our Board of Directors, we intend, upon conversion, to repay the principal amount of the convertible debentures in cash and settle any additional amounts in shares of our common stock. We intend to finance the principal amount of any converted debentures using borrowings under our credit facility. Accordingly, the debt component of the convertible debentures due 2042 remained classified as a non-current liability in the consolidated balance sheets during the period the debentures were convertible. Management expects to periodically pay down the balance of our revolving credit facility with available cash or use the credit facility to meet short-term financing needs. We expect that cash on-hand and cash flows from operations will be sufficient to meet our longer-term financing needs related to normal operating requirements, regular dividend payments, and our research and development and capital expenditure plans. Additional acquisition activity, share repurchases, or conversion of our convertible debentures may require additional borrowing under our credit facility or may otherwise require us to incur additional debt. No principal payments on our outstanding debt are due before the maturity of our revolving credit facility in August 2018. Substantially all of our December 31, 2014 cash and cash equivalents and short-term investments balances were held by our non-U.S. subsidiaries. At the present time, we expect that cash and profits generated by our non-U.S. subsidiaries prior to 2014, and cash generated in 2014 which is not funding the dividend program or the Capella acquisition, will continue to be reinvested outside of the United States indefinitely. Upon distribution of those earnings in the form of dividends or otherwise, we would be subject to U.S. income taxes (subject to an adjustment for foreign tax credits), state income taxes, incremental foreign income taxes, and withholding taxes payable to various foreign countries. We expect to fund the quarterly dividend program initiated in February 2014, by, at least in part, repatriating current year income of certain non-U.S. subsidiaries and providing appropriate U.S. federal and state income taxes, incremental foreign income taxes, and withholding taxes payable on that current period non-U.S. income. Additionally, our substantially undrawn credit facility provides us with significant liquidity in the United States. We invest a portion of our excess cash in highly liquid, high-quality instruments with maturities greater than 90 days, but less than 1 year, which we classify as short-term investments on our consolidated balance sheets. As these investments were funded using a portion of excess cash and represent a significant aspect of our cash management strategy, we include the investments in the calculation of net cash and short-term investments (debt). The interest rates on our short-term investments average 0.6% and are approximately 30 basis points higher than interest rates on our cash accounts. Transactions related to these investments are classified as investing activities on our consolidated statements of cash flows.
53
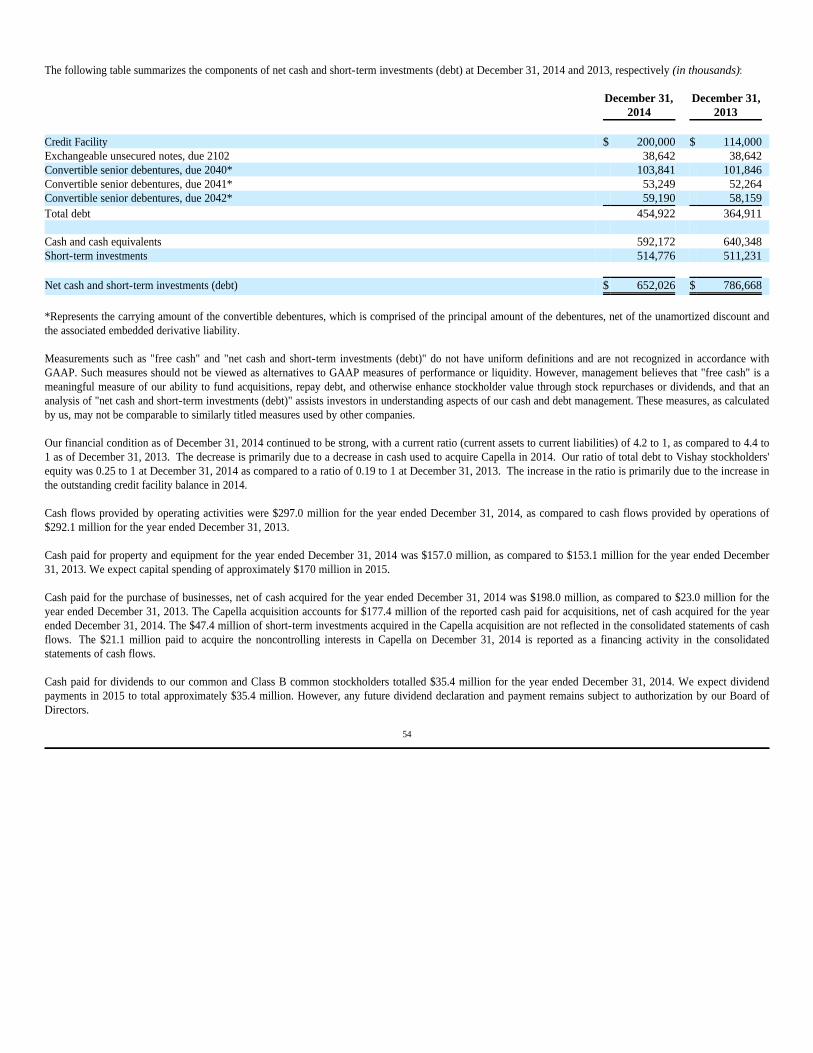
The following table summarizes the components of net cash and short-term investments (debt) at December 31, 2014 and 2013, respectively (in thousands):
*Represents the carrying amount of the convertible debentures, which is comprised of the principal amount of the debentures, net of the unamortized discount and the associated embedded derivative liability. Measurements such as "free cash" and "net cash and short-term investments (debt)" do not have uniform definitions and are not recognized in accordance with GAAP. Such measures should not be viewed as alternatives to GAAP measures of performance or liquidity. However, management believes that "free cash" is a meaningful measure of our ability to fund acquisitions, repay debt, and otherwise enhance stockholder value through stock repurchases or dividends, and that an analysis of "net cash and short-term investments (debt)" assists investors in understanding aspects of our cash and debt management. These measures, as calculated by us, may not be comparable to similarly titled measures used by other companies. Our financial condition as of December 31, 2014 continued to be strong, with a current ratio (current assets to current liabilities) of 4.2 to 1, as compared to 4.4 to 1 as of December 31, 2013. The decrease is primarily due to a decrease in cash used to acquire Capella in 2014. Our ratio of total debt to Vishay stockholders' equity was 0.25 to 1 at December 31, 2014 as compared to a ratio of 0.19 to 1 at December 31, 2013. The increase in the ratio is primarily due to the increase in the outstanding credit facility balance in 2014. Cash flows provided by operating activities were $297.0 million for the year ended December 31, 2014, as compared to cash flows provided by operations of $292.1 million for the year ended December 31, 2013. Cash paid for property and equipment for the year ended December 31, 2014 was $157.0 million, as compared to $153.1 million for the year ended December 31, 2013. We expect capital spending of approximately $170 million in 2015. Cash paid for the purchase of businesses, net of cash acquired for the year ended December 31, 2014 was $198.0 million, as compared to $23.0 million for the year ended December 31, 2013. The Capella acquisition accounts for $177.4 million of the reported cash paid for acquisitions, net of cash acquired for the year ended December 31, 2014. The $47.4 million of short-term investments acquired in the Capella acquisition are not reflected in the consolidated statements of cash flows. The $21.1 million paid to acquire the noncontrolling interests in Capella on December 31, 2014 is reported as a financing activity in the consolidated statements of cash flows. Cash paid for dividends to our common and Class B common stockholders totalled $35.4 million for the year ended December 31, 2014. We expect dividend payments in 2015 to total approximately $35.4 million. However, any future dividend declaration and payment remains subject to authorization by our Board of Directors.
54
December 31,
2014 December 31,
2013 Credit Facility $ 200,000 $ 114,000 Exchangeable unsecured notes, due 2102 38,642 38,642 Convertible senior debentures, due 2040* 103,841 101,846 Convertible senior debentures, due 2041* 53,249 52,264 Convertible senior debentures, due 2042* 59,190 58,159 Total debt 454,922 364,911 Cash and cash equivalents 592,172 640,348 Short-term investments 514,776 511,231 Net cash and short-term investments (debt) $ 652,026 $ 786,668
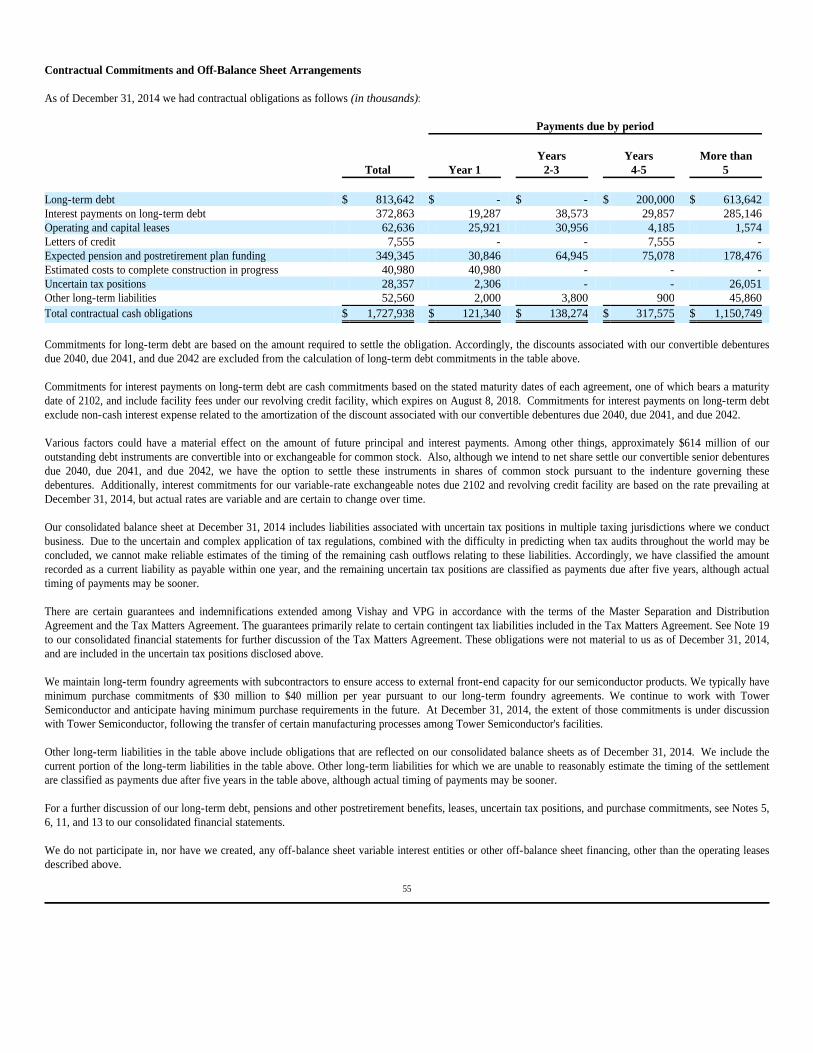
Contractual Commitments and Off-Balance Sheet Arrangements As of December 31, 2014 we had contractual obligations as follows (in thousands):
Commitments for long-term debt are based on the amount required to settle the obligation. Accordingly, the discounts associated with our convertible debentures due 2040, due 2041, and due 2042 are excluded from the calculation of long-term debt commitments in the table above. Commitments for interest payments on long-term debt are cash commitments based on the stated maturity dates of each agreement, one of which bears a maturity date of 2102, and include facility fees under our revolving credit facility, which expires on August 8, 2018. Commitments for interest payments on long-term debt exclude non-cash interest expense related to the amortization of the discount associated with our convertible debentures due 2040, due 2041, and due 2042. Various factors could have a material effect on the amount of future principal and interest payments. Among other things, approximately $614 million of our outstanding debt instruments are convertible into or exchangeable for common stock. Also, although we intend to net share settle our convertible senior debentures due 2040, due 2041, and due 2042, we have the option to settle these instruments in shares of common stock pursuant to the indenture governing these debentures. Additionally, interest commitments for our variable-rate exchangeable notes due 2102 and revolving credit facility are based on the rate prevailing at December 31, 2014, but actual rates are variable and are certain to change over time. Our consolidated balance sheet at December 31, 2014 includes liabilities associated with uncertain tax positions in multiple taxing jurisdictions where we conduct business. Due to the uncertain and complex application of tax regulations, combined with the difficulty in predicting when tax audits throughout the world may be concluded, we cannot make reliable estimates of the timing of the remaining cash outflows relating to these liabilities. Accordingly, we have classified the amount recorded as a current liability as payable within one year, and the remaining uncertain tax positions are classified as payments due after five years, although actual timing of payments may be sooner. There are certain guarantees and indemnifications extended among Vishay and VPG in accordance with the terms of the Master Separation and Distribution Agreement and the Tax Matters Agreement. The guarantees primarily relate to certain contingent tax liabilities included in the Tax Matters Agreement. See Note 19 to our consolidated financial statements for further discussion of the Tax Matters Agreement. These obligations were not material to us as of December 31, 2014, and are included in the uncertain tax positions disclosed above. We maintain long-term foundry agreements with subcontractors to ensure access to external front-end capacity for our semiconductor products. We typically have minimum purchase commitments of $30 million to $40 million per year pursuant to our long-term foundry agreements. We continue to work with Tower Semiconductor and anticipate having minimum purchase requirements in the future. At December 31, 2014, the extent of those commitments is under discussion with Tower Semiconductor, following the transfer of certain manufacturing processes among Tower Semiconductor's facilities. Other long-term liabilities in the table above include obligations that are reflected on our consolidated balance sheets as of December 31, 2014. We include the current portion of the long-term liabilities in the table above. Other long-term liabilities for which we are unable to reasonably estimate the timing of the settlement are classified as payments due after five years in the table above, although actual timing of payments may be sooner. For a further discussion of our long-term debt, pensions and other postretirement benefits, leases, uncertain tax positions, and purchase commitments, see Notes 5, 6, 11, and 13 to our consolidated financial statements. We do not participate in, nor have we created, any off-balance sheet variable interest entities or other off-balance sheet financing, other than the operating leases described above.
55
Payments due by period
Total Year 1 Years
2-3 Years
4-5 More than
5 Long-term debt $ 813,642 $ - $ - $ 200,000 $ 613,642 Interest payments on long-term debt 372,863 19,287 38,573 29,857 285,146 Operating and capital leases 62,636 25,921 30,956 4,185 1,574 Letters of credit 7,555 - - 7,555 - Expected pension and postretirement plan funding 349,345 30,846 64,945 75,078 178,476 Estimated costs to complete construction in progress 40,980 40,980 - - - Uncertain tax positions 28,357 2,306 - - 26,051 Other long-term liabilities 52,560 2,000 3,800 900 45,860 Total contractual cash obligations $ 1,727,938 $ 121,340 $ 138,274 $ 317,575 $ 1,150,749
Inflation Normally, inflation does not have a significant impact on our operations as our products are not generally sold on long-term contracts. Consequently, we can adjust our selling prices, to the extent permitted by competition, to reflect cost increases caused by inflation. See also "Commodity Price Risk" included in Item 7A, "Quantitative and Qualitative Disclosures About Market Risk" for additional related information. Recent Accounting Pronouncements In May 2014, the Financial Accounting Standards Board ("FASB") issued Accounting Standards Update ("ASU") No. 2014-09, Revenue from Contracts with Customers (Topic 606). The ASU is the result of a convergence project between the FASB and the International Accounting Standards Board to clarify the principles for recognizing revenue and to develop a common revenue standard for U.S. GAAP and International Financial Reporting Standards. The ASU removes inconsistencies and weaknesses in revenue requirements; provides a more robust framework for addressing revenue issues; improves comparability of revenue recognition practices across entities, industries, jurisdictions, and capital markets; provides more useful information to users of financial statements through expanded disclosure requirements; and simplifies the preparation of financial statements by reducing the number of requirements to which an entity must refer. The ASU is effective for us for interim and annual periods beginning after January 1, 2017. We are currently evaluating the effect of the ASU on our revenue contracts.
56

Market Risk Disclosure We are exposed to certain financial risks, including fluctuations in foreign currency exchange rates, interest rates, and commodity prices. We manage our exposure to these market risks through internally established policies and procedures and, when deemed appropriate, through the use of derivative financial instruments. Our policies do not allow speculation in derivative instruments for profit or execution of derivative instrument contracts for which there are no underlying exposures. We do not use financial instruments for trading purposes and we are not a party to any leveraged derivatives. We monitor our underlying market risk exposures on an ongoing basis and believe that we can modify or adapt our hedging strategies as needed. Interest Rate Risk We are exposed to changes in interest rates as a result of our borrowing activities and our cash balances. On a selective basis, we have in the past entered into interest rate swap or cap agreements to reduce the potential negative impact that increases in interest rates could have on our outstanding variable rate debt. As of December 31, 2014, 2013, and 2012 we did not have any outstanding interest rate swap or cap agreements. We are exposed to changes in interest rates on our exchangeable notes due 2102. The exchangeable notes, of which $38.6 million are outstanding, bear interest at LIBOR (reset quarterly). The interest paid on our credit facility is based on a LIBOR spread. At December 31, 2014, we had $200 million outstanding under the revolving credit facility. The present amounts outstanding under the revolving credit commitment bears interest at LIBOR plus 1.75%. Our convertible senior debentures due 2040, due 2041, and due 2042 bear interest at a fixed rate, and accordingly are not subject to interest rate fluctuation risks. At December 31, 2014, we have $592.2 million of cash and cash equivalents and $514.8 million of short-term investments, which earn interest at various variable rates. Based on the debt and cash positions at December 31, 2014, we would expect a 50 basis point increase or decrease in interest rates to increase or decrease our annualized net earnings by approximately $3.1 million. See Note 6 to our consolidated financial statements for additional information about our long-term debt. Also see "Economic Outlook and Impact on Operations and Future Financial Results" included in Item 7, "Management's Discussion and Analysis of Financial Condition and Results of Operations" for additional discussion of market risks. Foreign Exchange Risk We are exposed to foreign currency exchange rate risks, particularly due to market values of transactions in currencies other than the functional currencies of certain subsidiaries. We occasionally use forward exchange contracts to economically hedge a portion of these exposures. Beginning in the third fiscal quarter of 2014, we entered into forward contracts with a highly-rated financial institution to mitigate the foreign currency risk associated with an intercompany loan denominated in a currency other than the legal entity's functional currency. The notional amount of the forward contract was $48 million as of December 31, 2014. The intercompany loan was used to finance a portion of the purchase price for Capella. The forward contracts settle monthly and are expected to be renewed at our discretion on a monthly basis until the intercompany loan is repaid. The forward contract was renewed on the last day of the year. We have not designated the forward contract as a hedge for accounting purposes, and as such the change in the fair value of contract is recognized in our consolidated statements of operations as a component of other income (expense). We do not utilize derivatives or other financial instruments for trading or other speculative purposes. Our significant foreign subsidiaries are located in Germany, Israel, and Asia. We finance our operations in Europe and certain locations in Asia in local currencies. Our operations in Israel and most significant locations in Asia are largely financed in U.S. dollars, but these subsidiaries also have significant transactions in local currencies. Our exposure to foreign currency risk is mitigated to the extent that the costs incurred and the revenues earned in a particular currency offset one another. Our exposure to foreign currency risk is more pronounced in Israel, the Czech Republic, and China because the percentage of expenses denominated in Israeli shekels, Czech koruna, and Chinese renminbi to total expenses is much greater than the percentage of sales denominated in Israeli shekels, Czech koruna, and Chinese renminbi to total sales. Therefore, if the Israeli shekel, Czech koruna, and Chinese renminbi strengthen against all or most of our other major currencies, our operating profit is reduced. Where possible, we maintain local currency denominated cash balances in these countries approximately equal to the local currency liabilities to naturally hedge our exposures. We also have a slightly higher percentage of euro-denominated sales than expenses. Therefore, when the euro strengthens against all or most of our other major currencies, our operating profit is slightly increased. Accordingly, we monitor several important cross-rates. Capella holds a significant amount of its financial assets denominated in a currency other than its functional currency and will continue to do so until the assets mature or are liquidated. Exchange gains and losses arising from remeasurement of these financial assets into the functional currency of Capella are included in the results of operations.
57
Item 7A. QUANTITATIVE AND QUALITATIVE DISCLOSURES ABOUT MARKET RISK
We have performed sensitivity analyses of our consolidated foreign exchange risk as of December 31, 2014 and 2013, using a model that measures the change in the values arising from a hypothetical 10% adverse movement in foreign currency exchange rates relative to the U.S. dollar, with all other variables held constant. The foreign currency exchange rates we used were based on market rates in effect at December 31, 2014 and 2013. The sensitivity analyses indicated that a hypothetical 10% adverse movement in foreign currency exchange rates would impact our net earnings by approximately $2.7 million and $2.4 million at December 31, 2014 and December 31, 2013, respectively, although individual line items in our consolidated statement of operations would be materially affected. For example, a 10% weakening in all foreign currencies would decrease the U.S. dollar equivalent of operating income generated in foreign currencies, which would be offset by foreign exchange gains of our foreign subsidiaries that have significant transactions in U.S. dollars or have the U.S. dollar as their functional currency. A change in the mix of the currencies in which we transact our business could have a material effect on the estimated impact of the hypothetical 10% movement in the value of the U.S. dollar. Furthermore, the timing of cash receipts and disbursements could result in materially different actual results versus the hypothetical 10% movement in the value of the U.S. dollar, particularly if there are significant changes in exchange rates in a short period of time. Commodity Price Risk Although most materials incorporated in our products are available from a number of sources, certain materials are available only from a relatively limited number of suppliers or are subject to significant price volatility. Our results of operations may be materially and adversely affected if we have difficulty obtaining these raw materials, the quality of available raw materials deteriorates, or there are significant price changes for these raw materials. The determination that any of the raw materials used in our products are conflict minerals originating from the Democratic Republic of the Congo and adjoining countries could increase the probability that we will encounter the challenges noted above, incur additional expenses to comply with government regulations, and face public scrutiny. For periods in which the prices of these raw materials are rising, we may be unable to pass on the increased cost to our customers which would result in decreased margins for the products in which they are used. For periods in which the prices are declining, we may be required to write down our inventory carrying cost of these raw materials, since we record our inventory at the lower of cost or market. Depending on the extent of the difference between market price and our carrying cost, this write-down could have a material adverse effect on our net earnings. We also may need to record losses for adverse purchase commitments for these materials in periods of declining prices. Silicon wafers are the most important raw material for the manufacturing of our semiconductor products. Silicon wafers are manufactured from high-purity silicon, a metalloid. There have at times been industry-wide shortages of high-purity silicon resulting primarily from growing demand of the electronic component and solar power industries, and limited growth in high-purity silicon manufacturing capacities. Shifts in demand for high-purity silicon and in turn, silicon wafers, have resulted in significant fluctuation in prices of silicon wafers. We are a major consumer of the world's annual production of tantalum, a metal used in the manufacturing of tantalum capacitors. There are few suppliers that process tantalum ore into capacitor grade tantalum powder. Palladium, a metal used to produce multi-layer ceramic capacitors, is currently found primarily in South Africa and Russia. Palladium is a commodity metal that is subject to price volatility. We periodically enter into short-term commitments to purchase palladium. Certain metals used in the manufacture of our products, such as copper, are traded on active markets, and can be subject to significant price volatility. Our policy is to enter into short-term commitments to purchase defined portions of annual consumption of these metals if market prices decline below budget. We estimate that a 10% increase or decrease in the costs of raw materials subject to commodity price risk would decrease or increase our net earnings by $6.4 million, assuming that such changes in our costs have no impact on the selling prices of our products and that we have no pending commitments to purchase metals at fixed prices.
58
The financial statements required by this Item are included herein, commencing on page F-1 of this report.
None.
Conclusion Regarding the Effectiveness of Disclosure Controls and Procedures An evaluation was performed under the supervision and with the participation of our management, including the Chief Executive Officer ("CEO") and Chief Financial Officer ("CFO"), of the effectiveness of the design and operation of our disclosure controls and procedures, as such term is defined under Rule 13a-15(e) and Rule 15d-15(e) promulgated under the Securities Exchange Act of 1934, as amended. Based on that evaluation, our CEO and CFO concluded that our disclosure controls and procedures were effective as of the end of the period covered by this annual report to ensure that information required to be disclosed in reports that we file or submit under the Exchange Act is: (1) recorded, processed, summarized, and reported within the time periods specified in the SEC's rules and forms; and (2) accumulated and communicated to our management, including our CEO and CFO, as appropriate to allow timely decisions regarding required disclosure. Management's Report on Internal Control Over Financial Reporting Our management is responsible for establishing and maintaining adequate internal control over financial reporting, as such term is defined in Exchange Act Rules 13a-15(f) and 15d-15(f). Under the supervision and with the participation of our management, including our CEO and CFO, we conducted an evaluation of the effectiveness of our internal control over financial reporting as of December 31, 2014 based on the 2013 framework set forth in Internal Control – Integrated Framework issued by the Committee of Sponsoring Organizations of the Treadway Commission. Based on that evaluation, our management concluded that our internal control over financial reporting was effective as of December 31, 2014. Ernst & Young LLP has issued an attestation report on the effectiveness of our internal control over financial reporting, as stated in their report which is included herein on page F-3. Changes in Internal Control Over Financial Reporting There were no changes in our internal control over financial reporting during our last fiscal quarter that have materially affected, or are reasonably likely to materially affect, our internal control over financial reporting. Certifications The certifications of our CEO and CFO pursuant to Section 302 of the Sarbanes-Oxley Act of 2002 are filed as Exhibits 31.1 and 31.2 to this Annual Report on Form 10-K. We have also filed with the New York Stock Exchange the most recent Annual Certification as required by Section 303A.12(a) of the New York Stock Exchange Listed Company Manual.
59
Item 8. FINANCIAL STATEMENTS AND SUPPLEMENTARY DATA
Item 9. CHANGES IN AND DISAGREEMENTS WITH ACCOUNTANTS ON ACCOUNTING AND FINANCIAL DISCLOSURE
Item 9A. CONTROLS AND PROCEDURES

None.
We have a code of ethics applicable to our Chief Executive Officer, Chief Financial Officer, Principal Accounting Officer or Controller, and financial managers. The text of this code has been posted on our website. To view the code, go to our website at ir.vishay.com and click on Corporate Governance. You can obtain a printed copy of this code, free of charge, by contacting us at the following address:
Corporate Investor Relations Vishay Intertechnology, Inc. 63 Lancaster Avenue Malvern, PA 19355-2143
It is our intention to satisfy the disclosure requirement under Item 5.05 of Form 8-K regarding any amendment to, or any waiver from, a provision of this code by posting such information on our website, at the aforementioned address and location. Certain information required under this Item with respect to our Executive Officers is set forth in Part I hereof under the caption "Executive Officers of the Registrant."
Other information required under this Item will be contained in our definitive proxy statement, which will be filed within 120 days of December 31, 2014, our most recent fiscal year end, and is incorporated herein by reference.
Information required under this Item will be contained in our definitive proxy statement, which will be filed within 120 days of December 31, 2014, our most recent fiscal year end, and is incorporated herein by reference
Information required under this Item will be contained in our definitive proxy statement, which will be filed within 120 days of December 31, 2014, our most recent fiscal year end, and is incorporated herein by reference.
Information required under this Item will be contained in our definitive proxy statement, which will be filed within 120 days of December 31, 2014, our most recent fiscal year end, and is incorporated herein by reference.
Information required under this Item will be contained in our definitive proxy statement, which will be filed within 120 days of December 31, 2014, our most recent fiscal year end, and is incorporated herein by reference.
60
Item 9B. OTHER INFORMATION
Item 10. DIRECTORS, EXECUTIVE OFFICERS, AND CORPORATE GOVERNANCE
Item 11. EXECUTIVE COMPENSATION
Item 12. SECURITY OWNERSHIP OF CERTAIN BENEFICIAL OWNERS AND MANAGEMENT AND RELATED STOCKHOLDER MATTERS
Item 13. CERTAIN RELATIONSHIPS AND RELATED TRANSACTIONS, AND DIRECTOR INDEPENDENCE
Item 14. PRINCIPAL ACCOUNTING FEES AND SERVICES
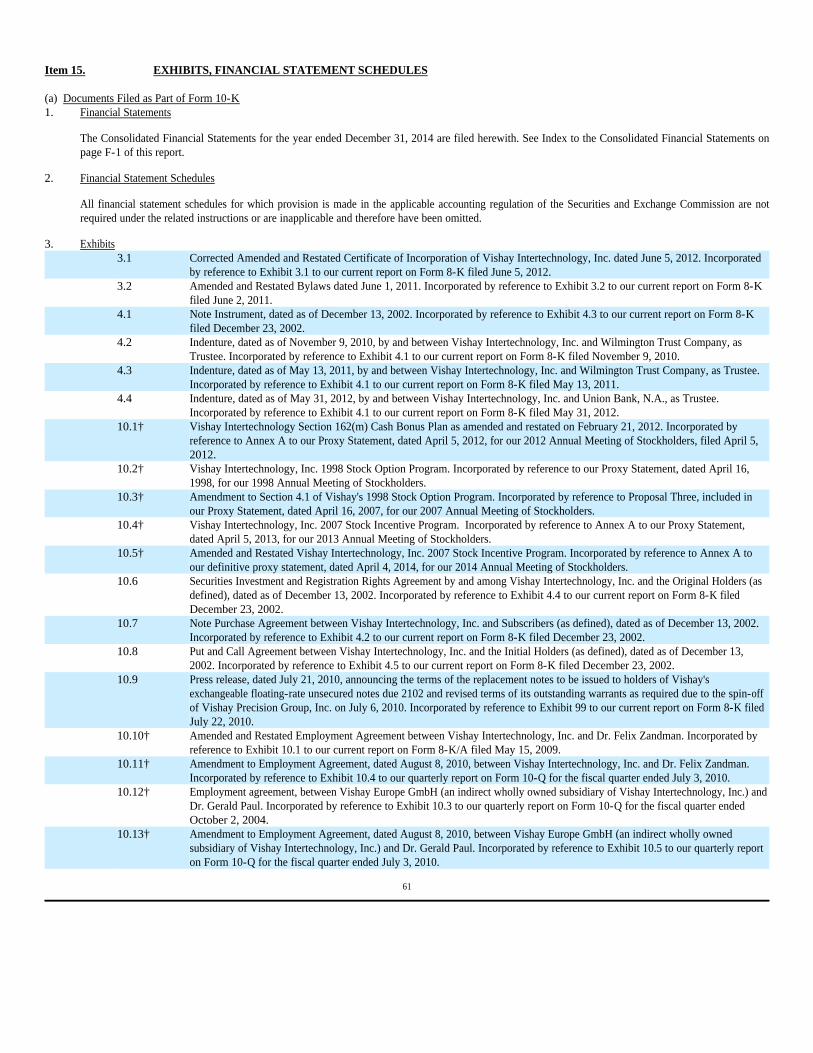
(a) Documents Filed as Part of Form 10-K
The Consolidated Financial Statements for the year ended December 31, 2014 are filed herewith. See Index to the Consolidated Financial Statements on page F-1 of this report.
All financial statement schedules for which provision is made in the applicable accounting regulation of the Securities and Exchange Commission are not required under the related instructions or are inapplicable and therefore have been omitted.
61
Item 15. EXHIBITS, FINANCIAL STATEMENT SCHEDULES
1. Financial Statements
2. Financial Statement Schedules
3. Exhibits 3.1 Corrected Amended and Restated Certificate of Incorporation of Vishay Intertechnology, Inc. dated June 5, 2012. Incorporated
by reference to Exhibit 3.1 to our current report on Form 8-K filed June 5, 2012. 3.2 Amended and Restated Bylaws dated June 1, 2011. Incorporated by reference to Exhibit 3.2 to our current report on Form 8-K
filed June 2, 2011. 4.1 Note Instrument, dated as of December 13, 2002. Incorporated by reference to Exhibit 4.3 to our current report on Form 8-K
filed December 23, 2002. 4.2 Indenture, dated as of November 9, 2010, by and between Vishay Intertechnology, Inc. and Wilmington Trust Company, as
Trustee. Incorporated by reference to Exhibit 4.1 to our current report on Form 8-K filed November 9, 2010. 4.3 Indenture, dated as of May 13, 2011, by and between Vishay Intertechnology, Inc. and Wilmington Trust Company, as Trustee.
Incorporated by reference to Exhibit 4.1 to our current report on Form 8-K filed May 13, 2011. 4.4 Indenture, dated as of May 31, 2012, by and between Vishay Intertechnology, Inc. and Union Bank, N.A., as Trustee.
Incorporated by reference to Exhibit 4.1 to our current report on Form 8-K filed May 31, 2012. 10.1† Vishay Intertechnology Section 162(m) Cash Bonus Plan as amended and restated on February 21, 2012. Incorporated by
reference to Annex A to our Proxy Statement, dated April 5, 2012, for our 2012 Annual Meeting of Stockholders, filed April 5, 2012.
10.2† Vishay Intertechnology, Inc. 1998 Stock Option Program. Incorporated by reference to our Proxy Statement, dated April 16, 1998, for our 1998 Annual Meeting of Stockholders.
10.3† Amendment to Section 4.1 of Vishay's 1998 Stock Option Program. Incorporated by reference to Proposal Three, included in our Proxy Statement, dated April 16, 2007, for our 2007 Annual Meeting of Stockholders.
10.4† Vishay Intertechnology, Inc. 2007 Stock Incentive Program. Incorporated by reference to Annex A to our Proxy Statement, dated April 5, 2013, for our 2013 Annual Meeting of Stockholders.
10.5† Amended and Restated Vishay Intertechnology, Inc. 2007 Stock Incentive Program. Incorporated by reference to Annex A to our definitive proxy statement, dated April 4, 2014, for our 2014 Annual Meeting of Stockholders.
10.6 Securities Investment and Registration Rights Agreement by and among Vishay Intertechnology, Inc. and the Original Holders (as defined), dated as of December 13, 2002. Incorporated by reference to Exhibit 4.4 to our current report on Form 8-K filed December 23, 2002.
10.7 Note Purchase Agreement between Vishay Intertechnology, Inc. and Subscribers (as defined), dated as of December 13, 2002. Incorporated by reference to Exhibit 4.2 to our current report on Form 8-K filed December 23, 2002.
10.8 Put and Call Agreement between Vishay Intertechnology, Inc. and the Initial Holders (as defined), dated as of December 13, 2002. Incorporated by reference to Exhibit 4.5 to our current report on Form 8-K filed December 23, 2002.
10.9 Press release, dated July 21, 2010, announcing the terms of the replacement notes to be issued to holders of Vishay's exchangeable floating-rate unsecured notes due 2102 and revised terms of its outstanding warrants as required due to the spin-off of Vishay Precision Group, Inc. on July 6, 2010. Incorporated by reference to Exhibit 99 to our current report on Form 8-K filed July 22, 2010.
10.10† Amended and Restated Employment Agreement between Vishay Intertechnology, Inc. and Dr. Felix Zandman. Incorporated by reference to Exhibit 10.1 to our current report on Form 8-K/A filed May 15, 2009.
10.11† Amendment to Employment Agreement, dated August 8, 2010, between Vishay Intertechnology, Inc. and Dr. Felix Zandman. Incorporated by reference to Exhibit 10.4 to our quarterly report on Form 10-Q for the fiscal quarter ended July 3, 2010.
10.12† Employment agreement, between Vishay Europe GmbH (an indirect wholly owned subsidiary of Vishay Intertechnology, Inc.) and Dr. Gerald Paul. Incorporated by reference to Exhibit 10.3 to our quarterly report on Form 10-Q for the fiscal quarter ended October 2, 2004.
10.13† Amendment to Employment Agreement, dated August 8, 2010, between Vishay Europe GmbH (an indirect wholly owned subsidiary of Vishay Intertechnology, Inc.) and Dr. Gerald Paul. Incorporated by reference to Exhibit 10.5 to our quarterly report on Form 10-Q for the fiscal quarter ended July 3, 2010.

62
10.14† Amendment to Employment Agreement, dated August 28, 2011, between Vishay Europe GmbH (an indirect wholly owned subsidiary of Vishay Intertechnology, Inc.) and Dr. Gerald Paul. Incorporated by reference to Exhibit 10.3 to our quarterly report on Form 10-Q for the fiscal quarter ended October 1, 2011.
10.15† Employment Agreement between Vishay Israel Ltd. (a wholly owned subsidiary of Vishay Intertechnology, Inc.) and Marc Zandman. Incorporated by reference to Exhibit 10.2 to our quarterly report on Form 10-Q for the fiscal quarter ended October 2, 2004.
10.16† Amendment to Employment Agreement, dated August 8, 2010, between Vishay Israel Ltd. (a wholly owned subsidiary of Vishay Intertechnology, Inc.) and Marc Zandman. Incorporated by reference to Exhibit 10.6 to our quarterly report on Form 10-Q for the fiscal quarter ended July 3, 2010.
10.17† Amendment to Employment Agreement, dated August 30, 2011, between Vishay Israel Ltd. (a wholly owned subsidiary of Vishay Intertechnology, Inc.) and Marc Zandman. Incorporated by reference to Exhibit 10.2 to our quarterly report on Form 10-Q for the fiscal quarter ended October 1, 2011.
10.18† Compensation Matters Agreement, dated August 23, 2011, between Vishay Intertechnology, Inc. and Lori Lipcaman. Incorporated by reference to Exhibit 10.4 to our quarterly report on Form 10-Q for the fiscal quarter ended October 1, 2011.
10.19†
Amendment to Compensation Matters Agreement, dated March 4, 2014, between Vishay Europe GmbH (an indirect wholly owned subsidiary of Vishay Intertechnology, Inc.) and Lori Lipcaman. Incorporated by reference to Exhibit 10.1 to our quarterly report on Form 10-Q for the fiscal quarter ended March 29, 2014.
10.20† Compensation Matters Agreement, dated November 11, 2011, between Vishay Intertechnology, Inc. and Dieter Wunderlich. Incorporated by reference to Exhibit 10.30 to our 2011 annual report on Form 10-K.
10.21† Amendment to Compensation Matters Agreement, dated March 4, 2014, between Vishay Electronic GmbH (an indirect wholly owned subsidiary of Vishay Intertechnology, Inc.) and Dieter Wunderlich. Incorporated by reference to Exhibit 10.2 to our quarterly report on Form 10-Q for the fiscal quarter ended March 29, 2014.
10.22† Terms and Conditions of Johan Vandoorn Employment Agreement, dated January 16, 2012. Incorporated by reference to Exhibit 10.31 to our 2011 annual report on Form 10-K.
10.23† Amendment to Terms and Conditions of Johan Vandoorn Employment Agreement, dated March 4, 2014. Incorporated by reference to Exhibit 10.3 to our quarterly report on Form 10-Q for the fiscal quarter ended March 29, 2014.
10.24† Employment Agreement between Vishay Americas, Inc. (a wholly owned subsidiary of Vishay Intertechnology, Inc.) and David Valletta dated November 21, 2011. Incorporated by reference to Exhibit 10.32 to our 2011 annual report on Form 10-K.
10.25† Amendment to Employment Agreement between Vishay Americas, Inc. (a wholly owned subsidiary of Vishay Intertechnology, Inc.) and David Valletta dated March 4, 2014. Incorporated by reference to Exhibit 10.4 to our quarterly report on Form 10-Q for the fiscal quarter ended March 29, 2014.
10.26† Consulting and Non-Competition Agreement between Vishay Intertechnology, Inc. and Richard N. Grubb. Incorporated by reference to Exhibit 10.17 to our 2008 annual report on Form 10-K.
10.27 Technology License Agreement, dated as of April 1, 2007, by and between International Rectifier Corporation and Vishay Intertechnology, Inc. Incorporated by reference to Exhibit 99.1 to International Rectifier Corporation's current report on Form 8-K filed April 9, 2007.
10.28 Technology License Back Agreement, dated as of April 1, 2007, by and between Vishay Intertechnology, Inc. and International Rectifier Corporation. Incorporated by reference to Exhibit 99.2 to International Rectifier Corporation's current report on Form 8-K filed April 9, 2007.
10.29 Confidential Settlement Agreement and Release, Amendment No. 1 to Transition Buy Back Die Supply Agreement, Amendment No. 2 to Technology License Agreement, Amendment No. 7 to Master Purchase Agreement, and Amendment No. 3 to Asset Purchase Agreement, dated June 25, 2009, by and between Vishay Intertechnology, Inc. and International Rectifier Corporation. Incorporated by reference to Exhibit 10.1 to International Rectifier Corporation's current report on Form 8-K/A filed July 29, 2009.
10.30 Master Separation and Distribution Agreement, dated June 22, 2010, by and among Vishay Intertechnology, Inc. and Vishay Precision Group, Inc. Incorporated by reference to Exhibit 10.1 to our current report on Form 8-K filed June 23, 2010.
10.31 Employee Matters Agreement, dated June 22, 2010, by and among Vishay Intertechnology, Inc. and Vishay Precision Group, Inc. Incorporated by reference to Exhibit 10.2 to our current report on Form 8-K filed June 23, 2010.

__________________ * Confidential treatment has been requested by, and accorded to, VPG with respect to certain portions of this Exhibit. Omitted portions have been filed separately by VPG with the Securities and Exchange Commission. ** Filed herewith. † Denotes a management contract or compensatory plan, contract, or arrangement.
63
10.32 Tax Matters Agreement, dated July 6, 2010, between Vishay Precision Group, Inc. and Vishay Intertechnology, Inc. Incorporated by reference to Exhibit 10.1 to Vishay Precision Group, Inc.'s current report on Form 8-K filed July 7, 2010.
10.33 Trademark License Agreement, dated July 6, 2010, between Vishay Precision Group, Inc. and Vishay Intertechnology, Inc. Incorporated by reference to Exhibit 10.2 to Vishay Precision Group, Inc.'s current report on Form 8-K filed July 7, 2010.
10.34* Supply Agreement, dated July 6, 2010, between Vishay Advanced Technology, Ltd. And Vishay Dale Electronics, Inc. Incorporated by reference to Exhibit 10.4 to Vishay Precision Group, Inc.'s current report on Form 8-K filed July 7, 2010.
10.35* Patent License Agreement, dated July 6, 2010, between Vishay Precision Group, Inc. and Vishay Dale Electronics, Inc. Incorporated by reference to Exhibit 10.6 to Vishay Precision Group, Inc.'s current report on Form 8-K filed July 7, 2010.
10.36 Lease Agreement, dated July 4, 2010, between Vishay Advanced Technology, Ltd. And V.I.E.C. Ltd. Incorporated by reference to Exhibit 10.7 to Vishay Precision Group, Inc.'s current report on Form 8-K filed July 7, 2010.
10.37 Amendment No. 1 to Lease Agreement, dated March 1, 2012, between Vishay Advanced Technology, Ltd. And V.I.E.C. Ltd. Incorporated by reference to Exhibit 10.2 to our quarterly report on Form 10-Q for the fiscal quarter ended March 31, 2012.
10.38* Supply Agreement, dated July 6, 2010, between Vishay Dale Electronics, Inc. and Vishay Advanced Technology, Ltd. Incorporated by reference to Exhibit 10.8 to Vishay Precision Group, Inc.'s current report on Form 8-K filed July 7, 2010.
10.39* Supply Agreement, dated July 6, 2010, between Vishay Measurements Group, Inc. and Vishay S.A. Incorporated by reference to Exhibit 10.9 to Vishay Precision Group, Inc.'s current report on Form 8-K filed July 7, 2010.
10.40* Manufacturing Agreement, dated July 6, 2010, between Vishay S.A. and Vishay Precision Foil GmbH. Incorporated by reference to Exhibit 10.10 to Vishay Precision Group, Inc.'s current report on Form 8-K filed July 7, 2010.
10.41 Intellectual Property License Agreement, dated July 6, 2010, between Vishay S.A. and Vishay Precision Foil GmbH. Incorporated by reference to Exhibit 10.11 to Vishay Precision Group, Inc.'s current report on Form 8-K filed July 7, 2010.
10.42* Supply Agreement, dated July 6, 2010, between Vishay Precision Foil GmbH and Vishay S.A. Incorporated by reference to Exhibit 10.12 to Vishay Precision Group, Inc.'s current report on Form 8-K filed July 7, 2010.
10.43* Intellectual Property License Agreement, dated July 6, 2010, between Vishay S.A. and Vishay Measurements Group, Inc. Incorporated by reference to Exhibit 10.13 to Vishay Precision Group, Inc.'s current report on Form 8-K filed July 7, 2010.
10.44 Lease Agreement between Vishay Alpha Electronics Corporation and Vishay Japan Co., Ltd. Incorporated by reference to Exhibit 10.14 to Vishay Precision Group, Inc.'s current report on Form 8-K filed July 7, 2010.
10.45 Third Amendment and Incremental Facility Agreement dated April 3, 2012, among Vishay Intertechnology, Inc., the Incremental Revolving Lenders party hereto, and JPMorgan Chase Bank, N.A. in its capacities as administrative agent and issuing bank. Incorporated by reference to Exhibit 10.1 to our current report on Form 8-K filed April 3, 2012.
10.46 Credit Agreement, dated as of December 1, 2010, as amended and restated as of August 8, 2013 among Vishay Intertechnology, Inc. and JPMorgan Chase Bank, N.A., as administrative agent and the lenders and other parties thereto. Incorporated by reference to Exhibit 10.1 to our current report on Form 8-K filed August 8, 2013.
10.47†** Vishay Intertechnology, Inc. Key Employee Wealth Accumulation Plan (as amended and restated, effective February 18, 2015). 10.48† Vishay Intertechnology, Inc. Form of Executive Officer Restricted Stock Unit Agreement. Incorporated by reference to Exhibit
10.2 to our Current Report on Form 8-K, filed on May 21, 2014. 10.49† Vishay Intertechnology, Inc. Form of Restricted Stock Unit Agreement. Incorporated by reference to Exhibit 10.3 to our Current
Report on Form 8-K, filed on May 21, 2014. 10.50† Vishay Intertechnology, Inc. Form of Executive Officer Phantom Stock Unit Agreement. Incorporated by reference to Exhibit
10.4 to our Current Report on Form 8-K, filed on May 21, 2014. 21** Subsidiaries of the Registrant. 23.1** Consent of Independent Registered Public Accounting Firm. 31.1** Certification pursuant to Rules 13a-15(e) or 15d-15(e) under the Securities Exchange Act of 1934, as adopted pursuant to
Section 302 of the Sarbanes-Oxley Act of 2002 – Chief Executive Officer. 31.2** Certification pursuant to Rules 13a-15(e) or 15d-15(e) under the Securities Exchange Act of 1934, as adopted pursuant to
Section 302 of the Sarbanes-Oxley Act of 2002 – Chief Financial Officer. 32.1** Certification Pursuant to 18 U.S.C. Section 1350, as adopted pursuant to Section 906 of the Sarbanes-Oxley Act of 2002 –
Chief Executive Officer. 32.2** Certification Pursuant to 18 U.S.C. Section 1350, as adopted pursuant to Section 906 of the Sarbanes-Oxley Act of 2002 –
Chief Financial Officer. 101** Interactive Data File (Annual Report on Form 10-K, for the year ended December 31, 2014, furnished in XBRL (eXtensible
Business Reporting Language)).

SIGNATURES
Pursuant to the requirement of Section 13 or 15(d) of the Securities Exchange Act of 1934, the Registrant has duly caused this report to be signed on its behalf by the undersigned, thereunto duly authorized.
VISHAY INTERTECHNOLOGY, INC.
Pursuant to the requirements of the Securities Exchange Act of 1934, this report has been signed below by the following persons on behalf of the Registrant and in the capacities and on the dates indicated below.
64
By:/s/ Gerald Paul Dr. Gerald Paul President and Chief Executive Officer February 19, 2015
Signature Title Date Principal Executive Officer: /s/ Gerald Paul President, Chief Executive Officer, February 19, 2015 Dr. Gerald Paul and Director Principal Financial and Accounting Officer: /s/ Lori Lipcaman Executive Vice President and Chief February 19, 2015 Lori Lipcaman Financial Officer Board of Directors: /s/ Marc Zandman Executive Chairman of February 19, 2015 Marc Zandman the Board of Directors /s/ Abraham Ludomirski Director February 19, 2015 Dr. Abraham Ludomirski /s/ Frank D. Maier Director February 19, 2015 Frank D. Maier /s/ Wayne M. Rogers Director February 19, 2015 Wayne M. Rogers /s/ Ronald M. Ruzic Director February 19, 2015 Ronald M. Ruzic /s/ Ziv Shoshani Director February 19, 2015 Ziv Shoshani /s/ Timothy V. Talbert Director February 19, 2015 Timothy V. Talbert /s/ Thomas C. Wertheimer Director February 19, 2015 Thomas C. Wertheimer /s/ Ruta Zandman Director February 19, 2015 Ruta Zandman
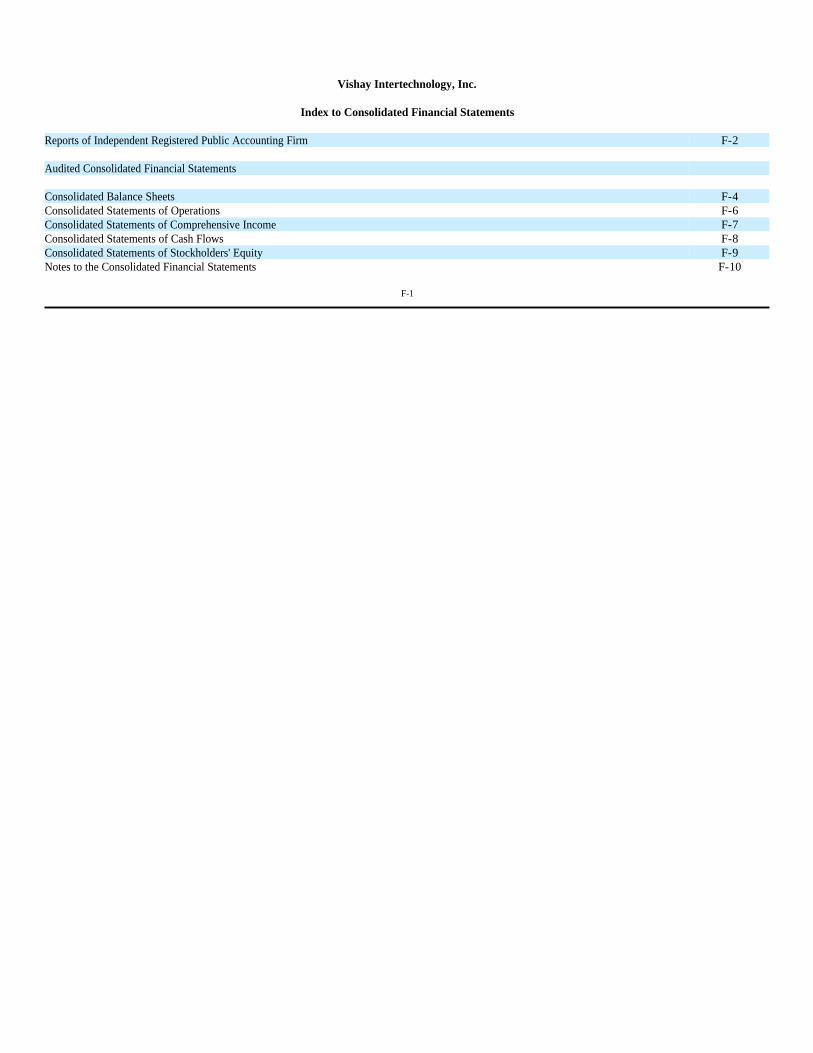
Vishay Intertechnology, Inc.
Index to Consolidated Financial Statements
F-1
Reports of Independent Registered Public Accounting Firm F-2 Audited Consolidated Financial Statements Consolidated Balance Sheets F-4 Consolidated Statements of Operations F-6 Consolidated Statements of Comprehensive Income F-7 Consolidated Statements of Cash Flows F-8 Consolidated Statements of Stockholders' Equity F-9 Notes to the Consolidated Financial Statements F-10

Report of Independent Registered Public Accounting Firm on the Consolidated Financial Statements
The Board of Directors and Stockholders of Vishay Intertechnology, Inc.: We have audited the accompanying consolidated balance sheets of Vishay Intertechnology, Inc. as of December 31, 2014 and 2013, and the related consolidated statements of operations, comprehensive income, stockholders' equity, and cash flows for each of the three years in the period ended December 31, 2014. These financial statements are the responsibility of Vishay Intertechnology, Inc.'s management. Our responsibility is to express an opinion on these financial statements based on our audits. We conducted our audits in accordance with the standards of the Public Company Accounting Oversight Board (United States). Those standards require that we plan and perform the audit to obtain reasonable assurance about whether the financial statements are free of material misstatement. An audit includes examining, on a test basis, evidence supporting the amounts and disclosures in the financial statements. An audit also includes assessing the accounting principles used and significant estimates made by management, as well as evaluating the overall financial statement presentation. We believe that our audits provide a reasonable basis for our opinion. In our opinion, the financial statements referred to above present fairly, in all material respects, the consolidated financial position of Vishay Intertechnology, Inc. at December 31, 2014 and 2013, and the consolidated results of its operations and its cash flows for each of the three years in the period ended December 31, 2014, in conformity with U.S. generally accepted accounting principles. We also have audited, in accordance with the standards of the Public Company Accounting Oversight Board (United States), Vishay Intertechnology, Inc.'s internal control over financial reporting as of December 31, 2014, based on criteria established in Internal Control—Integrated Framework issued by the Committee of Sponsoring Organizations of the Treadway Commission (2013 framework) and our report dated February 19, 2015 expressed an unqualified opinion thereon. /s/ Ernst & Young LLP Philadelphia, Pennsylvania February 19, 2015
F-2

Report of Independent Registered Public Accounting Firm on Internal Control over Financial Reporting
The Board of Directors and Stockholders of Vishay Intertechnology, Inc.: We have audited Vishay Intertechnology, Inc.'s internal control over financial reporting as of December 31, 2014, based on criteria established in Internal Control—Integrated Framework issued by the Committee of Sponsoring Organizations of the Treadway Commission (2013 framework) (the COSO criteria). Vishay Intertechnology, Inc.'s management is responsible for maintaining effective internal control over financial reporting, and for its assessment of the effectiveness of internal control over financial reporting included in Item 9A, "Management's Report on Internal Control Over Financial Reporting." Our responsibility is to express an opinion on Vishay Intertechnology, Inc.'s internal control over financial reporting based on our audit. We conducted our audit in accordance with the standards of the Public Company Accounting Oversight Board (United States). Those standards require that we plan and perform the audit to obtain reasonable assurance about whether effective internal control over financial reporting was maintained in all material respects. Our audit included obtaining an understanding of internal control over financial reporting, assessing the risk that a material weakness exists, testing and evaluating the design and operating effectiveness of internal control based on the assessed risk, and performing such other procedures as we considered necessary in the circumstances. We believe that our audit provides a reasonable basis for our opinion. A company's internal control over financial reporting is a process designed to provide reasonable assurance regarding the reliability of financial reporting and the preparation of financial statements for external purposes in accordance with generally accepted accounting principles. A company's internal control over financial reporting includes those policies and procedures that (1) pertain to the maintenance of records that, in reasonable detail, accurately and fairly reflect the transactions and dispositions of the assets of the company; (2) provide reasonable assurance that transactions are recorded as necessary to permit preparation of financial statements in accordance with generally accepted accounting principles, and that receipts and expenditures of the company are being made only in accordance with authorizations of management and directors of the company; and (3) provide reasonable assurance regarding prevention or timely detection of unauthorized acquisition, use, or disposition of the company's assets that could have a material effect on the financial statements. Because of its inherent limitations, internal control over financial reporting may not prevent or detect misstatements. Also, projections of any evaluation of effectiveness to future periods are subject to the risk that controls may become inadequate because of changes in conditions, or that the degree of compliance with the policies or procedures may deteriorate. In our opinion, Vishay Intertechnology, Inc. maintained, in all material respects, effective internal control over financial reporting as of December 31, 2014, based on the COSO criteria. We also have audited, in accordance with the standards of the Public Company Accounting Oversight Board (United States), the consolidated balance sheets of Vishay Intertechnology, Inc. as of December 31, 2014 and 2013, and the related consolidated statements of operations, comprehensive income, stockholders' equity, and cash flows for each of the three years in the period ended December 31, 2014 and our report dated February 19, 2015 expressed an unqualified opinion thereon. /s/ Ernst & Young LLP Philadelphia, Pennsylvania February 19, 2015
F-3
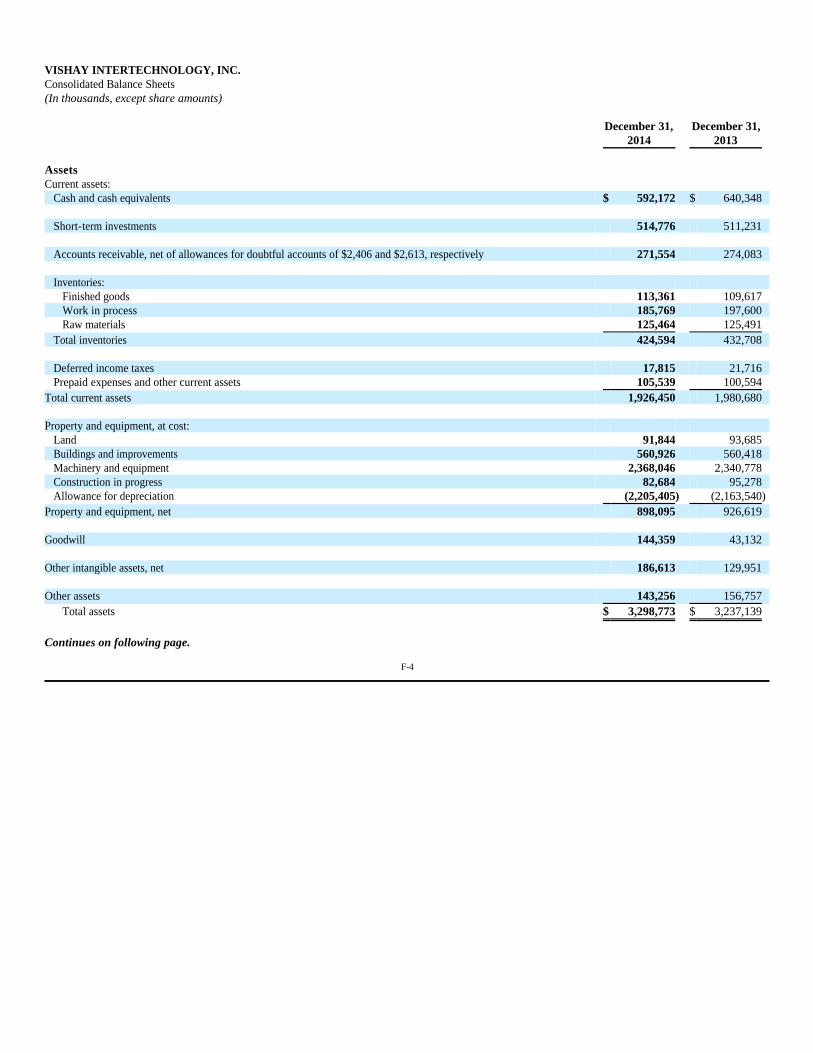
VISHAY INTERTECHNOLOGY, INC. Consolidated Balance Sheets (In thousands, except share amounts)
Continues on following page.
F-4
December 31,
2014 December 31,
2013 Assets Current assets:
Cash and cash equivalents $ 592,172 $ 640,348
Short-term investments 514,776 511,231
Accounts receivable, net of allowances for doubtful accounts of $2,406 and $2,613, respectively 271,554 274,083
Inventories: Finished goods 113,361 109,617 Work in process 185,769 197,600 Raw materials 125,464 125,491
Total inventories 424,594 432,708
Deferred income taxes 17,815 21,716 Prepaid expenses and other current assets 105,539 100,594
Total current assets 1,926,450 1,980,680 Property and equipment, at cost:
Land 91,844 93,685 Buildings and improvements 560,926 560,418 Machinery and equipment 2,368,046 2,340,778 Construction in progress 82,684 95,278 Allowance for depreciation (2,205,405) (2,163,540)
Property and equipment, net 898,095 926,619 Goodwill 144,359 43,132 Other intangible assets, net 186,613 129,951 Other assets 143,256 156,757
Total assets $ 3,298,773 $ 3,237,139

VISHAY INTERTECHNOLOGY, INC. Consolidated Balance Sheets (continued) (In thousands, except share amounts)
See accompanying notes.
F-5
Liabilities and stockholders' equity
December 31, 2014
December 31, 2013
Current liabilities: Notes payable to banks $ 18 $ 2 Trade accounts payable 174,451 163,894 Payroll and related expenses 120,023 120,997 Other accrued expenses 137,576 146,670 Income taxes 24,671 17,502
Total current liabilities 456,739 449,065 Long-term debt, less current portion 454,922 364,911 Deferred income taxes 178,900 157,640 Other liabilities 76,811 99,426 Accrued pension and other postretirement costs 300,524 287,901 Total liabilities 1,467,896 1,358,943 Commitments and contingencies Stockholders' equity:
Preferred stock, par value $1.00 per share: authorized - 1,000,000 shares; none issued Common stock, par value $0.10 per share: authorized - 300,000,000 shares; 135,324,313 and 135,202,081 shares
outstanding 13,532 13,520 Class B convertible common stock, par value $0.10 per share: authorized - 40,000,000 shares; 12,129,227 and
12,129,227 shares outstanding 1,213 1,213 Capital in excess of par value 2,055,246 2,054,087 (Accumulated deficit) retained earnings (175,485) (257,698) Accumulated other comprehensive income (loss) (69,140) 61,634 Total Vishay stockholders' equity 1,825,366 1,872,756
Non controlling interests 5,511 5,440 Total equity 1,830,877 1,878,196 Total liabilities and equity $ 3,298,773 $ 3,237,139
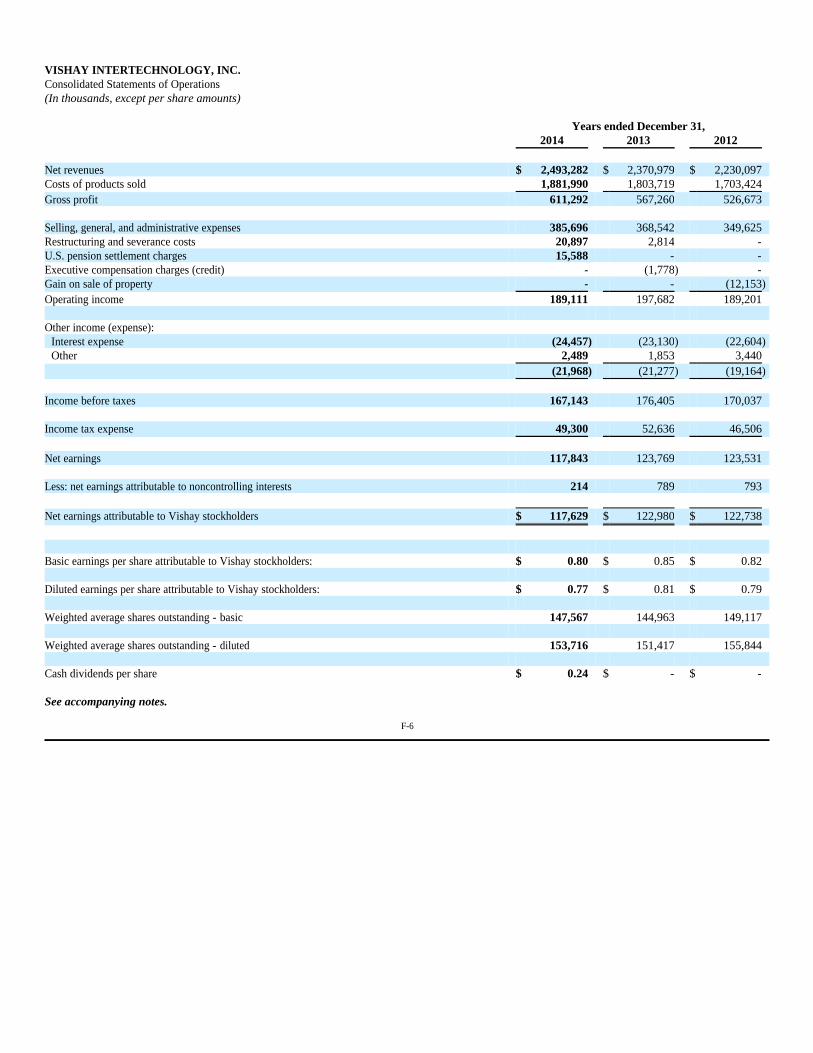
VISHAY INTERTECHNOLOGY, INC. Consolidated Statements of Operations (In thousands, except per share amounts)
See accompanying notes.
F-6
Years ended December 31, 2014 2013 2012 Net revenues $ 2,493,282 $ 2,370,979 $ 2,230,097 Costs of products sold 1,881,990 1,803,719 1,703,424 Gross profit 611,292 567,260 526,673 Selling, general, and administrative expenses 385,696 368,542 349,625 Restructuring and severance costs 20,897 2,814 - U.S. pension settlement charges 15,588 - - Executive compensation charges (credit) - (1,778) - Gain on sale of property - - (12,153) Operating income 189,111 197,682 189,201 Other income (expense):
Interest expense (24,457) (23,130) (22,604) Other 2,489 1,853 3,440
(21,968) (21,277) (19,164) Income before taxes 167,143 176,405 170,037 Income tax expense 49,300 52,636 46,506 Net earnings 117,843 123,769 123,531 Less: net earnings attributable to noncontrolling interests 214 789 793 Net earnings attributable to Vishay stockholders $ 117,629 $ 122,980 $ 122,738
Basic earnings per share attributable to Vishay stockholders: $ 0.80 $ 0.85 $ 0.82 Diluted earnings per share attributable to Vishay stockholders: $ 0.77 $ 0.81 $ 0.79 Weighted average shares outstanding - basic 147,567 144,963 149,117 Weighted average shares outstanding - diluted 153,716 151,417 155,844 Cash dividends per share $ 0.24 $ - $ -

VISHAY INTERTECHNOLOGY, INC. Consolidated Statements of Comprehensive Income (In thousands)
See accompanying notes.
F-7
Years ended December 31, 2014 2013 2012 Net earnings $ 117,843 $ 123,769 $ 123,531 Other comprehensive income (loss), net of tax
Foreign currency translation adjustment (106,295) 23,537 14,567
Pension and other post-retirement actuarial items (25,842) 49,038 (29,759)
Unrealized gain (loss) on available-for-sale securities 1,363 (719) 1,192 Other comprehensive income (loss) (130,774) 71,856 (14,000) Comprehensive income (loss) (12,931) 195,625 109,531 Less: comprehensive income attributable to noncontrolling interests 214 789 793 Comprehensive income (loss) attributable to Vishay stockholders $ (13,145) $ 194,836 $ 108,738
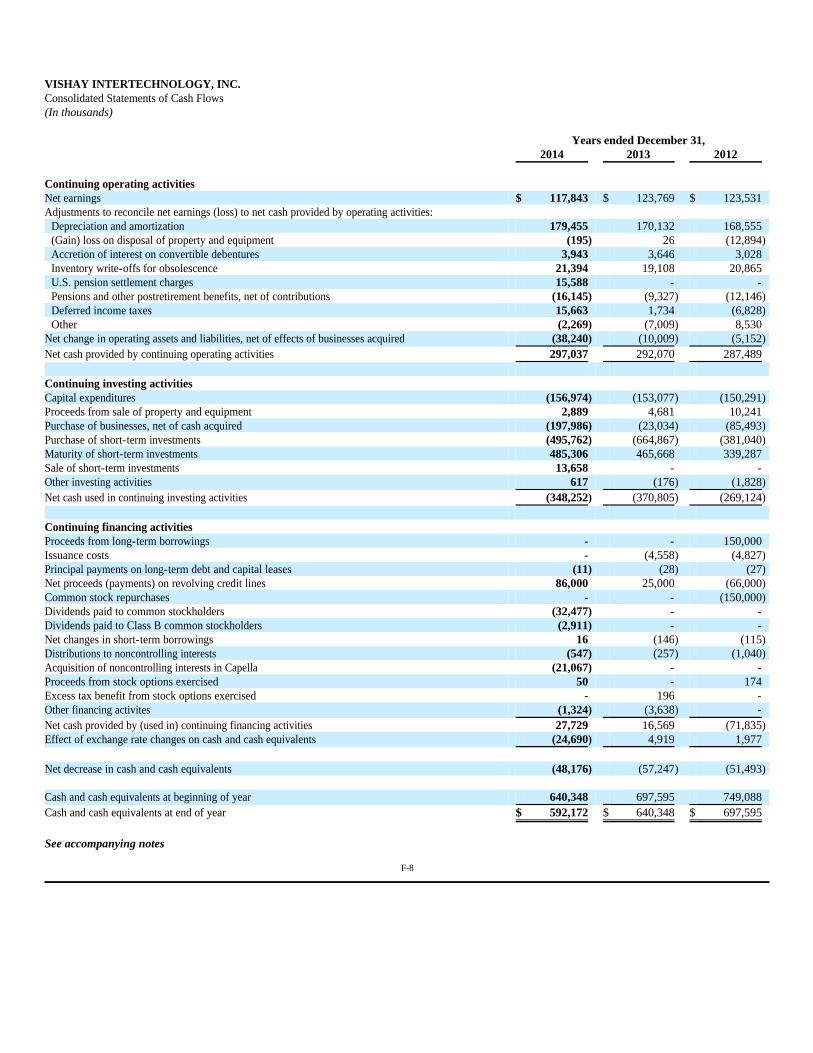
VISHAY INTERTECHNOLOGY, INC. Consolidated Statements of Cash Flows (In thousands)
See accompanying notes
F-8
Years ended December 31, 2014 2013 2012 Continuing operating activities Net earnings $ 117,843 $ 123,769 $ 123,531 Adjustments to reconcile net earnings (loss) to net cash provided by operating activities:
Depreciation and amortization 179,455 170,132 168,555 (Gain) loss on disposal of property and equipment (195) 26 (12,894) Accretion of interest on convertible debentures 3,943 3,646 3,028 Inventory write-offs for obsolescence 21,394 19,108 20,865 U.S. pension settlement charges 15,588 - - Pensions and other postretirement benefits, net of contributions (16,145) (9,327) (12,146) Deferred income taxes 15,663 1,734 (6,828) Other (2,269) (7,009) 8,530
Net change in operating assets and liabilities, net of effects of businesses acquired (38,240) (10,009) (5,152) Net cash provided by continuing operating activities 297,037 292,070 287,489 Continuing investing activities Capital expenditures (156,974) (153,077) (150,291) Proceeds from sale of property and equipment 2,889 4,681 10,241 Purchase of businesses, net of cash acquired (197,986) (23,034) (85,493) Purchase of short-term investments (495,762) (664,867) (381,040) Maturity of short-term investments 485,306 465,668 339,287 Sale of short-term investments 13,658 - - Other investing activities 617 (176) (1,828) Net cash used in continuing investing activities (348,252) (370,805) (269,124) Continuing financing activities Proceeds from long-term borrowings - - 150,000 Issuance costs - (4,558) (4,827) Principal payments on long-term debt and capital leases (11) (28) (27) Net proceeds (payments) on revolving credit lines 86,000 25,000 (66,000) Common stock repurchases - - (150,000) Dividends paid to common stockholders (32,477) - - Dividends paid to Class B common stockholders (2,911) - - Net changes in short-term borrowings 16 (146) (115) Distributions to noncontrolling interests (547) (257) (1,040) Acquisition of noncontrolling interests in Capella (21,067) - - Proceeds from stock options exercised 50 - 174 Excess tax benefit from stock options exercised - 196 - Other financing activites (1,324) (3,638) - Net cash provided by (used in) continuing financing activities 27,729 16,569 (71,835) Effect of exchange rate changes on cash and cash equivalents (24,690) 4,919 1,977 Net decrease in cash and cash equivalents (48,176) (57,247) (51,493) Cash and cash equivalents at beginning of year 640,348 697,595 749,088 Cash and cash equivalents at end of year $ 592,172 $ 640,348 $ 697,595

VISHAY INTERTECHNOLOGY, INC. Consolidated Statements of Stockholders' Equity (In thousands, except share amounts)
See accompanying notes.
F-9
Common
Stock
Class B Convertible
Common Stock
Capital in Excess of Par Value
Retained Earnings
(Accumulated Deficit)
Accumulated Other
Comprehensive Income (Loss)
Total Vishay Stockholders'
Equity Noncontrolling
Interests Total
Equity Balance at January 1, 2012 $ 14,374 $ 1,345 $2,086,925 $ (503,416) $ 3,778 $ 1,603,006 $ 5,155 $1,608,161 Net earnings - - - 122,738 - 122,738 793 123,531 Other comprehensive income
(loss) - - - - (14,000) (14,000) - (14,000) Distributions to noncontrolling
interests - - - - - - (1,040) (1,040) Phantom and restricted stock
issuances (11,323 shares) 1 - (9) - - (8) - (8) Issuance of convertible
debentures due 2042 - - 57,874 - - 57,874 - 57,874 Stock repurchase (13,948,687
shares) (1,395) - (148,605) - - (150,000) - (150,000) Stock compensation expense - - 3,544 - - 3,544 - 3,544 Stock options exercised
(22,095 shares) 2 - 172 - - 174 - 174 Conversions from Class B to
common stock (1,323,322 shares) 132 (132) - - - - - -
Balance at December 31, 2012 $ 13,114 $ 1,213 $1,999,901 $ (380,678) $ (10,222) $ 1,623,328 $ 4,908 $1,628,236 Net earnings - - - 122,980 - 122,980 789 123,769 Other comprehensive income - - - - 71,856 71,856 - 71,856 Distributions to noncontrolling
interests - - - - - - (257) (257) Restricted stock issuances
(393,818 shares) 40 - (2,680) - - (2,640) - (2,640) Stock compensation expense - - 636 - - 636 - 636 Tax effects of stock plan - - 196 - - 196 - 196 Issuance of common stock for
exchangeable unsecured notes (3,664,729 shares) 366 - 56,034 - - 56,400 - 56,400
Balance at December 31, 2013 $ 13,520 $ 1,213 $2,054,087 $ (257,698) $ 61,634 $ 1,872,756 $ 5,440 $1,878,196 Net earnings - - - 117,629 - 117,629 214 117,843 Other comprehensive income - - - - (130,774) (130,774) - (130,774) Noncontrolling interest in
business acquired - - - - - - 21,895 21,895 Distributions to noncontrolling
interests - - - - - - (547) (547) Acquisition of noncontrolling
interests - - 424 - - 424 (21,491) (21,067) Restricted stock issuances
(117,895 shares) 12 - (384) - - (372) - (372) Dividends declared ($0.24 per
share) - - 28 (35,416) - (35,388) - (35,388) Stock compensation expense - - 2,392 - - 2,392 - 2,392 Stock options exercised (4,337
shares) - - 50 - - 50 - 50 Tax effects of stock plan - - (1,351) - - (1,351) - (1,351) Balance at December 31, 2014 $ 13,532 $ 1,213 $2,055,246 $ (175,485) $ (69,140) $ 1,825,366 $ 5,511 $1,830,877

Vishay Intertechnology, Inc. ("Vishay" or the "Company") is a global manufacturer and supplier of semiconductors and passive components, including power MOSFETs, power integrated circuits, transistors, diodes, optoelectronic components, resistors, capacitors, and inductors. Semiconductors and electronic components manufactured by the Company are used in virtually all types of electronic products, including those in the industrial, computing, automotive, consumer electronics products, telecommunications, power supplies, military/aerospace, and medical industries. Note 1 – Summary of Significant Accounting Policies Use of Estimates The preparation of financial statements in conformity with accounting principles generally accepted in the United States ("GAAP") requires management to make estimates and assumptions that affect the amounts reported in the consolidated financial statements and accompanying notes. Actual results could differ significantly from those estimates. Principles of Consolidation The consolidated financial statements include the accounts of Vishay and all of its subsidiaries in which a controlling financial interest is maintained. For those consolidated subsidiaries in which the Company's ownership is less than 100 percent, the outside stockholders' interests are shown as noncontrolling interest in the accompanying consolidated balance sheets. Investments in affiliates over which the Company has significant influence but not a controlling interest are carried on the equity basis. Investments in affiliates over which the Company does not have significant influence are accounted for by the cost method. All intercompany transactions, accounts, and profits are eliminated. Subsequent Events In connection with the preparation of the consolidated financial statements and in accordance with GAAP, the Company evaluated subsequent events after the balance sheet date of December 31, 2014 through the date these financial statements were issued through the filing of this annual report on Form 10-K with the U.S. Securities and Exchange Commission. Revenue Recognition The Company recognizes revenue on product sales during the period when the sales process is complete. This generally occurs when products are shipped to the customer in accordance with terms of an agreement of sale, title and risk of loss have been transferred, collectibility is reasonably assured, and pricing is fixed or determinable. For the portion of sales where title and risk of loss passes at point of delivery, the Company recognizes revenue upon delivery to the customer, assuming all other criteria for revenue recognition are met. The Company historically has had agreements with distributors that provided limited rights of product return. The Company has modified these arrangements to allow distributors a limited credit for unsaleable products, which it terms a "scrap allowance." Consistent with industry practice, the Company also has a "stock, ship and debit" program whereby it considers requests by distributors for credits on previously purchased products that remain in distributors' inventory, to enable the distributors to offer more competitive pricing. In addition, the Company has contractual arrangements whereby it provides distributors with protection against price reductions initiated by the Company after product is sold by the Company to the distributor and prior to resale by the distributor. The Company records a reduction of revenue during each period, and records a related accrued expense for the period, based upon its estimate of product returns, scrap allowances, "stock, ship and debit" credits, and price protection credits that will be attributable to sales recorded through the end of the period. The Company makes these estimates based upon sales levels to its distributors during the period, inventory levels at the distributors, current and projected market conditions, and historical experience under the programs. While the Company utilizes a number of different methodologies to estimate the accruals, all of the methodologies take into account sales levels to distributors during the relevant period, inventory levels at the distributors, current and projected market trends and conditions, recent and historical activity under the relevant programs, changes in program policies, and open requests for credits. These procedures require the exercise of significant judgments. The Company believes that it has a reasonable basis to estimate future credits under the programs. Royalty revenues, included in net revenues on the consolidated statements of operations, were $4,525, $6,362, and $7,131 for the years ended December 31, 2014, 2013, and 2012, respectively. The Company records royalty revenue in accordance with agreed upon terms when performance obligations are satisfied, the amount is fixed or determinable, and collectibility is reasonably assured. Vishay earns royalties at the point of sale of products which incorporate licensed intellectual property. Accordingly, the amount of royalties recognized is determined based on periodic reporting to Vishay by its licensees, and based on judgments and estimates by Vishay management, which management considers reasonable.
F-10
NOTES TO THE CONSOLIDATED FINANCIAL STATEMENTS (dollars in thousands, except per share amounts)
Note 1 - Summary of Significant Accounting Policies (continued) Shipping and Handling Costs Shipping and handling costs are included in costs of products sold. Research and Development Expenses Research and development costs are expensed as incurred. The amount charged to expense for research and development (exclusive of purchased in-process research and development) aggregated $65,299, $62,090, and $57,164, for the years ended December 31, 2014, 2013, and 2012, respectively. The Company spends additional amounts for the development of machinery and equipment for new processes and for cost reduction measures. Income Taxes The provision for income taxes is determined using the asset and liability approach of accounting for income taxes. Under this approach, deferred taxes represent the future tax consequences expected to occur when the reported amounts of assets and liabilities are recovered or paid. The provision for income taxes represents income taxes paid or payable for the current year plus the change in deferred taxes during the year. Deferred taxes result from differences between the financial and tax bases of the Company's assets and liabilities and are adjusted for changes in tax rates and tax laws when changes are enacted. Valuation allowances have been established for deferred tax assets which the Company believes do not meet GAAP criteria of "more likely than not" to be realilzed. This criterion requires a level of judgment regarding future taxable income, which may be revised due to changes in market conditions, tax laws, or other factors. If the Company's assumptions and estimates change in the future, valuation allowances established may be increased, resulting in increased tax expense. Conversely, if the Company is ultimately able to utilize all or a portion of the deferred tax assets for which a valuation allowance has been established, then the related portion of the valuation allowance can be released, resulting in decreased tax expense. Substantially all earnings generated by non-U.S. subsidiaries prior to 2014, and cash generated in 2014 which is not funding the dividend program or the Capella acquisition, are deemed to be reinvested outside of the United States indefinitely. Accordingly, no provision has been made for U.S. federal and state income taxes on these foreign earnings. Upon distribution of those earnings in the form of dividends or otherwise, the Company would be subject to U.S. income taxes (subject to an adjustment for foreign tax credits), state income taxes, incremental foreign income taxes, and withholding taxes payable to various foreign countries. The Company expects to fund the quarterly dividend program initiated in February 2014, by, at least in part, repatriating current year income of certain non-U.S. subsidiaries and providing appropriate U.S. federal and state income taxes, incremental foreign income taxes, and withholding taxes payable on that current period non-U.S. income. The Company and its subsidiaries are subject to income taxes in the U.S. and numerous foreign jurisdictions. Significant judgment is required in evaluating the Company's tax positions and determining its provision for income taxes. During the ordinary course of business, there are many transactions and calculations for which the ultimate tax determination is uncertain. The Company establishes reserves for tax-related uncertainties based on estimates of whether, and the extent to which, additional taxes will be due. These reserves are established when the Company believes that certain positions might be challenged despite the Company's belief that its tax return positions are fully supportable. The Company adjusts these reserves in light of changing facts and circumstances and the provision for income taxes includes the impact of reserve provisions and changes to reserves that are considered appropriate. These accruals for tax-related uncertainties are based on management's best estimate of potential tax exposures. When particular matters arise, a number of years may elapse before such matters are audited by tax authorities and finally resolved. Favorable resolution of such matters could be recognized as a reduction to the Company's effective tax rate in the year of resolution. Unfavorable resolution of any particular issue could increase the effective tax rate and may require the use of cash in the year of resolution. The amount included in current liabilities on the accompanying consolidated balance sheets reflect only amounts expected to be settled in cash within one year.
F-11
NOTES TO THE CONSOLIDATED FINANCIAL STATEMENTS (dollars in thousands, except per share amounts)
Note 1 – Summary of Significant Accounting (continued) Cash, Cash Equivalents, and Short-Term Investments Cash and cash equivalents includes demand deposits and highly liquid investments with maturities of three months or less when purchased. Highly liquid investments with original maturities greater than three months, but less than one year are classified as short-term investments. At December 31, 2014 and 2013, the Company's short-term investments were comprised of time deposits with financial institutions whose original maturity exceeds three months, but less than one year. Allowance for Doubtful Accounts The Company maintains an allowance for doubtful accounts for estimated losses resulting from the inability of its customers to make required payments. The allowance is determined through an analysis of the aging of accounts receivable and assessments of risk that are based on historical trends and an evaluation of the impact of current and projected economic conditions. The Company evaluates the past-due status of its trade receivables based on contractual terms of sale. If the financial condition of the Company's customers were to deteriorate, resulting in an impairment of their ability to make payments, additional allowances may be required. Bad debt expense (income realized upon subsequent collection) was $(424), $62, and $(24) for the years ended December 31, 2014, 2013, and 2012, respectively. Inventories Inventories are stated at the lower of cost, determined by the first-in, first-out method, or market. Inventories are adjusted for estimated obsolescence and written down to net realizable value based upon estimates of future demand, technology developments, and market conditions. Property and Equipment Property and equipment is carried at cost and is depreciated principally by the straight-line method based upon the estimated useful lives of the assets. Machinery and equipment are being depreciated over useful lives of seven to ten years. Buildings and building improvements are being depreciated over useful lives of twenty to forty years. Construction in progress is not depreciated until the assets are placed in service. The estimated cost to complete construction in progress at December 31, 2014 was approximately $40,980. Depreciation of capital lease assets is included in total depreciation expense. Depreciation expense was $160,804, $155,064, and $153,801 for the years ended December 31, 2014, 2013, and 2012, respectively. Gains and losses on the disposal of assets which do not qualify for presentation as discontinued operations are included in the determination of operating margin (within selling, general, and administrative expenses). Individually material gains and losses on disposal are separately disclosed in the notes to the consolidated financial statements.
F-12
NOTES TO THE CONSOLIDATED FINANCIAL STATEMENTS (dollars in thousands, except per share amounts)
Note 1 – Summary of Significant Accounting (continued) Goodwill and Other Intangible Assets Goodwill and indefinite-lived intangible assets are not amortized but rather are tested for impairment at least annually. The required annual impairment tests of goodwill and indefinite-lived intangible assets are completed as of the first day of the fourth fiscal quarter of each year. These tests are performed more frequently whenever events or changes in circumstances indicate that the assets might be impaired. The Company's business segments (see Note 15) represent its reporting units for goodwill impairment testing purposes. Certain of the Company's tradenames have been assigned indefinite useful lives. Definite-lived intangible assets are amortized over their estimated useful lives. Patents and acquired technology are being amortized over useful lives of seven to twenty-five years. Capitalized software is amortized over periods of three to ten years, primarily included in costs of products sold on the consolidated statements of operations. Customer relationships are amortized over useful lives of five to twenty years. Noncompete agreements are amortized over periods of three to ten years. The Company continually evaluates the reasonableness of the useful lives of these assets. GAAP prescribes a two-step quantitative method for determining goodwill impairment. The Company has the option of performing a qualitative assessment before performing the two-step quantitative impairment test. If it is determined, on the basis of qualitative factors, that the fair value of the reporting unit is not more likely than not less than the carrying amount, the two-step quantitative impairment test is not required. If it is determined that the fair value of the reporting unit is more likely than not less than the carrying amount, the two-step quantitative impairment test is required. In the first step, the Company determines the fair value of the reporting unit and compares that fair value to the net book value of the reporting unit. The fair value of the reporting unit is determined using various valuation techniques, including a comparable companies market multiple approach and a discounted cash flow analysis (an income approach). If the net book value of the reporting unit were to exceed the fair value, the Company would then perform the second step of the quantitative impairment test, which requires allocation of the reporting unit's fair value to all of its assets and liabilities in a manner similar to a purchase price allocation, with any residual fair value being allocated to goodwill. An impairment charge will be recognized only when the implied fair value of a reporting unit's goodwill is less than its carrying amount. The Company has the option of performing a qualitative assessment of the indefinite-lived intangible assets before performing a quantitative impairment test. The fair value of the tradenames is measured as the discounted cash flow savings realized from owning such tradenames and not having to pay a royalty for their use. There was no impairment identified through the annual impairment tests completed in 2014, 2013, or 2012. Upon determining that an intangible asset classified as indefinite-lived is impaired, the Company reassesses the useful life of the impaired assets and begins to amortize the remaining carrying value over that useful life if it is determined that the asset no longer has an indefinite useful life. Impairment of Long-Lived Assets The carrying value of long-lived assets held-and-used, other than goodwill and indefinite-lived intangible assets, is evaluated when events or changes in circumstances indicate the carrying value may not be recoverable or the useful life has changed. The carrying value of a long-lived asset group is considered impaired when the total projected undiscounted cash flows from such asset group are separately identifiable and are less than the carrying value. In that event, a loss is recognized based on the amount by which the carrying value exceeds the fair market value of the long-lived asset group. Fair market value is determined primarily using present value techniques based on projected cash flows from the asset group. Losses on long-lived assets held-for-sale, other than goodwill and indefinite-lived intangible assets, are determined in a similar manner, except that fair market values are reduced for anticipated disposal costs. Available-for-Sale Securities Short-term investments and other assets reported on the consolidated balance sheets include time deposits with financial institutions whose original maturity exceeds three months, but less than one year and investments in marketable securities which are classified as available-for-sale. These assets include short-term investments acquired in the Capella Microsystems (Taiwan) Inc. ("Capella") acquisition (see Note 2), assets that are held in trust related to the Company's non-qualified pension and deferred compensation plans (see Note 11), and assets that are intended to fund a portion of the Company's other postretirement benefit obligations outside of the U.S. These assets are reported at fair value, based on quoted market prices as of the end of the reporting period. Unrealized gains and losses are reported, net of their related tax consequences, as a component of accumulated other comprehensive income in stockholders' equity until sold. At the time of sale, the assets that are held in trust related to the Company's non-qualified pension and deferred compensation plans, any gains (losses) calculated by the specific identification method are recognized as a reduction (increase) to benefits expense, within selling, general, and administrative expenses.
F-13
NOTES TO THE CONSOLIDATED FINANCIAL STATEMENTS (dollars in thousands, except per share amounts)

Note 1 – Summary of Significant Accounting (continued) Financial Instruments The Company uses financial instruments in the normal course of its business, including from time to time, derivative financial instruments. Additionally, from time to time, the Company enters into contracts that are not considered derivative financial instruments in their entirety, but that include embedded derivative features. The convertible senior debentures due 2040, due 2041, and due 2042 contain embedded derivatives that are recorded at fair value on a recurring basis. At December 31, 2014 and 2013, outstanding derivative instruments were not material. The Company reports derivative instruments on the consolidated balance sheet at their fair values. The accounting for changes in fair value depends upon the purpose of the derivative instrument and whether it is designated and qualifies for hedge accounting. For instruments designated as hedges, the effective portion of gains or losses is reported in other comprehensive income (loss) and the ineffective portion, if any, is reported in current period net earnings (loss). Changes in the fair values of derivative instruments that are not designated as hedges, including embedded derivatives, are recorded in current period net earnings (loss). The Company has in the past used interest rate swap agreements to modify variable rate obligations to fixed rate obligations, thereby reducing exposure to market rate fluctuations. The Company uses financial instruments such as forward exchange contracts to mitigate a portion, but not all, of the risk associated with its firm commitments denominated in foreign currencies. The purpose of the Company's foreign currency management is to minimize the effect of exchange rate changes on actual cash flows from foreign currency denominated transactions. Other financial instruments include cash and cash equivalents, held-to-maturity short-term investments, accounts receivable, and notes payable. The carrying amounts of these financial instruments reported in the consolidated balance sheets approximate their fair values due to the short-term nature of these assets and liabilities. Foreign Currency Translation The Company has significant operations outside of the United States. The Company finances its operations in Europe and certain locations in Asia in local currencies, and accordingly, these subsidiaries utilize the local currency as their functional currency. The Company's operations in Israel and most significant locations in Asia are largely financed in U.S. dollars, and accordingly, these subsidiaries utilize the U.S. dollar as their functional currency. For those subsidiaries where the local currency is the functional currency, assets and liabilities in the consolidated balance sheets have been translated at the rate of exchange as of the balance sheet date. Translation adjustments do not impact the consolidated results of operations and are reported as a separate component of stockholders' equity. Revenues and expenses are translated at the average exchange rate for the year. While the translation of revenues and expenses into U.S. dollars does not directly impact the statement of operations, the translation effectively increases or decreases the U.S. dollar equivalent of revenues generated and expenses incurred in those foreign currencies. For those foreign subsidiaries where the U.S. dollar is the functional currency, all foreign currency financial statement amounts are remeasured into U.S. dollars. Exchange gains and losses arising from remeasurement of foreign currency-denominated monetary assets and liabilities are included in the consolidated results of operations. Stock-Based Compensation Compensation costs related to stock-based payment transactions are recognized in the consolidated financial statements. The amount of compensation cost is measured based on the grant-date fair value of the equity (or liability) instruments issued. Compensation cost is recognized over the period that an officer, employee, or non-employee director provides service in exchange for the award. For options and restricted stock units subject to graded vesting, the Company recognizes expense over the service period for each separately vesting portion of the award as if the award was, in-substance, multiple awards. The Company recognizes compensation cost for restricted stock units ("RSUs") that are expected to vest and records cumulative adjustments in the period that the expectation changes.
F-14
NOTES TO THE CONSOLIDATED FINANCIAL STATEMENTS (dollars in thousands, except per share amounts)
Note 1 – Summary of Significant Accounting (continued) Commitments and Contingencies Liabilities for loss contingencies, including environmental remediation costs, arising from claims, assessments, litigation, fines, penalties, and other sources are recorded when it is probable that a liability has been incurred and the amount of the assessment and/or remediation can be reasonably estimated. The costs for a specific environmental remediation site are discounted if the aggregate amount of the obligation and the amount and timing of the cash payments for that site are fixed or reliably determinable based upon information derived from the remediation plan for that site. Accrued liabilities for environmental matters recorded at December 31, 2014 and 2013 do not include claims against third parties. Restructuring and Severance Costs Restructuring and severance costs reflect charges resulting from cost reduction programs implemented by the Company. Restructuring and severance costs include exit costs, severance benefits pursuant to an on-going arrangement, voluntary termination compensation under a defined program, and any related pension curtailment and settlement charges. The Company recognizes expense for one-time benefits only after management has committed to a plan, the plan is sufficiently detailed to provide the number, classification, and location of employees to be terminated as well as the expected completion date, the plan has been sufficiently communicated to employees such that they are able to determine the type and amount of benefits they will receive if terminated, and it is unlikely that the plan will be significantly changed or withdrawn. If an employee is not required to render service beyond a minimum retention period, the Company recognizes expense once the aforementioned criteria have been met. If an employee is required to render service beyond a minimum retention period, the Company recognizes expense over the period that the employee is required to render future service. The Company recognizes expense for on-going benefit arrangements when the liability is reasonably estimable and considered probable. The Company recognizes expense for voluntary separation / early retirement when the employee delivers an irrevocable voluntary termination notice pursuant to a defined company program. The Company recognizes other exit costs as incurred. Self-Insurance Programs The Company uses a combination of insurance and self-insurance mechanisms to provide for the potential liabilities for workers' compensation, general liability, property damage, director and officers' liability, and vehicle liability. As part of its self-insurance program for certain risks, the Company created a wholly-owned captive insurance entity in 2007. At December 31, 2014, the captive insurance entity provides only property and general liability insurance, although it is licensed to also provide casualty and directors' and officers' insurance. The captive insurance entity had no amounts accrued for outstanding claims at December 31, 2014 and 2013. Certain cash and investments held by the captive insurance entity are restricted primarily for the purpose of potential insurance claims. Restricted cash of $7,309 and $7,927 is included in other noncurrent assets at December 31, 2014 and 2013, respectively, representing required statutory reserves of the captive insurance entity. Convertible Debentures The Company separately accounts for the liability and equity components of convertible debt instruments that may be settled in cash in a manner that reflects the Company's nonconvertible debt borrowing rate. The liability component at issuance is recognized at fair value, based on the fair value of a similar instrument that does not have a conversion feature. A discount is recorded if debentures are issued at a coupon rate which is below the rate of a similar instrument that did not have a conversion feature at issuance. The equity component is based on the excess of the principal amount of the debentures over the fair value of the liability component, after adjusting for an allocation of debt issuance costs and the deferred tax impact, and is recorded as capital in excess of par. Debt discounts are amortized as additional non-cash interest expense over the expected life of the debt. Reclassifications Certain prior year amounts have been reclassified to conform to the current financial statement presentation.
F-15
NOTES TO THE CONSOLIDATED FINANCIAL STATEMENTS (dollars in thousands, except per share amounts)

Note 2 - Acquisition and Divestiture Activities As part of its growth strategy, the Company seeks to expand through targeted acquisitions of other manufacturers of electronic components that have established positions in major markets, reputations for product quality and reliability, and product lines with which the Company has substantial marketing and technical expertise. Year ended December 31, 2014 Holy Stone Polytech Co., Ltd. On June 11, 2014, Vishay acquired Holy Stone Polytech Co., Ltd. ("Holy Stone Polytech"), a Japanese manufacturer of tantalum capacitors and formerly a subsidiary of Holy Stone Enterprise Co. Ltd., for $20,576, net of cash acquired. The acquisition is expected to strengthen the Company's position in tantalum capacitors, especially in Asia. For financial reporting purposes, the results of operations of Holy Stone Polytech have been included in the Capacitors segment since June 11, 2014. The inclusion of this business did not have a material impact on the Company's consolidated results for the year ended December 31, 2014. Based on an estimate of their fair values, the Company allocated $3,736 of the purchase price to definite-lived intangible assets. After allocating the purchase price to the assets acquired and liabilities assumed based on an estimation of their fair values at the date of acquisition, the Company recorded goodwill of $6,328 related to this acquisition. The goodwill associated with this transaction is not deductible for income tax purposes. The Company will test the goodwill for impairment at least annually in accordance with GAAP. Capella Microsystems Inc. On July 11, 2014, Vishay entered into an agreement to acquire Capella for approximately $205,000. Capella is a fabless IC design company specializing in optoelectronic products. As a first step in the acquisition, Vishay launched a tender offer for Capella's outstanding shares. A total of 38,703,705 shares of Capella, or 88.95% of outstanding shares, were tendered and accepted by Vishay. The offer period expired on September 1, 2014. Pursuant to the terms of the tender offer, Vishay paid NT$139 for each share tendered. The aggregate purchase price was $180,167. Capella had cash and short-term investments on hand of $50,195 at the date of acquisition. Vishay funded the acquisition with cash on hand and $53,000 of borrowings under its credit facility. Subsequent to the acquisition of the noncontrolling interest on December 31, 2014, the Company expects to repatriate cash from the current earnings of non-U.S. subsidiaries to the United States primarily to repay those borrowings on the revolving credit facility, and also to realign the acquired entity structure to have Capella's U.S. subsidiary directly owned by Vishay Intertechnology, Inc. The acquisition is expected to strengthen the Company's position in optoelectronic sensors. Upon the close of the tender offer, Vishay controlled Capella and began consolidating it in its financial statements. For financial reporting purposes, the results and operations and net assets of Capella have been included in the Optoelectronic Components segment. The interest represented by the shares not tendered are presented as noncontrolling interests in the consolidated financial statements. The fair value of the noncontrolling interest was determined based on the observable quoted share price as of the acquisition date. Capella's results were not material to the Company's consolidated results for the year ended December 31, 2014. Vishay acquired the remaining outstanding shares of Capella on December 31, 2014 pursuant to the merger agreement. In connection with the closing of the merger, all remaining holders of Capella common stock other than Vishay and its subsidiaries received the same consideration for their shares as the holders who tendered their shares in the tender offer, or $21,067 in the aggregate. Based on an estimate of their fair values, the Company allocated the purchase price of the acquisition as follows:
F-16
NOTES TO THE CONSOLIDATED FINANCIAL STATEMENTS (dollars in thousands, except per share amounts)
Short-term investments $ 47,438 Working capital (excluding cash and short-term investments) (6,374) Property and equipment 4,134 Intangible assets: Patents and acquired technology 14,870 Capitalized software 101 Customer relationships 54,400 Tradenames 5,110 Total intangible assets 74,481 Other, net (454) Deferred taxes, net (16,769) Total identified assets and liabilities 102,456
Cash paid to Capella stockholders, net of cash acquired 177,410 Fair value of noncontrolling interest 21,895 Goodwill $ 96,849

Note 2 - Acquisition and Divestiture Activities (continued) The weighted average useful lives for patents and acquired technology, customer relationships, and tradenames are 10, 7, and 7 years, respectively. The Company will test the goodwill for impairment at least annually in accordance with GAAP. The goodwill associated with this transaction is not deductible for income tax purposes. In evaluating the acquisition of Capella, the Company focused primarily on the ability to synergize Capella's optoelectronics design capabilities with Vishay's existing optoelectronics product lines and customers. As a result, the fair value of the acquired assets, including identified intangible assets, corresponds to a relatively smaller portion of the acquisition price, with the Company recording a substantial amount of goodwill associated with the acquisition. The Company recognized $843 of acquisition costs classified as a component of selling, general, and administrative expenses in its consolidated statements of operations. Pro Forma Results The unaudited pro forma results would have been as follows, assuming the 2014 acquisitions had occurred as of January 1, 2013:
The pro forma information presented for the year ended December 31, 2014 was adjusted to exclude acquisition-related costs incurred in 2014. The pro forma information also includes adjustments for interest expense that would have been incurred to finance the acquisition, amortization of acquired intangible assets, depreciation of acquired property and equipment, and tax related effects. The unaudited pro forma results are not necessarily indicative of the results that would have been attained had the acquisition occurred on January 1, 2013. Year ended December 31, 2013 MCB Industrie S.A. On June 13, 2013, Vishay acquired MCB Industrie S.A. ("MCB Industrie") in France, a well-established manufacturer of specialty resistors and sensors, for $23,034, net of cash acquired. The products and technology portfolio acquired is expected to enable Vishay to expand its presence in the European industrial market. For financial reporting purposes, the results of operations for this business have been included in the Resistors & Inductors segment from June 13, 2013. The inclusion of this business did not have a material impact on the Company's consolidated results for the year ended December 31, 2013. Based on an estimate of their fair values, the Company allocated $5,433 of the purchase price to definite-lived intangible assets. After allocating the purchase price to the assets acquired and liabilities assumed based on an estimation of their fair values at the date of acquisition, the Company recorded goodwill of $7,985 related to this acquisition. The goodwill associated with this transaction is not deductible for income tax purposes. Had this acquisition occurred as of the beginning of the periods presented in these consolidated financial statements, the pro forma statements of operations would not be materially different than the consolidated statements of operations presented. Year ended December 31, 2012 HiRel Systems LLC On January 13, 2012, Vishay acquired HiRel Systems LLC, a leading supplier of high reliability transformers, inductors, coils, and power conversion products, for $85,493, net of cash acquired. The products and technology portfolio acquired further enhanced the Company's inductors portfolio, particularly in the field of custom magnetics for medical, military, aerospace and aviation, and applications in the industrial and commercial field such as renewable energy and test and measurement equipment. For financial reporting purposes, the results of operations for this business have been included in the Resistors & Inductors segment from January 13, 2012. Based on an estimate of their fair values, the Company allocated $43,950 of the purchase price to definite-lived intangible assets. After allocating the purchase price to the assets acquired and liabilities assumed based on an estimation of their fair values at the date of acquisition, the Company recorded goodwill of $25,815 related to this acquisition. The goodwill associated with this transaction is deductible for income tax purposes. Had this acquisition occurred as of the beginning of the periods presented in these consolidated financial statements, the pro forma statements of operations would not be materially different than the consolidated statements of operations presented.
F-17
NOTES TO THE CONSOLIDATED FINANCIAL STATEMENTS (dollars in thousands, except per share amounts)
Years ended December 31, 2014 2013 Pro forma net revenues $ 2,522,010 $ 2,446,503 Pro forma net earnings attributable to Vishay stockholders 114,510 128,252 Pro forma basic earnings per share attributable to Vishay stockholders $ 0.78 $ 0.88 Pro forma diluted earnings per share attributable to Vishay stockholders $ 0.75 $ 0.85

Note 3 – Goodwill and Other Intangible Assets The changes in the carrying amount of goodwill by segment for the years ended December 31, 2014 and 2013 were as follows:
Other intangible assets are as follows:
F-18
NOTES TO THE CONSOLIDATED FINANCIAL STATEMENTS (dollars in thousands, except per share amounts)
Optoelectronic Components
Resistors & Inductors Capacitors Total
Balance at January 1, 2013 $ - $ 34,866 $ - $ 34,866 MCB Industrie acquisition - 7,985 - 7,985 Exchange rate effects - 281 - 281 Balance at December 31, 2013 $ - $ 43,132 $ - $ 43,132 Holy Stone Polytech acquisition - - 6,328 6,328 Capella acquisition 96,849 - - 96,849 Exchange rate effects - (986) (964) (1,950) Balance at December 31, 2014 $ 96,849 $ 42,146 $ 5,364 $ 144,359
December 31, 2014 2013 Intangible Assets Subject to Amortization
(Definite-lived): Patents and acquired technology $ 108,190 $ 92,842 Capitalized software 53,369 55,893 Customer relationships 153,853 99,558 Tradenames 39,612 35,845 Non-competition agreements 2,283 1,948
357,307 286,086
Accumulated amortization: Patents and acquired technology (71,700) (66,337) Capitalized software (45,979) (50,006) Customer relationships (50,630) (40,727) Tradenames (21,384) (18,560) Non-competition agreements (1,360) (864)
(191,053) (176,494) Net Intangible Assets Subject to Amortization 166,254 109,592
Intangible Assets Not Subject to Amortization
(Indefinite-lived): Tradenames 20,359 20,359
$ 186,613 $ 129,951
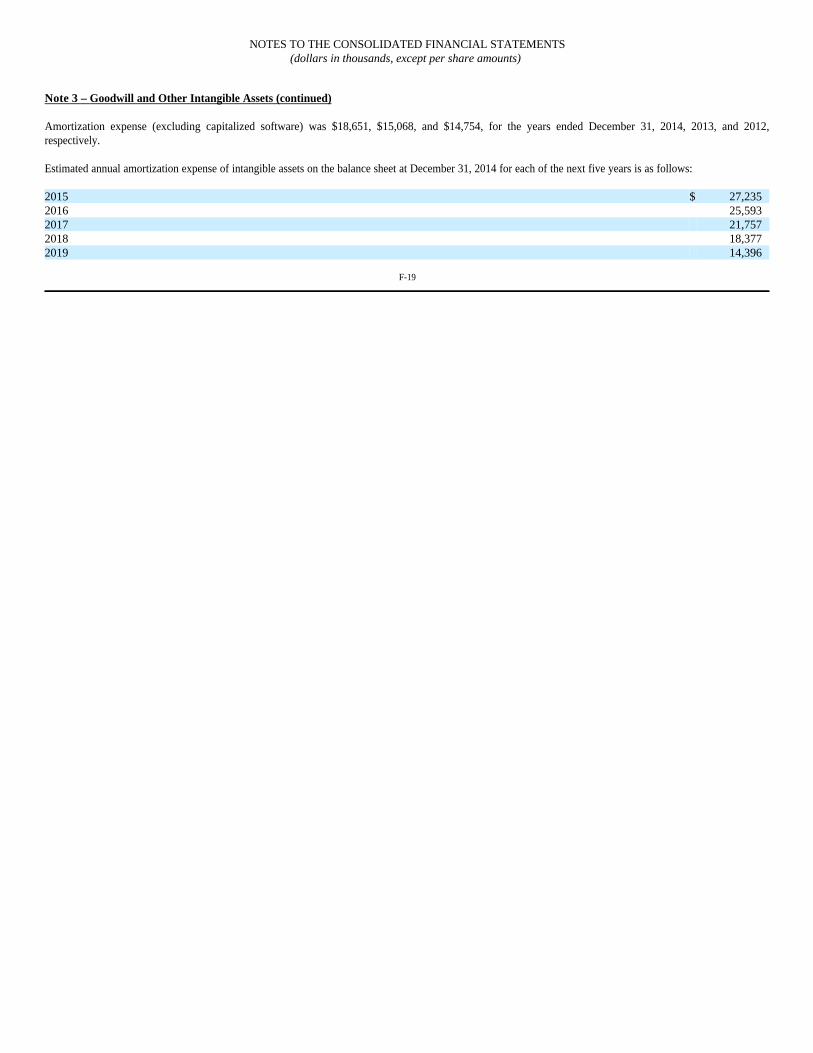
Note 3 – Goodwill and Other Intangible Assets (continued) Amortization expense (excluding capitalized software) was $18,651, $15,068, and $14,754, for the years ended December 31, 2014, 2013, and 2012, respectively. Estimated annual amortization expense of intangible assets on the balance sheet at December 31, 2014 for each of the next five years is as follows:
F-19
NOTES TO THE CONSOLIDATED FINANCIAL STATEMENTS (dollars in thousands, except per share amounts)
2015 $ 27,235 2016 25,593 2017 21,757 2018 18,377 2019 14,396
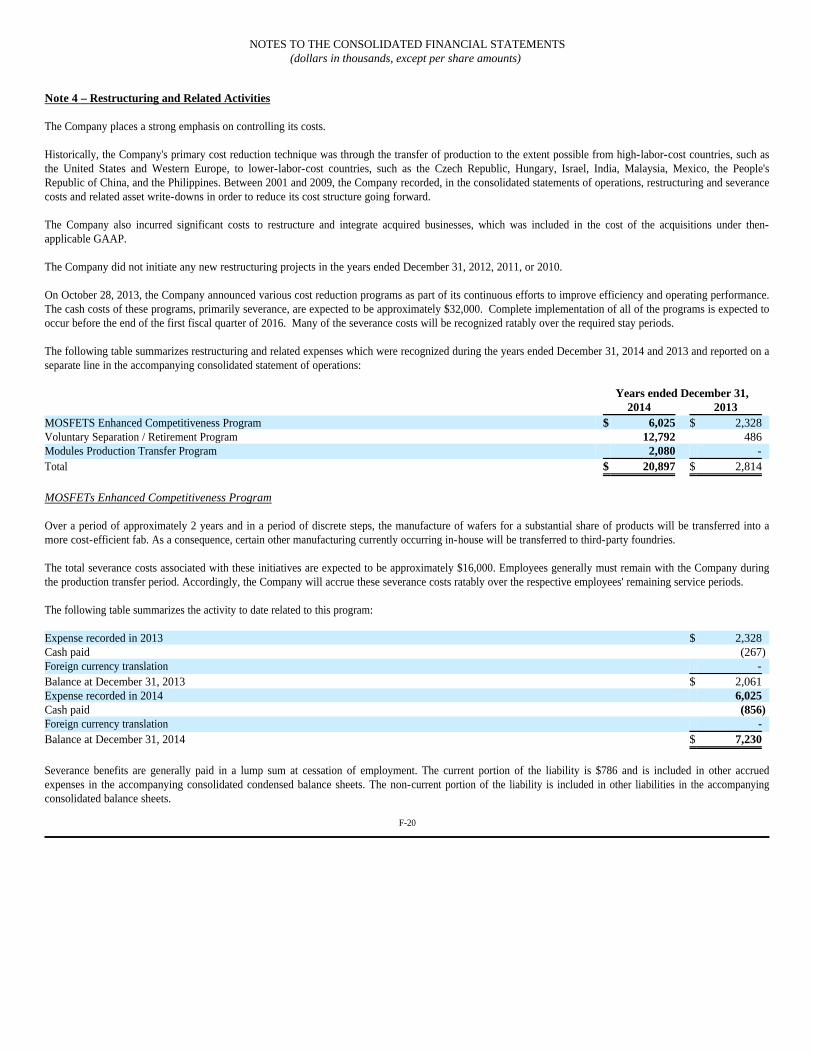
Note 4 – Restructuring and Related Activities The Company places a strong emphasis on controlling its costs. Historically, the Company's primary cost reduction technique was through the transfer of production to the extent possible from high-labor-cost countries, such as the United States and Western Europe, to lower-labor-cost countries, such as the Czech Republic, Hungary, Israel, India, Malaysia, Mexico, the People's Republic of China, and the Philippines. Between 2001 and 2009, the Company recorded, in the consolidated statements of operations, restructuring and severance costs and related asset write-downs in order to reduce its cost structure going forward. The Company also incurred significant costs to restructure and integrate acquired businesses, which was included in the cost of the acquisitions under then-applicable GAAP. The Company did not initiate any new restructuring projects in the years ended December 31, 2012, 2011, or 2010. On October 28, 2013, the Company announced various cost reduction programs as part of its continuous efforts to improve efficiency and operating performance. The cash costs of these programs, primarily severance, are expected to be approximately $32,000. Complete implementation of all of the programs is expected to occur before the end of the first fiscal quarter of 2016. Many of the severance costs will be recognized ratably over the required stay periods. The following table summarizes restructuring and related expenses which were recognized during the years ended December 31, 2014 and 2013 and reported on a separate line in the accompanying consolidated statement of operations:
MOSFETs Enhanced Competitiveness Program Over a period of approximately 2 years and in a period of discrete steps, the manufacture of wafers for a substantial share of products will be transferred into a more cost-efficient fab. As a consequence, certain other manufacturing currently occurring in-house will be transferred to third-party foundries. The total severance costs associated with these initiatives are expected to be approximately $16,000. Employees generally must remain with the Company during the production transfer period. Accordingly, the Company will accrue these severance costs ratably over the respective employees' remaining service periods. The following table summarizes the activity to date related to this program:
Severance benefits are generally paid in a lump sum at cessation of employment. The current portion of the liability is $786 and is included in other accrued expenses in the accompanying consolidated condensed balance sheets. The non-current portion of the liability is included in other liabilities in the accompanying consolidated balance sheets.
F-20
NOTES TO THE CONSOLIDATED FINANCIAL STATEMENTS (dollars in thousands, except per share amounts)
Years ended December 31, 2014 2013 MOSFETS Enhanced Competitiveness Program $ 6,025 $ 2,328 Voluntary Separation / Retirement Program 12,792 486 Modules Production Transfer Program 2,080 - Total $ 20,897 $ 2,814
Expense recorded in 2013 $ 2,328 Cash paid (267) Foreign currency translation - Balance at December 31, 2013 $ 2,061 Expense recorded in 2014 6,025 Cash paid (856) Foreign currency translation - Balance at December 31, 2014 $ 7,230

Note 4 – Restructuring and Related Activities (continued) Voluntary Separation / Retirement Program The voluntary separation / early retirement program was offered to employees worldwide who were eligible because they met job classification, age, and years-of-service criteria as of October 31, 2013. The program benefits vary by country and job classification, but generally include a cash loyalty bonus based on years of service. All employees eligible for the program have been identified, and have left or will leave the Company after the expiration of their respective transition periods. These employees generally were not aligned with any particular segment. The effective separation / retirement date for most employees who accepted the offer was June 30, 2014 or earlier, with a few exceptions to allow for a transition period. The following table summarizes the activity to date related to this program:
The payment terms vary by country, but generally are paid in a lump sum at cessation of employment. The entire amount of the liability is considered current and is included in other accrued expenses in the accompanying consolidated balance sheets.
Modules Production Transfer In an effort to reduce costs and streamline production of its module products within its Diodes segment, the Company committed to two smaller cost reduction programs related to the transferring of production of certain of its products. The following table summarizes the activity to date related to this program:
Severance benefits are generally paid in a lump sum at cessation of employment. The entire amount of the liability is considered current and is included in other accrued expenses in the accompanying consolidated balance sheets. Gain on Sale of Vacated Property On April 3, 2012, Vishay sold a property in Belgium vacated as a result of its restructuring activities in prior years for approximately $14,200. At closing, Vishay recognized a gain on the sale of the property of $12,153 within its statements of operations and proceeds from the sale of property and equipment of $3,406 within its statement of cash flows. The remaining proceeds are reported as proceeds from the sale of property and equipment within the statements of cash flows as the cash is received. At December 31, 2014, the remaining amount receivable by the Company is $1,771.
F-21
NOTES TO THE CONSOLIDATED FINANCIAL STATEMENTS (dollars in thousands, except per share amounts)
Expense recorded in 2013 $ 486 Cash paid (98) Foreign currency translation 3 Balance at December 31, 2013 $ 391 Expense recorded in 2014 12,792 Cash paid (8,054) Foreign currency translation (455) Balance at December 31, 2014 $ 4,674
Expense recorded in 2014 $ 2,080 Cash paid (464) Foreign currency translation (121) Balance at December 31, 2014 $ 1,495

Note 5 – Income Taxes Income (loss) from continuing operations before taxes and noncontrolling interests consists of the following components:
Significant components of income taxes are as follows:
F-22
NOTES TO THE CONSOLIDATED FINANCIAL STATEMENTS (dollars in thousands, except per share amounts)
Years ended December 31, 2014 2013 2012 Domestic $ (50,106) $ (26,065) $ (15,995) Foreign 217,249 202,470 186,032 $ 167,143 $ 176,405 $ 170,037
Years ended December 31, 2014 2013 2012 Current:
Federal $ (27,031) $ (603) $ 8,409 State and local 386 280 574 Foreign 60,282 51,225 44,351
33,637 50,902 53,334 Deferred:
Federal 7,999 2,215 (8,557) State and local 204 92 (240) Foreign 7,460 (573) 1,969
15,663 1,734 (6,828) Total income tax expense $ 49,300 $ 52,636 $ 46,506
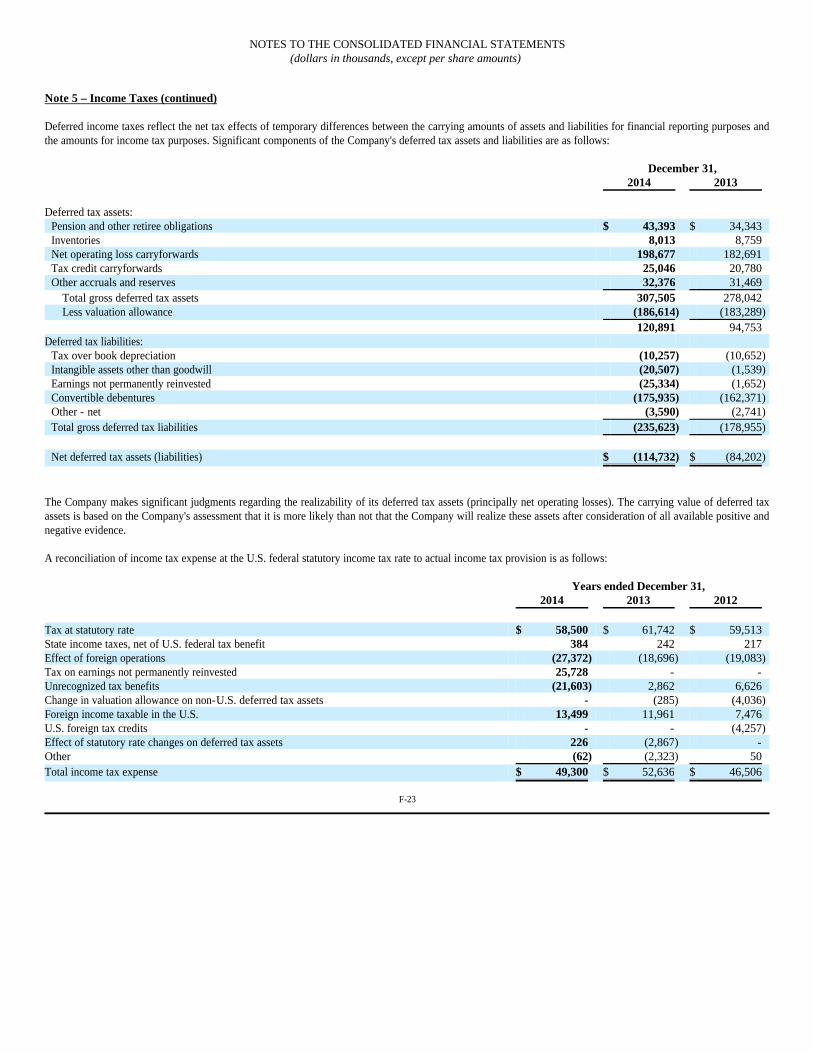
Note 5 – Income Taxes (continued) Deferred income taxes reflect the net tax effects of temporary differences between the carrying amounts of assets and liabilities for financial reporting purposes and the amounts for income tax purposes. Significant components of the Company's deferred tax assets and liabilities are as follows:
The Company makes significant judgments regarding the realizability of its deferred tax assets (principally net operating losses). The carrying value of deferred tax assets is based on the Company's assessment that it is more likely than not that the Company will realize these assets after consideration of all available positive and negative evidence. A reconciliation of income tax expense at the U.S. federal statutory income tax rate to actual income tax provision is as follows:
F-23
NOTES TO THE CONSOLIDATED FINANCIAL STATEMENTS (dollars in thousands, except per share amounts)
December 31, 2014 2013 Deferred tax assets:
Pension and other retiree obligations $ 43,393 $ 34,343 Inventories 8,013 8,759 Net operating loss carryforwards 198,677 182,691 Tax credit carryforwards 25,046 20,780 Other accruals and reserves 32,376 31,469
Total gross deferred tax assets 307,505 278,042 Less valuation allowance (186,614) (183,289)
120,891 94,753 Deferred tax liabilities:
Tax over book depreciation (10,257) (10,652) Intangible assets other than goodwill (20,507) (1,539) Earnings not permanently reinvested (25,334) (1,652) Convertible debentures (175,935) (162,371) Other - net (3,590) (2,741) Total gross deferred tax liabilities (235,623) (178,955)
Net deferred tax assets (liabilities) $ (114,732) $ (84,202)
Years ended December 31, 2014 2013 2012 Tax at statutory rate $ 58,500 $ 61,742 $ 59,513 State income taxes, net of U.S. federal tax benefit 384 242 217 Effect of foreign operations (27,372) (18,696) (19,083) Tax on earnings not permanently reinvested 25,728 - - Unrecognized tax benefits (21,603) 2,862 6,626 Change in valuation allowance on non-U.S. deferred tax assets - (285) (4,036) Foreign income taxable in the U.S. 13,499 11,961 7,476 U.S. foreign tax credits - - (4,257) Effect of statutory rate changes on deferred tax assets 226 (2,867) - Other (62) (2,323) 50 Total income tax expense $ 49,300 $ 52,636 $ 46,506

Note 5 – Income Taxes (continued) Income tax expense for the years ended December 31, 2014, 2013, and 2012 include certain discrete tax items for changes in uncertain tax positions, valuation allowances, tax rates, and other related items. These items total $1,228 (tax benefit), $4,197 (tax benefit), and $4,036 (tax benefit) in 2014, 2013, and 2012, respectively. For the year ended December 31, 2014, the discrete items include a $1,228 benefit recorded in the fourth fiscal quarter due to the enactment of The Tax Increase Prevention Act of 2014. The discrete items also include benefits upon the completion of certain tax examinations and lapses in the statute of limitations, offset by additional tax expenses for expected repatriation of cash and profits of non-U.S. subsidiaries to the United States, primarily to repay amounts borrowed on the revolving credit facility to provide future flexibility given the legal entity and the financial structure utilized for the Capella acquisition. The latter two items netted to an immaterial amount. For the year ended December 31, 2013, the discrete items include a $2,867 benefit recorded in the third fiscal quarter due to a new tax law enacted in Israel in July 2013 which effectively increases the corporate income tax rate on certain types of income earned after January 1, 2014, and, therefore, increases the deferred tax assets, and a $1,330 benefit recorded in the first fiscal quarter due to the retroactive enactment of the American Taxpayer Relief Act of 2012, signed into law on January 2, 2013. For the year ended December 31, 2012, the discrete item is the reduction of a valuation allowance on a deferred tax asset in Israel due to a merger of several of the Company's wholly-owned subsidiaries in Israel in the fourth fiscal quarter which will allow for the realization of these tax benefits that likely otherwise would have been forgone. At December 31, 2014, the Company had the following significant net operating loss carryforwards for tax purposes:
Approximately $64,232 of the carryforwards in Belgium resulted from the Company's acquisition of BCcomponents in 2002. Valuation allowances of $21,833 and $24,788, as of December 31, 2014 and 2013, respectively, have been recorded through goodwill for these acquired net operating losses. Prior to the adoption of updated guidance in ASC Topic 805 on January 1, 2009, if tax benefits were recognized through the utilization of these acquired net operating losses, the benefits of such loss utilization were recorded as a reduction to goodwill. After the adoption of the updated guidance on January 1, 2009, the benefits of such losses are recorded as a reduction of tax expense. At December 31, 2014, the Company had the following significant tax credit carryforwards available:
F-24
NOTES TO THE CONSOLIDATED FINANCIAL STATEMENTS (dollars in thousands, except per share amounts)
Expires Austria $ 14,515 No expiration Belgium 173,541 No expiration Brazil 14,876 No expiration Germany 42,968 No expiration Israel 62,528 No expiration Netherlands 23,411 2015 - 2023 United States 78,784 2033 - 2034 California 53,979 2016 - 2034 Pennsylvania 736,159 2018 - 2034
Expires U.S. Foreign Tax Credit $ 11,093 2020 - 2022 California Research Credit 10,926 No expiration

Note 5 – Income Taxes (continued) At December 31, 2014, no provision has been made for U.S. federal and state income taxes on approximately $2,686,284 of foreign earnings. Substantially all earnings generated by non-U.S. subsidiaries prior to 2014, and cash generated in 2014 which is not funding the dividend program or the Capella acquisition (as discussed below), are deemed to be reinvested outside of the United States indefinitely. Upon distribution of those earnings in the form of dividends or otherwise, the Company would be subject to U.S. income taxes (subject to an adjustment for foreign tax credits), state income taxes, incremental foreign income taxes, and withholding taxes payable to various foreign countries. Determination of the amount of unrecognized deferred U.S. income tax liability is not practicable because of the complexities associated with its hypothetical calculation. In 2008, the Company recorded additional tax expense for an expected repatriation of $112,500 because such earnings were not deemed to be indefinitely reinvested outside of the United States. During 2012 and 2014, the Company repatriated $72,100 and $4,588 of cash, respectively, which completed the repatriation program initiated in 2008. This repatriated cash was used to reduce the amount outstanding under the Company's revolving credit facility. During 2014, the Company borrowed $53,000 on its revolving credit facility to achieve future flexibility given the legal entity and the financial structure utilized for the Capella acquisition (see Note 2). Subsequent to the acquisition of the noncontrolling interest in Capella on December 31, 2014, the Company expects to repatriate cash from the current earnings of non-U.S. subsidiaries to the United States primarily to repay those borrowings on the revolving credit facility, and also to realign the acquired entity structure to have Capella's U.S. subsidiary directly owned by Vishay Intertechnology, Inc. The tax provision for the year ended December 31, 2014 includes all U.S. federal and state income taxes, incremental foreign income taxes, and withholding taxes payable related to that anticipated repatriation transaction. The Company expects to fund the quarterly dividend program initiated in February 2014, by, at least in part, repatriating current year income of certain non-U.S. subsidiaries and providing appropriate U.S. federal and state income taxes, incremental foreign income taxes, and withholding taxes payable on that current period non-U.S. income. Net income taxes paid were $62,051, $44,757, and $46,611 for the years ended December 31, 2014, 2013, and 2012, respectively. See Note 19 for a discussion of the tax-related uncertainties for the pre-spin-off period of Vishay Precision Group, Inc. ("VPG"), which was spun off on July 6, 2010.
F-25
NOTES TO THE CONSOLIDATED FINANCIAL STATEMENTS (dollars in thousands, except per share amounts)
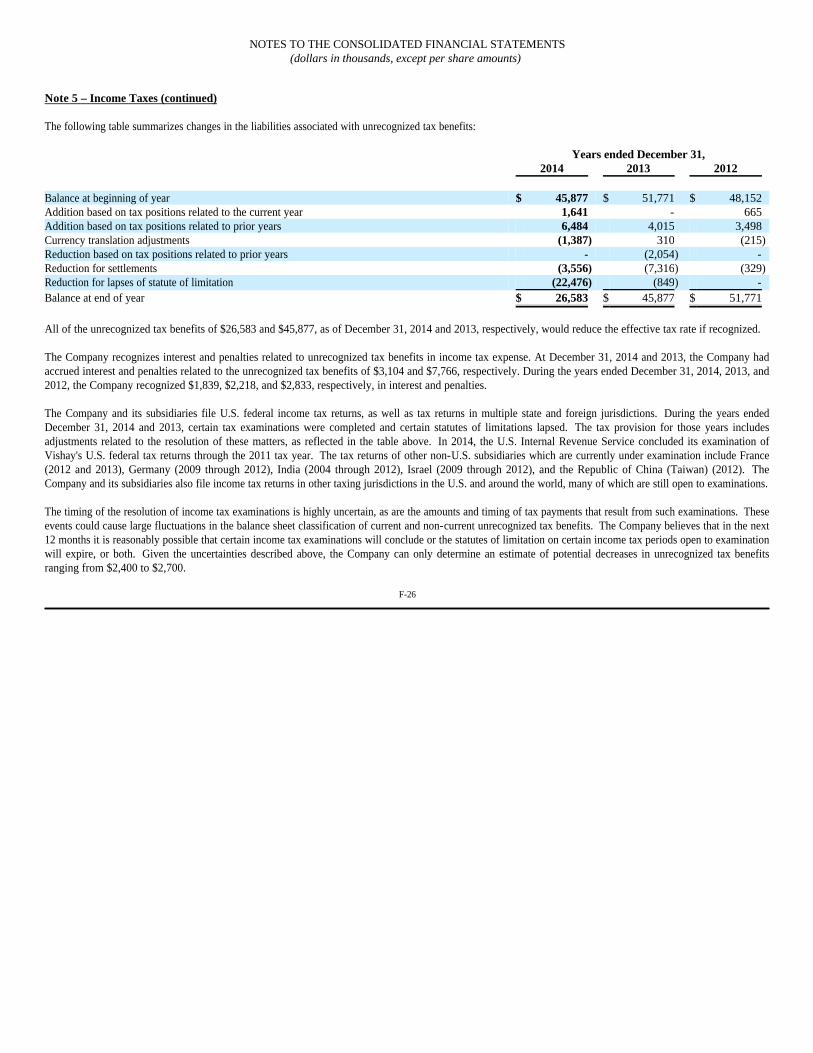
Note 5 – Income Taxes (continued) The following table summarizes changes in the liabilities associated with unrecognized tax benefits:
All of the unrecognized tax benefits of $26,583 and $45,877, as of December 31, 2014 and 2013, respectively, would reduce the effective tax rate if recognized. The Company recognizes interest and penalties related to unrecognized tax benefits in income tax expense. At December 31, 2014 and 2013, the Company had accrued interest and penalties related to the unrecognized tax benefits of $3,104 and $7,766, respectively. During the years ended December 31, 2014, 2013, and 2012, the Company recognized $1,839, $2,218, and $2,833, respectively, in interest and penalties. The Company and its subsidiaries file U.S. federal income tax returns, as well as tax returns in multiple state and foreign jurisdictions. During the years ended December 31, 2014 and 2013, certain tax examinations were completed and certain statutes of limitations lapsed. The tax provision for those years includes adjustments related to the resolution of these matters, as reflected in the table above. In 2014, the U.S. Internal Revenue Service concluded its examination of Vishay's U.S. federal tax returns through the 2011 tax year. The tax returns of other non-U.S. subsidiaries which are currently under examination include France (2012 and 2013), Germany (2009 through 2012), India (2004 through 2012), Israel (2009 through 2012), and the Republic of China (Taiwan) (2012). The Company and its subsidiaries also file income tax returns in other taxing jurisdictions in the U.S. and around the world, many of which are still open to examinations. The timing of the resolution of income tax examinations is highly uncertain, as are the amounts and timing of tax payments that result from such examinations. These events could cause large fluctuations in the balance sheet classification of current and non-current unrecognized tax benefits. The Company believes that in the next 12 months it is reasonably possible that certain income tax examinations will conclude or the statutes of limitation on certain income tax periods open to examination will expire, or both. Given the uncertainties described above, the Company can only determine an estimate of potential decreases in unrecognized tax benefits ranging from $2,400 to $2,700.
F-26
NOTES TO THE CONSOLIDATED FINANCIAL STATEMENTS (dollars in thousands, except per share amounts)
Years ended December 31, 2014 2013 2012 Balance at beginning of year $ 45,877 $ 51,771 $ 48,152 Addition based on tax positions related to the current year 1,641 - 665 Addition based on tax positions related to prior years 6,484 4,015 3,498 Currency translation adjustments (1,387) 310 (215) Reduction based on tax positions related to prior years - (2,054) - Reduction for settlements (3,556) (7,316) (329) Reduction for lapses of statute of limitation (22,476) (849) - Balance at end of year $ 26,583 $ 45,877 $ 51,771
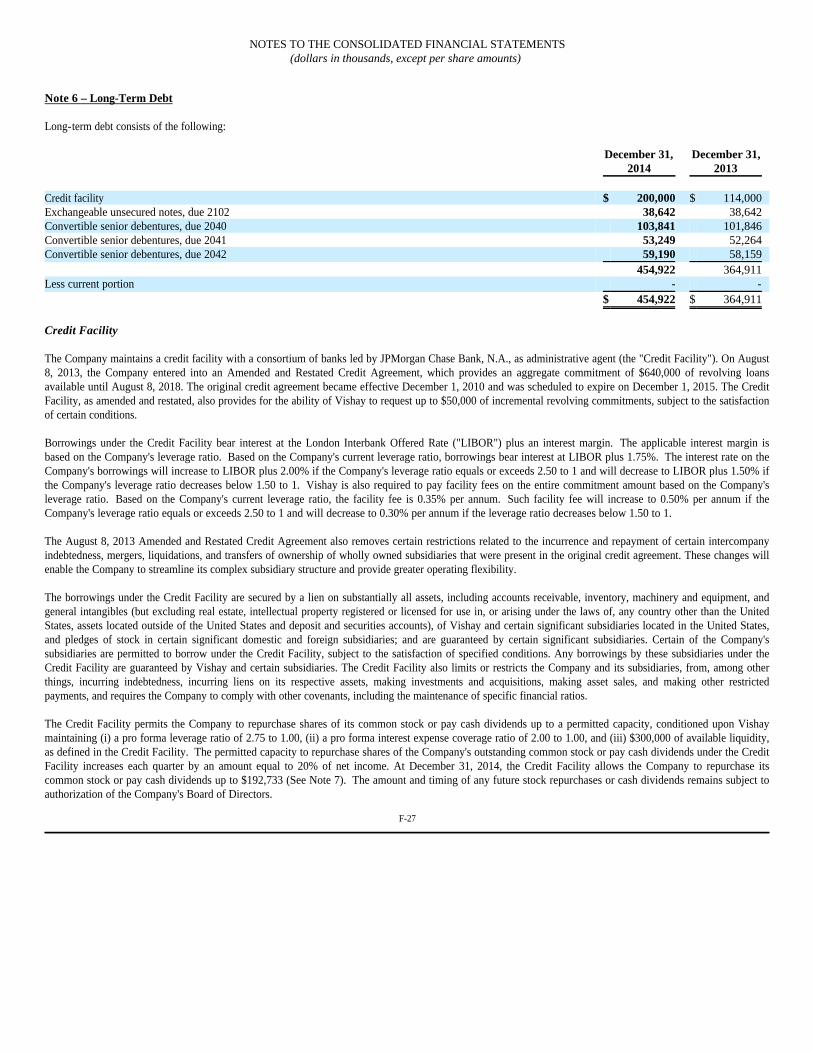
Note 6 – Long-Term Debt Long-term debt consists of the following:
Credit Facility The Company maintains a credit facility with a consortium of banks led by JPMorgan Chase Bank, N.A., as administrative agent (the "Credit Facility"). On August 8, 2013, the Company entered into an Amended and Restated Credit Agreement, which provides an aggregate commitment of $640,000 of revolving loans available until August 8, 2018. The original credit agreement became effective December 1, 2010 and was scheduled to expire on December 1, 2015. The Credit Facility, as amended and restated, also provides for the ability of Vishay to request up to $50,000 of incremental revolving commitments, subject to the satisfaction of certain conditions. Borrowings under the Credit Facility bear interest at the London Interbank Offered Rate ("LIBOR") plus an interest margin. The applicable interest margin is based on the Company's leverage ratio. Based on the Company's current leverage ratio, borrowings bear interest at LIBOR plus 1.75%. The interest rate on the Company's borrowings will increase to LIBOR plus 2.00% if the Company's leverage ratio equals or exceeds 2.50 to 1 and will decrease to LIBOR plus 1.50% if the Company's leverage ratio decreases below 1.50 to 1. Vishay is also required to pay facility fees on the entire commitment amount based on the Company's leverage ratio. Based on the Company's current leverage ratio, the facility fee is 0.35% per annum. Such facility fee will increase to 0.50% per annum if the Company's leverage ratio equals or exceeds 2.50 to 1 and will decrease to 0.30% per annum if the leverage ratio decreases below 1.50 to 1. The August 8, 2013 Amended and Restated Credit Agreement also removes certain restrictions related to the incurrence and repayment of certain intercompany indebtedness, mergers, liquidations, and transfers of ownership of wholly owned subsidiaries that were present in the original credit agreement. These changes will enable the Company to streamline its complex subsidiary structure and provide greater operating flexibility. The borrowings under the Credit Facility are secured by a lien on substantially all assets, including accounts receivable, inventory, machinery and equipment, and general intangibles (but excluding real estate, intellectual property registered or licensed for use in, or arising under the laws of, any country other than the United States, assets located outside of the United States and deposit and securities accounts), of Vishay and certain significant subsidiaries located in the United States, and pledges of stock in certain significant domestic and foreign subsidiaries; and are guaranteed by certain significant subsidiaries. Certain of the Company's subsidiaries are permitted to borrow under the Credit Facility, subject to the satisfaction of specified conditions. Any borrowings by these subsidiaries under the Credit Facility are guaranteed by Vishay and certain subsidiaries. The Credit Facility also limits or restricts the Company and its subsidiaries, from, among other things, incurring indebtedness, incurring liens on its respective assets, making investments and acquisitions, making asset sales, and making other restricted payments, and requires the Company to comply with other covenants, including the maintenance of specific financial ratios. The Credit Facility permits the Company to repurchase shares of its common stock or pay cash dividends up to a permitted capacity, conditioned upon Vishay maintaining (i) a pro forma leverage ratio of 2.75 to 1.00, (ii) a pro forma interest expense coverage ratio of 2.00 to 1.00, and (iii) $300,000 of available liquidity, as defined in the Credit Facility. The permitted capacity to repurchase shares of the Company's outstanding common stock or pay cash dividends under the Credit Facility increases each quarter by an amount equal to 20% of net income. At December 31, 2014, the Credit Facility allows the Company to repurchase its common stock or pay cash dividends up to $192,733 (See Note 7). The amount and timing of any future stock repurchases or cash dividends remains subject to authorization of the Company's Board of Directors.
F-27
NOTES TO THE CONSOLIDATED FINANCIAL STATEMENTS (dollars in thousands, except per share amounts)
December 31, 2014
December 31, 2013
Credit facility $ 200,000 $ 114,000 Exchangeable unsecured notes, due 2102 38,642 38,642 Convertible senior debentures, due 2040 103,841 101,846 Convertible senior debentures, due 2041 53,249 52,264 Convertible senior debentures, due 2042 59,190 58,159 454,922 364,911 Less current portion - - $ 454,922 $ 364,911

Note 6 – Long-Term Debt (continued) The Credit Facility also contains customary events of default, including, but not limited to, failure to pay principal or interest, failure to pay or default under other material debt, material misrepresentation or breach of warranty, violation of certain covenants, a change of control, the commencement of bankruptcy proceedings, the insolvency of Vishay or certain of its significant subsidiaries, and the rendering of a judgment in excess of $25,000 against Vishay or certain of its significant subsidiaries. Upon the occurrence of an event of default under the Credit Facility, the Company's obligations under the credit facility may be accelerated and the lending commitments under the credit facility terminated. At December 31, 2014 and 2013, there was $432,445 and $518,345, respectively, available under the Credit Facility. Letters of credit totaling $7,555 and $7,655 were outstanding at December 31, 2014 and 2013, respectively. Convertible Senior Debentures Vishay currently has three issuances of convertible senior debentures outstanding with generally congruent terms. The proceeds from the issuance of the convertible senior debentures were used to repurchase shares of the Company's common stock. The quarterly cash dividend program of the Company results in adjustments to the conversion rate and effective conversion price for each issuance of the Company's convertible senior debentures effective as of the ex-dividend date of each cash dividend. The following table summarizes some key facts and terms regarding the three series of outstanding convertible senior debentures following the adjustment made to the conversion rate of the debentures on the ex-dividend date of the December 16, 2014 dividend payment:
Prior to three months before the maturity date, the holders may only convert their debentures under the following circumstances: (1) during any fiscal quarter after the first full quarter subsequent to issuance, if the sale price of Vishay common stock reaches 130% of the conversion price for a specified period; (2) the trading price of the debentures falls below 98% of the product of the sale price of Vishay's common stock and the conversion rate for a specified period; (3) Vishay calls any or all of the debentures for redemption, at any time prior to the close of business on the third scheduled trading day immediately preceding the redemption date; or (4) upon the occurrence of specified corporate events. The convertible debentures due 2042 became convertible subsequent to the September 27, 2014 evaluation of the conversion criteria, due to the sale price of Vishay's common stock exceeding 130% of the conversion price for the applicable period in the third fiscal quarter of 2014. The debentures due 2042 remained convertible until December 31, 2014, at which time the conversion criteria was reevaluated. The convertible debentures due 2042 are no longer convertible subsequent to the December 31, 2014 reevaluation of the conversion criteria. The conversion criteria of the convertible senior debentures due 2040, due 2041, and due 2042 will continue to be evaluated and the convertible debentures may become convertible again in the future. The debentures are convertible, subject to certain conditions, into cash, shares of Vishay's common stock or a combination thereof, at Vishay's option, at the conversion rate. At the direction of its Board of Directors, the Company intends, upon future conversion of any of the convertible senior debentures, to repay the principal amounts of the convertible senior debentures in cash and settle any additional amounts in shares of Vishay common stock. The Company intends to finance the principal amount of any converted debentures using borrowings under its credit facility. Accordingly, the debt component of the convertible debentures due 2042 remained classified as a non-current liability in the consolidated balance sheets during the period such debentures were convertible. Vishay must provide additional shares upon conversion if there is a "fundamental change" in the business as defined in the indenture governing the debentures. Vishay may not redeem the debentures prior to the respective call dates. On or after the call date and prior to the maturity date, Vishay may redeem for cash all or part of the debentures at a redemption price equal to 100% of the principal amount of the debentures to be redeemed, plus accrued and unpaid interest to, but excluding, the redemption date, if the last reported sale price of Vishay's common stock has been at least 150% of the conversion price then in effect for at least 20 trading days during any 30 consecutive trading day period prior to the date on which Vishay provides notice of redemption.
F-28
NOTES TO THE CONSOLIDATED FINANCIAL STATEMENTS (dollars in thousands, except per share amounts)
Due 2040 Due 2041 Due 2042
Issuance date November 9,
2010 May 13, 2011 May 31, 2012
Maturity date November 15,
2040 May 15, 2041 June 1, 2042 Principal amount $ 275,000 $ 150,000 $ 150,000 Cash coupon rate (per annum) 2.25% 2.25% 2.25%Nonconvertible debt borrowing rate at issuance (per annum) 8.00% 8.375% 7.50%Conversion rate effective November 24, 2014 (per $1 principal amount) 73.2147 53.4282 86.0829 Effective conversion price effective November 24, 2014 (per share) $ 13.66 $ 18.72 $ 11.62 130% of the conversion price (per share) $ 17.76 $ 24.34 $ 15.11
Call date November 20,
2020 May 20, 2021 June 7, 2022

Note 6 – Long-Term Debt (continued) GAAP requires an issuer to separately account for the liability and equity components of the instrument in a manner that reflects the issuer's nonconvertible debt borrowing rate when interest costs are recognized in subsequent periods. The resulting discount on the debt is amortized as non-cash interest expense in future periods. The carrying values of the liability and equity components of the convertible debentures are reflected in the Company's consolidated balance sheets as follows:
Interest is payable on the debentures semi-annually at the cash coupon rate; however, the remaining debt discount is being amortized as additional non-cash interest expense using an effective annual interest rate equal to the Company's estimated nonconvertible debt borrowing rate at the time of issuance. In addition to ordinary interest, contingent interest will accrue in certain circumstances relating to the trading price of the debentures and under certain other circumstances beginning ten years subsequent to issuance. Interest expense related to the debentures is reflected on the consolidated statements of operations for the years ended December 31:
F-29
NOTES TO THE CONSOLIDATED FINANCIAL STATEMENTS (dollars in thousands, except per share amounts)
Principal amount of the
debentures Unamortized
discount Embedded derivative
Carrying value of liability
component
Equity component - net carrying
value
December 31, 2014 Due 2040 $ 275,000 (171,685) 526 $ 103,841 $ 110,094 Due 2041 $ 150,000 (97,092) 341 $ 53,249 $ 62,246 Due 2042 $ 150,000 (91,048) 238 $ 59,190 $ 57,874
Total $ 575,000 $ (359,825) $ 1,105 $ 216,280 $ 230,214
December 31, 2013
Due 2040 $ 275,000 (173,645) 491 $ 101,846 $ 110,094 Due 2041 $ 150,000 (98,085) 349 $ 52,264 $ 62,246 Due 2042 $ 150,000 (92,038) 197 $ 58,159 $ 57,874
Total $ 575,000 $ (363,768) $ 1,037 $ 212,269 $ 230,214
Contractual coupon interest
Non-cash amortization
of debt discount
Non-cash amortization of deferred financing
costs
Non-cash change in value of
derivative liability
Total interest expense
related to the debentures
2014
Due 2040 $ 6,188 1,960 88 35 $ 8,271 Due 2041 $ 3,375 993 47 (8) $ 4,407 Due 2042 $ 3,375 990 54 41 $ 4,460
Total $ 12,938 $ 3,943 $ 189 $ 68 $ 17,138
2013
Due 2040 $ 6,188 1,811 88 (131) $ 7,956 Due 2041 $ 3,375 915 47 (50) $ 4,287 Due 2042 $ 3,375 920 54 (85) $ 4,264
Total $ 12,938 $ 3,646 $ 189 $ (266) $ 16,507
2012
Due 2040 $ 6,188 1,675 88 28 $ 7,979 Due 2041 $ 3,375 843 45 7 $ 4,270 Due 2042 $ 1,978 510 32 46 $ 2,566
Total $ 11,541 $ 3,028 $ 165 $ 81 $ 14,815
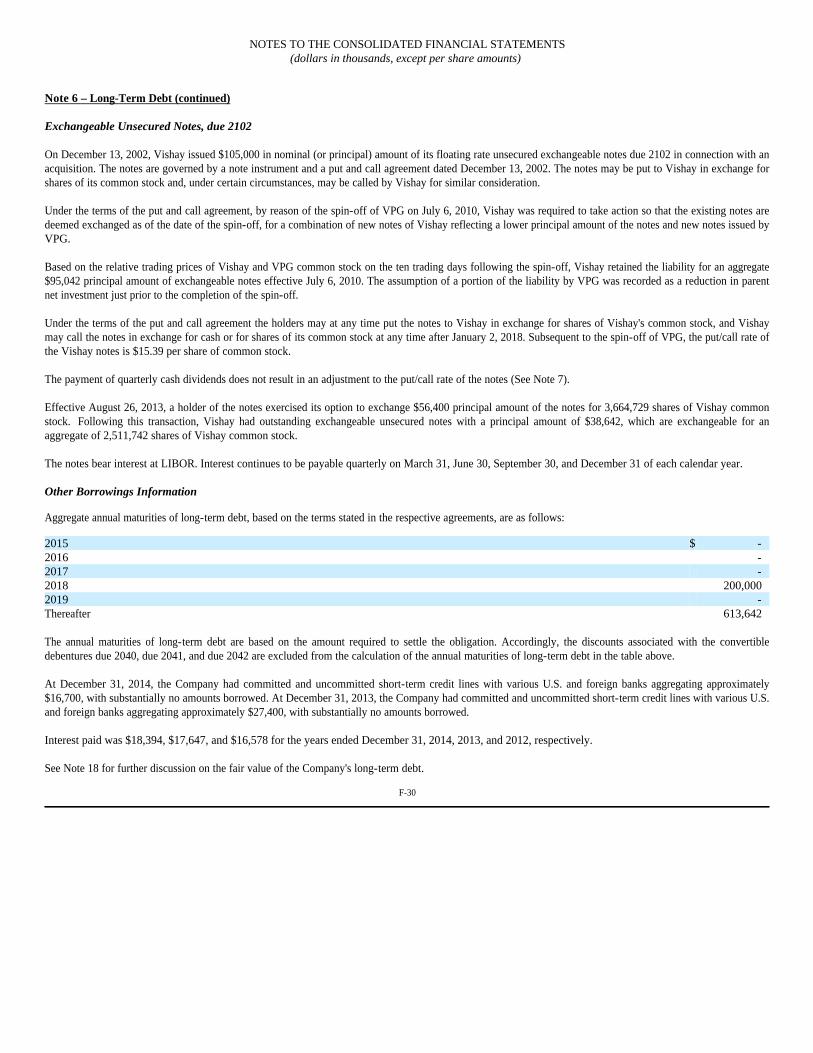
Note 6 – Long-Term Debt (continued) Exchangeable Unsecured Notes, due 2102 On December 13, 2002, Vishay issued $105,000 in nominal (or principal) amount of its floating rate unsecured exchangeable notes due 2102 in connection with an acquisition. The notes are governed by a note instrument and a put and call agreement dated December 13, 2002. The notes may be put to Vishay in exchange for shares of its common stock and, under certain circumstances, may be called by Vishay for similar consideration. Under the terms of the put and call agreement, by reason of the spin-off of VPG on July 6, 2010, Vishay was required to take action so that the existing notes are deemed exchanged as of the date of the spin-off, for a combination of new notes of Vishay reflecting a lower principal amount of the notes and new notes issued by VPG. Based on the relative trading prices of Vishay and VPG common stock on the ten trading days following the spin-off, Vishay retained the liability for an aggregate $95,042 principal amount of exchangeable notes effective July 6, 2010. The assumption of a portion of the liability by VPG was recorded as a reduction in parent net investment just prior to the completion of the spin-off. Under the terms of the put and call agreement the holders may at any time put the notes to Vishay in exchange for shares of Vishay's common stock, and Vishay may call the notes in exchange for cash or for shares of its common stock at any time after January 2, 2018. Subsequent to the spin-off of VPG, the put/call rate of the Vishay notes is $15.39 per share of common stock. The payment of quarterly cash dividends does not result in an adjustment to the put/call rate of the notes (See Note 7). Effective August 26, 2013, a holder of the notes exercised its option to exchange $56,400 principal amount of the notes for 3,664,729 shares of Vishay common stock. Following this transaction, Vishay had outstanding exchangeable unsecured notes with a principal amount of $38,642, which are exchangeable for an aggregate of 2,511,742 shares of Vishay common stock. The notes bear interest at LIBOR. Interest continues to be payable quarterly on March 31, June 30, September 30, and December 31 of each calendar year. Other Borrowings Information
Aggregate annual maturities of long-term debt, based on the terms stated in the respective agreements, are as follows:
The annual maturities of long-term debt are based on the amount required to settle the obligation. Accordingly, the discounts associated with the convertible debentures due 2040, due 2041, and due 2042 are excluded from the calculation of the annual maturities of long-term debt in the table above. At December 31, 2014, the Company had committed and uncommitted short-term credit lines with various U.S. and foreign banks aggregating approximately $16,700, with substantially no amounts borrowed. At December 31, 2013, the Company had committed and uncommitted short-term credit lines with various U.S. and foreign banks aggregating approximately $27,400, with substantially no amounts borrowed. Interest paid was $18,394, $17,647, and $16,578 for the years ended December 31, 2014, 2013, and 2012, respectively. See Note 18 for further discussion on the fair value of the Company's long-term debt.
F-30
NOTES TO THE CONSOLIDATED FINANCIAL STATEMENTS (dollars in thousands, except per share amounts)
2015 $ - 2016 - 2017 - 2018 200,000 2019 - Thereafter 613,642
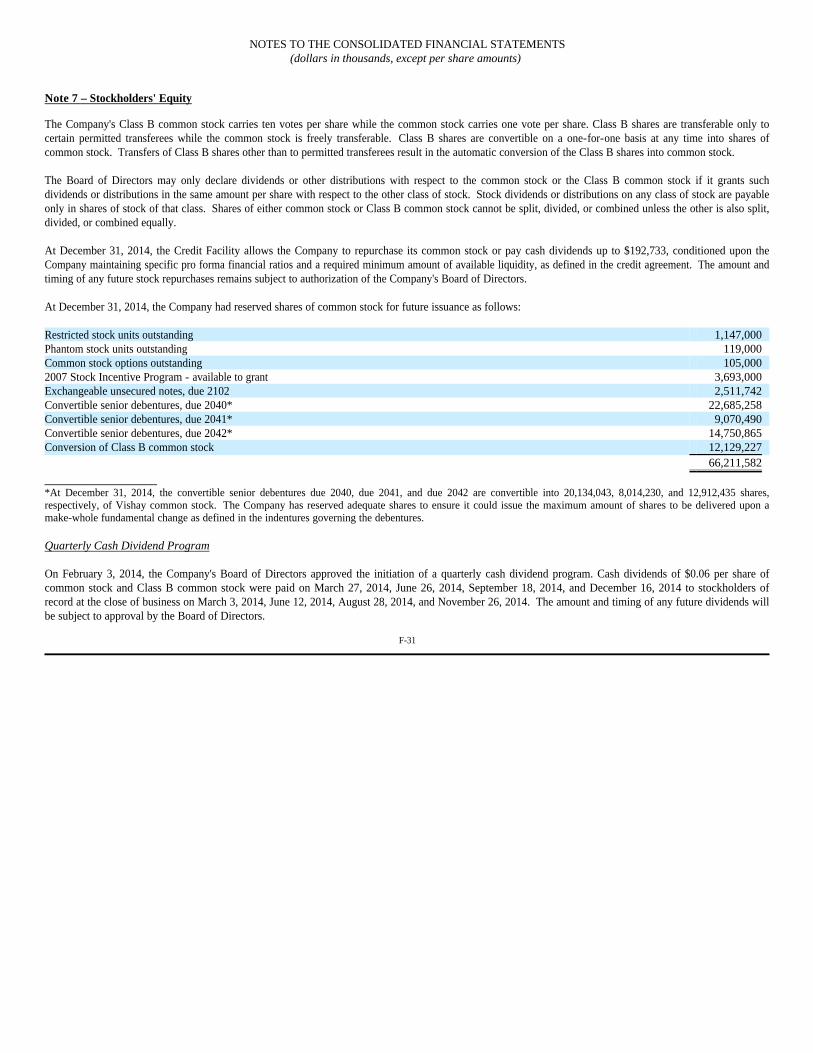
Note 7 – Stockholders' Equity
The Company's Class B common stock carries ten votes per share while the common stock carries one vote per share. Class B shares are transferable only to certain permitted transferees while the common stock is freely transferable. Class B shares are convertible on a one-for-one basis at any time into shares of common stock. Transfers of Class B shares other than to permitted transferees result in the automatic conversion of the Class B shares into common stock. The Board of Directors may only declare dividends or other distributions with respect to the common stock or the Class B common stock if it grants such dividends or distributions in the same amount per share with respect to the other class of stock. Stock dividends or distributions on any class of stock are payable only in shares of stock of that class. Shares of either common stock or Class B common stock cannot be split, divided, or combined unless the other is also split, divided, or combined equally. At December 31, 2014, the Credit Facility allows the Company to repurchase its common stock or pay cash dividends up to $192,733, conditioned upon the Company maintaining specific pro forma financial ratios and a required minimum amount of available liquidity, as defined in the credit agreement. The amount and timing of any future stock repurchases remains subject to authorization of the Company's Board of Directors. At December 31, 2014, the Company had reserved shares of common stock for future issuance as follows:
___________________ *At December 31, 2014, the convertible senior debentures due 2040, due 2041, and due 2042 are convertible into 20,134,043, 8,014,230, and 12,912,435 shares, respectively, of Vishay common stock. The Company has reserved adequate shares to ensure it could issue the maximum amount of shares to be delivered upon a make-whole fundamental change as defined in the indentures governing the debentures. Quarterly Cash Dividend Program On February 3, 2014, the Company's Board of Directors approved the initiation of a quarterly cash dividend program. Cash dividends of $0.06 per share of common stock and Class B common stock were paid on March 27, 2014, June 26, 2014, September 18, 2014, and December 16, 2014 to stockholders of record at the close of business on March 3, 2014, June 12, 2014, August 28, 2014, and November 26, 2014. The amount and timing of any future dividends will be subject to approval by the Board of Directors.
F-31
NOTES TO THE CONSOLIDATED FINANCIAL STATEMENTS (dollars in thousands, except per share amounts)
Restricted stock units outstanding 1,147,000 Phantom stock units outstanding 119,000 Common stock options outstanding 105,000 2007 Stock Incentive Program - available to grant 3,693,000 Exchangeable unsecured notes, due 2102 2,511,742 Convertible senior debentures, due 2040* 22,685,258 Convertible senior debentures, due 2041* 9,070,490 Convertible senior debentures, due 2042* 14,750,865 Conversion of Class B common stock 12,129,227 66,211,582
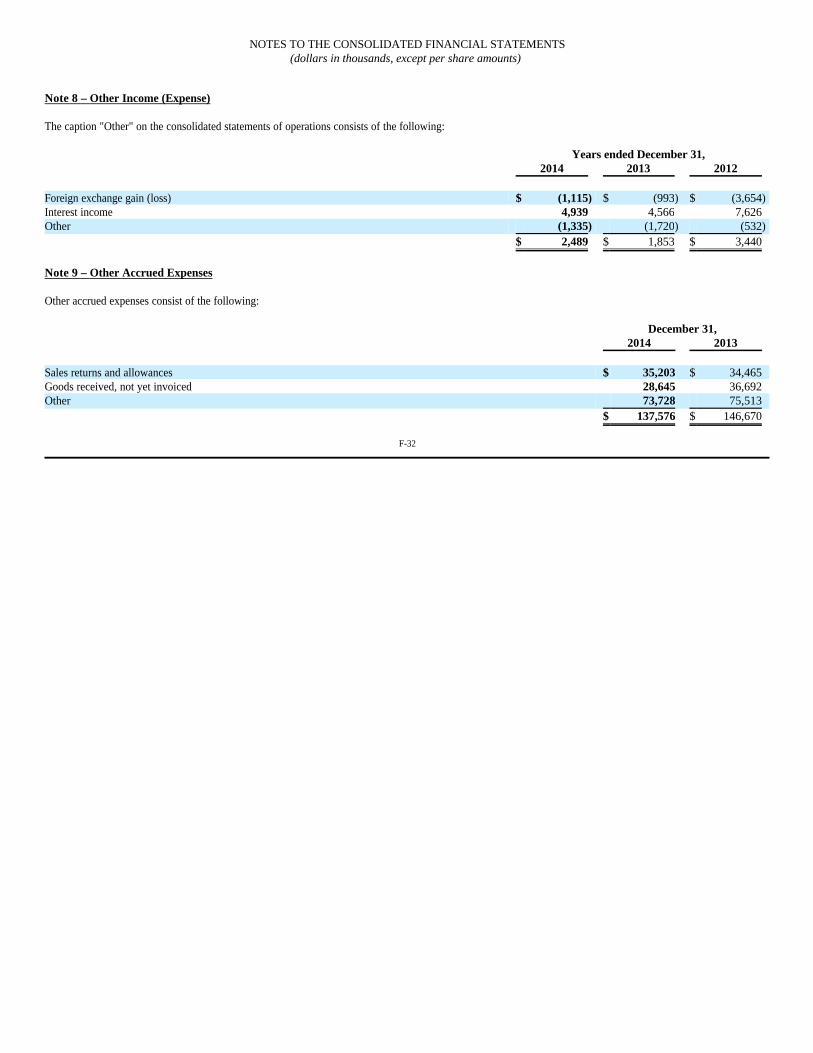
Note 8 – Other Income (Expense) The caption "Other" on the consolidated statements of operations consists of the following:
Note 9 – Other Accrued Expenses Other accrued expenses consist of the following:
F-32
NOTES TO THE CONSOLIDATED FINANCIAL STATEMENTS (dollars in thousands, except per share amounts)
Years ended December 31, 2014 2013 2012 Foreign exchange gain (loss) $ (1,115) $ (993) $ (3,654) Interest income 4,939 4,566 7,626 Other (1,335) (1,720) (532) $ 2,489 $ 1,853 $ 3,440
December 31, 2014 2013 Sales returns and allowances $ 35,203 $ 34,465 Goods received, not yet invoiced 28,645 36,692 Other 73,728 75,513 $ 137,576 $ 146,670

Note 10 – Accumulated Other Comprehensive Income (Loss) The cumulative balance of each component of other comprehensive income (loss) and the income tax effects allocated to each component are as follows:
Reclassifications of pension and other post-retirement actuarial items out of AOCI are included in the computation of net periodic benefit cost. (See Note 11 for further information). The amount of unrealized gains (losses) on available-for-sale securities reclassified out of AOCI as a result of sales of securities held by the Company's rabbi trust used to fund a deferred compensation plan was $24, $1,966, and $0 for the years ended December 31, 2014, 2013, and 2012, respectively. These reclassifications are recorded as a component of compensation expense within Selling, General, and Administrative expenses on our consolidated condensed statements of operations. The pre-tax amount of unrealized gains (losses) on available-for-sale securities reclassified out of AOCI as a result of sales of available-for-sale securities was $54, $53, and $0 for the years ended December 31, 2014, 2013, and 2012, respectively. These reclassifications are recorded as a component of Other Income on our consolidated condensed statements of operations. The tax effect of the reclassifications of unrealized gains (losses) on available-for-sale securities is recorded as a component of Income Tax Expense on our consolidated condensed statements of operations. Other comprehensive income (loss) includes Vishay's proportionate share of other comprehensive income (loss) of nonconsolidated subsidiaries accounted for under the equity method.
F-33
NOTES TO THE CONSOLIDATED FINANCIAL STATEMENTS (dollars in thousands, except per share amounts)
Pension and other post-retirement actuarial
items
Currency translation adjustment
Unrealized gain (loss) on available-for-sale securities Total
Balance at January 1, 2012 $ (149,197) $ 152,894 $ 81 $ 3,778
Other comprehensive income before reclassifications (57,072) 14,567 1,834 $ (40,671) Tax effect 16,626 - (642) $ 15,984 Other comprehensive income before reclassifications, net of tax (40,446) 14,567 1,192 $ (24,687) Amounts reclassified out of AOCI 16,059 - - $ 16,059 Tax effect (5,372) - - $ (5,372) Amounts reclassified out of AOCI, net of tax 10,687 - - $ 10,687
Net comprehensive income $ (29,759) $ 14,567 $ 1,192 $ (14,000) Balance at December 31, 2012 $ (178,956) $ 167,461 $ 1,273 $ (10,222)
Other comprehensive income before reclassifications 52,545 23,537 913 $ 76,995 Tax effect (16,334) - (299) $ (16,633) Other comprehensive income before reclassifications, net of tax 36,211 23,537 614 $ 60,362 Amounts reclassified out of AOCI 19,112 - (2,019) $ 17,093 Tax effect (6,285) - 686 $ (5,599) Amounts reclassified out of AOCI, net of tax 12,827 - (1,333) $ 11,494
Net comprehensive income $ 49,038 $ 23,537 $ (719) $ 71,856 Balance at December 31, 2013 $ (129,918) $ 190,998 $ 554 $ 61,634
Other comprehensive income (loss) before reclassifications (60,602) (106,295) 2,175 $ (164,722) Tax effect 18,117 - (758) $ 17,359 Other comprehensive income (loss) before reclassifications, net of tax (42,485) (106,295) 1,417 $ (147,363) Amounts reclassified out of AOCI 25,604 - (78) $ 25,526 Tax effect (8,961) - 24 $ (8,937) Amounts reclassified out of AOCI, net of tax 16,643 - (54) $ 16,589
Net comprehensive income (loss) $ (25,842) $ (106,295) $ 1,363 $ (130,774) Balance at December 31, 2014 $ (155,760) $ 84,703 $ 1,917 $ (69,140)

Note 11 – Pensions and Other Postretirement Benefits The Company maintains various retirement benefit plans. GAAP requires employers to recognize the funded status of a benefit plan, measured as the difference between plan assets at fair value and the benefit obligation, in its balance sheet. The recognition of the funded status on the balance sheet requires employers to recognize actuarial items (such as actuarial gains and losses, prior service costs, and transition obligations) as a component of other comprehensive income, net of tax. The following table summarizes amounts recorded on the consolidated balance sheets associated with these various retirement benefit plans:
* - Amounts included in accumulated other comprehensive loss are presented in this table pre-tax. Defined Benefit Pension Plans U.S. Pension Plans The Company maintains several defined benefit pension plans which covered most full-time U.S. employees. These include pension plans which are "qualified" under the Employee Retirement Income Security Act of 1974 ("ERISA") and the Internal Revenue Code, and "non-qualified" pension plans which provide defined benefits primarily to U.S. employees whose benefits under the qualified pension plan would be limited by ERISA and the Internal Revenue Code. Pension benefits earned are generally based on years of service and compensation during active employment. The Society of Actuaries Retirement Plans Experience Committee issued new mortality tables and a new mortality improvement scale in 2014. The new mortality tables and mortality improvement scale are based on a recent study of mortality experience in the United States, and reflect improved retiree longevity. The use of the new mortality tables and mortality improvement scale increased the Company's projected benefit obligations by approximately $24,000 and will increase future net periodic pension cost. Qualified U.S. Pension Plans The qualified U.S. pension plans historically included both contributory and non-contributory plans. The Company's principal qualified U.S. pension plan (the Vishay Retirement Plan) was funded through Company and participant contributions to an irrevocable trust fund. The Company's other qualified U.S. pension plans, which were assumed as a result of past acquisitions, were funded only through Company contributions.
F-34
NOTES TO THE CONSOLIDATED FINANCIAL STATEMENTS (dollars in thousands, except per share amounts)
December 31, 2014 2013 Included in "Other assets": U.S. pension plans $ 12,964 $ 15,708 Non-U.S. pension plans 212 257 Total included in other assets $ 13,176 $ 15,965
Included in "Payroll and related expenses": U.S. pension plans $ (51) $ (51) Non-U.S. pension plans (6,624) (7,644) U.S. other postretirement plans (666) (638) Non-U.S. other postretirement plans (349) - Total included in payroll and related expenses $ (7,690) $ (8,333)
Accrued pension and other postretirement costs: U.S. pension plans $ (40,744) $ (35,397) Non-U.S. pension plans (231,278) (224,280) U.S. other postretirement plans (8,011) (6,703) Non-U.S. other postretirement plans (6,934) (7,504) Other retirement obligations (13,557) (14,017) Total accrued pension and other postretirement costs $ (300,524) $ (287,901)
Accumulated other comprehensive loss: U.S. pension plans $ 88,474 $ 84,384 Non-U.S. pension plans 88,076 61,652 U.S. other postretirement plans (3,325) (5,782) Non-U.S. other postretirement plans 1,750 1,246 Total accumulated other comprehensive loss* $ 174,975 $ 141,500

Note 11 – Pensions and Other Postretirement Benefits (continued) In 2008, the Company adopted amendments to the Vishay Retirement Plan such that effective January 1, 2009, the plan was frozen. Pursuant to these amendments, no new employees may participate in the plan, no further participant contributions were required or permitted, and no further benefits shall accrue after December 31, 2008. Benefits accumulated as of December 31, 2008 will be paid to employees upon retirement, and the Company will likely need to make additional cash contributions to the plan to fund this accumulated benefit obligation. To mitigate the loss in benefits of these employees, effective January 1, 2009, the Company increased the Company-match portion of its 401(k) defined contribution savings plan for employees impacted by the pension freeze. The Company's other qualified U.S. pension plans had all been effectively frozen in prior years. All of the Company's qualified U.S. pension plans have been merged into the Vishay Retirement Plan. During the third fiscal quarter of 2014, the Company executed two partial-settlement transactions to reduce the risk associated with its U.S. qualified pension obligations. These transactions included the purchase of annuity contracts for approximately 700 participants pursuant to an arrangement inherited in a past acquisition and a special limited-time voluntary lump-sum payment offer to certain former employees who were deferred vested participants of the plan not currently receiving periodic payments of their pension benefit. A total of 800 participants accepted the voluntary lump-sum offer. The plan is no longer obligated to pay any benefits to the 1,500 participants covered by these two settlement transactions. These former participants represented approximately 23% of the total participants prior to executing these transactions. These transactions were funded entirely with plan assets and resulted in the recognition of non-cash settlement charges aggregating $15,588, representing previously unrecognized actuarial items. These non-cash charges are presented on a separate line in the consolidated statements of operations. The Company continues to evaluate options to further reduce the risk associated with its pension obligations. Non-qualified U.S. Pension Plans The Company's principal non-qualified U.S. pension plan (the Vishay Non-qualified Retirement Plan) was a contributory pension plan designed to provide similar defined benefits to covered U.S. employees whose benefits under the Vishay Retirement Plan would be limited by ERISA and the Internal Revenue Code. The Vishay Non-qualified Retirement Plan is identical in construction to the Vishay Retirement Plan, except that the plan is not qualified under ERISA. The Vishay Non-qualified Retirement Plan, like all non-qualified plans, is considered to be unfunded. The Company maintains a non-qualified trust, referred to as a "rabbi" trust, to fund benefit payments under this plan. Rabbi trust assets are subject to creditor claims under certain conditions and are not the property of employees. Therefore, they are accounted for as other noncurrent assets. Assets held in trust related to the non-qualified pension plan were $21,757 and $18,678 at December 31, 2014 and 2013, respectively. In 2008, the Company adopted amendments to the Vishay Non-Qualified Retirement Plan such that effective January 1, 2009, the plan was frozen. Pursuant to these amendments, no new employees may participate in the plans, no further participant contributions were required or permitted, and no further benefits shall accrue after December 31, 2008. Benefits accumulated as of December 31, 2008 will be paid to employees upon retirement, and the Company will likely need to make additional cash contributions to the rabbi trust to fund this accumulated benefit obligation. To mitigate the loss in benefits of these employees, effective January 1, 2009, the Company increased the Company-match portion of its 401(k) defined contribution savings plan for employees impacted by the pension freeze. The Company also maintains other pension plans which provide supplemental defined benefits primarily to former U.S. employees whose benefits under qualified pension plans were limited by ERISA. These non-qualified plans are all non-contributory plans, and are considered to be unfunded. In 2004, the Company entered into an employment agreement with Dr. Felix Zandman, its Executive Chairman and then-Chief Executive Officer. Pursuant to this agreement, the Company is providing an annual retirement benefit of approximately $614 to his surviving spouse. The Company maintains a non-qualified trust, referred to as a "rabbi" trust, to fund benefit payments under this plan. Rabbi trust assets are subject to creditor claims under certain conditions and are not the property of employees. Therefore, they are accounted for as other noncurrent assets. Assets held in trust related to this non-qualified pension plan were $3,607 and $4,221 at December 31, 2014 and 2013, respectively. In 2010, the Compensation Committee determined to modify Dr. Gerald Paul's and the Compensation Committee recommended to the Board of Directors, and the Board of Directors determined to modify Mr. Marc Zandman's employment arrangements such that upon any termination (other than for cause) after attaining age 62, the executive would be entitled to the same payments and benefits he would have received if his respective employment was terminated by Vishay without cause or by the respective executive for good reason. These modifications were included in formal amendments signed on August 8, 2010. The expense associated with the modifications to the employment arrangements of Dr. Gerald Paul and Mr. Marc Zandman effectively represents a defined retirement benefit that will be recognized over the remaining service period of the individuals.
F-35
NOTES TO THE CONSOLIDATED FINANCIAL STATEMENTS (dollars in thousands, except per share amounts)

Note 11 – Pensions and Other Postretirement Benefits (continued) Non-U.S. Pension Plans The Company provides pension and similar benefits to employees of certain non-U.S. subsidiaries consistent with local practices. Pension benefits earned are generally based on years of service and compensation during active employment. The following table sets forth a reconciliation of the benefit obligation, plan assets, and funded status related to U.S. and non-U.S. pension plans:
The plan assets are stated at fair value. See Note 18 for further discussion of the valuation of the plan assets. Amounts recognized in the consolidated balance sheet consist of the following:
F-36
NOTES TO THE CONSOLIDATED FINANCIAL STATEMENTS (dollars in thousands, except per share amounts)
December 31, 2014 December 31, 2013
U.S.
Plans Non-U.S.
Plans U.S.
Plans Non-U.S.
Plans Change in benefit obligation: Benefit obligation at beginning of year $ 315,373 $ 280,526 $ 355,065 $ 282,448 Service cost - 3,275 - 3,499 Interest cost 13,821 8,555 13,882 8,150 Acquisitions - 465 - - Plan amendments - - - 23 Actuarial (gains) losses 50,584 40,021 (34,703) (5,134) Benefits paid (18,940) (15,888) (18,871) (13,980) Curtailments and settlements (59,363) (486) - - Currency translation - (29,622) - 5,520 Benefit obligation at end of year $ 301,475 $ 286,846 $ 315,373 $ 280,526
Change in plan assets: Fair value of plan assets at beginning of year $ 295,633 $ 48,859 $ 265,866 46,580 Actual return on plan assets 38,688 1,858 31,018 2,482 Acquisitions - 10 - - Company contributions 17,626 17,015 17,620 14,781 Benefits paid (18,940) (15,888) (18,871) (13,980) Curtailments and settlements (59,363) (486) - - Currency translation - (2,212) - (1,004) Fair value of plan assets at end of year $ 273,644 $ 49,156 $ 295,633 $ 48,859
Funded status at end of year $ (27,831) $ (237,690) $ (19,740) $ (231,667)
December 31, 2014 December 31, 2013
U.S.
Plans Non-U.S.
Plans U.S.
Plans Non-U.S.
Plans Other assets $ 12,964 $ 212 $ 15,708 $ 257 Accrued benefit liability - currrent (51) (6,624) (51) (7,644) Accrued benefit liability - non-current (40,744) (231,278) (35,397) (224,280) Accumulated other comprehensive loss 88,474 88,076 84,384 61,652 $ 60,643 $ (149,614) $ 64,644 $ (170,015)

Note 11 – Pensions and Other Postretirement Benefits (continued) Actuarial items consist of the following:
The following table sets forth additional information regarding the projected and accumulated benefit obligations:
The following table sets forth the components of net periodic pension cost:
F-37
NOTES TO THE CONSOLIDATED FINANCIAL STATEMENTS (dollars in thousands, except per share amounts)
December 31, 2014 December 31, 2013
U.S.
Plans Non-U.S.
Plans U.S.
Plans Non-U.S.
Plans Unrecognized net actuarial loss $ 87,195 $ 88,076 $ 83,161 $ 61,652 Unamortized prior service cost 1,279 - 1,223 - $ 88,474 $ 88,076 $ 84,384 $ 61,652
December 31, 2014 December 31, 2013
U.S.
Plans Non-U.S.
Plans U.S.
Plans Non-U.S.
Plans Accumulated benefit obligation, all plans $ 301,475 $ 269,069 $ 315,373 $ 260,558 Plans for which the accumulated benefit obligation exceeds plan assets: Projected benefit obligation $ 40,795 $ 272,977 $ 35,448 $ 251,569 Accumulated benefit obligation 40,795 261,996 35,448 238,419 Fair value of plan assets - 37,634 - 21,356
Years ended December 31, 2014 2013 2012
U.S.
Plans Non-U.S.
Plans U.S.
Plans Non-U.S.
Plans U.S.
Plans Non-U.S.
Plans Service cost net of employee contributions $ - $ 3,275 $ - $ 3,499 $ - $ 3,247 Interest cost 13,821 8,555 13,882 8,150 15,699 9,374 Expected return on plan assets (14,892) (2,109) (19,124) (2,084) (18,972) (1,667) Amortization of actuarial losses 7,166 2,700 14,566 3,407 12,960 1,681 Amortization of prior service cost (credit) (56) (5) 978 (12) 2,200 60 Curtailment and settlement losses 15,588 1,137 - 959 - - Net periodic pension cost $ 21,627 $ 13,553 $ 10,302 $ 13,919 $ 11,887 $ 12,695
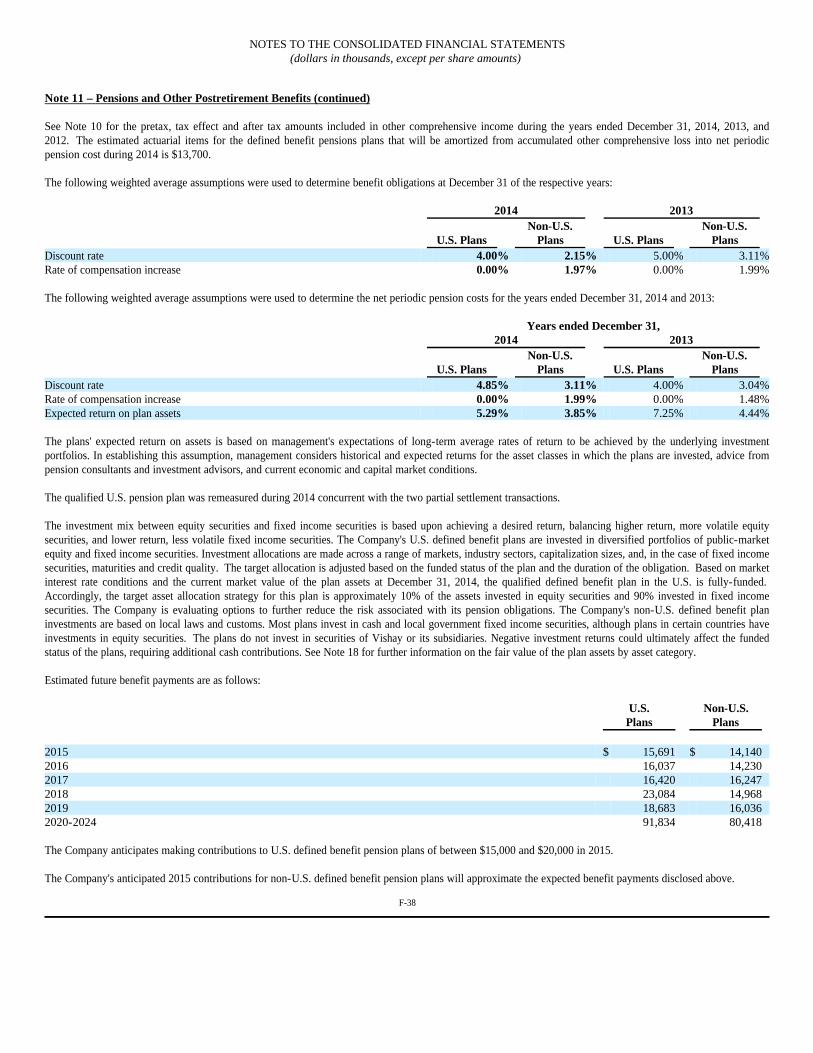
Note 11 – Pensions and Other Postretirement Benefits (continued) See Note 10 for the pretax, tax effect and after tax amounts included in other comprehensive income during the years ended December 31, 2014, 2013, and 2012. The estimated actuarial items for the defined benefit pensions plans that will be amortized from accumulated other comprehensive loss into net periodic pension cost during 2014 is $13,700. The following weighted average assumptions were used to determine benefit obligations at December 31 of the respective years:
The following weighted average assumptions were used to determine the net periodic pension costs for the years ended December 31, 2014 and 2013:
The plans' expected return on assets is based on management's expectations of long-term average rates of return to be achieved by the underlying investment portfolios. In establishing this assumption, management considers historical and expected returns for the asset classes in which the plans are invested, advice from pension consultants and investment advisors, and current economic and capital market conditions. The qualified U.S. pension plan was remeasured during 2014 concurrent with the two partial settlement transactions. The investment mix between equity securities and fixed income securities is based upon achieving a desired return, balancing higher return, more volatile equity securities, and lower return, less volatile fixed income securities. The Company's U.S. defined benefit plans are invested in diversified portfolios of public-market equity and fixed income securities. Investment allocations are made across a range of markets, industry sectors, capitalization sizes, and, in the case of fixed income securities, maturities and credit quality. The target allocation is adjusted based on the funded status of the plan and the duration of the obligation. Based on market interest rate conditions and the current market value of the plan assets at December 31, 2014, the qualified defined benefit plan in the U.S. is fully-funded. Accordingly, the target asset allocation strategy for this plan is approximately 10% of the assets invested in equity securities and 90% invested in fixed income securities. The Company is evaluating options to further reduce the risk associated with its pension obligations. The Company's non-U.S. defined benefit plan investments are based on local laws and customs. Most plans invest in cash and local government fixed income securities, although plans in certain countries have investments in equity securities. The plans do not invest in securities of Vishay or its subsidiaries. Negative investment returns could ultimately affect the funded status of the plans, requiring additional cash contributions. See Note 18 for further information on the fair value of the plan assets by asset category. Estimated future benefit payments are as follows:
The Company anticipates making contributions to U.S. defined benefit pension plans of between $15,000 and $20,000 in 2015. The Company's anticipated 2015 contributions for non-U.S. defined benefit pension plans will approximate the expected benefit payments disclosed above.
F-38
NOTES TO THE CONSOLIDATED FINANCIAL STATEMENTS (dollars in thousands, except per share amounts)
2014 2013
U.S. Plans Non-U.S.
Plans U.S. Plans Non-U.S.
Plans Discount rate 4.00% 2.15% 5.00% 3.11%Rate of compensation increase 0.00% 1.97% 0.00% 1.99%
Years ended December 31, 2014 2013 U.S. Plans
Non-U.S. Plans U.S. Plans
Non-U.S. Plans
Discount rate 4.85% 3.11% 4.00% 3.04%Rate of compensation increase 0.00% 1.99% 0.00% 1.48%Expected return on plan assets 5.29% 3.85% 7.25% 4.44%
U.S.
Plans Non-U.S.
Plans 2015 $ 15,691 $ 14,140 2016 16,037 14,230 2017 16,420 16,247 2018 23,084 14,968 2019 18,683 16,036 2020-2024 91,834 80,418
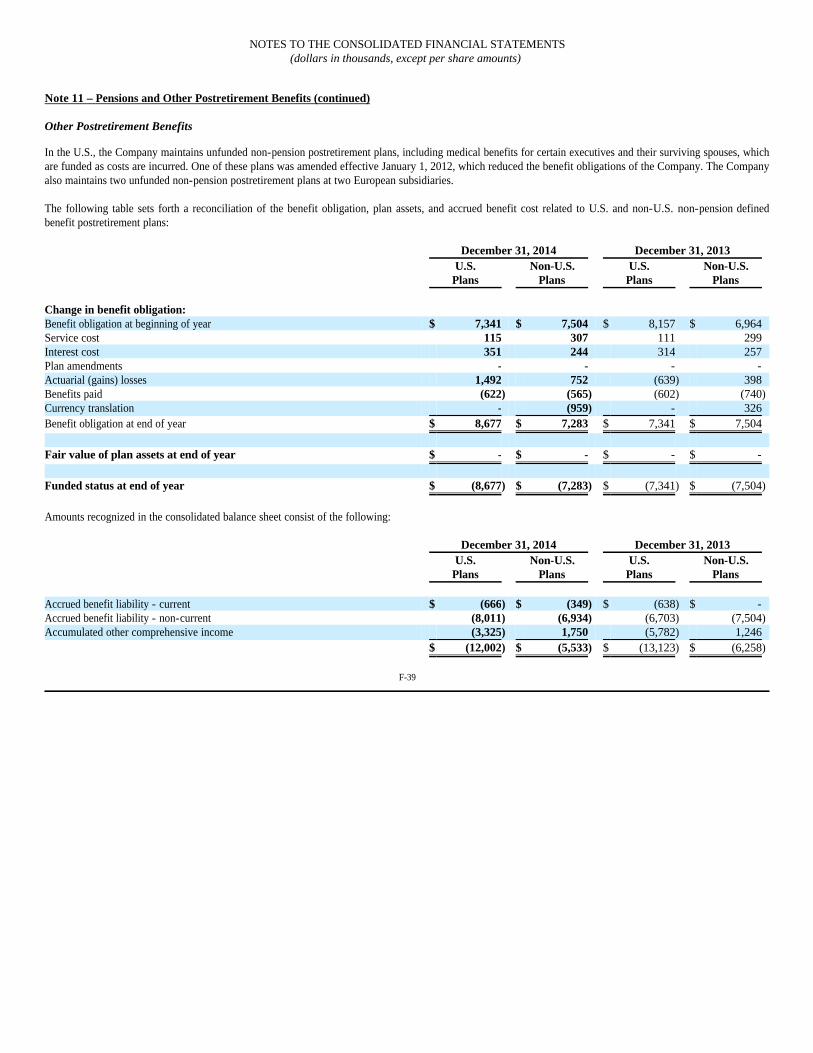
Note 11 – Pensions and Other Postretirement Benefits (continued) Other Postretirement Benefits
In the U.S., the Company maintains unfunded non-pension postretirement plans, including medical benefits for certain executives and their surviving spouses, which are funded as costs are incurred. One of these plans was amended effective January 1, 2012, which reduced the benefit obligations of the Company. The Company also maintains two unfunded non-pension postretirement plans at two European subsidiaries. The following table sets forth a reconciliation of the benefit obligation, plan assets, and accrued benefit cost related to U.S. and non-U.S. non-pension defined benefit postretirement plans:
Amounts recognized in the consolidated balance sheet consist of the following:
F-39
NOTES TO THE CONSOLIDATED FINANCIAL STATEMENTS (dollars in thousands, except per share amounts)
December 31, 2014 December 31, 2013
U.S.
Plans Non-U.S.
Plans U.S.
Plans Non-U.S.
Plans Change in benefit obligation: Benefit obligation at beginning of year $ 7,341 $ 7,504 $ 8,157 $ 6,964 Service cost 115 307 111 299 Interest cost 351 244 314 257 Plan amendments - - - - Actuarial (gains) losses 1,492 752 (639) 398 Benefits paid (622) (565) (602) (740) Currency translation - (959) - 326 Benefit obligation at end of year $ 8,677 $ 7,283 $ 7,341 $ 7,504
Fair value of plan assets at end of year $ - $ - $ - $ -
Funded status at end of year $ (8,677) $ (7,283) $ (7,341) $ (7,504)
December 31, 2014 December 31, 2013
U.S.
Plans Non-U.S.
Plans U.S.
Plans Non-U.S.
Plans Accrued benefit liability - current $ (666) $ (349) $ (638) $ - Accrued benefit liability - non-current (8,011) (6,934) (6,703) (7,504) Accumulated other comprehensive income (3,325) 1,750 (5,782) 1,246 $ (12,002) $ (5,533) $ (13,123) $ (6,258)

Note 11 – Pensions and Other Postretirement Benefits (continued) Actuarial items consist of the following:
The following table sets forth the components of net periodic benefit cost:
The estimated actuarial items for the other postretirement benefit plans that will be amortized from accumulated other comprehensive loss into net periodic benefit cost during 2014 are not material and approximate the amounts amortized in 2013. The following weighted average assumptions were used to determine benefit obligations at December 31 of the respective years:
The following weighted average assumptions were used to determine the net periodic benefit costs for the years ended December 31, 2014 and 2013:
The impact of a one-percentage-point change in assumed health care cost trend rates on the net periodic benefit cost and postretirement benefit obligation is not material.
F-40
NOTES TO THE CONSOLIDATED FINANCIAL STATEMENTS (dollars in thousands, except per share amounts)
December 31, 2014 December 31, 2013
U.S.
Plans Non-U.S.
Plans U.S.
Plans Non-U.S.
Plans Unrecognized net actuarial loss (gain) $ (668) $ 1,750 $ (2,301) $ 1,246 Unamortized prior service (credit) cost (2,657) - (3,481) - $ (3,325) $ 1,750 $ (5,782) $ 1,246
Years ended December 31, 2014 2013 2012
U.S. Plans Non-U.S.
Plans U.S. Plans Non-U.S.
Plans U.S. Plans Non-U.S.
Plans Service cost $ 115 $ 307 $ 111 $ 299 $ 106 $ 253 Interest cost 351 244 314 257 366 286 Amortization of actuarial (gains) losses (140) 38 4 8 (76) - Amortization of prior service credit (824) - (798) - (798) - Amortization of transition obligation - - - - 32 - Net periodic benefit cost (benefit) $ (498) $ 589 $ (369) $ 564 $ (370) $ 539
2014 2013 U.S. Plans
Non-U.S. Plans U.S. Plans
Non-U.S. Plans
Discount rate 4.00% 2.25% 5.00% 3.44%Rate of compensation increase 0.00% 2.87% 0.00% 3.19%
Years ended December 31, 2014 2013 U.S. Plans
Non-U.S. Plans U.S. Plans
Non-U.S. Plans
Discount rate 5.00% 3.44% 4.00% 3.80%Rate of compensation increase 0.00% 3.19% 0.00% 3.20%
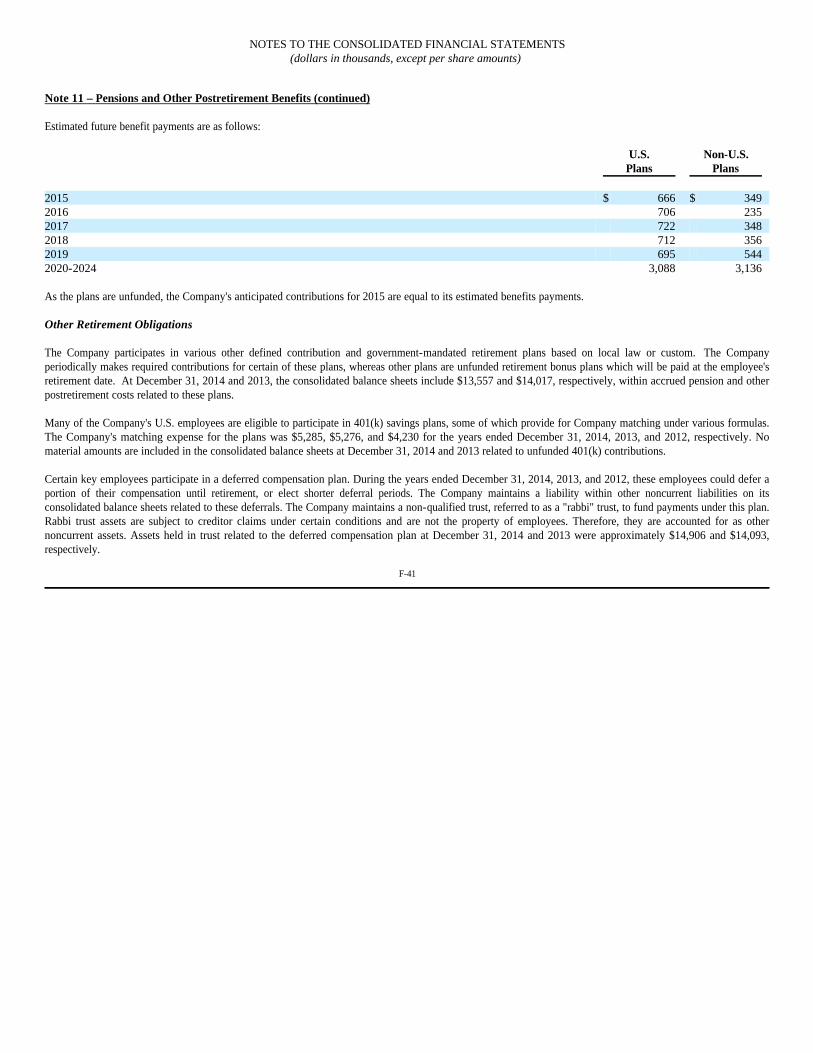
Note 11 – Pensions and Other Postretirement Benefits (continued) Estimated future benefit payments are as follows:
As the plans are unfunded, the Company's anticipated contributions for 2015 are equal to its estimated benefits payments. Other Retirement Obligations The Company participates in various other defined contribution and government-mandated retirement plans based on local law or custom. The Company periodically makes required contributions for certain of these plans, whereas other plans are unfunded retirement bonus plans which will be paid at the employee's retirement date. At December 31, 2014 and 2013, the consolidated balance sheets include $13,557 and $14,017, respectively, within accrued pension and other postretirement costs related to these plans. Many of the Company's U.S. employees are eligible to participate in 401(k) savings plans, some of which provide for Company matching under various formulas. The Company's matching expense for the plans was $5,285, $5,276, and $4,230 for the years ended December 31, 2014, 2013, and 2012, respectively. No material amounts are included in the consolidated balance sheets at December 31, 2014 and 2013 related to unfunded 401(k) contributions. Certain key employees participate in a deferred compensation plan. During the years ended December 31, 2014, 2013, and 2012, these employees could defer a portion of their compensation until retirement, or elect shorter deferral periods. The Company maintains a liability within other noncurrent liabilities on its consolidated balance sheets related to these deferrals. The Company maintains a non-qualified trust, referred to as a "rabbi" trust, to fund payments under this plan. Rabbi trust assets are subject to creditor claims under certain conditions and are not the property of employees. Therefore, they are accounted for as other noncurrent assets. Assets held in trust related to the deferred compensation plan at December 31, 2014 and 2013 were approximately $14,906 and $14,093, respectively.
F-41
NOTES TO THE CONSOLIDATED FINANCIAL STATEMENTS (dollars in thousands, except per share amounts)
U.S.
Plans Non-U.S.
Plans 2015 $ 666 $ 349 2016 706 235 2017 722 348 2018 712 356 2019 695 544 2020-2024 3,088 3,136
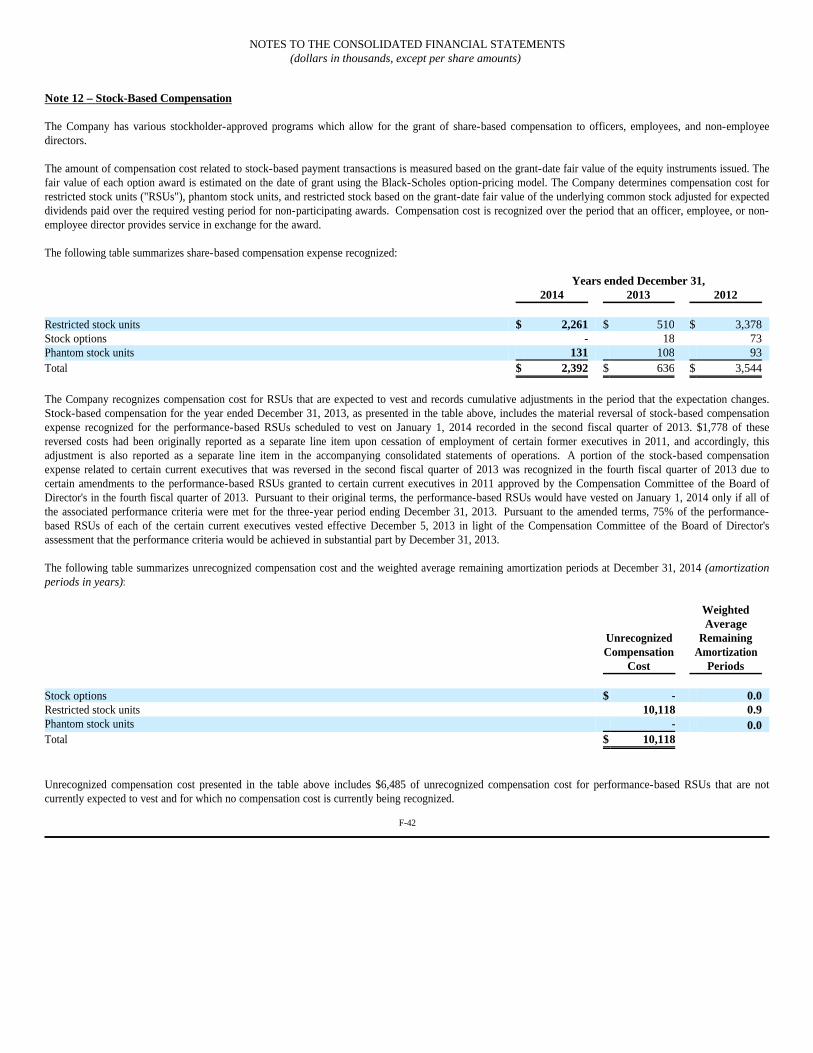
Note 12 – Stock-Based Compensation The Company has various stockholder-approved programs which allow for the grant of share-based compensation to officers, employees, and non-employee directors. The amount of compensation cost related to stock-based payment transactions is measured based on the grant-date fair value of the equity instruments issued. The fair value of each option award is estimated on the date of grant using the Black-Scholes option-pricing model. The Company determines compensation cost for restricted stock units ("RSUs"), phantom stock units, and restricted stock based on the grant-date fair value of the underlying common stock adjusted for expected dividends paid over the required vesting period for non-participating awards. Compensation cost is recognized over the period that an officer, employee, or non-employee director provides service in exchange for the award. The following table summarizes share-based compensation expense recognized:
The Company recognizes compensation cost for RSUs that are expected to vest and records cumulative adjustments in the period that the expectation changes. Stock-based compensation for the year ended December 31, 2013, as presented in the table above, includes the material reversal of stock-based compensation expense recognized for the performance-based RSUs scheduled to vest on January 1, 2014 recorded in the second fiscal quarter of 2013. $1,778 of these reversed costs had been originally reported as a separate line item upon cessation of employment of certain former executives in 2011, and accordingly, this adjustment is also reported as a separate line item in the accompanying consolidated statements of operations. A portion of the stock-based compensation expense related to certain current executives that was reversed in the second fiscal quarter of 2013 was recognized in the fourth fiscal quarter of 2013 due to certain amendments to the performance-based RSUs granted to certain current executives in 2011 approved by the Compensation Committee of the Board of Director's in the fourth fiscal quarter of 2013. Pursuant to their original terms, the performance-based RSUs would have vested on January 1, 2014 only if all of the associated performance criteria were met for the three-year period ending December 31, 2013. Pursuant to the amended terms, 75% of the performance-based RSUs of each of the certain current executives vested effective December 5, 2013 in light of the Compensation Committee of the Board of Director's assessment that the performance criteria would be achieved in substantial part by December 31, 2013. The following table summarizes unrecognized compensation cost and the weighted average remaining amortization periods at December 31, 2014 (amortization periods in years):
Unrecognized compensation cost presented in the table above includes $6,485 of unrecognized compensation cost for performance-based RSUs that are not currently expected to vest and for which no compensation cost is currently being recognized.
F-42
NOTES TO THE CONSOLIDATED FINANCIAL STATEMENTS (dollars in thousands, except per share amounts)
Years ended December 31, 2014 2013 2012 Restricted stock units $ 2,261 $ 510 $ 3,378 Stock options - 18 73 Phantom stock units 131 108 93 Total $ 2,392 $ 636 $ 3,544
Unrecognized Compensation
Cost
Weighted Average
Remaining Amortization
Periods Stock options $ - 0.0 Restricted stock units 10,118 0.9 Phantom stock units - 0.0 Total $ 10,118
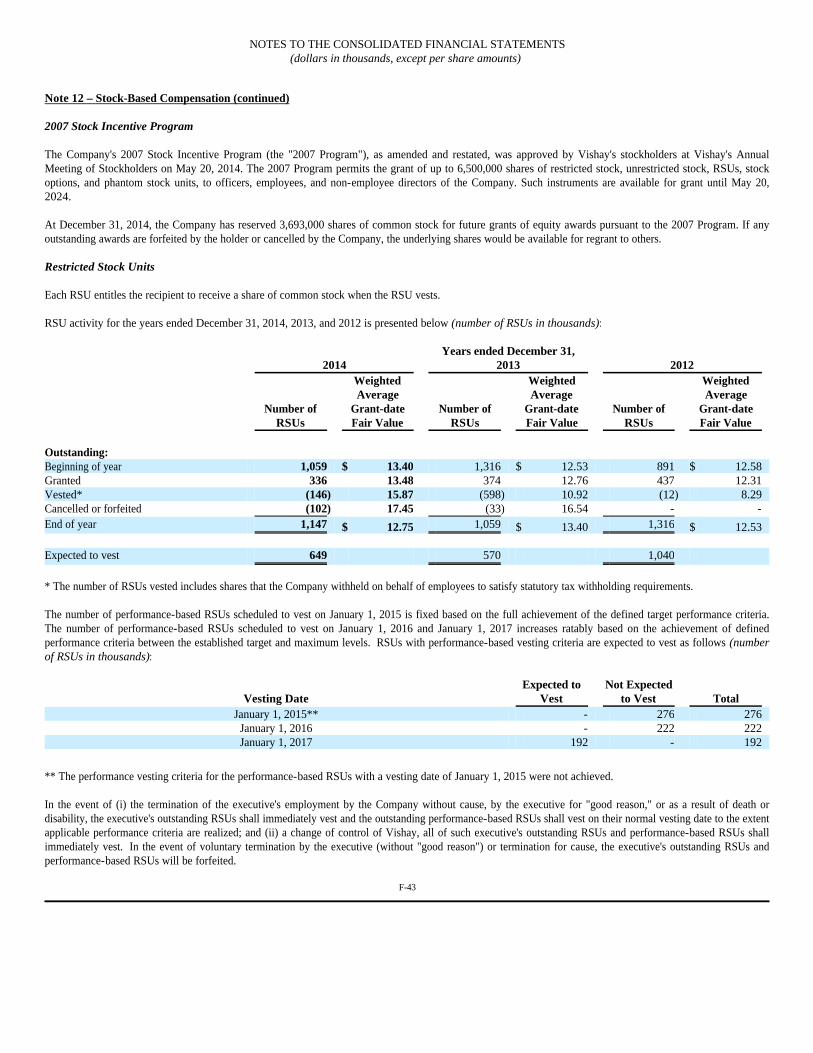
Note 12 – Stock-Based Compensation (continued) 2007 Stock Incentive Program The Company's 2007 Stock Incentive Program (the "2007 Program"), as amended and restated, was approved by Vishay's stockholders at Vishay's Annual Meeting of Stockholders on May 20, 2014. The 2007 Program permits the grant of up to 6,500,000 shares of restricted stock, unrestricted stock, RSUs, stock options, and phantom stock units, to officers, employees, and non-employee directors of the Company. Such instruments are available for grant until May 20, 2024. At December 31, 2014, the Company has reserved 3,693,000 shares of common stock for future grants of equity awards pursuant to the 2007 Program. If any outstanding awards are forfeited by the holder or cancelled by the Company, the underlying shares would be available for regrant to others. Restricted Stock Units Each RSU entitles the recipient to receive a share of common stock when the RSU vests. RSU activity for the years ended December 31, 2014, 2013, and 2012 is presented below (number of RSUs in thousands):
* The number of RSUs vested includes shares that the Company withheld on behalf of employees to satisfy statutory tax withholding requirements. The number of performance-based RSUs scheduled to vest on January 1, 2015 is fixed based on the full achievement of the defined target performance criteria. The number of performance-based RSUs scheduled to vest on January 1, 2016 and January 1, 2017 increases ratably based on the achievement of defined performance criteria between the established target and maximum levels. RSUs with performance-based vesting criteria are expected to vest as follows (number of RSUs in thousands):
** The performance vesting criteria for the performance-based RSUs with a vesting date of January 1, 2015 were not achieved. In the event of (i) the termination of the executive's employment by the Company without cause, by the executive for "good reason," or as a result of death or disability, the executive's outstanding RSUs shall immediately vest and the outstanding performance-based RSUs shall vest on their normal vesting date to the extent applicable performance criteria are realized; and (ii) a change of control of Vishay, all of such executive's outstanding RSUs and performance-based RSUs shall immediately vest. In the event of voluntary termination by the executive (without "good reason") or termination for cause, the executive's outstanding RSUs and performance-based RSUs will be forfeited.
F-43
NOTES TO THE CONSOLIDATED FINANCIAL STATEMENTS (dollars in thousands, except per share amounts)
Years ended December 31, 2014 2013 2012
Number of
RSUs
Weighted Average
Grant-date Fair Value
Number of RSUs
Weighted Average
Grant-date Fair Value
Number of RSUs
Weighted Average
Grant-date Fair Value
Outstanding: Beginning of year 1,059 $ 13.40 1,316 $ 12.53 891 $ 12.58 Granted 336 13.48 374 12.76 437 12.31 Vested* (146) 15.87 (598) 10.92 (12) 8.29 Cancelled or forfeited (102) 17.45 (33) 16.54 - - End of year 1,147 $ 12.75 1,059 $ 13.40 1,316 $ 12.53
Expected to vest 649 570 1,040
Vesting Date Expected to
Vest Not Expected
to Vest Total January 1, 2015** - 276 276
January 1, 2016 - 222 222 January 1, 2017 192 - 192
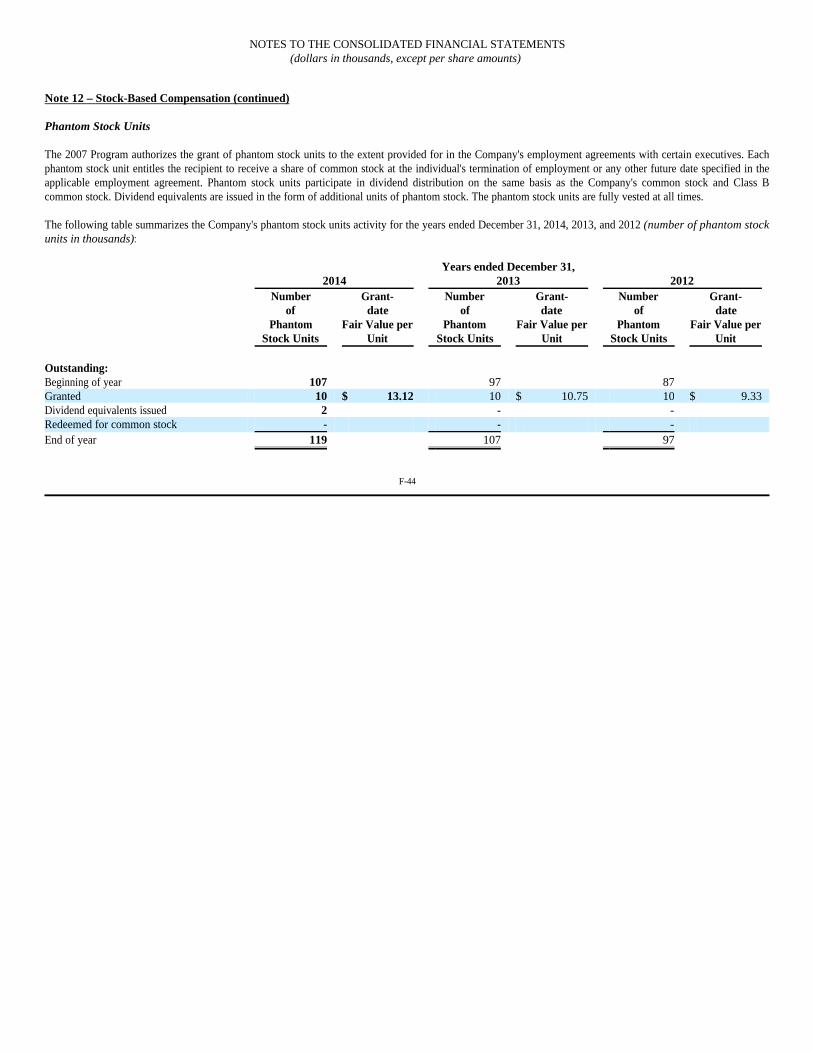
Note 12 – Stock-Based Compensation (continued) Phantom Stock Units The 2007 Program authorizes the grant of phantom stock units to the extent provided for in the Company's employment agreements with certain executives. Each phantom stock unit entitles the recipient to receive a share of common stock at the individual's termination of employment or any other future date specified in the applicable employment agreement. Phantom stock units participate in dividend distribution on the same basis as the Company's common stock and Class B common stock. Dividend equivalents are issued in the form of additional units of phantom stock. The phantom stock units are fully vested at all times. The following table summarizes the Company's phantom stock units activity for the years ended December 31, 2014, 2013, and 2012 (number of phantom stock units in thousands):
F-44
NOTES TO THE CONSOLIDATED FINANCIAL STATEMENTS (dollars in thousands, except per share amounts)
Years ended December 31, 2014 2013 2012
Number of
Phantom Stock Units
Grant- date
Fair Value per Unit
Number of
Phantom Stock Units
Grant- date
Fair Value per Unit
Number of
Phantom Stock Units
Grant- date
Fair Value per Unit
Outstanding: Beginning of year 107 97 87 Granted 10 $ 13.12 10 $ 10.75 10 $ 9.33 Dividend equivalents issued 2 - - Redeemed for common stock - - - End of year 119 107 97

Note 12 – Stock-Based Compensation (continued) Stock Options In addition to stock options outstanding pursuant to the 2007 Program, during the periods presented, the Company had stock options outstanding under previous stockholder-approved stock option programs. Under the 1998 Stock Option Program, certain executive officers and key employees were granted options. On March 16, 2008, the stockholder approval for the 1998 Stock Option Program expired. While no additional options may be granted pursuant to this plan, at December 31, 2014, 95,000 options issued under the 1998 Program remain outstanding and may be exercised in future periods. The following table summarizes the Company's stock option activity (number of options in thousands):
The following table summarizes information concerning stock options outstanding and exercisable at December 31, 2014 (number of options in thousands, contractual life in years):
The weighted-average remaining contractual life of all exercisable options is 2.33 years.
F-45
NOTES TO THE CONSOLIDATED FINANCIAL STATEMENTS (dollars in thousands, except per share amounts)
Years ended December 31, 2014 2013 2012
Number of
Options
Weighted Average
Exercise Price Number of
Options
Weighted Average
Exercise Price Number of
Options
Weighted Average
Exercise Price Outstanding: Beginning of year 109 $ 15.24 109 $ 15.24 384 $ 15.40 Granted - - - - - - Exercised (4) 11.62 - - (22) 7.89 Cancelled or forfeited - - - - (253) 16.12 End of year 105 $ 15.38 109 $ 15.24 109 $ 15.24
Vested and expected to vest 105 109 109
Exercisable: End of year 105 109 79
Options Outstanding & Exercisable
Exercise Price Number of Options Remaining
Contractual Life
$ 12.90 28 2.16 16.29 77 2.39 $ 15.38 105 2.33
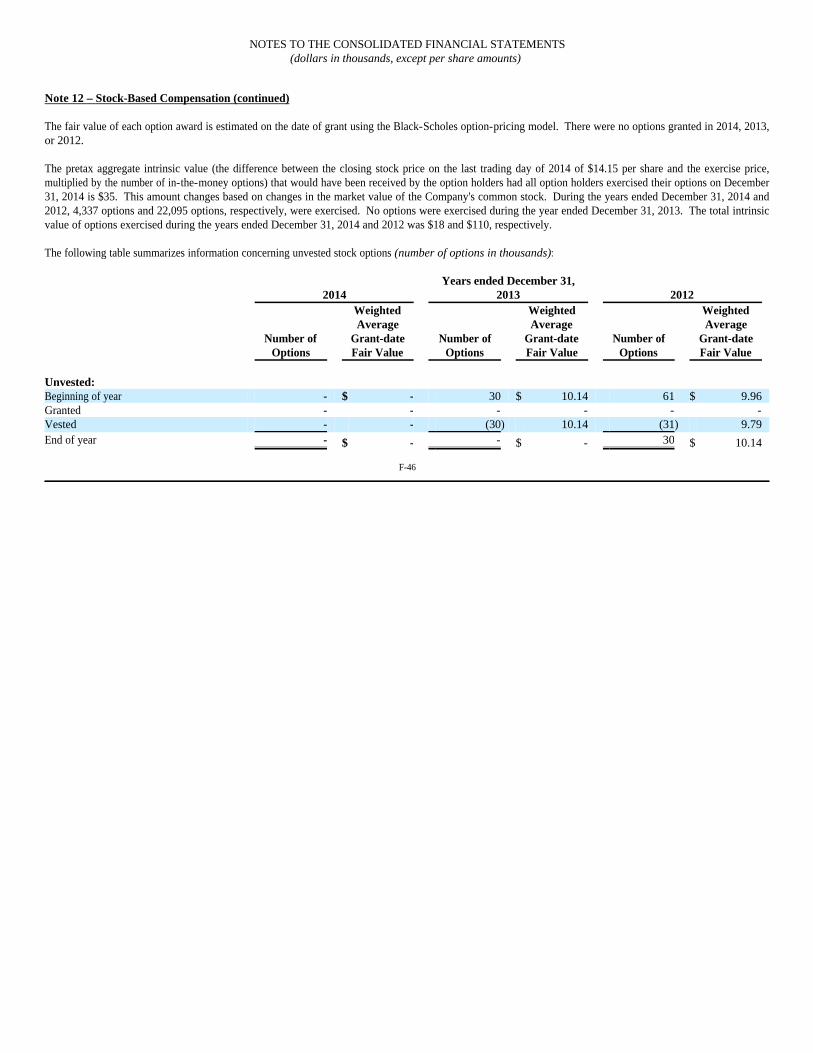
Note 12 – Stock-Based Compensation (continued) The fair value of each option award is estimated on the date of grant using the Black-Scholes option-pricing model. There were no options granted in 2014, 2013, or 2012. The pretax aggregate intrinsic value (the difference between the closing stock price on the last trading day of 2014 of $14.15 per share and the exercise price, multiplied by the number of in-the-money options) that would have been received by the option holders had all option holders exercised their options on December 31, 2014 is $35. This amount changes based on changes in the market value of the Company's common stock. During the years ended December 31, 2014 and 2012, 4,337 options and 22,095 options, respectively, were exercised. No options were exercised during the year ended December 31, 2013. The total intrinsic value of options exercised during the years ended December 31, 2014 and 2012 was $18 and $110, respectively. The following table summarizes information concerning unvested stock options (number of options in thousands):
F-46
NOTES TO THE CONSOLIDATED FINANCIAL STATEMENTS (dollars in thousands, except per share amounts)
Years ended December 31, 2014 2013 2012
Number of
Options
Weighted Average
Grant-date Fair Value
Number of Options
Weighted Average
Grant-date Fair Value
Number of Options
Weighted Average
Grant-date Fair Value
Unvested: Beginning of year - $ - 30 $ 10.14 61 $ 9.96 Granted - - - - - - Vested - - (30) 10.14 (31) 9.79 End of year - $ - - $ - 30 $ 10.14
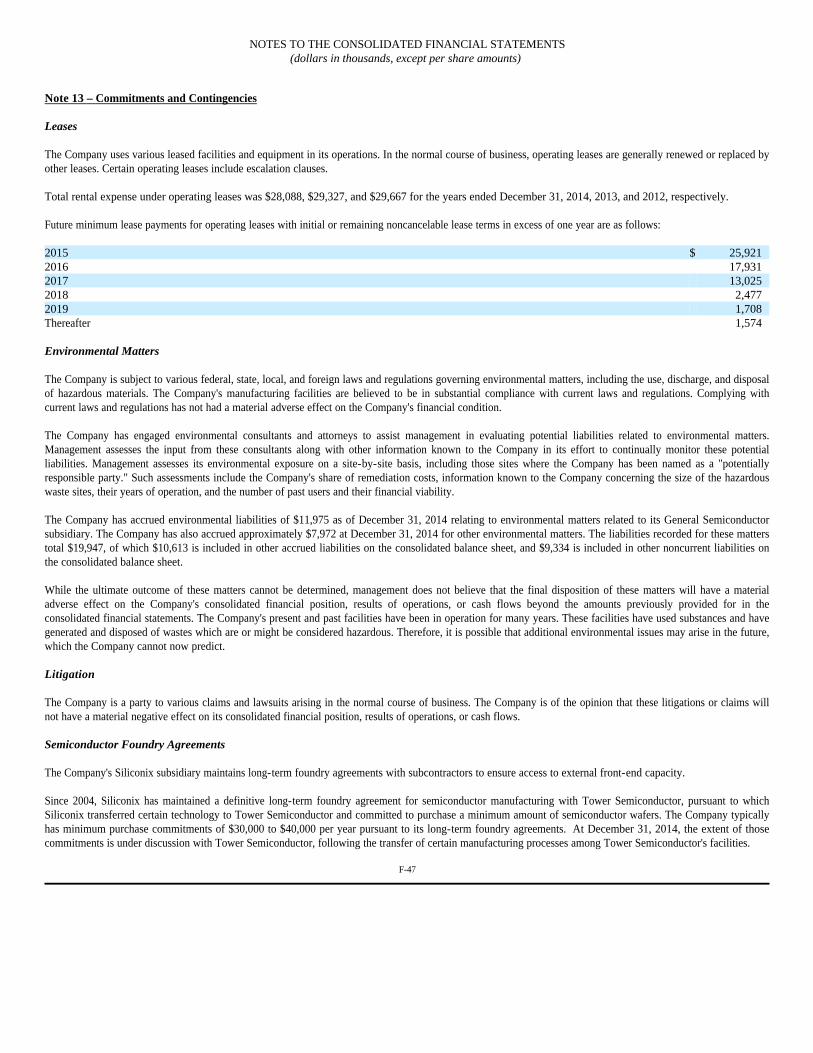
Note 13 – Commitments and Contingencies Leases The Company uses various leased facilities and equipment in its operations. In the normal course of business, operating leases are generally renewed or replaced by other leases. Certain operating leases include escalation clauses. Total rental expense under operating leases was $28,088, $29,327, and $29,667 for the years ended December 31, 2014, 2013, and 2012, respectively. Future minimum lease payments for operating leases with initial or remaining noncancelable lease terms in excess of one year are as follows:
Environmental Matters The Company is subject to various federal, state, local, and foreign laws and regulations governing environmental matters, including the use, discharge, and disposal of hazardous materials. The Company's manufacturing facilities are believed to be in substantial compliance with current laws and regulations. Complying with current laws and regulations has not had a material adverse effect on the Company's financial condition. The Company has engaged environmental consultants and attorneys to assist management in evaluating potential liabilities related to environmental matters. Management assesses the input from these consultants along with other information known to the Company in its effort to continually monitor these potential liabilities. Management assesses its environmental exposure on a site-by-site basis, including those sites where the Company has been named as a "potentially responsible party." Such assessments include the Company's share of remediation costs, information known to the Company concerning the size of the hazardous waste sites, their years of operation, and the number of past users and their financial viability. The Company has accrued environmental liabilities of $11,975 as of December 31, 2014 relating to environmental matters related to its General Semiconductor subsidiary. The Company has also accrued approximately $7,972 at December 31, 2014 for other environmental matters. The liabilities recorded for these matters total $19,947, of which $10,613 is included in other accrued liabilities on the consolidated balance sheet, and $9,334 is included in other noncurrent liabilities on the consolidated balance sheet. While the ultimate outcome of these matters cannot be determined, management does not believe that the final disposition of these matters will have a material adverse effect on the Company's consolidated financial position, results of operations, or cash flows beyond the amounts previously provided for in the consolidated financial statements. The Company's present and past facilities have been in operation for many years. These facilities have used substances and have generated and disposed of wastes which are or might be considered hazardous. Therefore, it is possible that additional environmental issues may arise in the future, which the Company cannot now predict. Litigation The Company is a party to various claims and lawsuits arising in the normal course of business. The Company is of the opinion that these litigations or claims will not have a material negative effect on its consolidated financial position, results of operations, or cash flows. Semiconductor Foundry Agreements The Company's Siliconix subsidiary maintains long-term foundry agreements with subcontractors to ensure access to external front-end capacity. Since 2004, Siliconix has maintained a definitive long-term foundry agreement for semiconductor manufacturing with Tower Semiconductor, pursuant to which Siliconix transferred certain technology to Tower Semiconductor and committed to purchase a minimum amount of semiconductor wafers. The Company typically has minimum purchase commitments of $30,000 to $40,000 per year pursuant to its long-term foundry agreements. At December 31, 2014, the extent of those commitments is under discussion with Tower Semiconductor, following the transfer of certain manufacturing processes among Tower Semiconductor's facilities.
F-47
NOTES TO THE CONSOLIDATED FINANCIAL STATEMENTS (dollars in thousands, except per share amounts)
2015 $ 25,921 2016 17,931 2017 13,025 2018 2,477 2019 1,708 Thereafter 1,574

Note 13 – Commitments and Contingencies (continued) Product Quality Claims The Company is a party to various product quality claims in the normal course of business. The Company provides warranties for its products which offer replacement of defective products. Annual warranty expenses are generally not significant. The Company periodically receives claims which arise from consequential damages which result from a customer's installation of an alleged defective Vishay component into the customer's product. Although not covered by its stated warranty, Vishay may occasionally reimburse the customer for these consequential damages in limited circumstances. Executive Employment Agreements The Company has employment agreements with certain of its senior executives. These employment agreements provide incremental compensation in the event of termination. The Company does not provide any severance or other benefits specifically upon a change in control. On May 13, 2009, the Company entered into an amended and restated employment agreement with Dr. Felix Zandman (the "2009 Agreement"). This agreement amended and restated the employment agreement between the Company and Dr. Zandman that was previously amended and restated as of January 1, 2004 (the "2004 Agreement"). The purpose of the 2009 Agreement was to eliminate the right of Dr. Zandman to receive a royalty during the ten years following his termination of employment equal to 5% of gross sales, less returns and allowances, of Vishay products incorporating inventions and any other form of technology created, discovered or developed by him or under his direction. The royalty was payable in the event Dr. Zandman was terminated without "cause" or resigned for "good reason," as defined in the 2004 Agreement. This provision was carried over from Dr. Zandman's original employment agreement of March 1985, and could not be modified or eliminated without Dr. Zandman's consent. It was a reflection, among other things, of Dr. Zandman's key role in the founding of the Company and in creating, developing and commercializing the Company's technologies and the absence of any compensation to Dr. Zandman for the core intellectual property that he contributed to the Company over the years from its inception. The Company engaged a consultant in 2007 to assist its evaluation of the royalties to which Dr. Zandman would be entitled were his employment to be terminated. Based in part upon the work of this consultant and management's own updated computations, management estimated that the present value of the royalties to which Dr. Zandman would be entitled were his employment terminated at December 31, 2008 would have been between approximately $370,000 and $445,000, with a possible tax gross-up if the royalties were payable in connection with a change of control and deemed subject to an excise tax. (This present value does not factor in any assessment of the probability of payment.) Pursuant to the 2009 Agreement, Dr. Zandman's right to the royalty payments was terminated. Dr. Zandman received a payment of $10,000 as of the effective date of the amended and restated agreement, and he or his estate was entitled to receive annual payments of $10,000 each through 2014. Dr. Zandman's passing in June 2011 had no effect on the timing of these payments. The Company recognized the compensation expense equal to the present value of these payments in 2009. The Company recognized no tax benefit associated with the executive employment agreement charge. The last annual payment was made in 2014. The Company recognized executive compensation charges for the year ended December 31, 2011 for other elements of compensation that accelerated upon the passing of Dr. Zandman and for elements of compensation payable to the Company's former Chief Financial Officer, in connection with his resignation. The Company recognized a credit of $1,778 reported as the executive compensation credit in the accompanying consolidated statement of operations for the year ended December 31, 2013 for the reversal of stock-based compensation expense previously recorded for the performance-based RSUs scheduled to vest to Dr. Zandman's estate and the Company's former Chief Financial Officer on January 1, 2014 at the time it was determined that achievement of the performance-based vesting criteria was no longer probable.
F-48
NOTES TO THE CONSOLIDATED FINANCIAL STATEMENTS (dollars in thousands, except per share amounts)
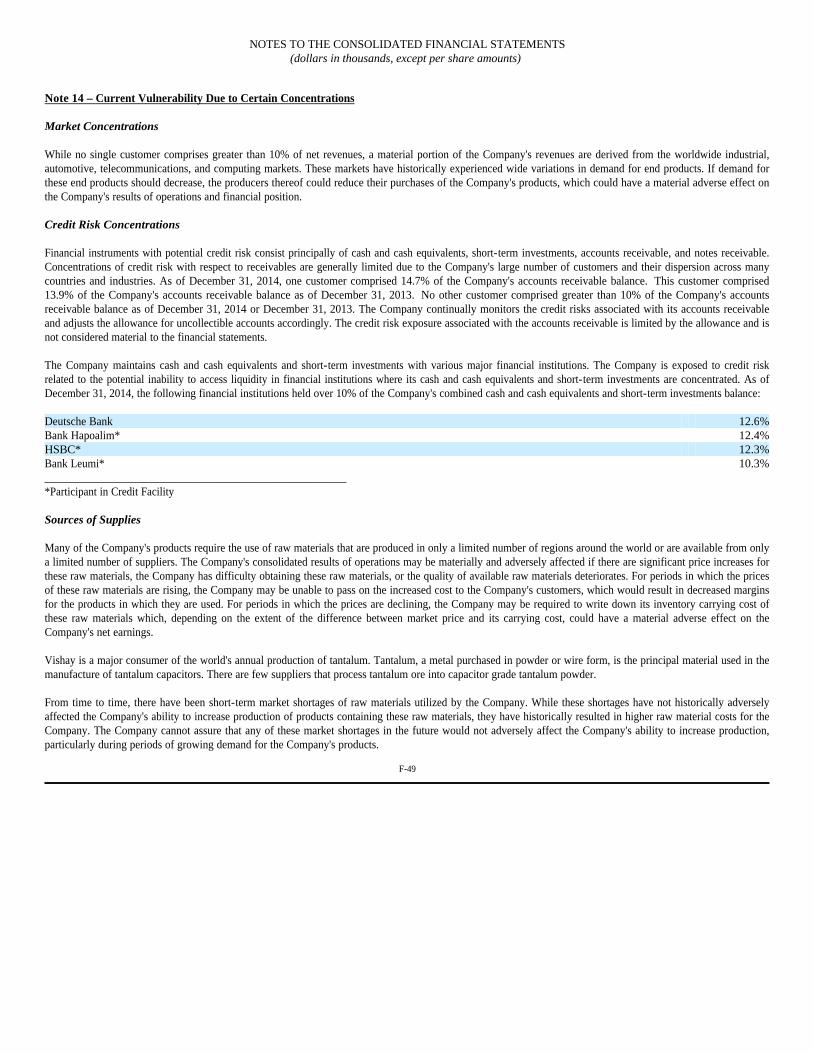
Note 14 – Current Vulnerability Due to Certain Concentrations Market Concentrations While no single customer comprises greater than 10% of net revenues, a material portion of the Company's revenues are derived from the worldwide industrial, automotive, telecommunications, and computing markets. These markets have historically experienced wide variations in demand for end products. If demand for these end products should decrease, the producers thereof could reduce their purchases of the Company's products, which could have a material adverse effect on the Company's results of operations and financial position. Credit Risk Concentrations Financial instruments with potential credit risk consist principally of cash and cash equivalents, short-term investments, accounts receivable, and notes receivable. Concentrations of credit risk with respect to receivables are generally limited due to the Company's large number of customers and their dispersion across many countries and industries. As of December 31, 2014, one customer comprised 14.7% of the Company's accounts receivable balance. This customer comprised 13.9% of the Company's accounts receivable balance as of December 31, 2013. No other customer comprised greater than 10% of the Company's accounts receivable balance as of December 31, 2014 or December 31, 2013. The Company continually monitors the credit risks associated with its accounts receivable and adjusts the allowance for uncollectible accounts accordingly. The credit risk exposure associated with the accounts receivable is limited by the allowance and is not considered material to the financial statements. The Company maintains cash and cash equivalents and short-term investments with various major financial institutions. The Company is exposed to credit risk related to the potential inability to access liquidity in financial institutions where its cash and cash equivalents and short-term investments are concentrated. As of December 31, 2014, the following financial institutions held over 10% of the Company's combined cash and cash equivalents and short-term investments balance:
___________________________________________________ *Participant in Credit Facility Sources of Supplies Many of the Company's products require the use of raw materials that are produced in only a limited number of regions around the world or are available from only a limited number of suppliers. The Company's consolidated results of operations may be materially and adversely affected if there are significant price increases for these raw materials, the Company has difficulty obtaining these raw materials, or the quality of available raw materials deteriorates. For periods in which the prices of these raw materials are rising, the Company may be unable to pass on the increased cost to the Company's customers, which would result in decreased margins for the products in which they are used. For periods in which the prices are declining, the Company may be required to write down its inventory carrying cost of these raw materials which, depending on the extent of the difference between market price and its carrying cost, could have a material adverse effect on the Company's net earnings. Vishay is a major consumer of the world's annual production of tantalum. Tantalum, a metal purchased in powder or wire form, is the principal material used in the manufacture of tantalum capacitors. There are few suppliers that process tantalum ore into capacitor grade tantalum powder. From time to time, there have been short-term market shortages of raw materials utilized by the Company. While these shortages have not historically adversely affected the Company's ability to increase production of products containing these raw materials, they have historically resulted in higher raw material costs for the Company. The Company cannot assure that any of these market shortages in the future would not adversely affect the Company's ability to increase production, particularly during periods of growing demand for the Company's products.
F-49
NOTES TO THE CONSOLIDATED FINANCIAL STATEMENTS (dollars in thousands, except per share amounts)
Deutsche Bank 12.6%Bank Hapoalim* 12.4%HSBC* 12.3%Bank Leumi* 10.3%

Note 14 – Current Vulnerability Due to Certain Concentrations (continued) Certain raw materials used in the manufacture of the Company's products, such as gold, copper, palladium, and other metals, are traded on active markets and can be subject to significant price volatility. To ensure adequate supply and to provide cost certainty, the Company's policy is to enter into short-term commitments to purchase defined portions of annual consumption of the raw materials utilized by the Company if market prices decline below budget. If after entering into these commitments, the market prices for these raw materials decline, the Company must recognize losses on these adverse purchase commitments. Recently enacted rules in the U.S. on conflict minerals, which include tantalum, tungsten, tin, and gold, all of which are used in the Company's products, could result in increased prices and decreased supply of conflict minerals, which could negatively affect the Company's consolidated results of operations. Geographic Concentration The Company has operations outside the United States, and approximately 76% of revenues earned during 2014 were derived from sales to customers outside the United States. Additionally, as of December 31, 2014, $1,100,025 of the Company's cash and cash equivalents and short-term investments were held in countries outside of the United States. Some of the Company's products are produced and cash and cash equivalents and short-term investments are held in countries which are subject to risks of political, economic, and military instability. This instability could result in wars, riots, nationalization of industry, currency fluctuations, and labor unrest. These conditions could have an adverse impact on the Company's ability to operate in these regions and, depending on the extent and severity of these conditions, could materially and adversely affect the Company's overall financial condition, operating results, and ability to access its liquidity when needed. As of December 31, 2014 the Company's cash and cash equivalents and short-term investments were concentrated in the following countries:
Vishay has been in operation in Israel for 44 years. The Company has never experienced any material interruption in its operations attributable to these factors, in spite of several Middle East crises, including wars.
F-50
NOTES TO THE CONSOLIDATED FINANCIAL STATEMENTS (dollars in thousands, except per share amounts)
Germany 41.0%Israel 26.6%The Republic of China (Taiwan) 9.7%People's Republic of China 8.6%Singapore 7.3%Canada 1.8%United States 1.1%Other Asia 1.6%Other Europe 1.4%Other 0.9%

Note 15 –Segment and Geographic Data Vishay operates, and its chief operating decision maker makes strategic and operating decisions with regards to assessing performance and allocating resources based on, five reporting segments: MOSFETs, Diodes, Optoelectronic Components, Resistors & Inductors, and Capacitors. The Company evaluates business segment performance on operating income, exclusive of certain items ("segment operating income"). Only dedicated, direct selling, general, and administrative expenses of the segments are included in the calculation of segment operating income. The Company's calculation of segment operating income excludes such selling, general, and administrative costs as global operations, sales and marketing, information systems, finance and administration groups, as well as restructuring and severance costs, executive compensation charges (credits), material gains or losses on sales of property, and other items. Management believes that evaluating segment performance excluding such items is meaningful because it provides insight with respect to intrinsic operating results of the Company. These items represent reconciling items between segment operating income and consolidated operating income. Business segment assets are the owned or allocated assets used by each business. The Company has also disclosed certain additional items not used to evaluate segment performance. In some cases, the items are regularly provided to the chief operating decision maker and are required to be disclosed by GAAP. Additionally, the additional segment disclosures may provide insight to the Company's future profitability by reportable segment.
F-51
NOTES TO THE CONSOLIDATED FINANCIAL STATEMENTS (dollars in thousands, except per share amounts)

Note 15 –Segment and Geographic Data (continued) The following tables set forth business segment information:
F-52
NOTES TO THE CONSOLIDATED FINANCIAL STATEMENTS (dollars in thousands, except per share amounts)
MOSFETs Diodes OptoelectronicComponents
Resistors & Inductors Capacitors
Corporate / Other Total
Year ended December 31, 2014: Product sales $ 470,377 $ 579,288 $ 258,248 $ 755,251 $ 425,593 $ - $ 2,488,757 Royalty revenues 160 - - 4,365 - - $ 4,525
Total revenue $ 470,537 $ 579,288 $ 258,248 $ 759,616 $ 425,593 $ - $ 2,493,282 Gross Margin $ 59,614 $ 132,021 $ 91,165 $ 241,090 $ 87,402 $ - $ 611,292 Depreciation expense $ 53,939 $ 39,592 $ 13,266 $ 32,380 $ 20,524 $ 1,103 $ 160,804 Interest expense (income) - 21 41 119 18 24,258 $ 24,457 Capital expenditures 33,672 41,713 23,008 42,950 12,694 2,937 $ 156,974 Total Assets as of
December 31, 2014: $ 499,550 $ 732,502 $ 422,257 $ 812,664 $ 605,281 $ 226,519 $ 3,298,773 Year ended December 31, 2013: Product sales $ 449,299 $ 547,264 $ 228,194 $ 700,115 $ 439,745 $ - $ 2,364,617 Royalty revenues 178 - 51 6,133 - - $ 6,362
Total revenue $ 449,477 $ 547,264 $ 228,245 $ 706,248 $ 439,745 $ - $ 2,370,979 Gross Margin $ 59,387 $ 121,231 $ 76,732 $ 221,851 $ 88,059 $ - $ 567,260 Depreciation expense $ 50,606 $ 37,305 $ 12,484 $ 31,998 $ 21,596 $ 1,075 $ 155,064 Interest expense (income) - 54 122 79 28 22,847 $ 23,130 Capital expenditures 41,869 44,431 18,310 32,515 13,052 2,900 $ 153,077 Total Assets as of
December 31, 2013: $ 543,037 $ 788,121 $ 213,128 $ 843,685 $ 636,637 $ 212,531 $ 3,237,139 Year ended December 31, 2012: Product sales $ 433,436 $ 496,744 $ 209,141 $ 635,488 $ 448,157 $ - $ 2,222,966 Royalty revenues 246 - 53 6,832 - - $ 7,131
Total revenue $ 433,682 $ 496,744 $ 209,194 $ 642,320 $ 448,157 $ - $ 2,230,097 Gross Margin $ 56,694 $ 99,116 $ 67,943 $ 204,137 $ 98,783 $ - $ 526,673 Depreciation expense $ 49,124 $ 36,335 $ 11,917 $ 31,921 $ 23,354 $ 1,150 $ 153,801 Interest expense (income) - 64 140 543 52 21,805 $ 22,604 Capital expenditures 49,201 30,025 16,759 35,878 15,531 2,897 $ 150,291 Total Assets as of
December 31, 2012: $ 625,597 $ 670,811 $ 199,385 $ 760,257 $ 587,586 $ 172,641 $ 3,016,277
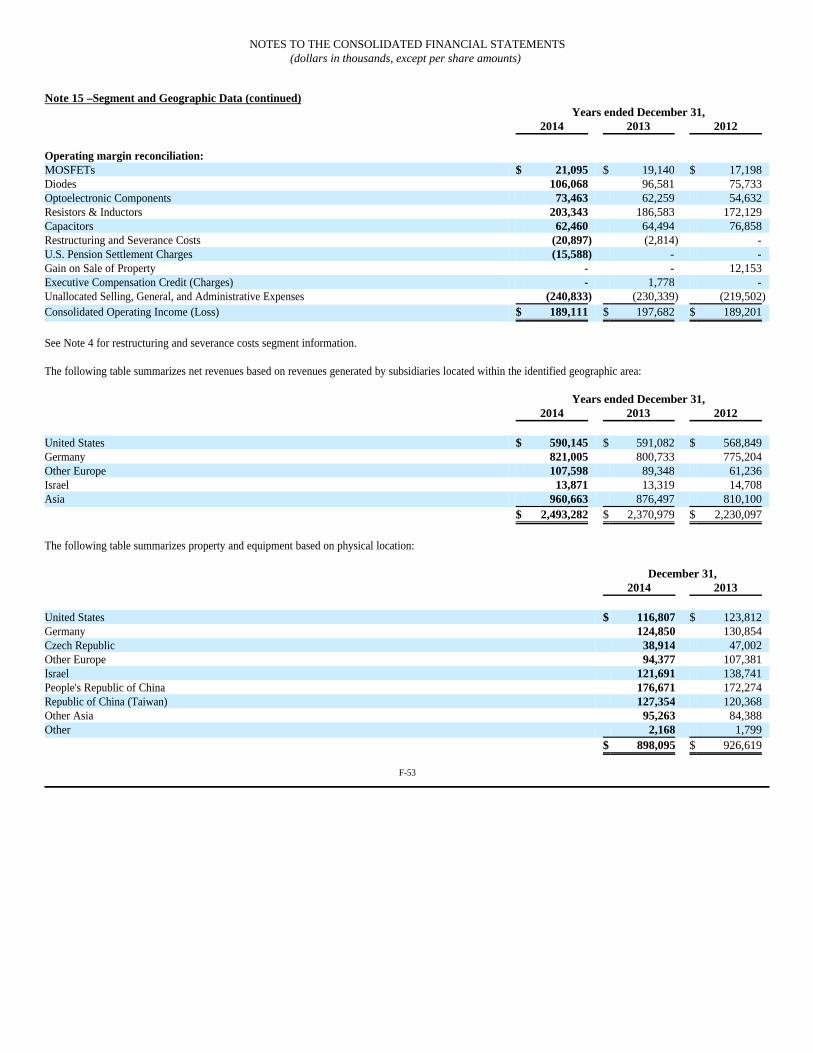
Note 15 –Segment and Geographic Data (continued)
See Note 4 for restructuring and severance costs segment information. The following table summarizes net revenues based on revenues generated by subsidiaries located within the identified geographic area:
The following table summarizes property and equipment based on physical location:
F-53
NOTES TO THE CONSOLIDATED FINANCIAL STATEMENTS (dollars in thousands, except per share amounts)
Years ended December 31, 2014 2013 2012 Operating margin reconciliation: MOSFETs $ 21,095 $ 19,140 $ 17,198 Diodes 106,068 96,581 75,733 Optoelectronic Components 73,463 62,259 54,632 Resistors & Inductors 203,343 186,583 172,129 Capacitors 62,460 64,494 76,858 Restructuring and Severance Costs (20,897) (2,814) - U.S. Pension Settlement Charges (15,588) - - Gain on Sale of Property - - 12,153 Executive Compensation Credit (Charges) - 1,778 - Unallocated Selling, General, and Administrative Expenses (240,833) (230,339) (219,502) Consolidated Operating Income (Loss) $ 189,111 $ 197,682 $ 189,201
Years ended December 31, 2014 2013 2012 United States $ 590,145 $ 591,082 $ 568,849 Germany 821,005 800,733 775,204 Other Europe 107,598 89,348 61,236 Israel 13,871 13,319 14,708 Asia 960,663 876,497 810,100 $ 2,493,282 $ 2,370,979 $ 2,230,097
December 31, 2014 2013 United States $ 116,807 $ 123,812 Germany 124,850 130,854 Czech Republic 38,914 47,002 Other Europe 94,377 107,381 Israel 121,691 138,741 People's Republic of China 176,671 172,274 Republic of China (Taiwan) 127,354 120,368 Other Asia 95,263 84,388 Other 2,168 1,799 $ 898,095 $ 926,619
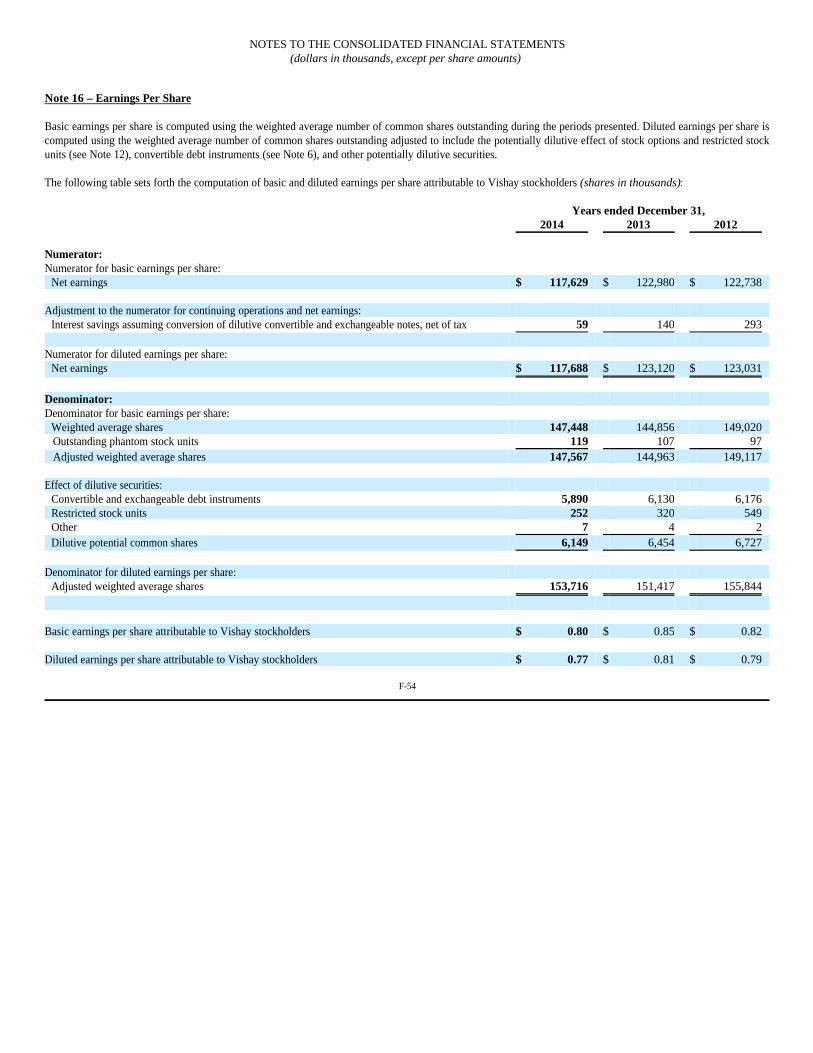
Note 16 – Earnings Per Share Basic earnings per share is computed using the weighted average number of common shares outstanding during the periods presented. Diluted earnings per share is computed using the weighted average number of common shares outstanding adjusted to include the potentially dilutive effect of stock options and restricted stock units (see Note 12), convertible debt instruments (see Note 6), and other potentially dilutive securities. The following table sets forth the computation of basic and diluted earnings per share attributable to Vishay stockholders (shares in thousands):
F-54
NOTES TO THE CONSOLIDATED FINANCIAL STATEMENTS (dollars in thousands, except per share amounts)
Years ended December 31, 2014 2013 2012 Numerator: Numerator for basic earnings per share:
Net earnings $ 117,629 $ 122,980 $ 122,738 Adjustment to the numerator for continuing operations and net earnings:
Interest savings assuming conversion of dilutive convertible and exchangeable notes, net of tax 59 140 293 Numerator for diluted earnings per share:
Net earnings $ 117,688 $ 123,120 $ 123,031
Denominator: Denominator for basic earnings per share:
Weighted average shares 147,448 144,856 149,020 Outstanding phantom stock units 119 107 97 Adjusted weighted average shares 147,567 144,963 149,117 Effect of dilutive securities:
Convertible and exchangeable debt instruments 5,890 6,130 6,176 Restricted stock units 252 320 549 Other 7 4 2 Dilutive potential common shares 6,149 6,454 6,727
Denominator for diluted earnings per share:
Adjusted weighted average shares 153,716 151,417 155,844
Basic earnings per share attributable to Vishay stockholders $ 0.80 $ 0.85 $ 0.82 Diluted earnings per share attributable to Vishay stockholders $ 0.77 $ 0.81 $ 0.79

Note 16 – Earnings Per Share (continued) Diluted earnings per share for the years presented do not reflect the following weighted average potential common shares, as the effect would be antidilutive (in thousands):
In periods in which they are dilutive, if the potential common shares related to the exchangeable notes are included in the computation, the related interest savings, net of tax, assuming conversion/exchange is added to the net earnings used to compute earnings per share. The Company's convertible debt instruments are only convertible upon the occurrence of certain events. The convertible debentures due 2042 were convertible subsequent to the September 27, 2014 evaluation of the conversion criteria until subsequent to the December 31, 2014 evaluation of the conversion criteria. In periods that the debentures are not convertible, the certain conditions which could trigger conversion of the remaining debentures have been deemed to be non-substantive, and accordingly, the Company has always assumed the conversion of these instruments in its diluted earnings per share computation during periods in which they are dilutive. At the direction of its Board of Directors, the Company intends, upon conversion, to repay the principal amounts of the convertible senior debentures, due 2040, due 2041, and due 2042, in cash and settle any additional amounts in shares of Vishay common stock. Accordingly, the debentures are included in the diluted earnings per share computation using the "treasury stock method" (similar to options and warrants) rather than the "if converted method" otherwise required for convertible debt. Under the "treasury stock method," Vishay calculates the number of shares issuable under the terms of the debentures based on the average market price of Vishay common stock during the period, and that number is included in the total diluted shares figure for the period. If the average market price is less than $13.66, no shares are included in the diluted earnings per share computation for the convertible senior debentures due 2040, if the average market price is less than $18.72, no shares are included in the diluted earnings per share computation for the convertible senior debentures due 2041, and if the average market price is less than $11.62, no shares are included in the diluted earnings per share computation for the convertible senior debentures due 2042.
F-55
NOTES TO THE CONSOLIDATED FINANCIAL STATEMENTS (dollars in thousands, except per share amounts)
Years ended December 31, 2014 2013 2012 Convertible and exchangeable notes:
Convertible Senior Debentures, due 2040 - 19,809 19,809 Convertible Senior Debentures, due 2041 7,944 7,885 7,885 Convertible Senior Debentures, due 2042 - - 7,434
Weighted average employee stock options 77 91 177 Weighted average warrants - - 8,390 Weighted average other 135 385 282

Note 17 – Additional Cash Flow Information Changes in operating assets and liabilities, net of effects of businesses acquired consists of the following:
F-56
NOTES TO THE CONSOLIDATED FINANCIAL STATEMENTS (dollars in thousands, except per share amounts)
Years ended December 31, 2014 2013 2012 Accounts receivable $ (731) $ (16,870) $ 33,004 Inventories (23,753) (31,246) (186) Prepaid expenses and other current assets (5,031) 19,160 2,977 Accounts payable 9,339 11,087 (9,408) Other current liabilities (18,064) 7,860 (31,539) Net change in operating assets and liabilities $ (38,240) $ (10,009) $ (5,152)

Note 18 – Fair Value Measurements The fair value measurement accounting guidance establishes a valuation hierarchy of the inputs used to measure fair value. This hierarchy prioritizes the inputs to valuation techniques used to measure fair value into three broad levels. The following is a brief description of those three levels:
Level 1: Observable inputs such as quoted prices (unadjusted) in active markets for identical assets or liabilities.
Level 2: Inputs other than quoted prices that are observable for the asset or liability, either directly or indirectly. These include quoted prices for similar assets or liabilities in active markets and quoted prices for identical or similar assets or liabilities in markets that are not active.
Level 3: Unobservable inputs that reflect the Company's own assumptions.
An asset or liability's classification within the hierarchy is determined based on the lowest level input that is significant to the fair value measurement. The following table provides the financial assets and liabilities carried at fair value measured on a recurring basis as of December 31, 2014 and 2013:
F-57
NOTES TO THE CONSOLIDATED FINANCIAL STATEMENTS (dollars in thousands, except per share amounts)
Total Fair
Value Level 1 Level 2 Level 3 December 31, 2014 Assets: Assets held in rabbi trusts $ 40,270 $ 26,853 $ 13,417 $ - Available for sale securities $ 15,432 4,439 10,993 - U.S. Defined Benefit Pension Plan Assets:
Equity securities $ 26,601 26,601 - - Fixed income securities $ 244,037 242,749 1,288 - Cash $ 3,006 3,006 - -
Non - U.S. Defined Benefit Pension Plan Assets: Equity securities $ 9,268 9,268 - - Fixed income securities $ 18,269 18,269 - - Cash $ 21,619 21,619 - -
$ 378,502 $ 352,804 $ 25,698 $ - Liabilities: Embedded derivative - convertible debentures due 2040 $ (526) - - (526) Embedded derivative - convertible debentures due 2041 $ (341) - - (341) Embedded derivative - convertible debentures due 2042 $ (238) - - (238) $ (1,105) $ - $ - $ (1,105) December 31, 2013 Assets: Assets held in rabbi trusts $ 36,992 $ 24,064 $ 12,928 $ - Available for sale securities $ 7,356 7,356 - - U.S. Defined Benefit Pension Plan Assets:
Equity securities $ 51,666 51,666 - - Fixed income securities $ 241,827 194,777 47,050 - Real Estate Investment Trust securities 1,969 1,969 - - Cash $ 171 171 - -
Non - U.S. Defined Benefit Pension Plan Assets: Equity securities $ 9,911 9,911 - - Fixed income securities $ 16,117 16,117 - - Cash $ 22,831 22,831 - -
$ 388,840 $ 328,862 $ 59,978 $ - Liabilities: Embedded derivative - convertible debentures due 2040 $ (491) - - (491) Embedded derivative - convertible debentures due 2041 $ (349) - - (349) Embedded derivative - convertible debentures due 2042 $ (197) - - (197) $ (1,037) $ - $ - $ (1,037)

Note 18 – Fair Value Measurements (continued) The Company maintains non-qualified trusts, referred to as "rabbi" trusts, to fund payments under deferred compensation and non-qualified pension plans. Rabbi trust assets consist primarily of marketable securities, classified as available-for-sale, and company-owned life insurance assets. The marketable securities held in the rabbi trusts are valued using quoted market prices on the last business day of the year. The company-owned life insurance assets are valued in consultation with the Company's insurance brokers using the value of underlying assets of the insurance contracts. The fair value measurement of the marketable securities held in the rabbi trust is considered a Level 1 measurement and the measurement of the company-owned life insurance assets is considered a Level 2 measurement within the fair value hierarchy. The Company maintains defined benefit retirement plans in certain of its U.S. and non-U.S. subsidiaries. The assets of the plans are measured at fair value. Equity securities held by the U.S. defined benefit retirement plans consist of various mutual funds and exchange traded funds that are valued based on quoted market prices on the last business day of the year. The fair value measurement of the mutual funds and exchange traded funds securities is considered a Level 1 measurement within the fair value hierarchy. Fixed income securities held by the U.S. defined benefit retirement plans consist of exchange traded funds, investments in a group annuity contract, and a short-term investment fund. The exchange traded funds are valued based on quoted market prices on the last business day of the year. The fair value measurement of the exchange traded funds securities is considered a Level 1 measurement within the fair value hierarchy. The group annuity contract consists of a general asset account and a pooled separate account. Units of the general asset account are valued based on a discounted cash flow model using the current yields of similar instruments with comparable durations and similar credit risk. The pooled separate accounts are valued based on the value of the underlying bond funds, which are valued at quoted market prices on the last business day of the year, with adjustments made to reflect the nature of how the investment is held. The fair value measurement of the group annuity contract is considered a Level 2 measurement within the fair value hierarchy. The short-term investment fund strictly invests in short-term investments, including commercial paper, certificates of deposit, U.S. government agency and instrumentality obligations, U.S. government obligations, corporate notes, and funding agreements. The maturity date of all investments held by the short-term investment fund is within one year from the financial statement date. There are no redemption restrictions on the plan's investment. The fair value of the short-term investment fund has been estimated using the net asset value per share of the investment. The fair value measurement of the short-term investment fund is considered a Level 2 measurement within the fair value hierarchy. Real estate investments held by the U.S. defined benefit retirement plans consisted of real estate investment trust securities that were valued at quoted market prices on the last business day of the year. There were no real estate investment trust securities held by the U.S. defined benefit retirement plans at December 31, 2014. The fair value measurement of the real estate investments is considered a Level 1 measurement within the fair value hierarchy. Equity securities held by the non-U.S. defined benefit retirement plans consist of equity securities that are valued based on quoted market prices on the last business day of the year. The fair value measurement of the equity securities is considered a Level 1 measurement within the fair value hierarchy. Fixed income securities held by the non-U.S. defined benefit retirement plans consist of government bonds in the Philippines and India and corporate notes that are valued based on quoted market prices on the last business day of the year. The fair value measurement of the fixed income securities is considered a Level 1 measurement within the fair value hierarchy. Cash held by the U.S. and non-U.S. defined benefit retirement plans consists of demand deposits on account in various financial institutions to fund current benefit payments. The carrying amount of the cash approximates its fair value. The Company holds available for sale investments in debt securities that are intended to fund a portion of its pension and other postretirement benefit obligations outside of the U.S. The investments are valued based on quoted market prices on the last business day of the year. The fair value measurement of the investments is considered a Level 1 measurement within the fair value hierarchy. The convertible senior debentures, due 2040, due 2041, and due 2042, issued by the Company on November 9, 2010, May 13, 2011, and May 31, 2012, respectively, contain embedded derivative features that GAAP requires to be bifurcated and remeasured each reporting period. Each quarter, the change in the fair value of the embedded derivative features, if any, is recorded in the consolidated statements of operations. The Company uses a derivative valuation model to derive the value of the embedded derivative features. Key inputs into this valuation model are the Company's current stock price, risk-free interest rates, the stock dividend yield, the stock volatility, and the debentures' credit spread over London Interbank Offered Rate (LIBOR). The first three aforementioned inputs are based on observable market data and are considered Level 2 inputs while the last two aforementioned inputs are unobservable and thus require management's judgment and are considered Level 3 inputs. The fair value measurement is considered a Level 3 measurement within the fair value hierarchy.
F-58
NOTES TO THE CONSOLIDATED FINANCIAL STATEMENTS (dollars in thousands, except per share amounts)
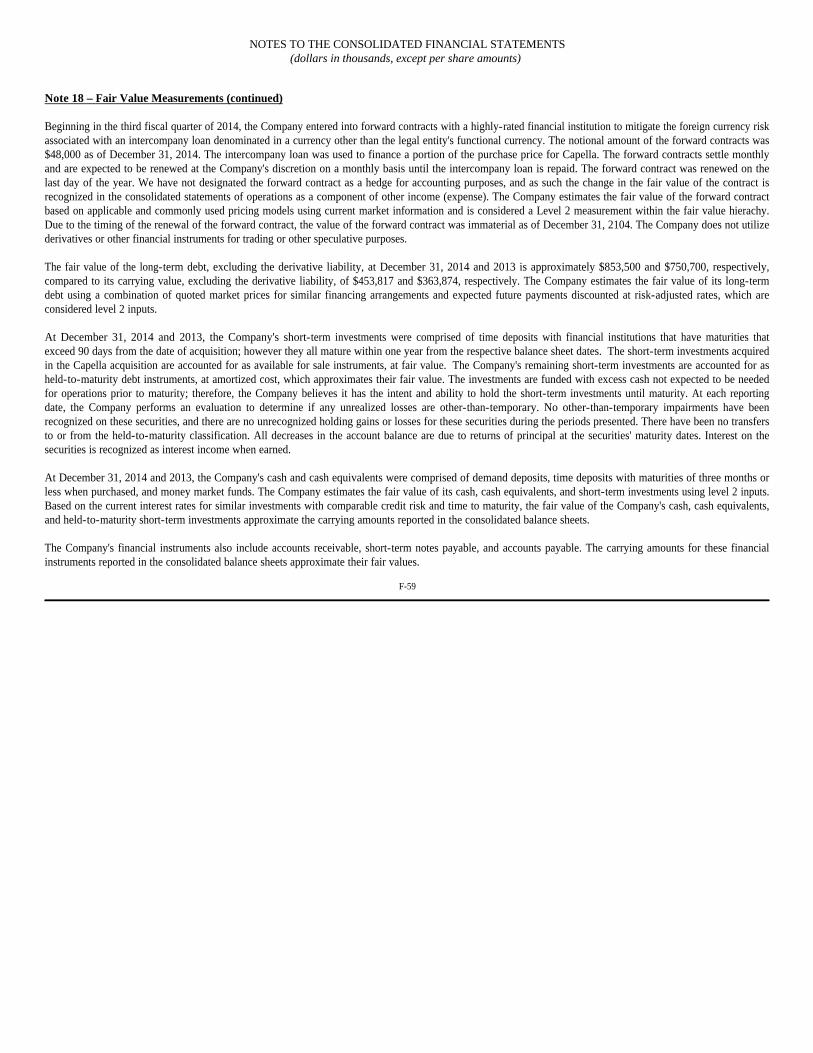
Note 18 – Fair Value Measurements (continued) Beginning in the third fiscal quarter of 2014, the Company entered into forward contracts with a highly-rated financial institution to mitigate the foreign currency risk associated with an intercompany loan denominated in a currency other than the legal entity's functional currency. The notional amount of the forward contracts was $48,000 as of December 31, 2014. The intercompany loan was used to finance a portion of the purchase price for Capella. The forward contracts settle monthly and are expected to be renewed at the Company's discretion on a monthly basis until the intercompany loan is repaid. The forward contract was renewed on the last day of the year. We have not designated the forward contract as a hedge for accounting purposes, and as such the change in the fair value of the contract is recognized in the consolidated statements of operations as a component of other income (expense). The Company estimates the fair value of the forward contract based on applicable and commonly used pricing models using current market information and is considered a Level 2 measurement within the fair value hierachy. Due to the timing of the renewal of the forward contract, the value of the forward contract was immaterial as of December 31, 2104. The Company does not utilize derivatives or other financial instruments for trading or other speculative purposes. The fair value of the long-term debt, excluding the derivative liability, at December 31, 2014 and 2013 is approximately $853,500 and $750,700, respectively, compared to its carrying value, excluding the derivative liability, of $453,817 and $363,874, respectively. The Company estimates the fair value of its long-term debt using a combination of quoted market prices for similar financing arrangements and expected future payments discounted at risk-adjusted rates, which are considered level 2 inputs. At December 31, 2014 and 2013, the Company's short-term investments were comprised of time deposits with financial institutions that have maturities that exceed 90 days from the date of acquisition; however they all mature within one year from the respective balance sheet dates. The short-term investments acquired in the Capella acquisition are accounted for as available for sale instruments, at fair value. The Company's remaining short-term investments are accounted for as held-to-maturity debt instruments, at amortized cost, which approximates their fair value. The investments are funded with excess cash not expected to be needed for operations prior to maturity; therefore, the Company believes it has the intent and ability to hold the short-term investments until maturity. At each reporting date, the Company performs an evaluation to determine if any unrealized losses are other-than-temporary. No other-than-temporary impairments have been recognized on these securities, and there are no unrecognized holding gains or losses for these securities during the periods presented. There have been no transfers to or from the held-to-maturity classification. All decreases in the account balance are due to returns of principal at the securities' maturity dates. Interest on the securities is recognized as interest income when earned. At December 31, 2014 and 2013, the Company's cash and cash equivalents were comprised of demand deposits, time deposits with maturities of three months or less when purchased, and money market funds. The Company estimates the fair value of its cash, cash equivalents, and short-term investments using level 2 inputs. Based on the current interest rates for similar investments with comparable credit risk and time to maturity, the fair value of the Company's cash, cash equivalents, and held-to-maturity short-term investments approximate the carrying amounts reported in the consolidated balance sheets. The Company's financial instruments also include accounts receivable, short-term notes payable, and accounts payable. The carrying amounts for these financial instruments reported in the consolidated balance sheets approximate their fair values.
F-59
NOTES TO THE CONSOLIDATED FINANCIAL STATEMENTS (dollars in thousands, except per share amounts)

Note 19 – Related Party Transactions Vishay Precision Group, Inc. On July 6, 2010, Vishay completed the spin-off of its measurements and foil resistors businesses into an independent, publicly-traded company to be named Vishay Precision Group, Inc. through a tax-free stock dividend to Vishay's stockholders. Vishay's common stockholders received 1 share of VPG common stock for every 14 shares of Vishay common stock they held on the record date, June 25, 2010, and Vishay's Class B common stockholders received 1 share of VPG Class B common stock for every 14 shares of Vishay Class B common stock they held on the record date. Following the spin-off, VPG is an independent company and Vishay retains no ownership interest. Relationship with VPG after Spin-off Following the spin-off, VPG and Vishay operate separately, each as independent public companies. Vishay Intertechnology has no ownership interest in VPG. However, Ruta Zandman controls a large portion of the voting power of both Vishay and VPG. Marc Zandman, Vishay's Executive Chairman of the Board and an executive officer of Vishay, serves as the Chairman of VPG. Ziv Shoshani, CEO of VPG, serves as a director of Vishay. Additionally, Timothy V. Talbert, a member of Vishay's Board of Directors is also a member of the Board of Directors of VPG. In connection with the completion of the spin-off, Vishay and its subsidiaries entered into several agreements with VPG and its subsidiaries that govern the relationship of the parties following the spin-off. Among the agreements entered into with VPG and its subsidiaries were a transition services agreement, several lease agreements, and supply agreements. None of the agreements have had nor are expected to have a material impact on Vishay's financial position, results of operations, or liquidity. Vishay also entered into a trademark license agreement with VPG pursuant to which Vishay granted VPG the license to use certain trademarks, service marks, logos, trade names, entity names, and domain names which include the term "Vishay." The license granted VPG the limited, exclusive, royalty-free right and license to use certain marks and names incorporating the term "Vishay" in connection with the design, development, manufacture, marketing, provision and performance of certain VPG products that do not compete with any products within Vishay's product range as constituted immediately following the separation and certain services provided in connection with the products. The license cannot be terminated except as a result of willful misconduct or liquidation bankruptcy of VPG. Until the spin-off, VPG was included in Vishay's consolidated federal income tax returns and with Vishay and/or certain of Vishay's subsidiaries in applicable combined or unitary state and local income tax returns. In conjunction with the spin-off, Vishay and VPG entered a tax matters agreement under which Vishay generally will be liable for all U.S. federal, state, local, and foreign income taxes attributable to VPG with respect to taxable periods ending on or before the distribution date except to the extent that VPG has a liability for such taxes on its books at the time of the spin-off. Vishay is also principally responsible for managing any income tax audits by the various tax jurisdictions for pre-spin-off periods. Vishay has fully indemnified VPG of tax exposures arising prior to the spin-off.
F-60
NOTES TO THE CONSOLIDATED FINANCIAL STATEMENTS (dollars in thousands, except per share amounts)
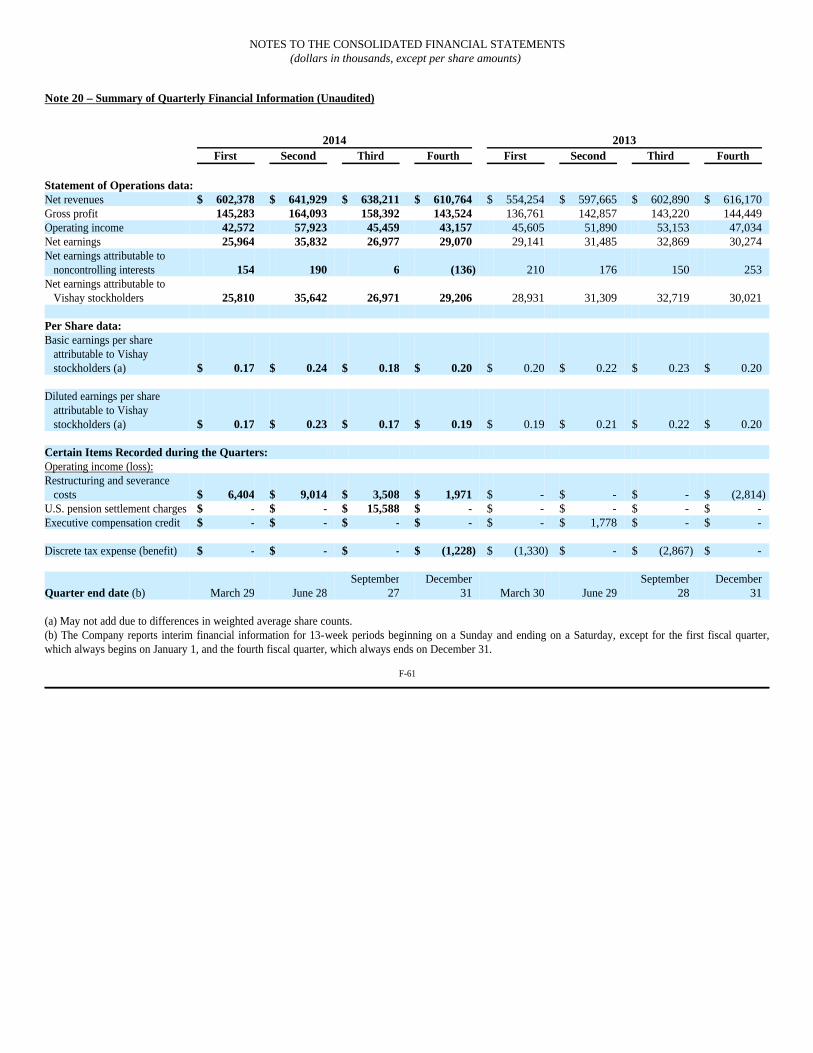
Note 20 – Summary of Quarterly Financial Information (Unaudited)
(a) May not add due to differences in weighted average share counts. (b) The Company reports interim financial information for 13-week periods beginning on a Sunday and ending on a Saturday, except for the first fiscal quarter, which always begins on January 1, and the fourth fiscal quarter, which always ends on December 31.
F-61
NOTES TO THE CONSOLIDATED FINANCIAL STATEMENTS (dollars in thousands, except per share amounts)
2014 2013 First Second Third Fourth First Second Third Fourth Statement of Operations data: Net revenues $ 602,378 $ 641,929 $ 638,211 $ 610,764 $ 554,254 $ 597,665 $ 602,890 $ 616,170 Gross profit 145,283 164,093 158,392 143,524 136,761 142,857 143,220 144,449 Operating income 42,572 57,923 45,459 43,157 45,605 51,890 53,153 47,034 Net earnings 25,964 35,832 26,977 29,070 29,141 31,485 32,869 30,274 Net earnings attributable to
noncontrolling interests 154 190 6 (136) 210 176 150 253 Net earnings attributable to
Vishay stockholders 25,810 35,642 26,971 29,206 28,931 31,309 32,719 30,021 Per Share data: Basic earnings per share
attributable to Vishay stockholders (a) $ 0.17 $ 0.24 $ 0.18 $ 0.20 $ 0.20 $ 0.22 $ 0.23 $ 0.20
Diluted earnings per share
attributable to Vishay stockholders (a) $ 0.17 $ 0.23 $ 0.17 $ 0.19 $ 0.19 $ 0.21 $ 0.22 $ 0.20
Certain Items Recorded during the Quarters: Operating income (loss): Restructuring and severance
costs $ 6,404 $ 9,014 $ 3,508 $ 1,971 $ - $ - $ - $ (2,814) U.S. pension settlement charges $ - $ - $ 15,588 $ - $ - $ - $ - $ - Executive compensation credit $ - $ - $ - $ - $ - $ 1,778 $ - $ - Discrete tax expense (benefit) $ - $ - $ - $ (1,228) $ (1,330) $ - $ (2,867) $ -
Quarter end date (b) March 29 June 28 September
27 December
31 March 30 June 29 September
28 December
31

Exhibit 21
SUBSIDIARIES OF THE REGISTRANT Note: Names of Subsidiaries are indented under name of Parent. Subsidiaries are wholly owned unless otherwise noted. (Directors' or other shares required by statute in foreign jurisdictions and totaling less than 1% of equity are omitted.)
Vishay Americas, Inc. Delaware Vishay Americas do Brasil, LTDA Brazil
Vishay Insurance, Ltd. Ireland Vishay France Holdings SAS France
MCB Industrie S.A. France Vishay Dale Electronics, Inc. Delaware
Electronica Dale de Mexico S.A. de C.V. Mexico Vishay HiRel Systems LLC Delaware
Vishay HiRel Systems International, LLC Delaware Vishay HiRel Systems Asia Limited Hong Kong
Vishay HiRel Systems (HK) Ltd. Hong KongVishay Sprague, Inc. Delaware Vishay Sprague Canada Holdings Inc. Canada
Sprague Electric of Canada, Ltd. Canada Siliconix incorporated Delaware
Vishay Siliconix, LLC Delaware Siliconix Semiconductor, Inc. Delaware Siliconix Technology C.V. Netherlands (a)
Vishay Siliconix Electronic Co. Ltd. The Republic of China (Taiwan) Shanghai Simconix Electronic Company Ltd. China (b) Vishay Semiconductor Italiana S.p.A. Italy Vishay Asia Logistics Pte Ltd. Singapore
Vishay Semiconductor India Pvt. Ltd. India Siliconix Singapore Pte Ltd Singapore
Vishay GSI, Inc. Delaware Vishay GSI Holdings, LLC Delaware Vishay General Semiconductor, L.P. Cayman Islands (c)
Vishay General Semiconductor, LLC Delaware Vishay General Semiconductor of Taiwan, Ltd. The Republic of China (Taiwan) Vishay Asia GS Investments Pte., Ltd. Singapore
ATC Corp. Delaware General Semiconductor Hong Kong Ltd. Hong Kong
Vishay BCcomponents Holdings Ltd. Delaware Vishay BCcomponents B.V. Netherlands
Vishay Capacitors Belgium NV Belgium Vishay Resistors Belgium BVBA Belgium Valen Ltd. Hong Kong Vishay Components India Pvt. Ltd India (d) Vishay BCcomponents Hong Kong Ltd. Hong Kong
BCcomponents China Ltd Hong Kong Vishay Components (Huizhou) Co. Ltd. China
Vishay Intertechnology Asia Pte Ltd. Singapore Vishay Hong Kong Ltd. Hong Kong Vishay Japan K.K. Japan Vishay Korea Co. Ltd. Korea Vishay (Taiwan) Ltd. The Republic of China (Taiwan)
Vishay Malaysia Sdn. Bhd. Malaysia Vishay Dutch Holdings B.V. Netherlands Vishay Capella Microsystems (Taiwan) Limited The Republic of China (Taiwan) (e) Capella Microsystems, Inc. California Capella Microsystems Corp British Virgin Islands

Subsidiaries of the Registrant (continued)
Vishay Israel Limited Israel Z.T.R. Electronics Ltd. Israel ECOMAL Israel Ltd. Israel (f)
Vishay Polytech Co. Ltd. JapanVishay Europe GmbH Germany (g)
Vishay Europe Sales GmbH Germany Vishay BCcomponents Austria GmbH Austria Vishay BCcomponents Beyschlag GmbH Germany Vishay Electronic GmbH Germany Vishay Siliconix Itzehoe GmbH Germany Roederstein GmbH Germany Roederstein Electronica Portugal Lda. Portugal (h) ECOMAL Europe GmbH Germany ECOMAL Sweden AB Sweden ECOMAL Schweiz A.G. Switzerland ECOMAL Austria Ges.mbH Austria Vishay Components, S.A. Spain ECOMAL Iberia S.A.U. Spain ECOMAL Nederland BV Netherlands ECOMAL Belgium N.V. Belgium ECOMAL Ceska republika S.r.O. Czech Republic ECOMAL Denmark A/S Denmark ECOMAL Finland OY Finland ECOMAL France S.A. France ECOMAL UK Ltd. United Kingdom ECOMAL Italy SRL Italy Vishay Electronic SPOL SRO Czech Republic Vishay S.A. France (i)
Ultronix, Inc. Delaware E-Sil Components Ltd. United Kingdom
Vishay Ltd. United Kingdom Vishay Semiconductor GmbH Germany
Vishay (Phils.) Inc. Philippines Vishay Semiconductor Ges.mbH Austria (j) Vishay Asia Semiconductor Investments Pte. Ltd. Singapore
Vishay Asia Investments Pte. Ltd. Singapore (k) Shanghai Vishay Semiconductors Ltd. China General Semiconductor (China) Co., Ltd. China Vishay Xi'an Micro-Electronics Co. Ltd. China Vishay China Co. Ltd. China
Vishay HiRel Systems Zhuhai Electronics Co Ltd China Vishay Hungary Elektronikai KFT Hungary Vishay Semiconductor Malaysia Sdn Bhd Malaysia Vishay Phoenix do Brasil Ltda Brazil (l)
Vishay General Semiconductor GmbH Germany

Subsidiaries of the Registrant (continued)
(a) - Registrant's indirect ownership percentage in Siliconix Technology C.V. is 100%; 89% is owned by its wholly owned subsidiary Siliconix Incorporated, 10% is owned by its indirectly wholly owned subsidiary Siliconix Semiconductor, Inc., and 1% is owned by its indirect wholly owned subsidiary Vishay Siliconix LLC.
(b) - Registrant's indirect ownership percentage in Shanghai Simconix Electronic Company Ltd. is 96%.(c) - Registrant's indirect ownership percentage in Vishay General Semiconductor, L.P. is 100%; 1% is owned by its indirectly wholly owned subsidiary Vishay
GSI Holdings, LLC, and 99% is owned by its wholly owned subsidiary Vishay GSI, Inc.(d) - Registrant's indirect ownership percentage in Vishay Components India Pvt Ltd. is 100%; 69% is owned directly and 31% is owned by its indirectly wholly
owned subsidiary Vishay BCcomponents B.V.(e) - Registrant's indirect ownership percentage in Vishay Capella Microsystems (Taiwan) Limited is 100%, over 99.9% is owned by its directly wholly owned
subsidiary Vishay Dutch Holdings B.V. and less than 0.1% is owned directly.(f) - Registrant's indirect ownership percentage in Ecomal Israel Ltd. is 66.7%.(g) - Registrant's indirect ownership percentage in Vishay Europe GmbH is 100%; over 99.9% is owned directly or indirectly by its wholly owned subsidiary
Vishay Israel Limited and its affiliates; and less than 0.1% is owned directly.(h) - Registrant's indirect ownership percentage in Roederstein Electronics Portugal Lda.is 100%; 65% is owned by its indirectly wholly owned subsidiary
Roederstein GmbH, 30% is owned by its indirectly wholly owned subsidiary Vishay Electronic GmbH, and 5% is owned by its indirectly wholly owned subsidiary Vishay Europe GmbH.
(i) - Registrant's indirect ownership percentage in Vishay S.A. is 99.9%; 2.3% is owned directly and 97.6% is owned by its indirectly wholly owned subsidiary Vishay Europe GmbH.
(j) - Registrant's indirect ownership percentage in Vishay Semiconductor Ges.mbH is 100%, 54% is owned by its indirectly wholly owned subsidiary Sprague Electric of Canada and 46% is owned by its indirectly wholly owned subsidiary Vishay Semiconductor GmbH.
(k) - Registrant's indirect ownership percentage in Vishay Asia Investments Pte. Ltd. is 100%, 48% is owned by its indirectly wholly owned subsidiary Vishay Asia Semiconductor Investments Pte. Ltd., 26% is owned by its indirectly wholly owned subsidiary Vishay Asia Semiconductor GS Investments Pte. Ltd., and 26% is owned by its indirectly wholly owned subsidiary Siliconix Technology C.V.
(l) - Registrant's indirect ownership percentage in Vishay Phoenix do Brazil LTDA is 100%, over 99.9% is owned by its indirectly wholly owned subsidiary Vishay Europe GmbH, less than 0.1% is owned by its indirectly wholly owned subsidiary Roederstein GmbH, and less than 0.1% is owned by its directly wholly owned subsidiary Vishay Sprague, Inc.

CONSENT OF INDEPENDENT REGISTERED PUBLIC ACCOUNTING FIRM
We consent to the incorporation by reference in the following Registration Statements and in the related Prospectuses of Vishay Intertechnology, Inc. of our reports dated February 19, 2015, with respect to the consolidated financial statements of Vishay Intertechnology, Inc. and the effectiveness of internal control over financial reporting of Vishay Intertechnology, Inc., included in this Annual Report (Form 10-K) for the year ended December 31, 2014.
Registration Statement Number Form Description
333-78045 S-8 1997 Stock Option Program and 1998 Employee Stock Option Program of Vishay
Intertechnology, Inc. 333-102507 S-3/A Class A Warrants to Purchase 7,000,000 Shares of Common Stock; Class B Warrants to
Purchase 1,823,529 Shares of Common Stock; 6,176,467 Shares of Common Stock Issuable Upon Exchange of $105,000,000 Floating Rate Unsecured Notes due 2102; and 8,823,529 Shares of Common Stock Issuable Upon Exercise of Class A Warrants and Class B Warrants
333-144466 S-8 2007 Stock Incentive Program of Vishay Intertechnology, Inc. 333-178895 S-8 Vishay Intertechnology, Inc. Deferred Compensation Plan 333-196143 S-8 2007 Stock Incentive Program of Vishay Intertechnology, Inc.
/s/ Ernst & Young LLP Philadelphia, Pennsylvania February 19, 2015
Exhibit 31.1
CERTIFICATIONS I, Dr. Gerald Paul, certify that:
(a) Designed such disclosure controls and procedures, or caused such disclosure controls and procedures to be designed under our supervision, to ensure that material information relating to the registrant, including its consolidated subsidiaries, is made known to us by others within those entities, particularly during the period in which this report is being prepared;
(b) Designed such internal control over financial reporting, or caused such internal control over financial reporting to be designed under our supervision, to provide reasonable assurance regarding the reliability of financial reporting and the preparation of financial statements for external purposes in accordance with generally accepted accounting principles;
(c) Evaluated the effectiveness of the registrant's disclosure controls and procedures and presented in this report our conclusions about the effectiveness of the disclosure controls and procedures, as of the end of the period covered by this report based on such evaluation; and
(d) Disclosed in this report any change in the registrant's internal control over financial reporting that occurred during the registrant's most recent fiscal quarter that has materially affected, or is reasonably likely to materially affect, the registrant's internal control over financial reporting; and
(a) All significant deficiencies and material weaknesses in the design or operation of internal control over financial reporting which are reasonably likely to adversely affect the registrant's ability to record, process, summarize and report financial information; and
(b) Any fraud, whether or not material, that involves management or other employees who have a significant role in the registrant's internal control over financial reporting.
Date: February 19, 2015
/s/ Gerald Paul Dr. Gerald Paul Chief Executive Officer
1. I have reviewed this Annual Report on Form 10-K of Vishay Intertechnology, Inc.;
2. Based on my knowledge, this report does not contain any untrue statement of a material fact or omit to state a material fact necessary to make the statements made, in light of the circumstances under which such statements were made, not misleading with respect to the period covered by this report;
3. Based on my knowledge, the financial statements, and other financial information included in this report, fairly present in all material respects the financial condition, results of operations and cash flows of the registrant as of, and for, the periods presented in this report;
4. The registrant's other certifying officer(s) and I are responsible for establishing and maintaining disclosure controls and procedures (as defined in Exchange Act Rules 13a-15(e) and 15d-15(e)) and internal control over financial reporting (as defined in Exchange Act Rules 13a-15(f) and 15d-15(f)) for the registrant and have:
5. The registrant's other certifying officer(s) and I have disclosed, based on our most recent evaluation of internal control over financial reporting, to the registrant's auditors and the audit committee of the registrant's board of directors (or persons performing the equivalent functions):

Exhibit 31.2
CERTIFICATIONS I, Lori Lipcaman, certify that:
(a) Designed such disclosure controls and procedures, or caused such disclosure controls and procedures to be designed under our supervision, to ensure that material information relating to the registrant, including its consolidated subsidiaries, is made known to us by others within those entities, particularly during the period in which this report is being prepared;
(b) Designed such internal control over financial reporting, or caused such internal control over financial reporting to be designed under our supervision, to provide reasonable assurance regarding the reliability of financial reporting and the preparation of financial statements for external purposes in accordance with generally accepted accounting principles;
(c) Evaluated the effectiveness of the registrant's disclosure controls and procedures and presented in this report our conclusions about the effectiveness of the disclosure controls and procedures, as of the end of the period covered by this report based on such evaluation; and
(d) Disclosed in this report any change in the registrant's internal control over financial reporting that occurred during the registrant's most recent fiscal quarter that has materially affected, or is reasonably likely to materially affect, the registrant's internal control over financial reporting; and
(a) All significant deficiencies and material weaknesses in the design or operation of internal control over financial reporting which are reasonably likely to adversely affect the registrant's ability to record, process, summarize and report financial information; and
(b) Any fraud, whether or not material, that involves management or other employees who have a significant role in the registrant's internal control over financial reporting.
Date: February 19, 2015
/s/ Lori Lipcaman Lori Lipcaman Chief Financial Officer
1. I have reviewed this Annual Report on Form 10-K of Vishay Intertechnology, Inc.;
2. Based on my knowledge, this report does not contain any untrue statement of a material fact or omit to state a material fact necessary to make the statements made, in light of the circumstances under which such statements were made, not misleading with respect to the period covered by this report;
3. Based on my knowledge, the financial statements, and other financial information included in this report, fairly present in all material respects the financial condition, results of operations and cash flows of the registrant as of, and for, the periods presented in this report;
4. The registrant's other certifying officer(s) and I are responsible for establishing and maintaining disclosure controls and procedures (as defined in Exchange Act Rules 13a-15(e) and 15d-15(e)) and internal control over financial reporting (as defined in Exchange Act Rules 13a-15(f) and 15d-15(f)) for the registrant and have:
5. The registrant's other certifying officer(s) and I have disclosed, based on our most recent evaluation of internal control over financial reporting, to the registrant's auditors and the audit committee of the registrant's board of directors (or persons performing the equivalent functions):

Exhibit 32.1
CERTIFICATION PURSUANT TO 18 U.S.C. SECTION 1350,
AS ADOPTED PURSUANT TO SECTION 906 OF THE SARBANES-OXLEY ACT OF 2002
In connection with the Annual Report of Vishay Intertechnology, Inc. (the "Company") on Form 10-K for the year ended December 31, 2014 as filed with the Securities and Exchange Commission on the date hereof (the "Report"), I, Dr. Gerald Paul, Chief Executive Officer of the Company, certify, pursuant to 18 U.S.C. section 1350, as adopted pursuant to section 906 of the Sarbanes-Oxley Act of 2002, that:
/s/ Gerald Paul Dr. Gerald Paul Chief Executive Officer February 19, 2015
(1) The Report fully complies with the requirements of section 13(a) or 15(d) of the Securities Exchange Act of 1934; and
(2) The information contained in the Report fairly presents, in all material respects, the financial condition and results of operations of the Company.

Exhibit 32.2
CERTIFICATION PURSUANT TO 18 U.S.C. SECTION 1350,
AS ADOPTED PURSUANT TO SECTION 906 OF THE SARBANES-OXLEY ACT OF 2002
In connection with the Annual Report of Vishay Intertechnology, Inc. (the "Company") on Form 10-K for the year ended December 31, 2014 as filed with the Securities and Exchange Commission on the date hereof (the "Report"), I, Lori Lipcaman, Chief Financial Officer of the Company, certify, pursuant to 18 U.S.C. section 1350, as adopted pursuant to section 906 of the Sarbanes-Oxley Act of 2002, that:
/s/ Lori Lipcaman Lori Lipcaman Chief Financial Officer February 19, 2015
(1) The Report fully complies with the requirements of section 13(a) or 15(d) of the Securities Exchange Act of 1934; and
(2) The information contained in the Report fairly presents, in all material respects, the financial condition and results of operations of the Company.