vision - pcmcindia.gov.in march 2017.pdf · - sewerage network improvement 10.0 10.0 0.0 0.0 0 ......
TRANSCRIPT


Vision : “RE-defining Pimpri-Chinchwad”
Goals :

Citizen’s engagement

ABD : “RE-connecting Neighbourhoods”
Selected area : Pimple Saudagar & Pimple Gurav
City-wide replication strategy ABD Profile

ABD : “RE-connecting Neighbourhoods”

ABD : C0nnected Streets

ABD : C0nnected Streets

ABD : C0nnected Greens

ABD : C0nnected Systems
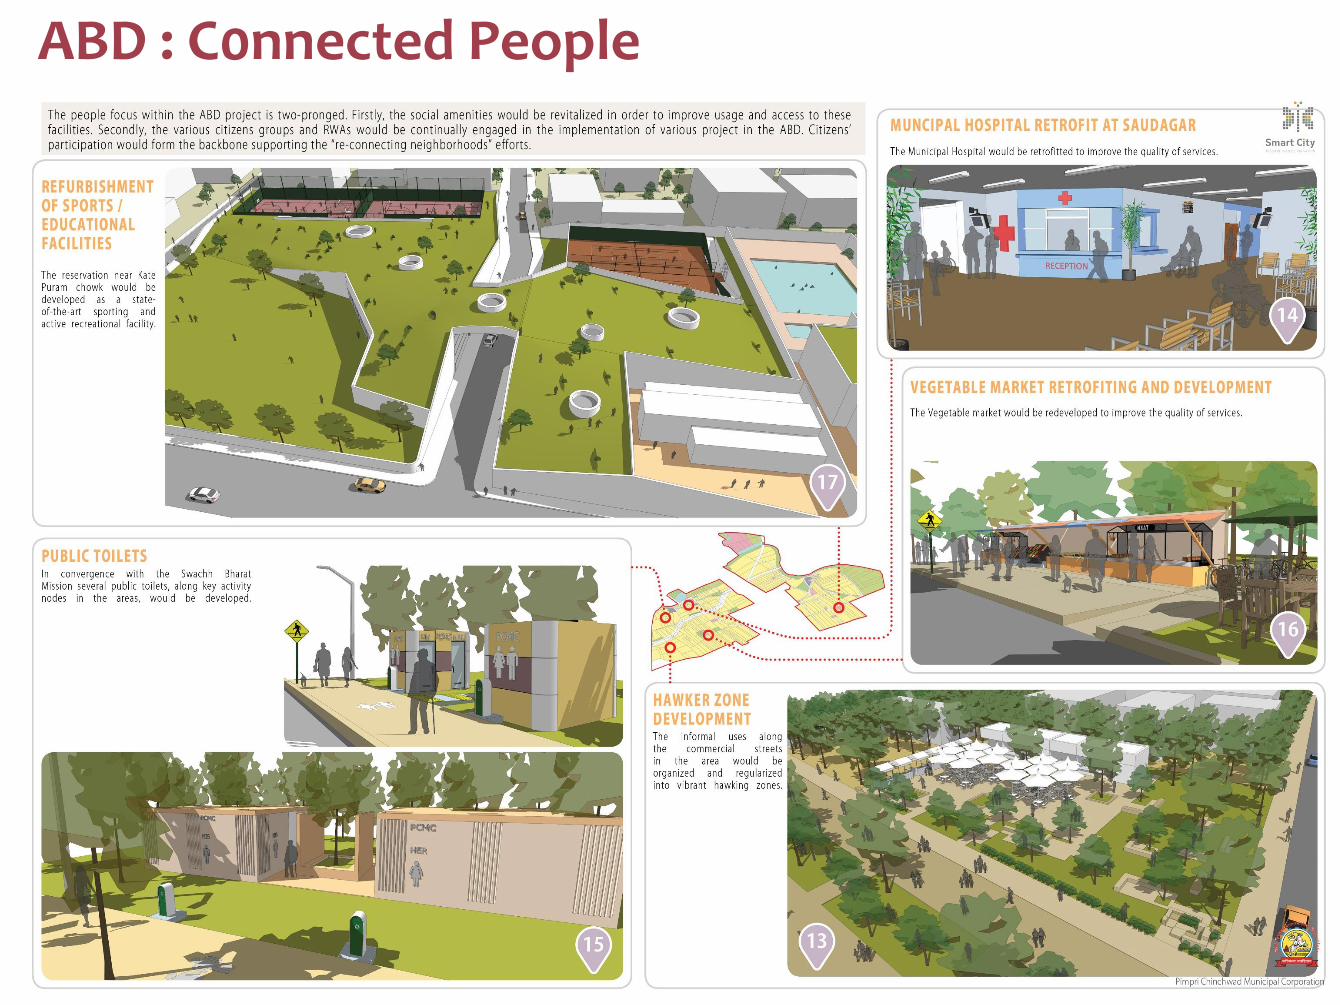
ABD : C0nnected People

Pan
Cit
y S
olu
tio
ns
: Pac
kag
es

SCP Implementation Plan

Structure of SPV

SPV Finance 2018-19 2019-20 2020-21 2021-22 2022-23 SCHEME AMT.
A1 Connected Streets 361.6 178.3 178.3 5.0 0.0 0.0 - 0.0
A2 Connected Parks 92.8 66.4 26.4 0.0 0.0 0.0 - 0.0
A3 Connected Systems 58.0 48.8 9.3 0.0 0.0 0.0 - 0.0
A4 Connected People 53.0 27.5 25.5 0.0 0.0 0.0 - 0.0
TOTAL ABD CAPEX 565.4 321.0 239.5 5.0 0.0 0.0 0.0
P1 Intelligence (Live Data Capture) 194.1 82.4 64.4 47.3 0.0 0.0 - 0.0
P2 Communication 40.0 7.5 17.5 7.5 7.5 0.0 - 0.0
P3 Response 148.0 29.3 32.9 42.9 42.9 0.0 - 0.0
P4 Outdoor Package 54.0 20.0 20.0 14.0 0.0 0.0 - 3.2
P5 Transit Package 67.0 24.2 26.2 16.7 0.0 0.0 - 0.0
P6 Business & Employment Package 12.0 5.0 5.7 0.7 0.7 0.0 - 0.0
P7 Social Package 14.0 5.0 9.0 0.0 0.0 0.0 - 0.0
TOTAL PAN-CITY CAPEX 529.1 173.3 175.6 129.1 51.1 0.0 3.2
Consulting 54.7 21.9 13.7 8.2 5.5 5.5 0.0
GRAND TOTAL 1149.2 516.1 428.8 142.3 56.6 5.5 3.2
PROJECT
CAPEX PHASING CONVERGENCE
TOTAL COST
CASH FLOW STATEMENT - SPV 2018-19 2019-20 2020-21 2021-22 2022-23 Total
INFLOWS
Mission Grant - GoI 196.0 98.0 98.0 98.0 0.0 490.0
Equity contribution - GoM 75.0 75.0 50.0 50.0 0.0 250.0
Equity contribution - PCMC 75.0 75.0 50.0 50.0 0.0 250.0
Additional Capital infusion - PCMC 91.1 91.1 0.0 0.0 0.0 182.2
Soft Loan - PCMC 84.0 91.8 0.0 0.0 0.0 175.8
Convergence - AMRUT 0.0 3.2 0.0 0.0 0.0 3.2
Total 521.1 434.1 198.0 198.0 0.0 1351.2
OUTFLOWS
Capital Expenditure 494.3 415.1 134.1 51.1 0.0 1094.5
Establishment Expenditure 2.0 2.1 2.1 2.1 2.1 10.5
Administrative Expenditure 3.0 3.2 3.2 3.2 3.2 15.7
Consultancy fees 21.9 13.7 8.2 5.5 5.5 54.7
Loan repayment 0.0 0.0 50.4 125.4 0.0 175.8
Total 521.1 434.1 198.0 187.2 10.8 1351.2
CLOSING CASH BALANCE 0.0 0.0 0.0 10.8 0.0 0.0
NET CASH FLOW 0.0 0.0 0.0 10.8 -10.8 0.0

2018-19 2019-20 2020-21 2021-22 2022-23 SCHEME AMT.
A1 Connected Streets 361.6 178.3 178.3 5.0 0.0 0.0 - 0.0
- Street-scaping 265.3 132.7 132.7 0.0 0.0 0.0 - 0.0
- Junction Improvement 5.3 2.7 2.7 0.0 0.0 0.0 - 0.0
Accessibility Improvements to BRTS stations 10.0 5.0 5.0 0.0 0.0 0.0 - 0.0
BRTS stops and Bus stops Improvement 20.0 10.0 10.0 0.0 0.0 0.0 - 0.0
Multi-modal integration at Kasarvadi Railway, BRTS and Mero Stations 30.0 15.0 15.0 0.0 0.0 0.0 - 0.0
TOD at Pimple Gurav Bus Station 15.0 5.0 5.0 5.0 0.0 0.0 - 0.0
- Parking management 1.0 0.5 0.5 0.0 0.0 0.0 - 0.0
- Shifting electric cables underground 15.0 7.5 7.5 0.0 0.0 0.0 - 0.0
A2 Connected Parks 92.8 66.4 26.4 0.0 0.0 0.0 - 0.0
- Major Parks Redevelopment 52.8 26.4 26.4 0.0 0.0 0.0 - 0.0
- Playground Improvement 25.0 25.0 0.0 0.0 0.0 0.0 - 0.0
- Urban forestry 10.0 10.0 0.0 0.0 0.0 0.0 - 0.0
- Beautification of space under flyover 5.0 5.0 0.0 0.0 0.0 0.0 - 0.0
A3 Connected Systems 58.0 48.8 9.3 0.0 0.0 0.0 - 0.0
- Storm water drainage development 10.0 10.0 0.0 0.0 0.0 0.0 - 0.0
- Sewerage network improvement 10.0 10.0 0.0 0.0 0.0 0.0 - 0.0
- Recycling of waste water 5.0 5.0 0.0 0.0 0.0 0.0 - 0.0
- Solar power generation 15.0 15.0 0.0 0.0 0.0 0.0 - 0.0
- Community level composting 0.5 0.0 0.5 0.0 0.0 0.0 - 0.0
- Community level rainwater harvesting 17.5 8.8 8.8 0.0 0.0 0.0 - 0.0
A4 Connected People 53.0 27.5 25.5 0.0 0.0 0.0 - 0.0
- Refurbishment of sports and educational facilities 25.0 12.5 12.5 0.0 0.0 0.0 - 0.0
- Hawking zone development 10.0 5.0 5.0 0.0 0.0 0.0 - 0.0
- Retrofitting municipal hospital 10.0 10.0 0.0 0.0 0.0 0.0 - 0.0
- Installation of public e-toilets (30 no's) 3.0 0.0 3.0 0.0 0.0 0.0 - 0.0
- Development of vegetable market 5.0 0.0 5.0 0.0 0.0 0.0 - 0.0
TOTAL ABD CAPEX 565.4 321.0 239.5 5.0 0.0 0.0 0.0
PROJECT
CAPEX PHASING CONVERGENCE
TOTAL COST
ABD Capex

Pan City Capex2018-19 2019-20 2020-21 2021-22 2022-23 SCHEME AMT.
P1 Intelligence (Live Data Capture) 194.1 82.4 64.4 47.3 0.0 0.0 - 0.0
- Smart Water Supply 34.1 17.1 17.1 0.0 0.0 0.0 - 0.0
- Smart Sewerage 3.0 3.0 0.0 0.0 0.0 0.0 - 0.0
- Smart Traffic Management 42.0 14.0 14.0 14.0 0.0 0.0 - 0.0
- Smart Street-lighting 50.0 16.7 16.7 16.7 0.0 0.0 - 0.0
- Environmental Monitoring 15.0 15.0 0.0 0.0 0.0 0.0 - 0.0
- City Surveillance 50.0 16.7 16.7 16.7 0.0 0.0 - 0.0
P2 Communication 40.0 7.5 17.5 7.5 7.5 0.0 - 0.0
- Optical Fiber Cabling 30.0 7.5 7.5 7.5 7.5 0.0 - 0.0
- Telecommunication systems 10.0 0.0 10.0 0.0 0.0 0.0 - 0.0
P3 Response 148.0 29.3 32.9 42.9 42.9 0.0 - 0.0
- Command & Control Center 25.0 0.0 0.0 12.5 12.5 0.0 - 0.0
- GIS-enabled Enterprise Resource Planning 95.0 23.8 23.8 23.8 23.8 0.0 - 0.0
- Municipal Service Level Benchmarking 5.0 2.5 2.5 0.0 0.0 0.0 - 0.0
- UrbanHEART Benchmarking 3.0 3.0 0.0 0.0 0.0 0.0 - 0.0
-Auditorium Control and Broadcasting Facility 20.0 0.0 6.7 6.7 6.7 0.0 - 0.0
P4 Outdoor Package 54.0 20.0 20.0 14.0 0.0 0.0 - 3.2
- Smart Kiosks 12.0 6.0 6.0 0.0 0.0 0.0 - 0.0
- Public E-toilets 10.0 3.3 3.3 3.3 0.0 0.0 SBM 3.2
- Public WiFi Hotspots 27.0 9.0 9.0 9.0 0.0 0.0 - 0.0
- Unique Smart Addressing 5.0 1.7 1.7 1.7 0.0 0.0 - 0.0
P5 Transit Package 67.0 24.2 26.2 16.7 0.0 0.0 - 0.0
- Smart Parking including multi level car parks 50.0 16.7 16.7 16.7 0.0 0.0 - 0.0
- Bicycle Sharing 15.0 7.5 7.5 0.0 0.0 0.0 - 0.0
- One Transit App 2.0 0.0 2.0 0.0 0.0 0.0 - 0.0
P6 Business & Employment Package 12.0 5.0 5.7 0.7 0.7 0.0 - 0.0
- Skill Development Centers 5.0 2.5 2.5 0.0 0.0 0.0 - 0.0
- Start-Up Incubation Centers 5.0 2.5 2.5 0.0 0.0 0.0 - 0.0
- Establishment Licensing 2.0 0.0 0.7 0.7 0.7 0.0 - 0.0
P7 Social Package 14.0 5.0 9.0 0.0 0.0 0.0 - 0.0
- Municipal E-Classrooms 4.0 0.0 4.0 0.0 0.0 0.0 - 0.0
- School Health Monitoring 10.0 5.0 5.0 0.0 0.0 0.0 - 0.0
TOTAL PAN-CITY CAPEX 529.1 173.3 175.6 129.1 51.1 0.0 3.2
PROJECT
CAPEX PHASING CONVERGENCE
TOTAL COST

Thank You !