visitor attraction trends in england 2014 · pdf filetrends in england 2014 ... with 83% of...
TRANSCRIPT

Full Report
Visitor Attraction Trends in England 2014

Acknowledgements
VisitEngland would like to thank all representatives and operators in the attraction sector who provided information for the national survey on which this report is based. For a number of attractions, data has been included with kind permission of ALVA (Association of Leading Visitor Attractions), Historic England and The National Trust as well as several Destination Management Organisations, councils and museum groups. Where relevant this has been referenced in the report.
No part of this publication may be reproduced for commercial purposes without previous written consent of VisitEngland. Extracts may be quoted if the source is acknowledged.
Statistics in this report are given in good faith on the basis of information provided by proprietors of attractions and relevant organisations. VisitEngland regrets it cannot guarantee the accuracy of the information contained in this report nor accept responsibility for error or misrepresentation.
Published by VisitEngland (incorporated under the 1969 Development of Tourism Act as the British Tourist Authority) © 2014 British Tourist Authority (trading as VisitBritain).
VisitEngland is grateful to Historic England for their financial support for the 2014 survey.
July 2015
1

Introduction This report presents the findings of the Survey of
Visits to Visitor Attractions undertaken in England
by VisitEngland. The report provides a
comprehensive England-wide analysis of trends
plus visits data for individual attractions.
Objectives
To monitor trends in the visitor attraction sector in
England and to improve understanding of the
dynamics of the sector. Findings contribute to
estimates of the economic impact of tourism and
inform development and planning work. Results
allow operators to benchmark their operation
within their category, within their region and across
the sector as a whole.
Survey Method
Attractions have the option of either online or
postal survey completion.
All attractions for whom email contacts are held are
sent an email invitation with a link to their
attraction’s online questionnaire. Attractions not
responding are subsequently sent a postal
questionnaire alongside attractions with no or only
generic email contacts.
A copy of the questionnaire is appended.
BDRC Continental holds the contract for the survey in England and is responsible for the preparation of this report.
It is important to highlight that major individual attractions can have a significant impact upon the proportion of visits within each region and attraction category. Their participation or non-participation in the survey year-on-year can result in significant fluctuations in the data within each region and attraction category.
Visitor Attraction Definition
“…an attraction where it is feasible to charge admission for the sole purpose of sightseeing. The attraction must be a permanently established excursion destination, a primary purpose of which is to allow access for entertainment, interest, or education and can include places of worship (but excludes small parish churches); rather than being primarily a retail outlet or a venue for sporting, theatrical, or film performances. It must be open to the public, without prior booking, for published periods each year, and should be capable of attracting day visitors or tourists as well as local residents. In addition, the attraction must be a single business, under a single management, so that it is capable of answering the economic questions on revenue, employment etc.”
2
3
Sample and Response
VisitEngland tightened its definition and undertook a major review of attractions used for the 2013 survey.
For example, parish churches and small art galleries with a retail focus were removed from the attractions list.
This removed a number of small sites previously classified as attractions, and we therefore saw a slight shift in the attraction size profile of sites participating in the research in 2013.
Further, whilst country parks continue to be included in the survey findings, they have generally been excluded from the most visited lists on the basis that it is not possible to exclude those who have visited the park in such a way that falls outside the our visitor attraction definition.
VisitEngland no longer rigorously monitors attractions openings and closures. The England attractions database was therefore updated this year using Experian business data. This data was de-duplicated against the existing attractions database.
5,555 English visitor attractions were invited to take part in this year’s survey.
1608 English visitor attractions responded to the survey in 2015:
• 888 completed online
• 428 completed by post
• 292 provided data through umbrella organisations
1,583 attractions gave 2014 visitor numbers.
1,491 attractions provided admissions for both 2014 and 2013 and these attractions form the basis of this report’s visitor trend evaluation.

4
Category No. attractions
providing data for 2013 & 2014
Profile of attractions providing data
2014 2013
Country Parks 53 4% 4%
Farms 54 4% 3%
Gardens 92 6% 6%
Historic properties 470 32% 32%
Leisure / theme parks 24 2% 1%
Museums / art galleries 497 33% 32%
Steam / heritage railways 35 2% 2%
Visitor / heritage centres 82 5% 5%
Wildlife attractions / zoos 74 5% 5%
Workplaces 26 2% 2%
Places of worship 62 4% 5%
Other 22 1% 4%
Total 1,491
Response by attraction category
Sample and Response (1)

5
Response by region
Category
No. attns. giving 2013 &
2014 data
Profile of attractions that provided data
2014 2013
Annual Visits
10,000 or less 467 31%
33%
10,001–20,000 196 13% 14%
20,001–50,000 288 19% 20%
50,001–100,000 181 12% 11%
100,001–200,000 138 9% 9%
Over 200,000 221 15% 13%
Total 1,491
Admission
Free 564 38%
38%
Paid 927 62% 62%
Total 1,491
Response by attraction size and admission type
Sample and Response (2)
Category
No. attns. giving 2013
& 2014 data
Profile of attractions
providing data
2014 2013
North West 149 10% 11%
North East 88 6% 5%
Yorks/Humber 144 10% 9%
East Midlands 135 9% 9%
West Midlands 132 9% 10%
East 198 13% 13%
London 104 7% 7%
South East 279 19% 19%
South West 262 18% 17%
Total 1,491
Headlines (1)
Attractions reported a healthy 4% annual increase in total visits to visitor attractions in 2014 (adults and children), consolidating the sector’s return to growth.
The UK economy continued to strengthen in 2014, and with it consumer confidence. Inbound tourism reached record levels and contributed to an increase in overseas visits to attractions (+8%). However, sector growth was limited by a decline in domestic holidays.
The weather in 2014 was mixed –high temperatures and more sun than usual were offset against spells of storms and heavy rain during the year, which brought damaging winds and flash flooding.
2014 saw a change in fortunes of the regions. Growth in 2013 was most marked in London at +8%, but the city only managed to improve visitor numbers by 2% in 2014 – half the average growth of attractions across the whole of England. Instead, it was the East of England that saw the most significant growth, reflecting the positive change in overnight stays by domestic tourists (+10%).
All sectors, aside from Places of worship, have experienced growth in visitor numbers. The biggest growth was seen in Farm attractions and Visitor/ heritage centres, continuing their success from 2013.
Gross revenue at attractions was up by +5% in 2014 – typical of growth levels reported over the last eight years. Almost half (48%) of attractions reported an increase in gross revenue in 2014 compared with only 16% reporting a decrease.
Contributing to this was the +4% increase in adult admission fees (consistent with previous years) and above average increase of child admission charges (+7%).
6
Headlines (2)
The eight year decline in the proportion of attractions reporting increases in marketing expenditure appears to have halted, but not reversed with only 7% more attractions expecting to increase their marketing spend than those anticipating a reduction in expenditure.
Use of digital communications (other than a website) continued to increase in 2014, albeit at a slower pace, with 83% of attractions now using at least one form of digital communications.
Facebook and Twitter remain the most popular platforms and are commonly used, even amongst smaller attractions. However, use of YouTube and Online blogs have increased the most, driven by attractions with less than 100,000 visitors.
Reliance on deals and discounts appears to be increasing with over half (56%) of attractions offering some form of deal or discount in 2014, up from 44% in 2013. This increases to 78% among charged admission attractions. Deals and discounts help to drive family and overseas visits, but their overall impact on admissions appears to be waning.
More sites increased their full time and part time permanent and seasonal employees than cut head counts in 2014 and with the financial climate improving attractions anticipate further increases in staff across all levels in 2015. However, the trend of increasing voluntary workers continued into 2014 and looks set to remain, with 28% of attractions expecting to increase their use of unpaid volunteers in 2015.
7
2014 Weather Summary (source: Met Office)
2014 was the warmest year on record (with records going back to 1910) and was slightly sunnier than the average across 1981 to 2010. However, there were spells of storms and heavy rain during the year, which brought damaging winds and flash flooding.
Winter 2013/14: 2014 started with winter storms in January and February, which brought damaging winds and high levels of rain, 174% of the norm from 1981-2010. This led to inland and coastal flooding. Temperatures were slightly above average at 5.8ºC (+1.6ºC above the norm for the time of year).
Spring 2014: In comparison, Spring was fairly benign, and slightly warmer than average (9.8ºC, which is +1.3ºC of the 1981-2010 average).
Summer 2014: The summer months continued in this vein until August when there was some further heavy rainfall, especially in south-east England, causing localised flash flooding.
Autumn 2014: Autumn saw a shift to lower than average sunshine and rainfall, although the high temperatures continued (11.8ºC, which is 1.5ºC above the norm).
8

52
93
53
42
25
40
43
59
14
55
80
79
86
60
45
7
44
57
72
58
57
36
83
38
19
14
8
40
4
4
1
3
2
5
3
7
1
7
6
ALL
Country parks
Farms
Gardens
Historic houses / castles
Other historic properties
Leisure / theme parks
Museums / art galleries
Steam / heritage railways
Visitor / heritage centres
Wildlife attractions / zoos
Workplaces
Places of worship
Other
Open all year round
Regular seasonal closure
Closed for other reason
Attraction opening – by attraction category
9 Base: All attractions answering (1,411)
Around half (52%) of attractions remain open all year round. This is consistent with last year (49%).
Country parks, places of worship, wildlife attractions and workplaces are the most likely to remain open year round. All of these sectors aside from places of worship are more likely to have remained open compared with 2013.
Steam and heritage railways and historic houses/ castles are the most seasonal.
4% of sites closed for other reasons (such as restoration) during the year.
% open all year
in 2013*
49
55
49
43
22
31
50
58
14
55
73
63
87
52
*Underlined scores indicate 2014 % ‘open all year round’ significantly different from 2013

52
39
40
72
34
45
83
80
45
56
57
23
61
52
43
18
4
5
3
5
5
3
3
3
ALL
Coastal
Rural
Urban
10,000 or less
10,000-20,000
20,000-100,000
Over 100,000
Open all year round
Regular seasonal closure
Closed for other reason
Attraction opening – by destination type & attraction size
10 Base: All attractions answering (1,411)
Larger attractions (100,000 visitors or more), which tend to be based in urban areas are more likely to stay open year round.
Only a third of small attractions (defined as having 10,000 visitors a year or less) remain open for the whole year. These sites are less likely to attract sufficient visitors during off-peak periods to warrant staying open.

Visitor admission trends
Visitor admission trends
8
2 1
-*
3 3 2
5
3 3
-1
5 4
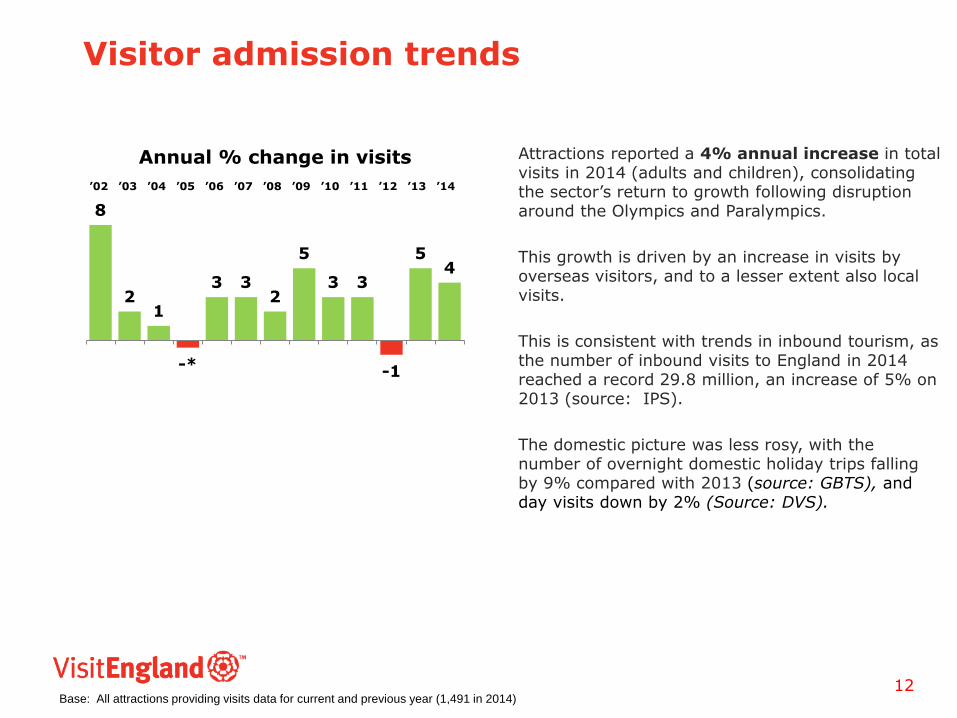
Annual % change in visits Attractions reported a 4% annual increase in total visits in 2014 (adults and children), consolidating the sector’s return to growth following disruption around the Olympics and Paralympics.
This growth is driven by an increase in visits by overseas visitors, and to a lesser extent also local visits.
This is consistent with trends in inbound tourism, as the number of inbound visits to England in 2014 reached a record 29.8 million, an increase of 5% on 2013 (source: IPS).
The domestic picture was less rosy, with the number of overnight domestic holiday trips falling by 9% compared with 2013 (source: GBTS), and day visits down by 2% (Source: DVS).
Base: All attractions providing visits data for current and previous year (1,491 in 2014) 12
’02 ’03 ’04 ’05 ’06 ’07 ’08 ’09 ’10 ’11 ’12 ’13 ’14
Visitor admission trends 2014 – by attraction category
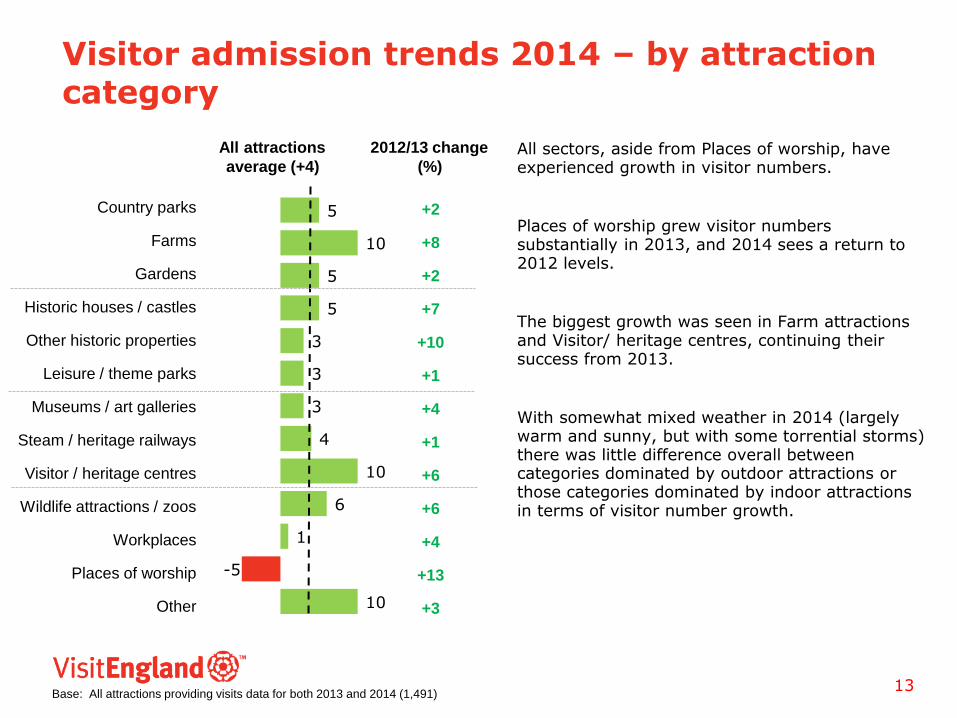
All sectors, aside from Places of worship, have experienced growth in visitor numbers.
Places of worship grew visitor numbers substantially in 2013, and 2014 sees a return to 2012 levels.
The biggest growth was seen in Farm attractions and Visitor/ heritage centres, continuing their success from 2013.
With somewhat mixed weather in 2014 (largely warm and sunny, but with some torrential storms) there was little difference overall between categories dominated by outdoor attractions or those categories dominated by indoor attractions in terms of visitor number growth.
Base: All attractions providing visits data for both 2013 and 2014 (1,491)
5
10
5
5
3
3
3
4
10
6
1
-5
10
Country parks
Farms
Gardens
Historic houses / castles
Other historic properties
Leisure / theme parks
Museums / art galleries
Steam / heritage railways
Visitor / heritage centres
Wildlife attractions / zoos
Workplaces
Places of worship
Other
All attractions
average (+4)
2012/13 change
(%)
+2
+8
+2
+7
+10
+1
+4
+1
+6
+6
+4
+13
+3
13
Index of visits to attractions – sectors outperforming market
148 153
169
232
183
244
202
80
100
120
140
160
180
200
220
240
260
19
89
19
90
19
91
19
92
19
93
19
94
19
95
19
96
19
97
19
98
19
99
20
00
20
01
20
02
20
03
20
04
20
05
20
06
20
07
20
08
20
09
20
10
20
11
20
12
20
13
20
14
TOTAL ENGLAND ATTRACTIONS Museums/art galleries
Country parks Visitor/heritage centres
Workplaces Farms
Gardens
14 Base: All attractions providing visits data for both 2012 and 2013 (1,478)

Index of visits to attractions – sectors outperforming market Index Calculation
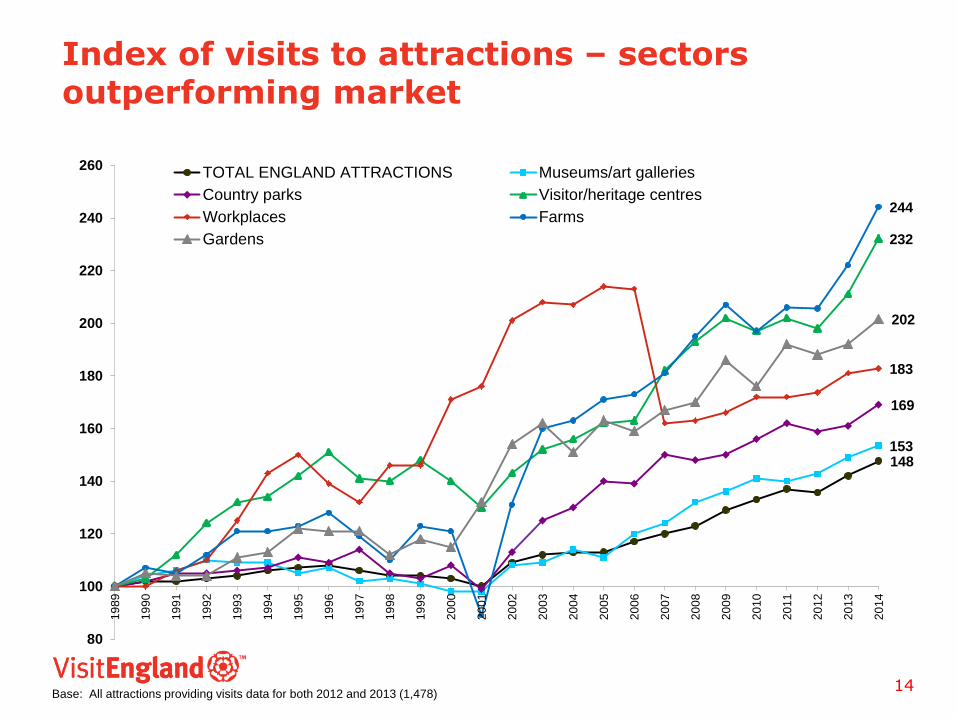
The charts presented on slides 14 and 16 show the indexed visits trend for each attraction category. The base year for the index is 1989, with the index set at 100 for that year. Annual percentage changes in visits are subsequently applied to this index e.g. visits to museums / art galleries increased +4% between 1989 and 1990, increasing the index for 1990 to 104.
Because the number of attractions responding each year differs, the percentage change between any two years is applied each time to the previous year’s index to take account of varying sample sizes each year.
Operators are asked in each survey year to provide the number of visits for both the survey year and previous year. This enables the trend between any two years to be calculated based on the same attractions.
The chart shows the attraction categories which have shown above average annual visit increases since 1989. Across England attractions as a whole, visits have increased 48% in that time.
Farms have seen the greatest increase in visits, particularly in the last ten years, since the Foot and Mouth outbreak of 2001. Visitor / heritage centres have also seen very strong increases overall.
Visits to museums / art galleries overall are now over 50% higher than they were on the introduction of free entry to national museums in 2001. DCMS data on visits to former charging sponsored museums indicate that this increase has been primarily driven by visits to these museums. These figures state that visits to former charging sponsored London museums were up by +151% in the ten years since becoming free and those outside London by +148%.
15

Index of visits to attractions – sectors under performing against market
148
116
106
126
120
80
100
120
140
160
180
200
220
240
260
19
89
19
90
19
91
19
92
19
93
19
94
19
95
19
96
19
97
19
98
19
99
20
00
20
01
20
02
20
03
20
04
20
05
20
06
20
07
20
08
20
09
20
10
20
11
20
12
20
13
20
14
TOTAL ENGLAND ATTRACTIONS Historic properties
Leisure / theme parks Steam / heritage railways
Wildlife attractions / zoos
16 Base: All attractions providing visits data for both 2012 and 2013 (1,478)

Index of visits to attractions – sectors under performing against market
Steam/ heritage railways, which had been performing above or in line with the industry average until 2010, saw two years of decline in 2011 and 2012 and a below average +1% increase in 2013. 2014 may herald the turning point, with visitor growth matching the sector average.
Both historic properties and wildlife attractions/ zoos reported slightly above average increases in visitor numbers this year (+5% and +6% respectively). Both have seen steady improvement since 2001, with historic properties particularly strong since 2008.
Visits to leisure / theme parks have rather stagnated over the past nine years, although it should be noted that attractions operated by Merlin Entertainments are not included in this survey.
17

Visitor admission trends 2014 - by region
6
7
2
3
5
10
2
6
2
2014 saw a change in fortunes of the regions. Growth in 2013 was most marked in London at +8%, but the city only managed to improve visitor numbers by 2% in 2014 – half the average growth of attractions across the whole of England. A record 17.4 million overnight visits to London were made by overseas residents in 2014, an increase of 0.6 million (3.5%) from 2013 (Source: IPS). However, bed nights spent in London were down by 11% amongst the domestic audience in 2014 (Source: GBTS), which has limited growth in the capital. Instead, it was the East of England that saw the most significant growth, reflecting the positive change in bed nights by domestic tourists (+10%, Source: GBTS). North East and West and the South East also showed above average growth.
-2
+6
+4
+5
+1
+4
+8
+4
+4
2012/13
change (%)
All attractions
average (+4%)
North West
North East
Yorks / Humber
East Midlands
West Midlands
East
London
South East
South West
18 Base: All attractions providing visits data for both 2013 and 2014 (1,491)

4
4
7
5
3
1
3
5
4
Visitor admission trends 2014 – by admission charge, geographic location and size
In 2014 visitor numbers grew at a consistent level between free and paid attractions.
In 2013 urban sites were most successful in growing visitor numbers, but the warmer weather in 2014 supported greater growth in coastal regions.
Larger attractions with 50,000+ visits per annum continue to outperform the rest of the market, while attractions with fewer than 20,000 visits continue to grow at the slowest rate.
Free
Paid
Coastal
Rural
Urban
20,000 visits or less
20,001-50,000 visits
50,001-200,000 visits
Over 200,000 visits
+3
+7
+3
+4
+5
+1
+4
+7
+4
2012/13
change (%)
All attractions
average (+4%)
19 Base: All attractions providing visits data for both 2013 and 2014 (1,491)
Visitor admission trends 2014 – paid and free attractions
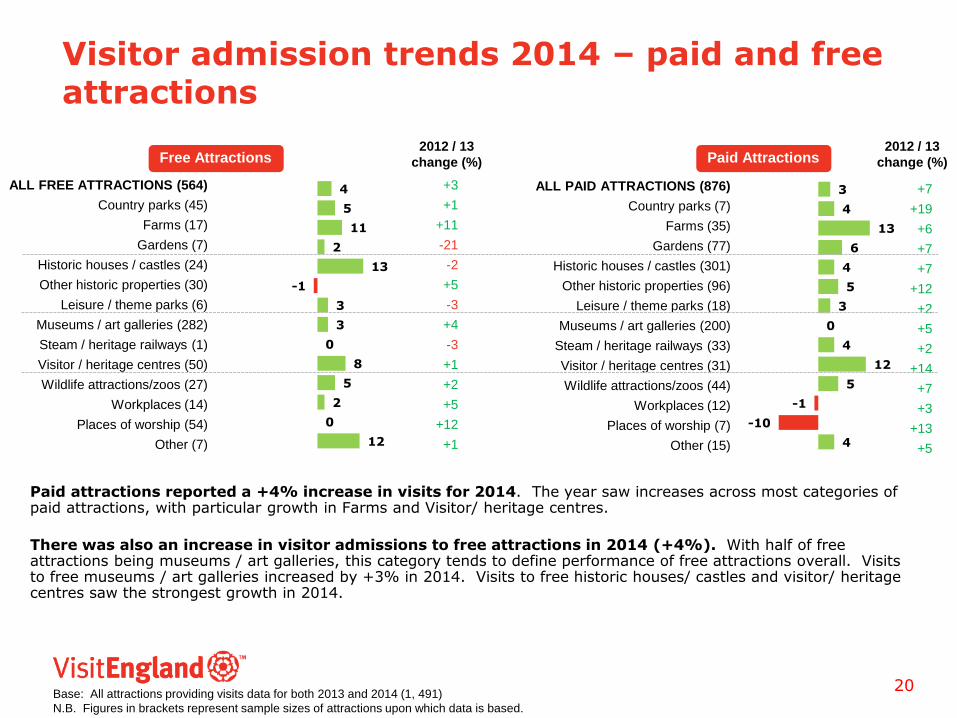
Paid attractions reported a +4% increase in visits for 2014. The year saw increases across most categories of paid attractions, with particular growth in Farms and Visitor/ heritage centres.
There was also an increase in visitor admissions to free attractions in 2014 (+4%). With half of free attractions being museums / art galleries, this category tends to define performance of free attractions overall. Visits to free museums / art galleries increased by +3% in 2014. Visits to free historic houses/ castles and visitor/ heritage centres saw the strongest growth in 2014.
4
5
11
2
13
-1
3
3
0
8
5
2
0
12
ALL FREE ATTRACTIONS (564)
Country parks (45)
Farms (17)
Gardens (7)
Historic houses / castles (24)
Other historic properties (30)
Leisure / theme parks (6)
Museums / art galleries (282)
Steam / heritage railways (1)
Visitor / heritage centres (50)
Wildlife attractions/zoos (27)
Workplaces (14)
Places of worship (54)
Other (7)
Free Attractions 2012 / 13
change (%)
+3
+1
+11
-21
-2
+5
-3
+4
-3
+1
+2
+5
+12
+1
3
4
13
6
4
5
3
0
4
12
5
-1
-10
4
Base: All attractions providing visits data for both 2013 and 2014 (1, 491)
N.B. Figures in brackets represent sample sizes of attractions upon which data is based.
+7
+19
+6
+7
+7
+12
+2
+5
+2
+14
+7
+3
+13
+5
2012 / 13
change (%) Paid Attractions
ALL PAID ATTRACTIONS (876)
Country parks (7)
Farms (35)
Gardens (77)
Historic houses / castles (301)
Other historic properties (96)
Leisure / theme parks (18)
Museums / art galleries (200)
Steam / heritage railways (33)
Visitor / heritage centres (31)
Wildlife attractions/zoos (44)
Workplaces (12)
Places of worship (7)
Other (15)
20

Visitor admission trends 2014 – other regional dimensions
6
6
0
2
5
11
3
7
-2
7
8
5
4
4
9
-4
3
3
4
-5
5
10
3
6
11
6
4
4
8
4
4
4
6
0
1
5
14
2
4
-4
North West
North East
Yorks / Humber
East Midlands
West Midlands
East
London
South East
South West
All attractions +4% +4% +7% +5% +3%
Free Paid Coastal Rural Urban
% change 2013 / 2014
21 Base: All attractions providing visits data for both 2013 and 2014 (1,491)
Small
base
n/a n/a
n/a
Small
base
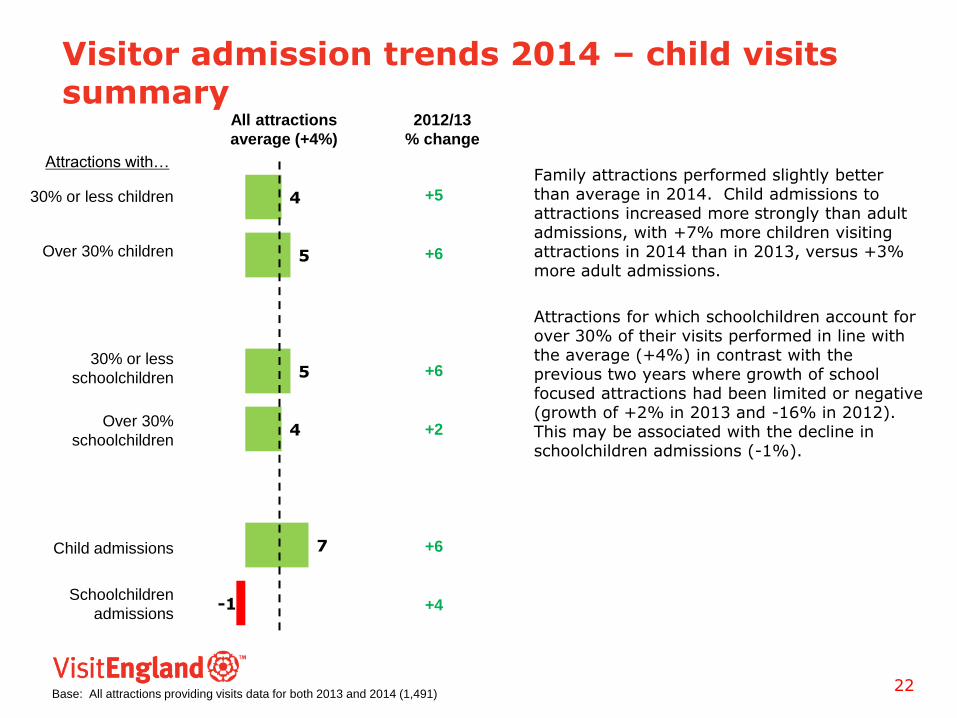
Visitor admission trends 2014 – child visits summary
Family attractions performed slightly better than average in 2014. Child admissions to attractions increased more strongly than adult admissions, with +7% more children visiting attractions in 2014 than in 2013, versus +3% more adult admissions.
Attractions for which schoolchildren account for over 30% of their visits performed in line with the average (+4%) in contrast with the previous two years where growth of school focused attractions had been limited or negative (growth of +2% in 2013 and -16% in 2012). This may be associated with the decline in schoolchildren admissions (-1%).
4
5
5
4
7
-1
All attractions
average (+4%)
2012/13
% change
+5
+6
+6
+2
+6
+4
30% or less children
Over 30% children
30% or less
schoolchildren
Over 30%
schoolchildren
Child admissions
Schoolchildren
admissions
Attractions with…
22 Base: All attractions providing visits data for both 2013 and 2014 (1,491)

43
24
33
44
25
31
Visitor admission trends 2014 – by visitor origin
Across the attractions sector, overseas visits were up by 8% in 2014, following growth of 10% for the previous two years. However, unlike in 2012 when this increase was driven almost entirely by London, the increases in 2013 and 2014 were much more likely to be shared around the regions.
Only the South West saw a decline in overseas visitor admissions (see page 24).
Attractions reported local visitors within day trip distance up by +4% in 2014. This growth has slowed since 2013 (+8%), but is a positive result, given a decline in day visits (-2% in 2014, Source: DVS).
Up
Similar
Down
Base: All attractions responding ( c.1,280)
Up
Similar
Down
Overseas visitors
Compared with 2013 (%)
Local / day trippers
Compared with 2013 (%)
+8% in visits
+4% in visits
23

-20
-22
-22
-22
-25
-20
-28
-29
-27
Visitor admission trends 2014 – overseas visitors by attraction category and region
41
52
51
41
44
29
42
43
43
47
30
40
41
-12
-12
-14
-34
-26
-8
-27
-14
-21
-11
-19
-26
-14
Country parks
Farms
Gardens
Historic houses / castles
Other historic properties
Leisure / theme parks
Museums / art galleries
Steam / heritage railways
Visitor / heritage centres
Wildlife attractions / zoos
Workplaces
Places of worship
Other
% down % up
Attraction Category: overseas visitors
Overseas visits increased to all types of attractions apart from ‘Steam/ heritage railways’ and ‘Places of worship’ in 2014.
2013/14
% change
47
55
51
39
43
40
45
42
35
North West
North East
Yorks / Humber
East Midlands
West Midlands
East
London
South East
South West
% down % up
Region: overseas visitors
Continuing the trend from 2013, overseas visitors were venturing further across the country in 2014. The North East, East Midlands and East of England saw particularly strong increases in overseas visits to their attractions. The South West saw another drop in overseas visitors this year, although the decline was less marked than in 2013 (-6% vs. -18%).
2013/14
% change
Base: All attractions responding ( c.790)
2%
9%
10%
2%
9%
24
34%
6%
4%
26%
22%
13%
17%
4%
22%
9%
22%
38%
10%
12%
30%
10%
17%
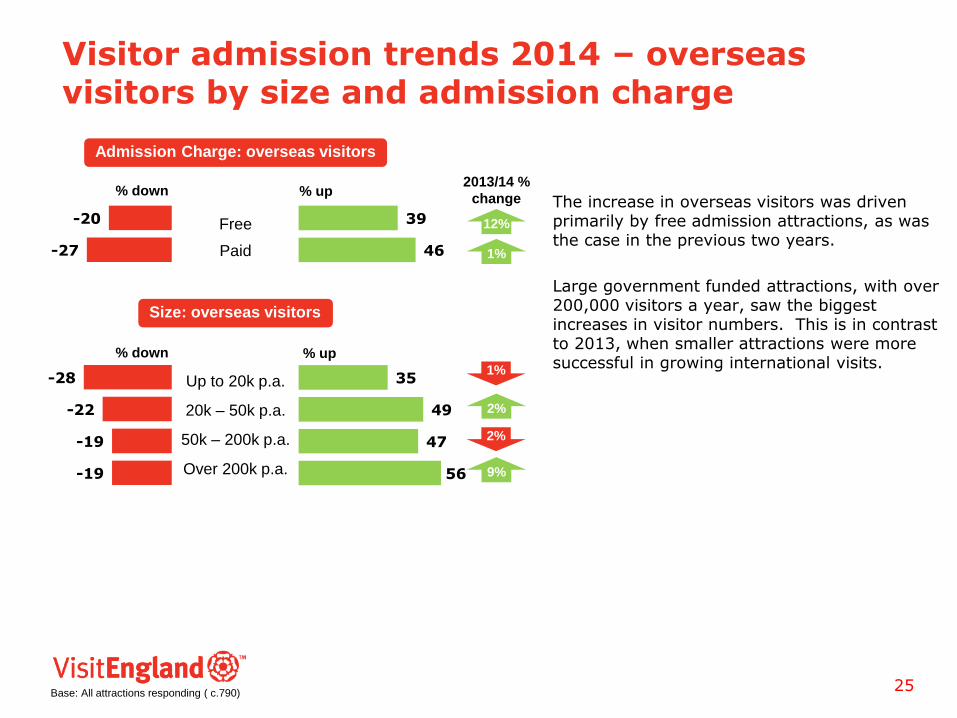
Visitor admission trends 2014 – overseas visitors by size and admission charge
The increase in overseas visitors was driven primarily by free admission attractions, as was the case in the previous two years.
Large government funded attractions, with over 200,000 visitors a year, saw the biggest increases in visitor numbers. This is in contrast to 2013, when smaller attractions were more successful in growing international visits.
39
46
35
49
47
56
-20
-27
-28
-22
-19
-19
% down % up
Admission Charge: overseas visitors
2013/14 %
change
Free
Paid
Up to 20k p.a.
20k – 50k p.a.
50k – 200k p.a.
Over 200k p.a.
Size: overseas visitors
% up % down
12%
1%
Base: All attractions responding ( c.790) 25
9%
2%
1%
2%

36
49
49
43
47
35
44
44
42
55
32
37
48
-22
-24
-21
-25
-23
-20
-30
-30
-25
Visitor admission trends 2014 – local / day trip visitors by attraction category and region
-13
-11
-15
-34
-27
-15
-28
-18
-19
-9
-18
-25
-17
Country parks
Farms
Gardens
Historic houses / castles
Other historic properties
Leisure / theme parks
Museums / art galleries
Steam / heritage railways
Visitor / heritage centres
Wildlife attractions / zoos
Workplaces
Places of worship
Other
% down % up
Attraction Category: local visitors
2013/14
% change
50
54
48
43
47
45
45
41
38
North West
North East
Yorks / Humber
East Midlands
West Midlands
East
London
South East
South West
% down % up
Region: local visitors
2013/14
% change
Other than Museums/ art galleries, and Places of worship which both showed declines of 1%, all other attraction categories reported growth in the local market in 2014. Local visitor numbers held steady or increased across the whole of the UK, with particular growth in the East of England.
Base: All attractions responding ( c.800)
5%
9%
6%
26
3%
13%
4%
4%
2%
9%
1%
10%
7%
5%
1%
9%
1%
7%
9%
0%
3%
4%
1%

2013/14%
change
Visitor admission trends 2014 – local / day trip visitors by size and admission charge
Local visitors appear to have driven the increase in visits to paid admission attractions in 2014. Local visitors to these attractions increased by +6% in 2014 compared with an overall +4% increase in visits to paid attractions and marginal growth of +1% amongst overseas visitors.
The smallest attractions experienced a slight decline (-1%) in local visitors.
39
49
39
47
50
52
-23
-26
-27
-24
-19
-23
% down % up
Admission Charge: local visitors
Free
Paid
Up to 20k p.a.
20k – 50k p.a.
50k – 200k p.a.
Over 200k p.a.
Size: local visitors
% up % down
Base: All attractions responding ( c.1,260) 27
2%
6%
4%
4%
2%
1%

Admission charge and revenue trends

0
1
3
7
5
7
7
10
10
10
14
10
8
7
Adult admission charges 2014
39% of attractions charging admission, charge £5 or less for entry – this has been slowly declining over the last couple of years (43% in 2012 and 41% in 2013). 16% charge over £10.
The average entry charge stands at £7.24 in 2014.
The average child admission charge amongst those sites charging is £4.69. A quarter of charging sites charge over £5 for child entry, with 5% charging over £10.00.
Over £30.00
£20.01 - £30.00
£15.01 - £20.00
£12.01 - £15.00
£10.01 - £12.00
£9.01 - £10.00
£8.01 - £9.00
£7.01 - £8.00
£6.01 - £7.00
£5.01 - £6.00
£4.01 - £5.00
£3.01 - £4.00
£2.01 - £3.00
£2.00 or less
Base: Attractions charging for admission in 2014 (919)
%
29

4
4
5
3
3
5
5
6
2
5
3
5
3
4
Adult admission charge trends 2014 – by attraction category
Adult and child entrance fees both increased in 2014, with fairly consistent increases across categories.
The average increase in adult admission fees was 4% – consistent with increases during the previous years, with increases of 4% (2013), 4% (2012), 5% (2011), 5% (2010) and 4% (2009). This remains significantly above the rate of inflation.
Average child admission charges increased by more - 7% on average – which is a higher increase than in previous years (4% in 2013, 3% in 2012).
Leisure/ theme parks (£15.66), wildlife attractions/ zoos (£9.83) and steam/ heritage railways (£9.31) have the highest average admission prices.
Country parks charging asked for £6.67 on average for adult entry in 2014. Go Ape (which charges significantly more than this per entry) did not provide data this year, which explains the apparent drop in price point for this category compared with 2013, when the average price for entry was £25.13.
ALL ATTRACTIONS
Country parks
Farms
Gardens
Historic houses / castles
Other historic properties
Leisure / theme parks
Museums / art galleries
Steam / heritage railways
Visitor / heritage centres
Wildlife attractions / zoos
Workplaces
Places of worship
Other
Base: Attractions providing admission charge data for both 2013 and 2014 (919)
Average
2014
charge
% average increase
in adult charge
versus 2013
£7.24
£6.67
£8.11
£6.90
£7.71
£5.96
£15.66
£5.43
£9.31
£5.93
£9.83
£6.29
£8.56
£9.48
+4
+3
-5
+4
+4
+7
+6
+5
+2
+5
+4
+3
+18
+8
2012/13
change
(%)
30

4
4
5
3
3
5
3
4
4
Adult admission charge trends 2014 – by region
London charging attractions remain the most expensive (at £8.83 on average), but only marginally, with most areas (except the North East, East Midlands and Yorkshire) charging over £7 for adult entry.
Attractions in the East have been increasing their prices most rapidly over the last couple of years (+5% in 2014, +5% in 2013 and +6% in 2012).
North West
North East
Yorks / Humber
East Midlands
West Midlands
East
London
South East
South West
Base: All attractions providing admission charge data for both 2013 and 2014 (919)
Average
2014 charge
All attractions
average (4%)
£7.24
£6.02
£6.75
£6.20
£7.23
£7.13
£8.83
£7.64
£7.51
+6
+5
+4
+4
+5
+5
+4
+4
+3
2012/13
change (%)
31
% change in adult admission charge

4
4
3
3
5
Adult admission charge trends 2014 – by attraction size
Site admission charges increase in line with the number of visitors attracted, with those bringing in more than 200,000 visitors a year charging over £12 on average, vs. an average entrance fee of a little of £5 for attractions with 20,000 visitors or fewer.
There is little variation in entrance price inflation by attraction size, although the largest sites (those with over 200,000 visitors) continue to be more bullish, increasing adult charges by +5% in 2014.
20,000 or less p.a.
20,001 – 50,000 p.a.
50,001 – 100,000 p.a.
100,001 – 200,000 p.a.
Over 200,000 p.a.
Base: All attractions providing admission charge data for both 2013 and 2014 (919)
Average
2014 charge All attractions
average (4%)
£5.18
£6.84
£8.43
£10.79
£12.45
+4
+2
+5
+6
+7
2012/13
change (%)
% change in adult admission charge
Annual visits
32

5
4
4
5
4
4
4
Adult admission charge trends 2014 – by geographic location and child admissions
Change in admission pricing is consistent across the different types of areas, and between sites attracting families/ non-family and domestic/ overseas audiences.
Sites with a high proportion of overseas visitors and children tend to set their entrance fees higher, with coastal attractions charging the least.
Coastal
Rural
Urban
30% or less child visits
Over 30% child visits
30% or less overseas visits
Over 30% overseas visits
Base: All attractions providing admission charge data for both 2013 and 2014 (919)
Average 2013
charge
£6.48
£7.44
£7.16
£6.56
£8.32
£7.04
£9.24
2012/13
change (%) All attractions
average (4%)
Attractions with…
+4
+4
+5
+4
+4
+4
+5
33
% change in adult admission charge

5 5
8
5 5
1
5 5
2007 2008 2009 2010 2011 2012 2013 2014
Gross revenue trend
Gross revenue at attractions was up by +5% in 2014, following the general trend over the last eight years (with exceptions in 2009 and 2012).
Almost half (48%) of attractions reported an increase in gross revenue in 2014 compared with only 16% reporting a decrease.
In the past, revenue has been correlated with change in adult admission prices, with larger price increases generating more revenue. However, in 2014 we didn’t find this to be the case. With the high, above inflation, price increases, it seems that some attractions may have increased their prices beyond the optimal level.
% change in gross revenue
Base: All attractions responding (1,167) 34
5
3
5
Gross revenue up
Gross revenue similar
Gross revenue down
% change adult admission charges

6
7
6
4
6
10
4
6
8
8
1
3
18
Gross revenue trend 2014 – by attraction category
All categories managed to increase gross revenue in 2014.
Once again, growth was particularly strong for leisure / theme parks – perhaps seeing growth in secondary spend, accommodation, annual passes / memberships etc.
Workplaces managed to increase revenue by 1% this year, having been static in 2013.
Country parks
Farms
Gardens
Historic houses / castles
Other historic properties
Leisure / theme parks
Museums / art galleries
Steam / heritage railways
Visitor / heritage centres
Wildlife attractions / zoos
Workplaces
Places of worship
Other
+3
+8
+4
+6
+12
+18
+4
+9
+5
+2
0
+4
+7
2012/13 %
change All attractions (+5%)
35 Base: All attractions responding (1,166)

Gross revenue trend 2014 – by region
Attractions in the North West, Yorkshire & Humberside and London were the most effective at increasing revenue in 2014.
In the North West, revenue increases were driven by the increase in visitor numbers.
Yorkshire attractions reported below average increases in visitors, so their revenue growth is likely to have come from the above average increase in entrance fees.
London attractions reported below average visitor numbers and price increases, so we can only assume that revenue growth in this region has come through secondary spend and operational efficiencies.
Despite growth in visitor numbers and above average increases in admission charges, sites in the East of England report below average revenue gains, so this may be associated with expenditure on marketing or improvements to the offer.
8
5
8
5
4
3
7
5
5
North West
North East
Yorks / Humber
East Mids
West Mids
East
London
South East
South West
Base: All attractions responding (1,166) 36
+2
+7
+8
+3
+8
+5
+8
+6
+5
2012/13 %
change All attractions (+5%)

5
6
3
6
5
4
6
6
7
Gross revenue trend 2014 – by admission charge, destination type and visit volume
Revenues grew in 2014 across all sizes of category, destination types and free versus charging attractions.
Revenue growth was more significant at large attractions with over 200,000 visitors, with slightly below average increases at small attractions (with fewer than 20,000 visitors).
Coastal attractions (a fifth of which are found in the East) reported the lowest revenue gains, despite above average increases in visitor numbers and adult admission fees.
+3
+7
+5
+6
+5
+5
+5
+7
+5
2012/13 %
change All attractions (+5%)
Free
Paid
Up to 20k p.a.
20k – 50k p.a.
50k – 200k p.a.
Over 200k p.a.
Admission Charge
Annual visit volume
37 Base: All attractions responding (1,166)
Coastal
Rural
Urban
Destination type

Marketing and communications trends
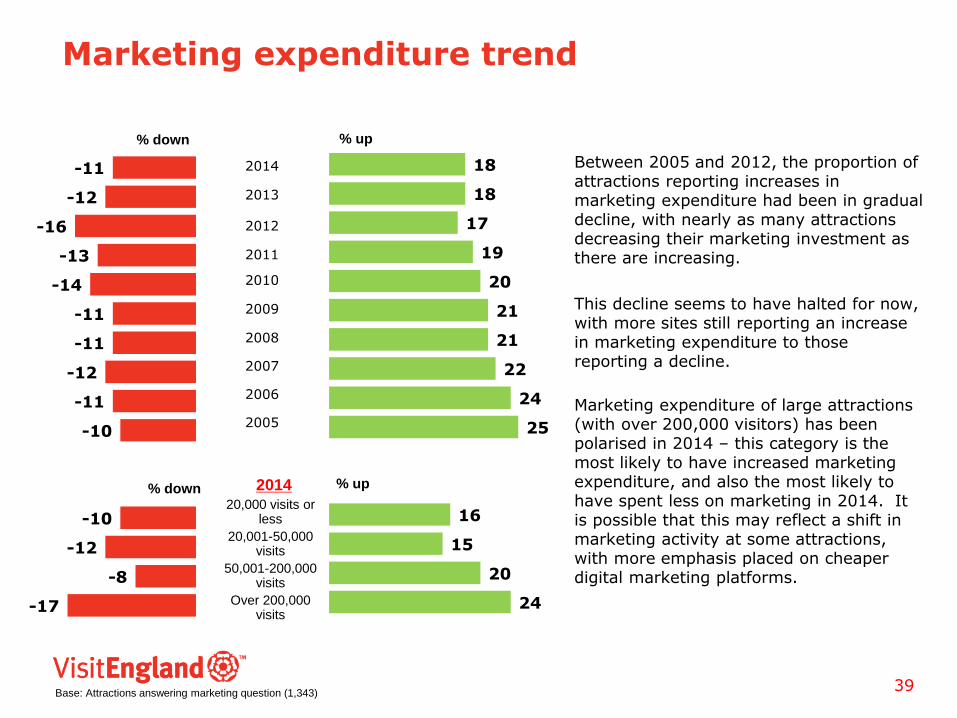
Marketing expenditure trend
Between 2005 and 2012, the proportion of attractions reporting increases in marketing expenditure had been in gradual decline, with nearly as many attractions decreasing their marketing investment as there are increasing.
This decline seems to have halted for now, with more sites still reporting an increase in marketing expenditure to those reporting a decline.
Marketing expenditure of large attractions (with over 200,000 visitors) has been polarised in 2014 – this category is the most likely to have increased marketing expenditure, and also the most likely to have spent less on marketing in 2014. It is possible that this may reflect a shift in marketing activity at some attractions, with more emphasis placed on cheaper digital marketing platforms.
18
18
17
19
20
21
21
22
24
25
16
15
20
24
-11
-12
-16
-13
-14
-11
-11
-12
-11
-10
-10
-12
-8
-17
20,000 visits or less
20,001-50,000 visits
50,001-200,000 visits
Over 200,000 visits
% down % up
% down % up 2014
Base: Attractions answering marketing question (1,343) 39
2014
2013
2012
2011
2010
2009
2008
2007
2006
2005

Marketing expenditure trends 2014 –by attraction category
13
36
14
13
15
44
19
25
20
21
7
13
16
-19
-11
-14
-9
-5
-11
-13
-8
-7
-13
-4
-7
-24
Country parks
Farms
Gardens
Historic houses / castles
Other historic properties
Leisure / theme parks
Museums / art galleries
Steam / heritage railways
Visitor / heritage centres
Wildlife attractions / zoos
Workplaces
Places of worship
Other
% down
(All attractions 11%) % up
(All attractions 18%)
Leisure/ theme parks are the most likely to have increased their marketing spend, with approaching half of these attractions doing so and only one in ten reducing spend. Although this category experienced below average growth in visitor numbers, it was able to support slightly above average admissions price increases and were the most successful category at growing revenue in 2014.
Over a third of Farms increased their marketing expenditure in 2014, which is likely to have supported their growth in visitor numbers and associated revenue.
Only Country parks reported a net reduction in marketing spend (where the proportion decreasing exceeded the proportion increasing marketing spend).
40 Base: Attractions answering marketing question (1,343)
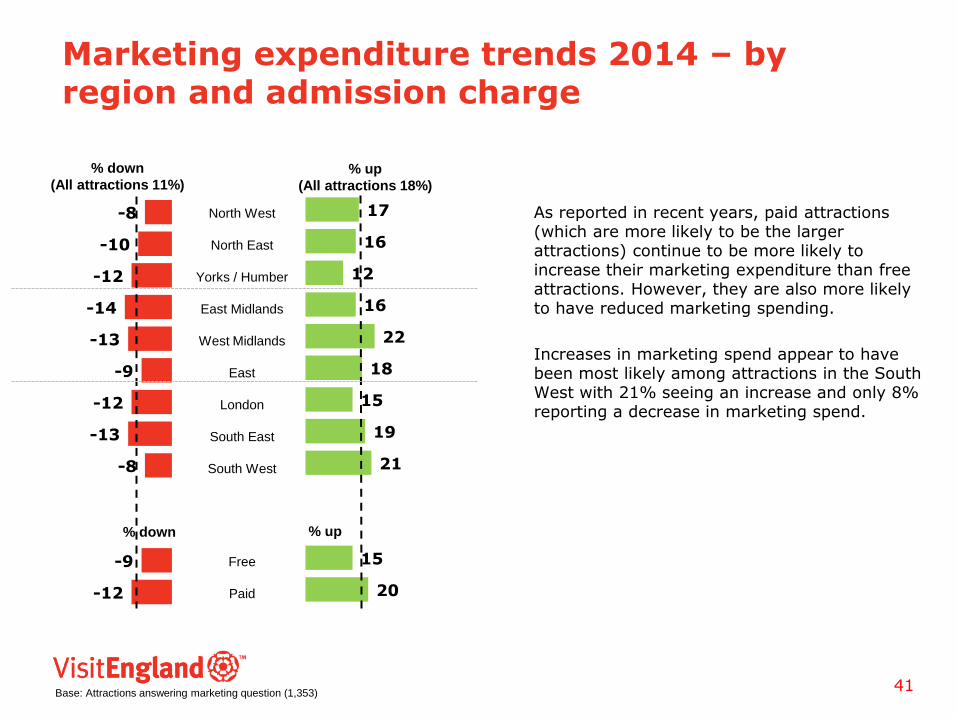
Marketing expenditure trends 2014 – by region and admission charge
As reported in recent years, paid attractions (which are more likely to be the larger attractions) continue to be more likely to increase their marketing expenditure than free attractions. However, they are also more likely to have reduced marketing spending.
Increases in marketing spend appear to have been most likely among attractions in the South West with 21% seeing an increase and only 8% reporting a decrease in marketing spend.
-8
-10
-12
-14
-13
-9
-12
-13
-8
-9
-12
17
16
12
16
22
18
15
19
21
15
20
North West
North East
Yorks / Humber
East Midlands
West Midlands
East
London
South East
South West
Free
Paid
% down % up
41 Base: Attractions answering marketing question (1,353)
% down
(All attractions 11%) % up
(All attractions 18%)
Impact of marketing expenditure - summary
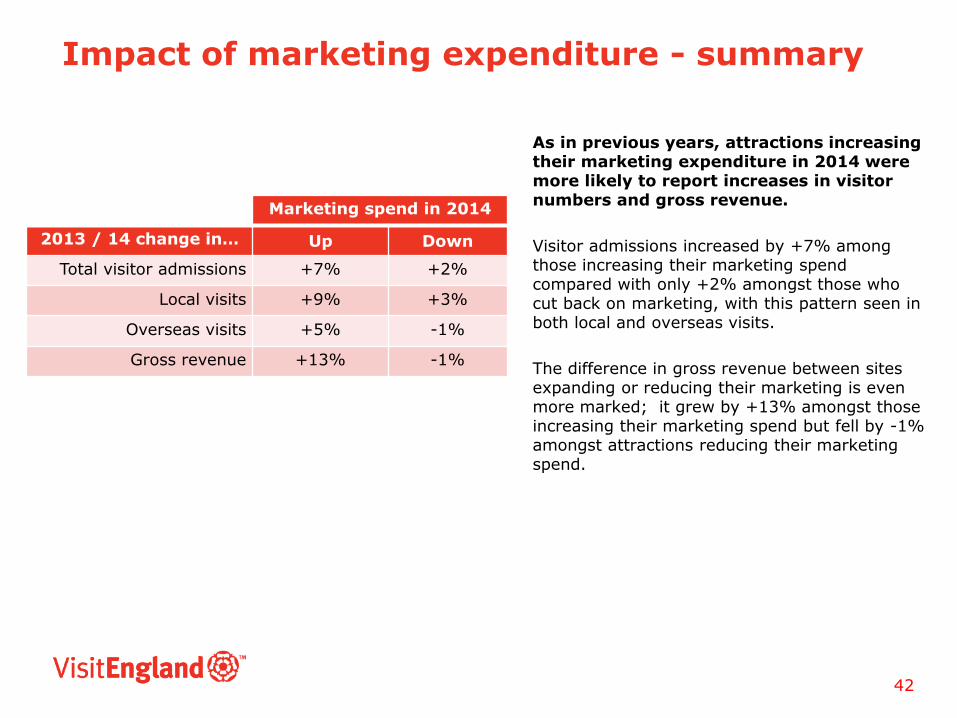
As in previous years, attractions increasing their marketing expenditure in 2014 were more likely to report increases in visitor numbers and gross revenue.
Visitor admissions increased by +7% among those increasing their marketing spend compared with only +2% amongst those who cut back on marketing, with this pattern seen in both local and overseas visits.
The difference in gross revenue between sites expanding or reducing their marketing is even more marked; it grew by +13% amongst those increasing their marketing spend but fell by -1% amongst attractions reducing their marketing spend.
Marketing spend in 2014
2013 / 14 change in… Up Down
Total visitor admissions +7% +2%
Local visits +9% +3%
Overseas visits +5% -1%
Gross revenue +13% -1%
42
Website and online booking facilities
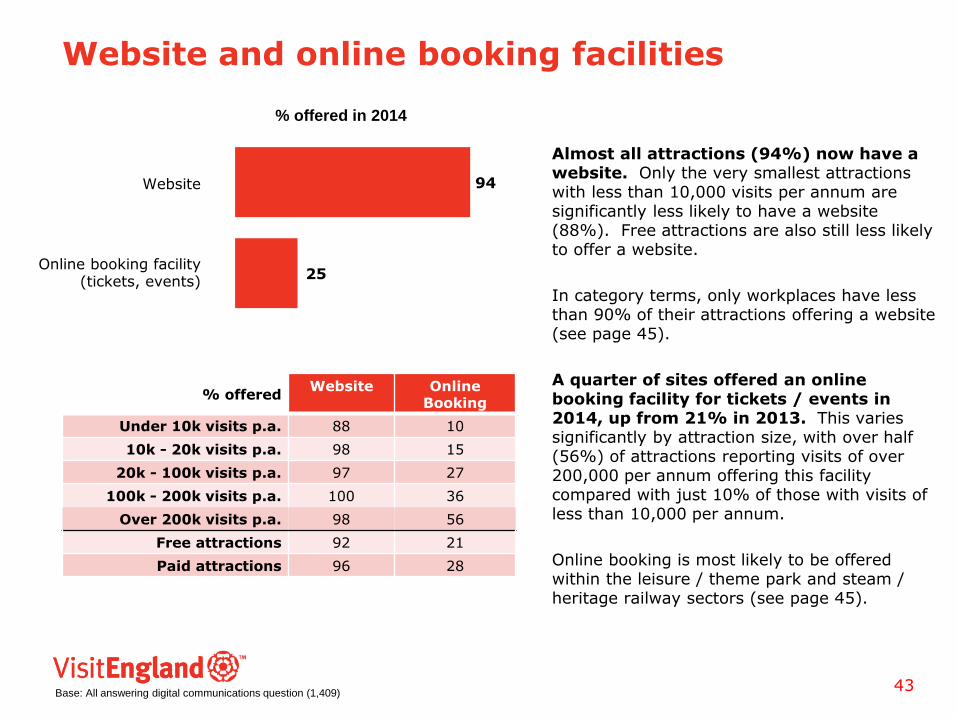
Almost all attractions (94%) now have a website. Only the very smallest attractions with less than 10,000 visits per annum are significantly less likely to have a website (88%). Free attractions are also still less likely to offer a website.
In category terms, only workplaces have less than 90% of their attractions offering a website (see page 45).
A quarter of sites offered an online booking facility for tickets / events in 2014, up from 21% in 2013. This varies significantly by attraction size, with over half (56%) of attractions reporting visits of over 200,000 per annum offering this facility compared with just 10% of those with visits of less than 10,000 per annum.
Online booking is most likely to be offered within the leisure / theme park and steam / heritage railway sectors (see page 45).
94
25
% offered Website Online
Booking
Under 10k visits p.a. 88 10
10k - 20k visits p.a. 98 15
20k - 100k visits p.a. 97 27
100k - 200k visits p.a. 100 36
Over 200k visits p.a. 98 56
Free attractions 92 21
Paid attractions 96 28
% offered in 2014
Base: All answering digital communications question (1,409) 43
Website
Online booking facility (tickets, events)

77 67
62 55
51 45
31 29
19 17
19 16
18 7
11 n/a
10 10
13 10
%‘12
Other digital communications offered
Use of digital communications (other than a website) continued to increase in 2014, albeit at a slower pace, with 83% of attractions now using at least one form of digital communications.
Facebook and Twitter remain the most popular platforms and are commonly used, even amongst smaller attractions. However, use of YouTube and Online blogs have increased the most, driven by attractions with less than 100,000 visitors.
Provision of mobile apps more than doubled between 2012 and 2013, but developments in this area seem to have halted in 2014.
83
69
57
31
28
27
18
16
11
8
% offered Number of visits p.a
20k or less 20k-100k Over 100k
ANY 72 92 94
Facebook page 54 79 89
Twitter account 37 69 83
E-newsletter 20 34 54
YouTube 15 33 46
Online blogs 16 32 43
Mobile apps 12 21 27
Instagram/Pinterest 6 18 34
Other social media 5 12 25
Mobile website 3 8 18
% offered in 2014
Base: All answering digital communications question (1,409) 44
ANY
Facebook page
Twitter account
E-newsletter
YouTube
Online blogs
Mobile apps
Instagram/Pinterest
Other social media
Mobile website
%‘13

Digital communications offered in 2014 – by attraction category
% offering Country Parks
Farms Gardens Historic houses / castles
Other historic
properties
Leisure / theme
parks
Museums / art
galleries
Steam / heritage railways
Visitor / heritage centres
Wildlife / zoos
Work-places
Places of
Worship Other
ANY 85 95 79 89 77 96 82 89 81 89 52 67 93
Facebook 77 91 74 62 46 82 74 89 67 83 41 58 85
Twitter account
50 64 61 56 35 79 62 62 52 69 37 47 59
E-newsletter 19 48 32 25 19 57 37 43 27 37 26 30 11
YouTube 4 30 12 43 42 43 24 38 10 31 7 13 30
Online blogs 6 27 23 49 39 21 23 24 6 29 4 8 11
Mobile apps 6 2 13 42 37 25 9 8 14 11 0 5 7
Instagram/ Pinterest
0 16 16 14 10 29 22 16 10 16 15 5 19
Other social media
2 11 11 9 6 21 16 8 10 19 7 0 11
Mobile website
6 9 9 6 6 21 8 16 5 13 4 3 19
WEBSITE 94 95 93 93 93 96 94 97 91 97 85 100 96
ONLINE BOOKING
17 38 15 21 18 68 24 59 19 30 19 23 33
Base: All answering digital communications question (1,409) 45

Impact of digital communications - summary
Those attractions offering some form of digital communications platform (excluding just a website or online booking facility) in 2014 reported stronger increases in overall gross revenue and in child admissions.
Gross revenue increased by +6% amongst those offering digital communications, but by only +2% amongst sites not offering.
There was no impact of offering digital communications on total admissions; nor was there any impact on local or overseas visitors.
However, digital communications are clearly important to the success of family attractions. The impact on child admissions was significant – increasing by +7% among those offering digital communications and declining by -7% among those who did not.
Offer any digital communications
(exc. website / online booking)?
2013 / 14 change in… Yes No
Total visitor admissions +4% +3%
Children admissions +7% -7%
Local visits +4% +4%
Overseas visits +8% +8%
Gross revenue +6% +2%
46

Deals and Discounts
Deals or discounts offered in 2014
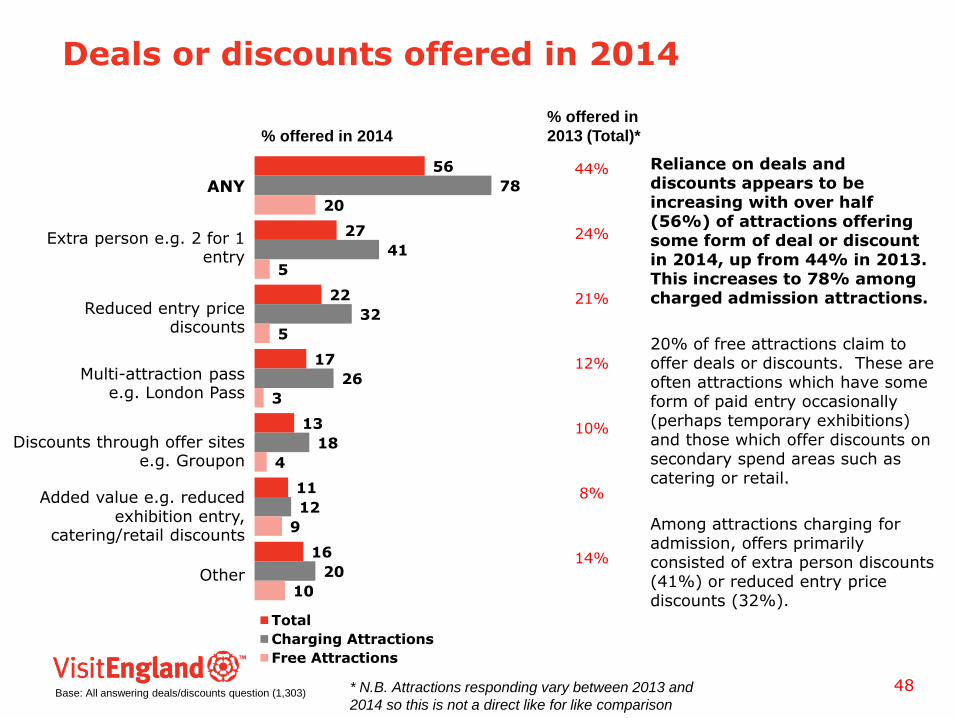
Reliance on deals and discounts appears to be increasing with over half (56%) of attractions offering some form of deal or discount in 2014, up from 44% in 2013. This increases to 78% among charged admission attractions.
20% of free attractions claim to offer deals or discounts. These are often attractions which have some form of paid entry occasionally (perhaps temporary exhibitions) and those which offer discounts on secondary spend areas such as catering or retail.
Among attractions charging for admission, offers primarily consisted of extra person discounts (41%) or reduced entry price discounts (32%).
56
27
22
17
13
11
16
78
41
32
26
18
12
20
20
5
5
3
4
9
10
Total
Charging Attractions
Free Attractions
% offered in 2014
Base: All answering deals/discounts question (1,303) 48
ANY
Extra person e.g. 2 for 1 entry
Reduced entry price discounts
Multi-attraction pass e.g. London Pass
Discounts through offer sites e.g. Groupon
Added value e.g. reduced exhibition entry,
catering/retail discounts
Other
% offered in
2013 (Total)*
44%
24%
21%
12%
10%
8%
14%
* N.B. Attractions responding vary between 2013 and
2014 so this is not a direct like for like comparison

Deals or discounts offered by charging attractions 2014 – by attraction category
Among charging attractions, it is the attractions which tend to focus upon the family market - leisure / theme parks (91%), farms (90%) and wildlife attractions / zoos (88%) - which are most likely to offer deals and discounts.
Deals and discounts are offered across all sectors, although the type of offer varies by category.
Reduced entry discounts and extra person discounts are the most popular offer, but are less likely to be employed at historic houses/ castles, other historic properties and workplaces.
Offer sites, such as Groupon, are employed in the Farms and Wildlife attractions/ zoos sectors.
Leisure/ theme parks
Farms
Wildlife attractions / zoos
Steam/ heritage railways
Other historic properties
Museums/ art galleries
Historic houses / castles
Country parks
Gardens
Visitor / heritage centres
Places of worship
Workplaces
Other
0% 40 50
49
30 10 20
Base: All charging attractions answering deals/discounts question (853)
N.B. Country Park, Workplaces and Places of Worship have low base sizes (under 20)
91%
90%
88%
81%
81%
78%
76%
75%
73%
69%
63%
58%
67%
% ANY
Offer sites Added value Multi-attraction pass
Extra person Reduced entry
Other
70% 60

Deals or discounts offered by charging attractions in 2014– by visitor volume
Use of deals and discounts is prevalent across all attraction sizes and is growing, particularly at the smaller end of the market. In 2013 around half of attractions with under 10,000 visitors used deals/ discounts to market their offer; this rose to almost two thirds in 2014.
Use of deals and discounts grows with attraction size, but the types of discount used are fairly consistent.
Visit Volume
% offering Under 10k
10k-20k
20k-50k
50k-100k
Over 100k
ANY (2013) 49 57 67 69 75
ANY (2014) 64 86 86 84 81
Extra person e.g. 2 for 1
entry
30 44 44 47 51
Reduced entry price discounts
20 26 37 48 40
Multi-attraction pass e.g. London Pass
16 34 32 31 28
Discounts through offer sites e.g. Groupon
7 20 26 25 21
Added value e.g. reduced exhibition entry, catering/retail discounts
5 11 10 16 25
Other 13 20 23 26 26
50 Base: All charging attractions answering deals/discounts question (808)

Deals or discounts offered by charging attractions in 2014 – by region
Region (%)
% offering NW NE Y+H EM WM EAST LON SE SW
ANY 79 83 82 76 76 74 88 76 78
Extra person e.g. 2 for 1 entry
41 29 33 41 41 48 56 44 38
Reduced entry price discounts
32 29 34 26 35 27 29 31 38
Multi-attraction pass e.g. London Pass
19 45 45 20 27 16 63 17 25
Discounts through offer sites e.g. Groupon
13 12 21 21 27 14 22 15 19
Added value e.g. reduced exhibition entry,
catering/retail discounts
15 10 7 16 8 11 10 16 12
Other 25 10 21 24 23 12 29 19 23
51 Base: All charging attractions answering deals/discounts question (808)
Offering deals and discounts is common among charging attractions across England, and particularly high in London, where greater competition has led to use of a wider array of offers to attract visitors.
Multi-attraction passes are common in London and also North East and Yorkshire, but used less elsewhere. Discounts through offer sites are most popular in the West Midlands.

Impact of offering deals and discounts - summary
In 2013 we found a significant difference in visitor admission growth according to whether or not attractions offered deals and discounts (+7% growth vs. +3% growth). This variance has reduced in 2014 (+4% vs. +3% growth), and there was no discernible impact on revenue.
Consumer confidence improved in 2014 (Source: GfK Confidence Barometer) so it may be that some visitors are using offers more tactically – checking for offers for places that they are intending to visit anyway.
Deals and discounts do have a clear impact on the family and overseas markets.
Offer deals / discounts?
2013 / 14 change in… Yes No
Total visitor admissions +4% +3%
Child admissions +6% -1%
Overseas visits +8% 0%
Local visits +5% +2%
Gross revenue +6% +6%
52

Employment trends

9
3
9
8
22
8
4
9
9
28
Employment trends
Proportions of attractions employing any of the following employees in 2014:
• 80% full-time permanent
• 47% full-time seasonal
• 81% part-time permanent
• 58% part-time seasonal
• 85% unpaid volunteers
The trend of increasing voluntary workers continued into 2014 and looks set to remain, with 28% of attractions expecting to increase their use of unpaid volunteers in 2015.
More sites increased their full time and part time permanent and seasonal employees than cut head counts in 2014 and with the financial climate improving attractions anticipate further increases in staff across all levels in 2015.
-7
-2
-5
-3
-4
-4
-2
-5
-3
-2
Full-time permanent
Full-time seasonal
Part-time permanent
Part-time seasonal
Unpaid volunteers
% down % up
% down % up
Anticipated change in employees in 2015
Change in employees since 2013
Full-time permanent
Full-time seasonal
Part-time permanent
Part-time seasonal
Unpaid volunteers
Base: All answering employment questions
54
-4
-6
-3
-2
27
18
28
21
11
8
24
33
29
23
8
19
0
22
21
86
71
73
91
80
42
92
89
81
84
44
94
29
Country parks
Farms
Gardens
Historic houses / castles
Other historic properties
Leisure / theme parks
Museums / art galleries
Steam / heritage railways
Visitor / heritage centres
Wildlife attractions / zoos
Workplaces
Places of worship
Other
Employment trends – unpaid volunteers summary (2013 to 2014)
% down % up
% up
2013 to 2014
Free
Paid
-4
-7
-3
-4
-5
-4
-5
-3
-1
-3
-4
-5
0
-5
-4
% down
Under 20k visits
20k-50k visits
50k-200k visits
Over 200k visits
% down % up
18
19
26
31
85
85
% any volunteers
in 2014
% any volunteers
in 2014
84
86
85
83
% any
volunteers
in 2014 2013 to 2014
55
Base: All answering employment questions (1,338)
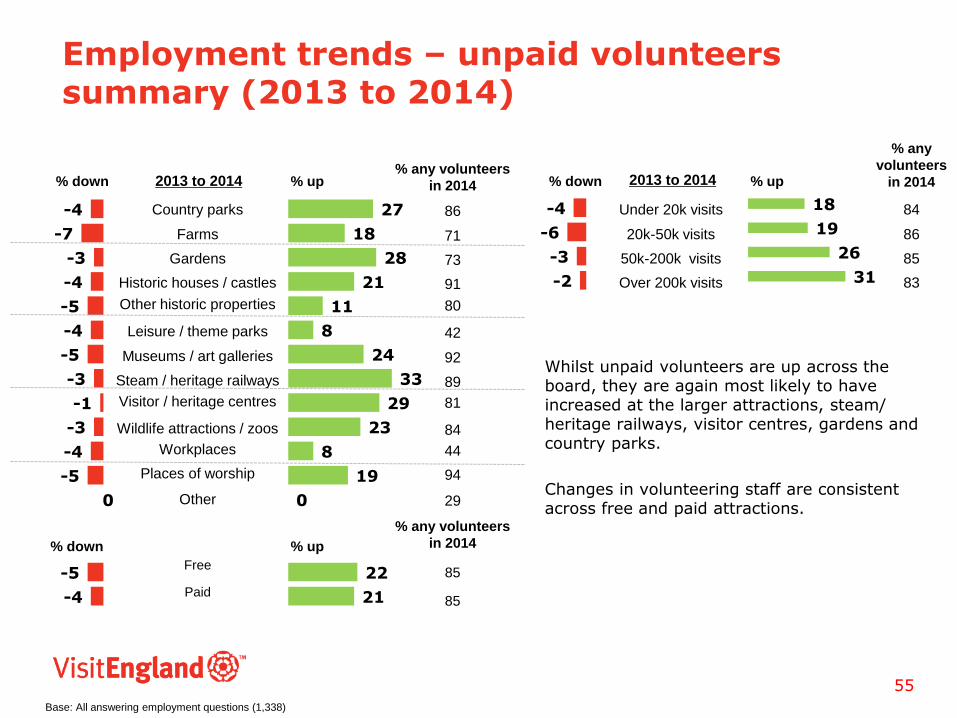
Whilst unpaid volunteers are up across the board, they are again most likely to have increased at the larger attractions, steam/ heritage railways, visitor centres, gardens and country parks.
Changes in volunteering staff are consistent across free and paid attractions.

27
26
19
47
44
8
22
22
28
21
0
14
4
21
33
-2
-2
-2
0
Country parks
Farms
Gardens
Historic houses / castles
Other historic properties
Leisure / theme parks
Museums / art galleries
Steam / heritage railways
Visitor / heritage centres
Wildlife attractions / zoos
Workplaces
Places of worship
Other
Employment trends – unpaid volunteers summary (2015 predictions)
% down % up
% up
2015 predictions
Free
Paid
0
0
0
-2
-2
-4
-2
0
-1
-1
-5
-3
0
-2
% down
Under 20k visits
20k-50k visits
50k-200k visits
Over 200k visits
% down % up
25
31
35
26
The trend towards unpaid volunteers is predicted to continue again in 2014, with all size and categories of site holding this intention.
Prediction for increases in unpaid volunteers is highest amongst historic properties.
2015 predictions
56 Base: All answering employment questions (1,327)

12
32
10
8
5
13
6
17
6
13
12
7
4
5
11
-5
-8
-5
-15
Under 20k visits
20k-50k visits
50k-200k visits
Over 200k visits
94
96
93
93
76
100
69
66
67
89
80
77
76
Country parks
Farms
Gardens
Historic houses / castles
Other historic properties
Leisure / theme parks
Museums / art galleries
Steam / heritage railways
Visitor / heritage centres
Wildlife attractions / zoos
Workplaces
Places of worship
Other
Employment trends – full time permanent employees summary (2013-2014)
% down % up
% up
2013 to 2014
Free
Paid
-15
-12
-11
-4
-4
-4
-8
-3
-4
-9
-4
0
-8
-7
-7
% down
% down % up
4
9
14
16
72
86
% any FT
perm in 2014
61
93
99
99
Although there are more attractions increasing than decreasing full-time permanent staff overall, this masks some differences by type of attraction.
In 2012-13 more farms reduced than increased their full time permanent staff count; in 2013-14 this trend was reversed with almost a third of farm attractions boosting FT permanent staff and only 12% reducing staff. However, Museums and art galleries, country parks and gardens continued to reduce these members of staff in 2014.
Full time permanent staff are declining at free attractions, but numbers have increased in the charging attractions category.
There is a fairly balanced pattern by attraction size with roughly as many attractions increasing full time permanent staff as decreasing in 2014; the exception to this is larger mid size attractions with 50-200,000 staff.
% any FT
perm in 2014
% any FT
perm in 2014 2013 to 2014
57 Base: All answering employment questions (1,272)

4
14
10
8
8
32
5
17
11
13
8
4
12
5
10
5
7
10
11
Under 20k visits
20k-50k visits
50k-200k visits
Over 200k visits
Country parks
Farms
Gardens
Historic houses / castles
Other historic properties
Leisure / theme parks
Museums / art galleries
Steam / heritage railways
Visitor / heritage centres
Wildlife attractions / zoos
Workplaces
Places of worship
Other
Employment trends – full time permanent employees summary (2015 predictions)
% down % up
% up
2015 predictions
Free
Paid
-17
-7
-4
-3
0
-4
-6
0
-3
-1
0
-4
-4
-8
-2
% down
% down % up
5
7
11
14
2015 predictions
Large, charging attractions (with over 200,000 visitors) are the most likely to be anticipating increases in permanent full time staff in 2015.
There is substantial variation between categories in their plans for permanent full time staffing in 2015. Country parks, and museums & art galleries are anticipating cuts in staffing. Most other categories, in particular leisure/ theme parks and steam/ heritage railways, are expecting to take on additional full time permanent staff.
58 Base: All answering employment questions

Attracting visitors to the area
Attracting visitors to the area
The past couple of years have see a question added to the Visits to Visitor Attractions survey to try to tease out the ‘pull’ of attractions to an area. ‘Thinking just about your visitors who are staying away from home in the area, what percentage of these visitors would you estimate decided to visit the area mainly because of your attraction?‘ These results are unaudited, and we don’t know what sites based this information on – whether it is data from other surveys they run, or simply ‘gut feel’.
61
17
37
14
10
15
7
None
1-5%
6-10%
11-20%
21-50%
Over 50%
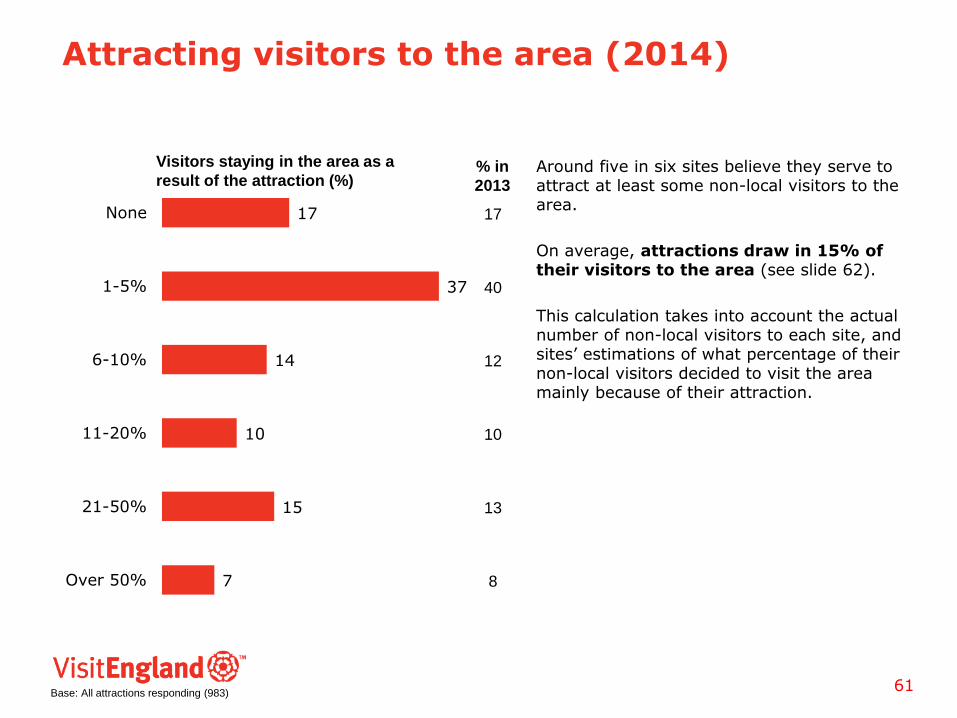
Attracting visitors to the area (2014)
Around five in six sites believe they serve to attract at least some non-local visitors to the area.
On average, attractions draw in 15% of their visitors to the area (see slide 62).
This calculation takes into account the actual number of non-local visitors to each site, and sites’ estimations of what percentage of their non-local visitors decided to visit the area mainly because of their attraction.
Base: All attractions responding (983)
Visitors staying in the area as a
result of the attraction (%)
17
40
12
10
13
8
% in
2013

62
15
12
11
13
17
15
21
13
17
21
14
20
21
31
ALL
Country parks
Farms
Gardens
Historic houses / castles
Other historic properties
Leisure / theme parks
Museums / art galleries
Steam / heritage railways
Visitor / heritage centres
Wildlife attractions / zoos
Workplaces
Places of worship
Other
Attracting visitors to the area – by attraction type (2014)
Base: All attractions responding (983)
Visitors staying in the area as a
result of the attraction (average 15%)
Visitor/ heritage centres, leisure/ theme parks, places of worship and workplaces seemingly have the biggest draw, with around a fifth of visitors thought to be visiting the area in order to experience these attractions.
Farms and country parks are more likely to be secondary places to visit once you are already in the area.
63
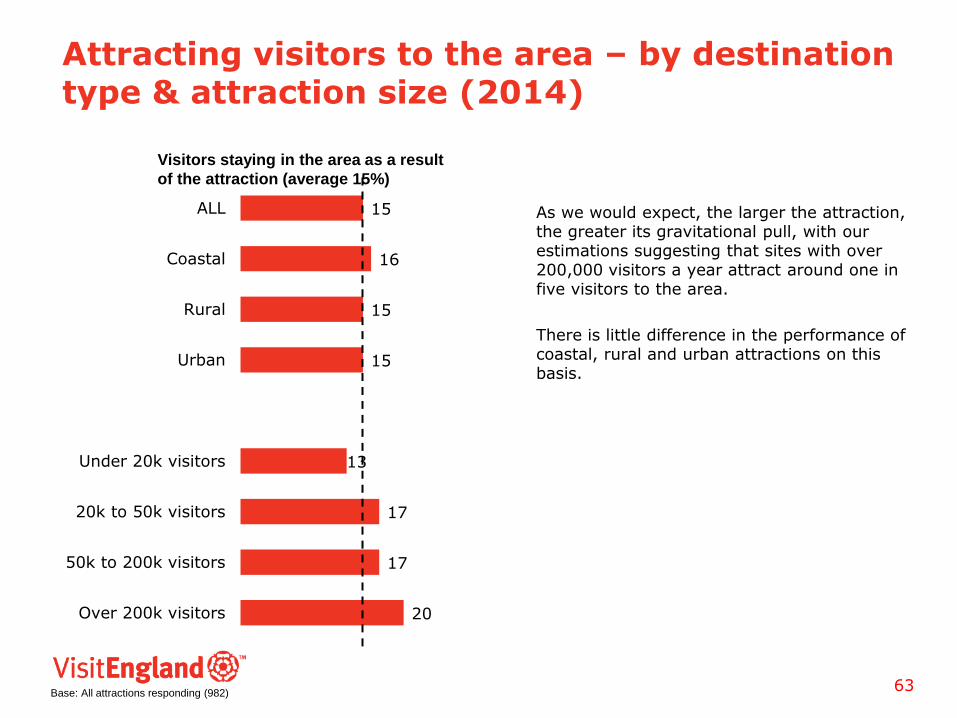
15
16
15
15
13
17
17
20
ALL
Coastal
Rural
Urban
Under 20k visitors
20k to 50k visitors
50k to 200k visitors
Over 200k visitors
Attracting visitors to the area – by destination type & attraction size (2014)
As we would expect, the larger the attraction, the greater its gravitational pull, with our estimations suggesting that sites with over 200,000 visitors a year attract around one in five visitors to the area.
There is little difference in the performance of coastal, rural and urban attractions on this basis.
Base: All attractions responding (982)
Visitors staying in the area as a result
of the attraction (average 15%)

64
Questionnaire