visteon q4 and full-year 2016 earnings
TRANSCRIPT
Visteon Confidential
Visteon Q4 and Full-Year 2016 EarningsFebruary 23, 2017
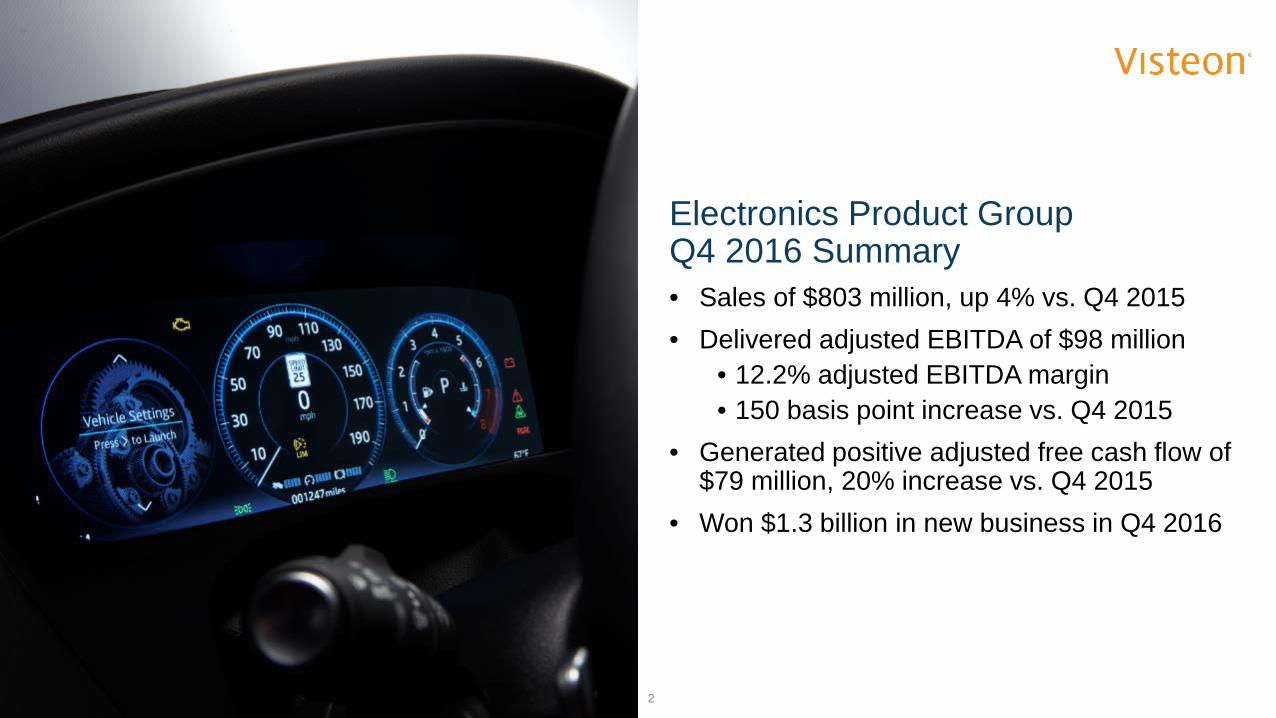
Electronics Product Group Q4 2016 Summary• Sales of $803 million, up 4% vs. Q4 2015• Delivered adjusted EBITDA of $98 million
• 12.2% adjusted EBITDA margin• 150 basis point increase vs. Q4 2015
• Generated positive adjusted free cash flow of $79 million, 20% increase vs. Q4 2015
• Won $1.3 billion in new business in Q4 2016
2
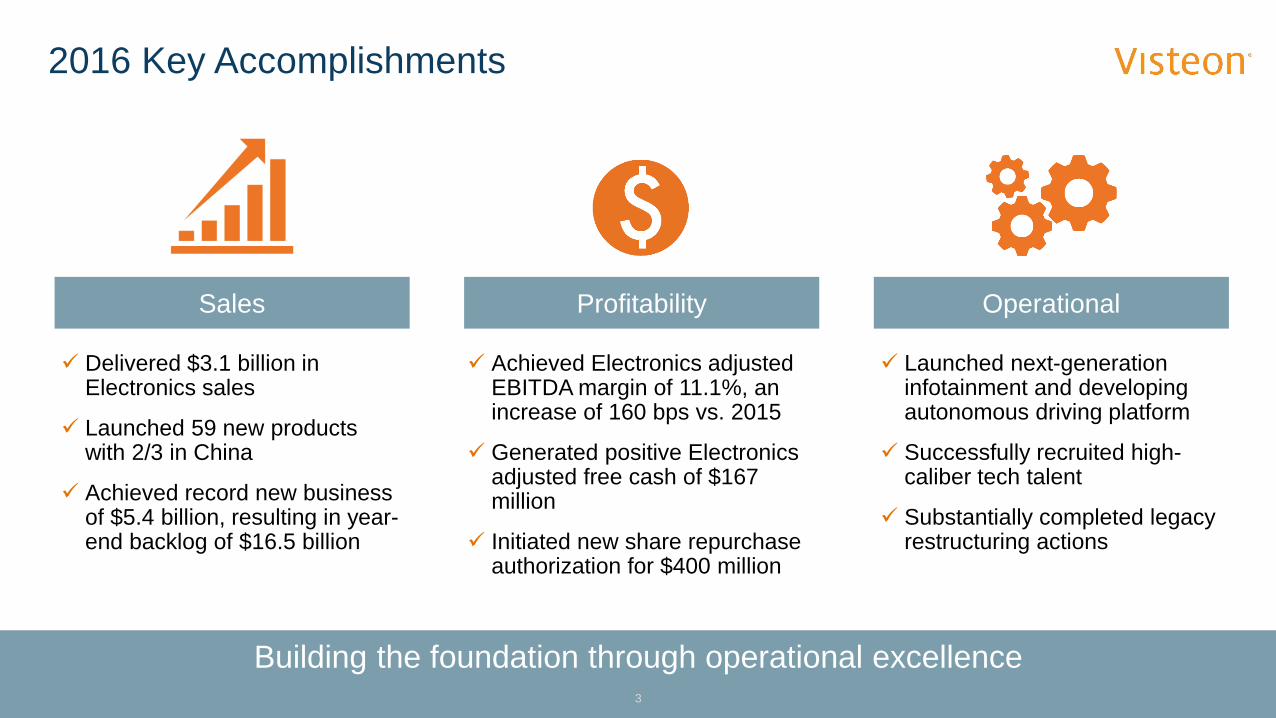
2016 Key Accomplishments
Building the foundation through operational excellence3
Delivered $3.1 billion in Electronics sales
Launched 59 new products with 2/3 in China
Achieved record new business of $5.4 billion, resulting in year-end backlog of $16.5 billion
Achieved Electronics adjusted EBITDA margin of 11.1%, an increase of 160 bps vs. 2015
Generated positive Electronics adjusted free cash of $167 million
Initiated new share repurchase authorization for $400 million
Launched next-generation infotainment and developing autonomous driving platform
Successfully recruited high-caliber tech talent
Substantially completed legacy restructuring actions
Sales Profitability Operational
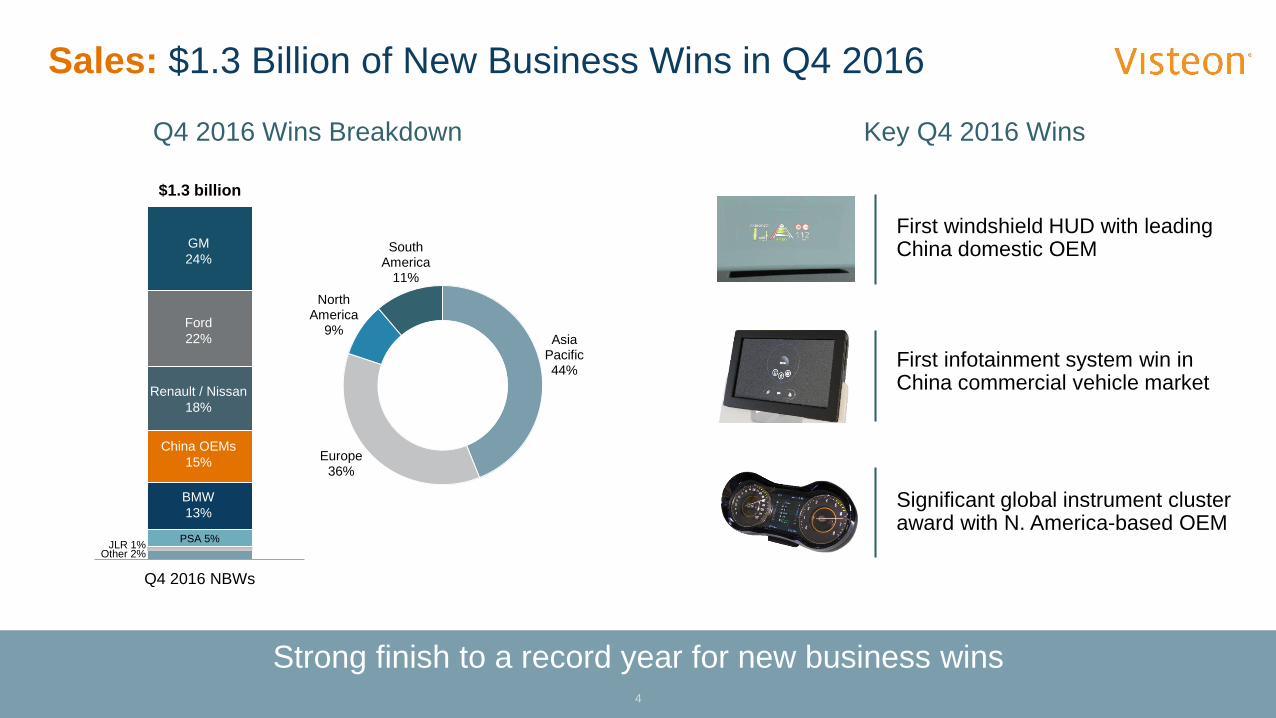
Sales: $1.3 Billion of New Business Wins in Q4 2016
Strong finish to a record year for new business wins
Key Q4 2016 Wins
4
First windshield HUD with leading China domestic OEM
Q4 2016 Wins Breakdown
Significant global instrument cluster award with N. America-based OEM
First infotainment system win in China commercial vehicle market
Asia Pacific44%
Europe36%
North America
9%
SouthAmerica
11%
Q4 2016 NBWs
GM24%
Ford22%
Renault / Nissan18%
China OEMs15%
BMW13%
PSA 5%JLR 1%Other 2%
$1.3 billion
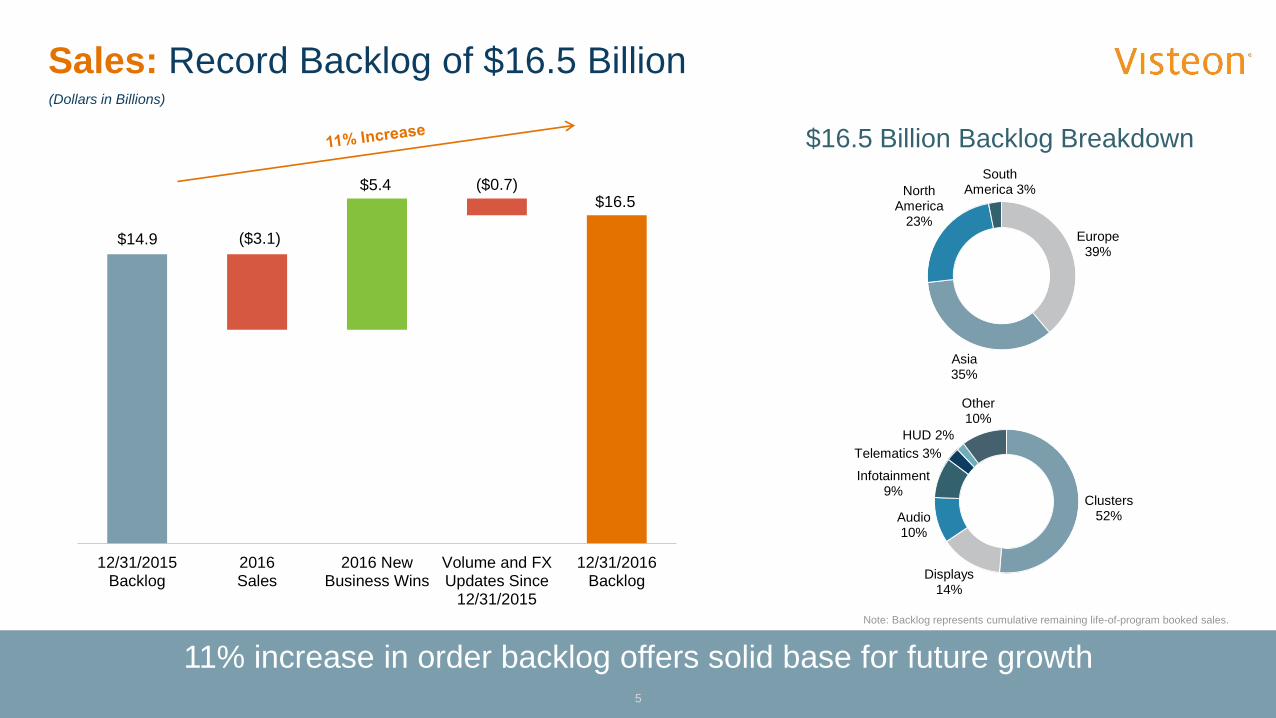
Sales: Record Backlog of $16.5 Billion
11% increase in order backlog offers solid base for future growth
(Dollars in Billions)
$16.5 Billion Backlog Breakdown
Note: Backlog represents cumulative remaining life-of-program booked sales.
5
$14.9
$16.5
($3.1)
$5.4 ($0.7)
12/31/2015Backlog
2016Sales
2016 NewBusiness Wins
Volume and FXUpdates Since
12/31/2015
12/31/2016Backlog
Clusters52%
Displays14%
Audio10%
Infotainment9%
Telematics 3%HUD 2%
Other10%
Europe39%
Asia35%
North America
23%
South America 3%
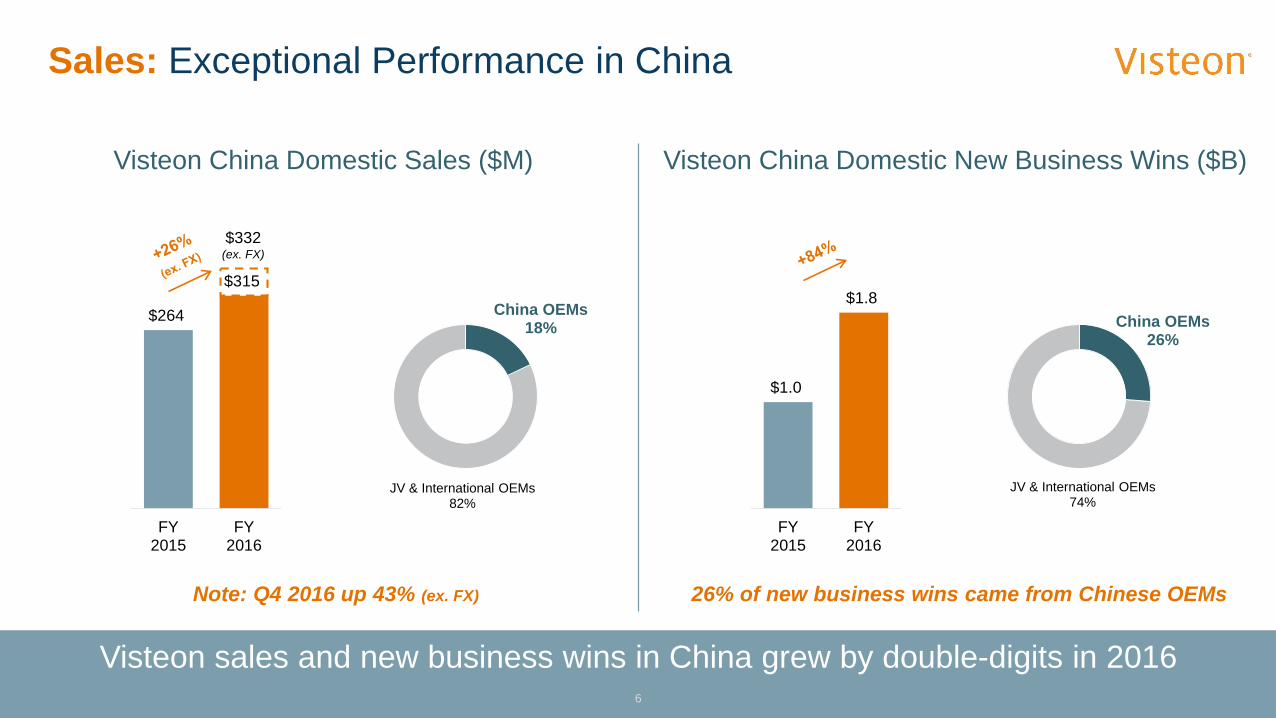
Sales: Exceptional Performance in China
Visteon sales and new business wins in China grew by double-digits in 2016
Visteon China Domestic New Business Wins ($B)
6
JV & International OEMs82%
China OEMs18%
JV & International OEMs74%
China OEMs26%
Visteon China Domestic Sales ($M)
$1.0
$1.8
FY2015
FY2016
Note: Q4 2016 up 43% (ex. FX)
$264
$315
FY2015
FY2016
$332(ex. FX)
26% of new business wins came from Chinese OEMs
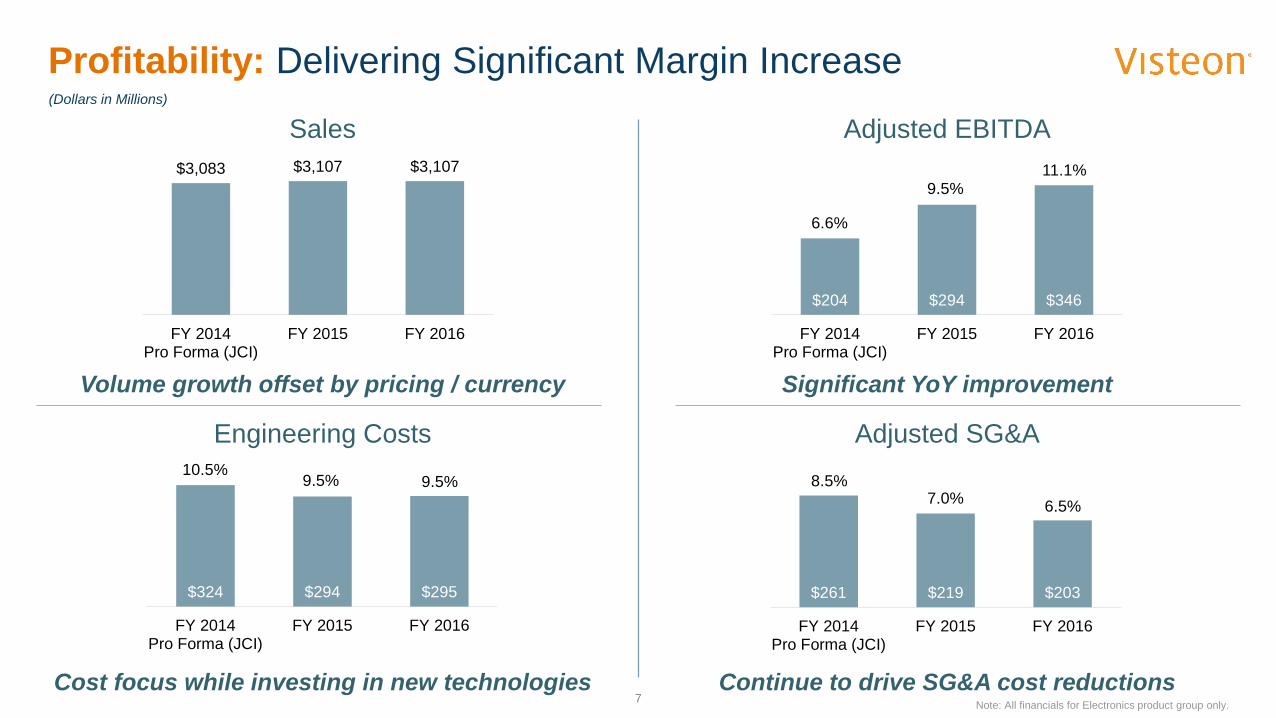
Profitability: Delivering Significant Margin Increase
7
Sales Adjusted EBITDA
Engineering Costs Adjusted SG&A
$204 $294 $346
FY 2014Pro Forma (JCI)
FY 2015 FY 2016
$261 $219 $203
FY 2014Pro Forma (JCI)
FY 2015 FY 2016
$324 $294 $295
FY 2014Pro Forma (JCI)
FY 2015 FY 2016
6.6%
9.5%11.1%
10.5%9.5% 9.5%
7.0% 6.5%8.5%
Volume growth offset by pricing / currency Significant YoY improvement
Continue to drive SG&A cost reductionsCost focus while investing in new technologiesNote: All financials for Electronics product group only.
(Dollars in Millions)
$3,083 $3,107 $3,107
FY 2014Pro Forma (JCI)
FY 2015 FY 2016
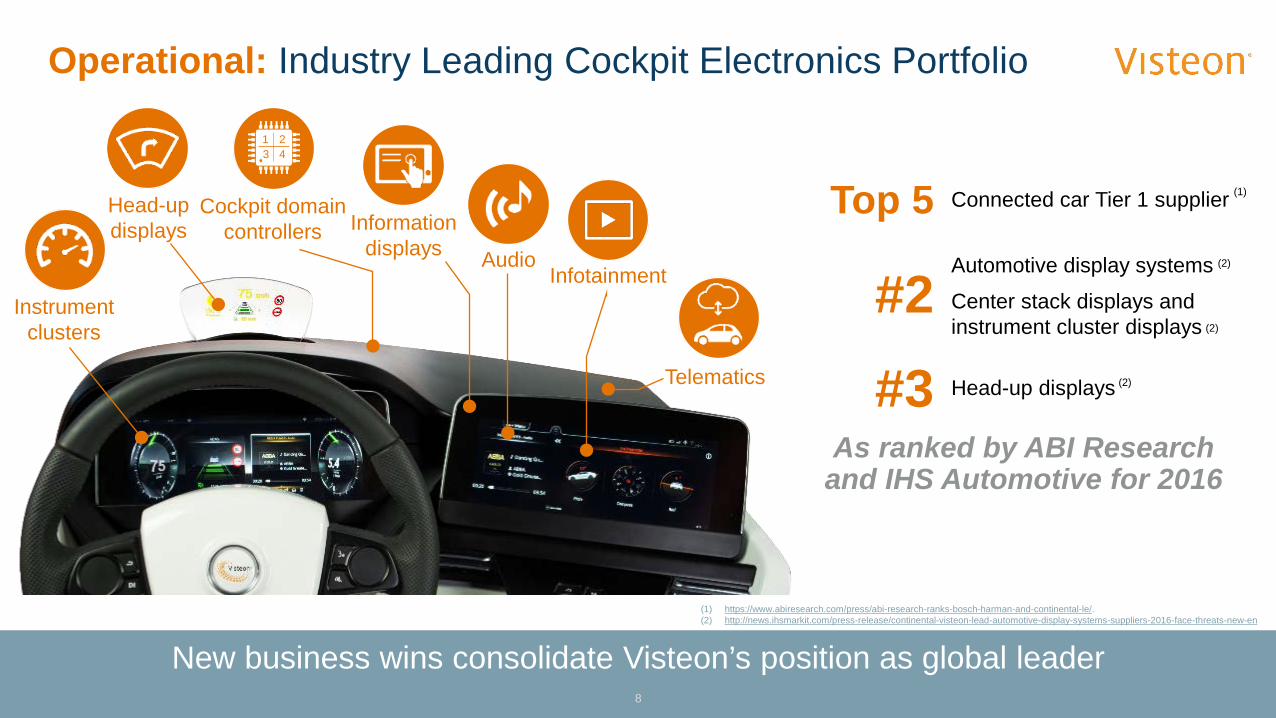
Operational: Industry Leading Cockpit Electronics Portfolio
8
New business wins consolidate Visteon’s position as global leader
Instrumentclusters
Head-updisplays Information
displaysInfotainment
Audio
Telematics
(1) https://www.abiresearch.com/press/abi-research-ranks-bosch-harman-and-continental-le/.(2) http://news.ihsmarkit.com/press-release/continental-visteon-lead-automotive-display-systems-suppliers-2016-face-threats-new-en
#2Automotive display systems
Center stack displays and instrument cluster displays
#3 Head-up displays
Top 5 Connected car Tier 1 supplier
(2)
(2)
(1)
(2)
As ranked by ABI Research and IHS Automotive for 2016
Cockpit domaincontrollers
1 23 4
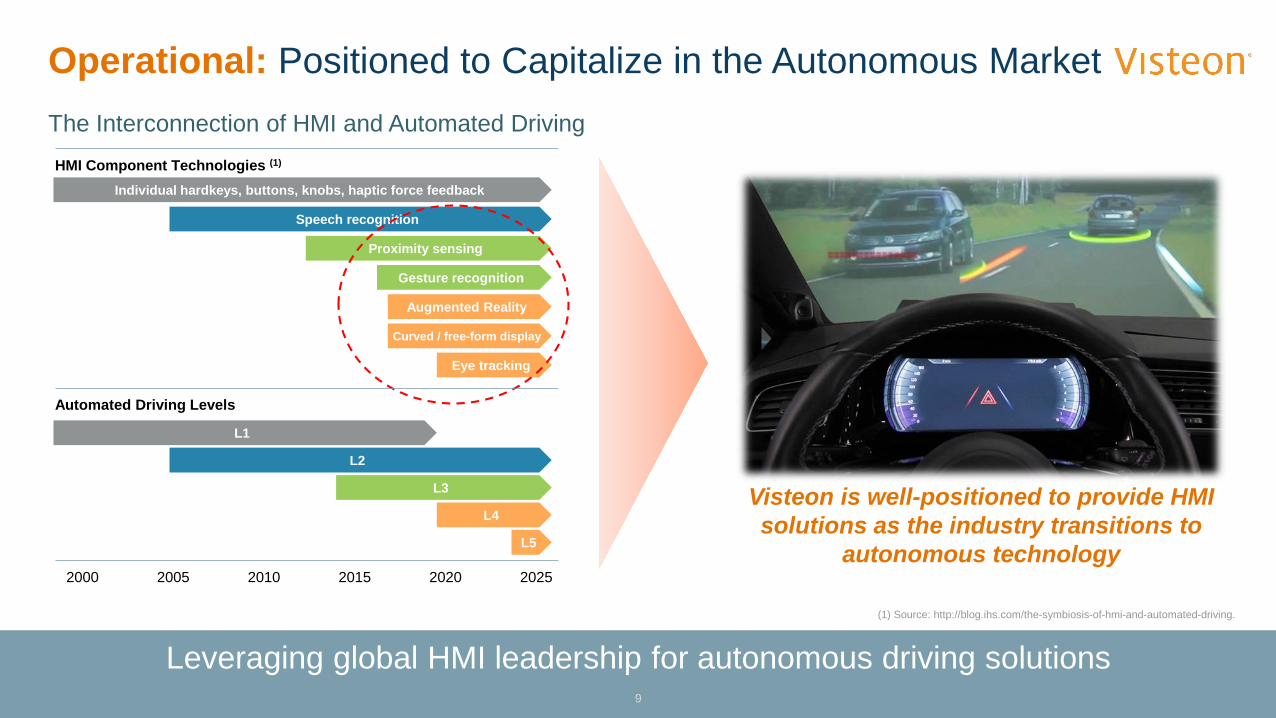
Operational: Positioned to Capitalize in the Autonomous Market
9
Leveraging global HMI leadership for autonomous driving solutions
Visteon is well-positioned to provide HMI solutions as the industry transitions to
autonomous technology
Individual hardkeys, buttons, knobs, haptic force feedback
Speech recognition
Proximity sensing
Gesture recognition
Augmented Reality
Curved / free-form display
Eye tracking
L1
L2
L3
L4
L5
The Interconnection of HMI and Automated Driving
2000 2005 2010 2015 2020 2025
HMI Component Technologies (1)
Automated Driving Levels
(1) Source: http://blog.ihs.com/the-symbiosis-of-hmi-and-automated-driving.
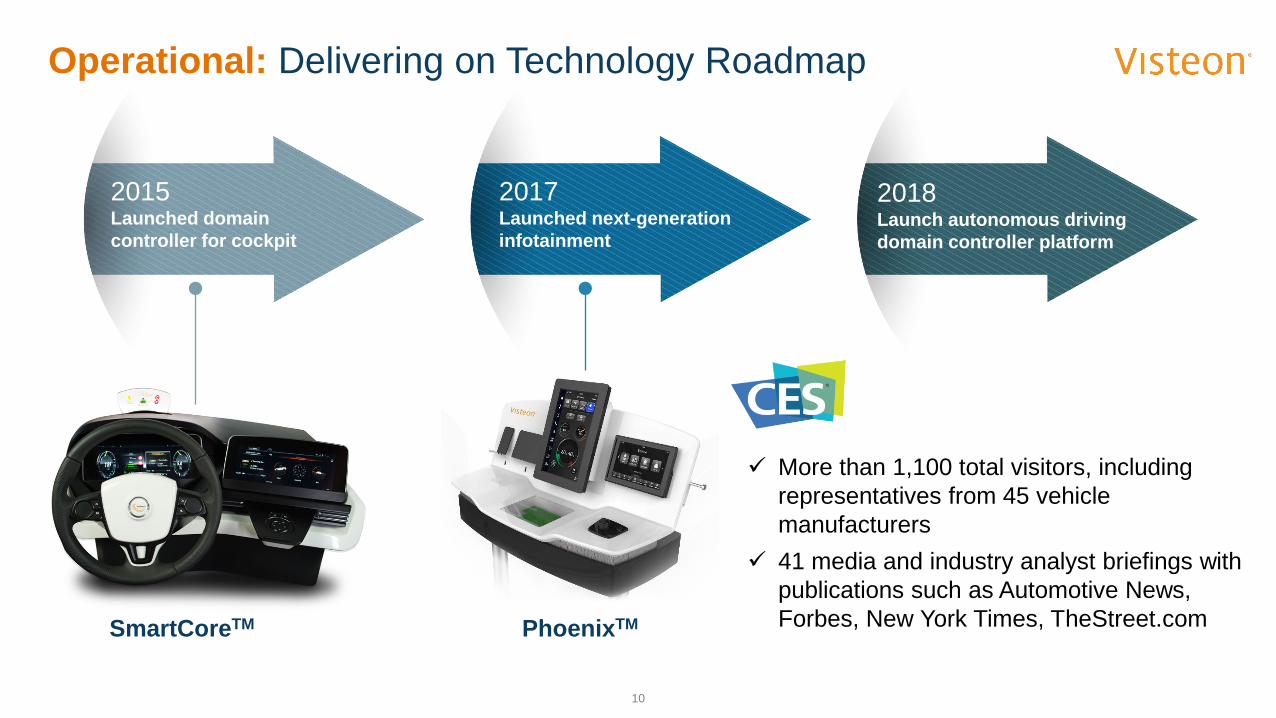
Operational: Delivering on Technology Roadmap
10
2015Launched domain controller for cockpit
2017Launched next-generation infotainment
2018Launch autonomous driving domain controller platform
More than 1,100 total visitors, including representatives from 45 vehicle manufacturers
41 media and industry analyst briefings with publications such as Automotive News, Forbes, New York Times, TheStreet.comSmartCoreTM PhoenixTM
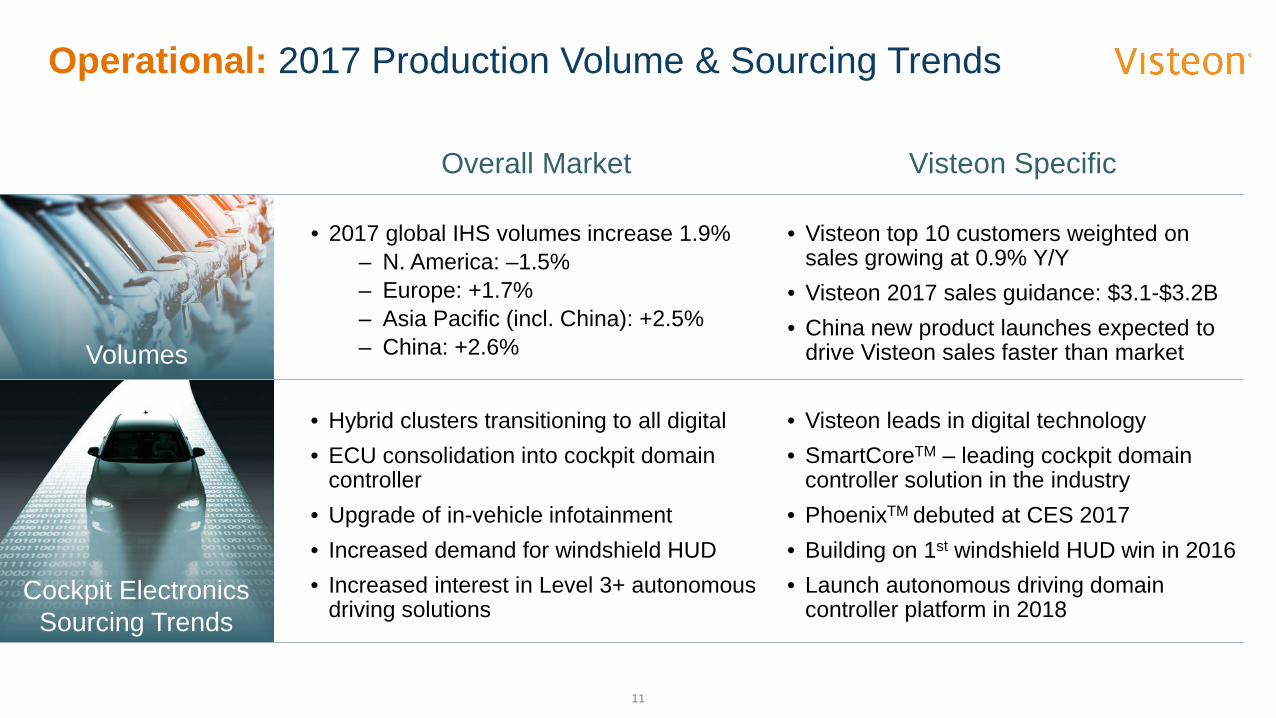
Operational: 2017 Production Volume & Sourcing Trends
11
Overall Market
• 2017 global IHS volumes increase 1.9%– N. America: –1.5%– Europe: +1.7%– Asia Pacific (incl. China): +2.5%– China: +2.6%
• Visteon top 10 customers weighted on sales growing at 0.9% Y/Y
• Visteon 2017 sales guidance: $3.1-$3.2B• China new product launches expected to
drive Visteon sales faster than market
Visteon Specific
• Hybrid clusters transitioning to all digital• ECU consolidation into cockpit domain
controller• Upgrade of in-vehicle infotainment• Increased demand for windshield HUD• Increased interest in Level 3+ autonomous
driving solutions
• Visteon leads in digital technology• SmartCoreTM – leading cockpit domain
controller solution in the industry• PhoenixTM debuted at CES 2017• Building on 1st windshield HUD win in 2016• Launch autonomous driving domain
controller platform in 2018
Volumes
Cockpit Electronics Sourcing Trends
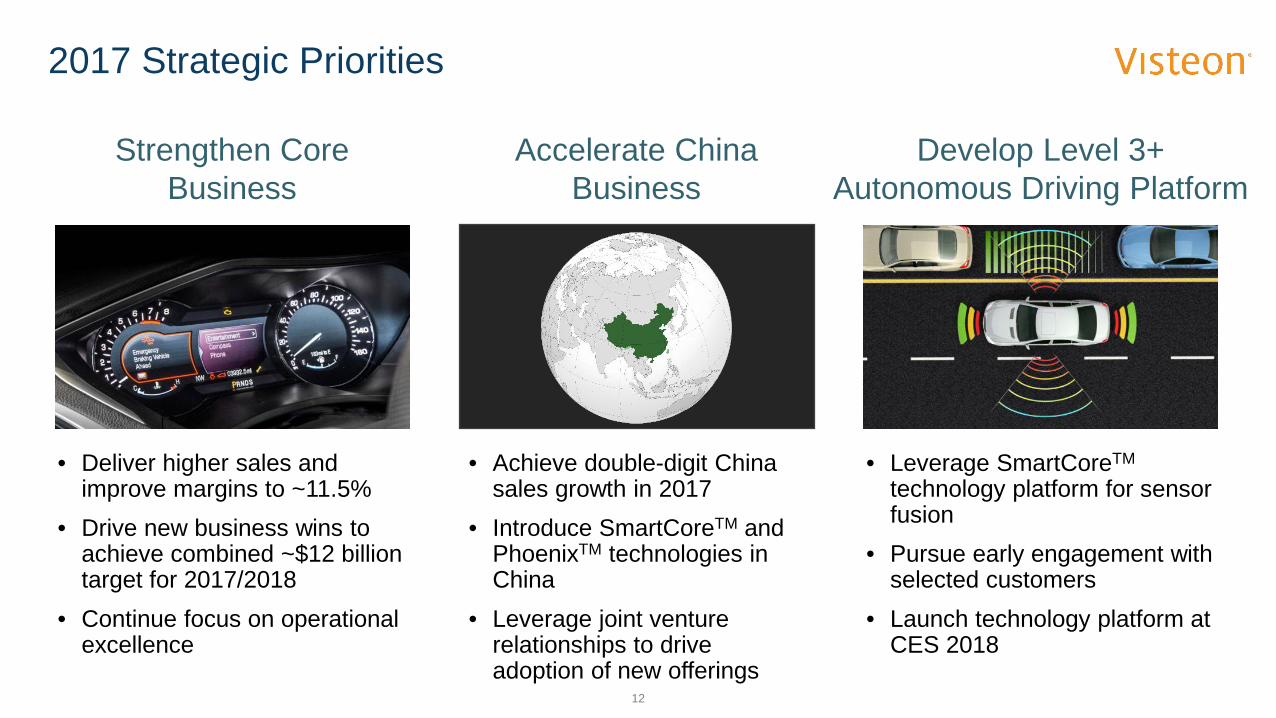
2017 Strategic Priorities
12
Strengthen CoreBusiness
Develop Level 3+Autonomous Driving Platform
Accelerate China Business
• Deliver higher sales and improve margins to ~11.5%
• Drive new business wins to achieve combined ~$12 billion target for 2017/2018
• Continue focus on operational excellence
• Achieve double-digit China sales growth in 2017
• Introduce SmartCoreTM and PhoenixTM technologies in China
• Leverage joint venture relationships to drive adoption of new offerings
• Leverage SmartCoreTM
technology platform for sensor fusion
• Pursue early engagement with selected customers
• Launch technology platform at CES 2018

Q4 and Full-Year 2016 Financial ResultsFebruary 23, 2017
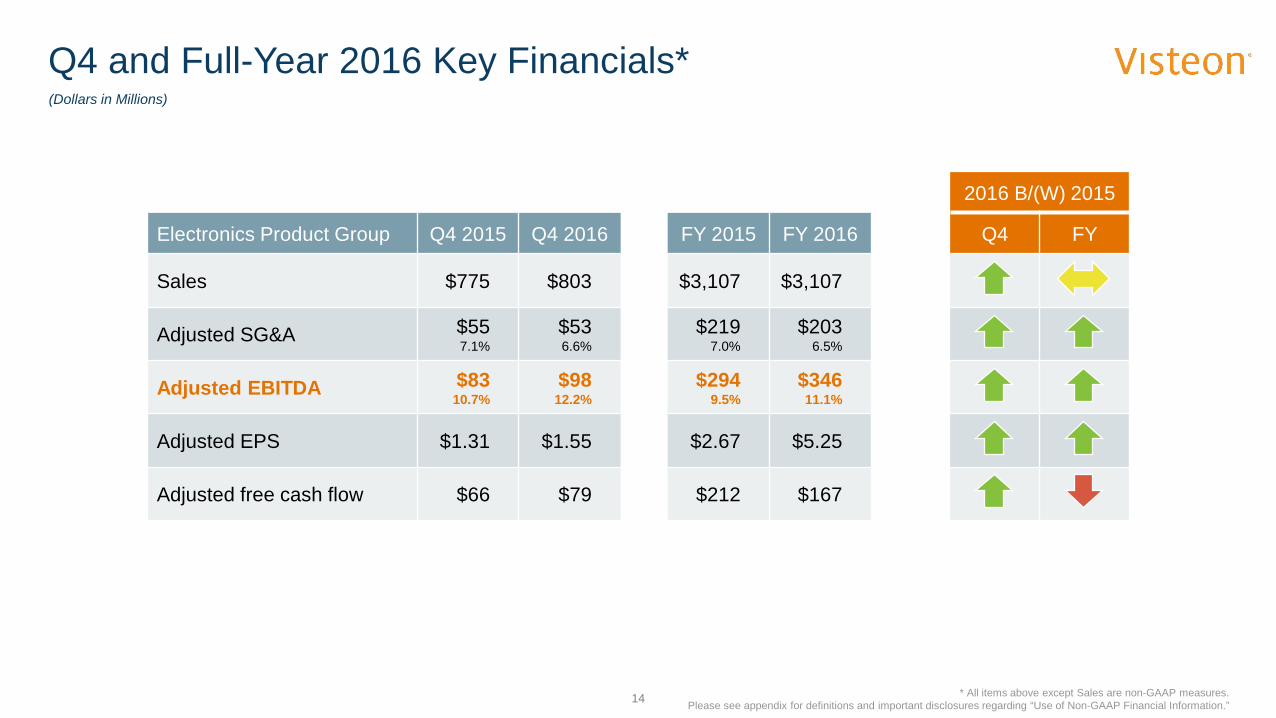
Q4 and Full-Year 2016 Key Financials*
2016 B/(W) 2015
Electronics Product Group Q4 2015 Q4 2016 FY 2015 FY 2016 Q4 FY
Sales $775 $803 $3,107 $3,107
Adjusted SG&A $557.1%
$536.6%
$2197.0%
$2036.5%
Adjusted EBITDA $8310.7%
$9812.2%
$2949.5%
$34611.1%
Adjusted EPS $1.31 $1.55 $2.67 $5.25
Adjusted free cash flow $66 $79 $212 $167
(Dollars in Millions)
14 * All items above except Sales are non-GAAP measures. Please see appendix for definitions and important disclosures regarding “Use of Non-GAAP Financial Information.”
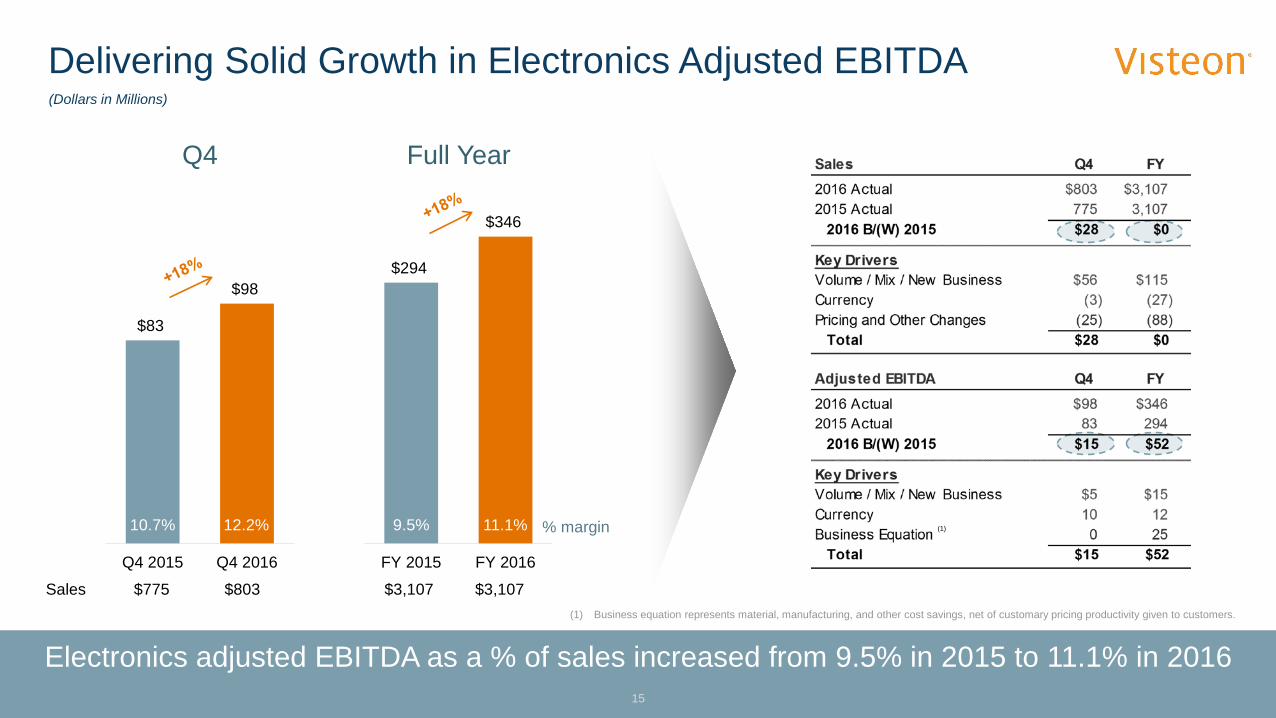
Delivering Solid Growth in Electronics Adjusted EBITDA
Electronics adjusted EBITDA as a % of sales increased from 9.5% in 2015 to 11.1% in 2016
(Dollars in Millions)
$294
$346
FY 2015 FY 2016
9.5% 11.1% % margin
Q4 Full Year
(1) Business equation represents material, manufacturing, and other cost savings, net of customary pricing productivity given to customers.
15
Sales $775 $803 $3,107 $3,107
$83
$98
Q4 2015 Q4 2016
10.7% 12.2% (1)
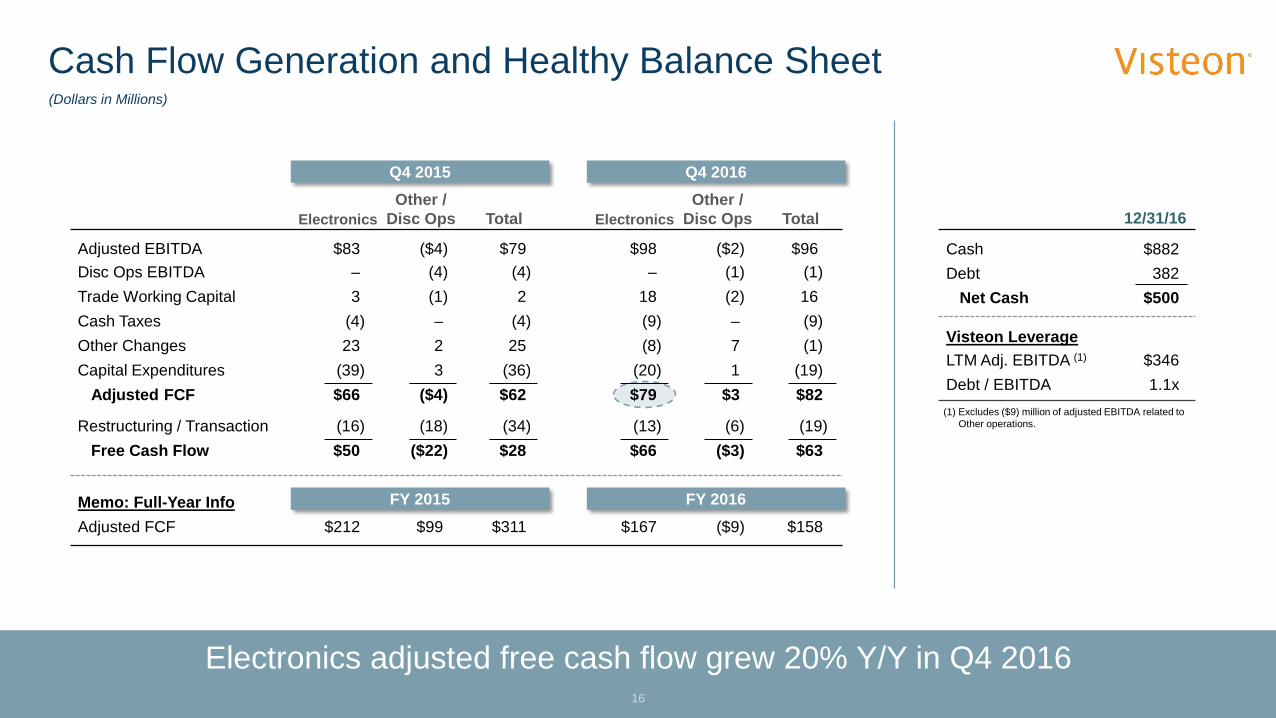
Cash Flow Generation and Healthy Balance Sheet
Electronics adjusted free cash flow grew 20% Y/Y in Q4 2016
12/31/16
Cash $882Debt 382
Net Cash $500
Visteon LeverageLTM Adj. EBITDA (1) $346Debt / EBITDA 1.1x(1) Excludes ($9) million of adjusted EBITDA related to
Other operations.
ElectronicsOther /
Disc Ops Total ElectronicsOther /
Disc Ops Total
Adjusted EBITDA $83 ($4) $79 $98 ($2) $96Disc Ops EBITDA – (4) (4) – (1) (1)Trade Working Capital 3 (1) 2 18 (2) 16Cash Taxes (4) – (4) (9) – (9)Other Changes 23 2 25 (8) 7 (1)Capital Expenditures (39) 3 (36) (20) 1 (19)
Adjusted FCF $66 ($4) $62 $79 $3 $82
Restructuring / Transaction (16) (18) (34) (13) (6) (19)Free Cash Flow $50 ($22) $28 $66 ($3) $63
Memo: Full-Year InfoAdjusted FCF $212 $99 $311 $167 ($9) $158
Q4 2015 Q4 2016
FY 2015 FY 2016
16
(Dollars in Millions)
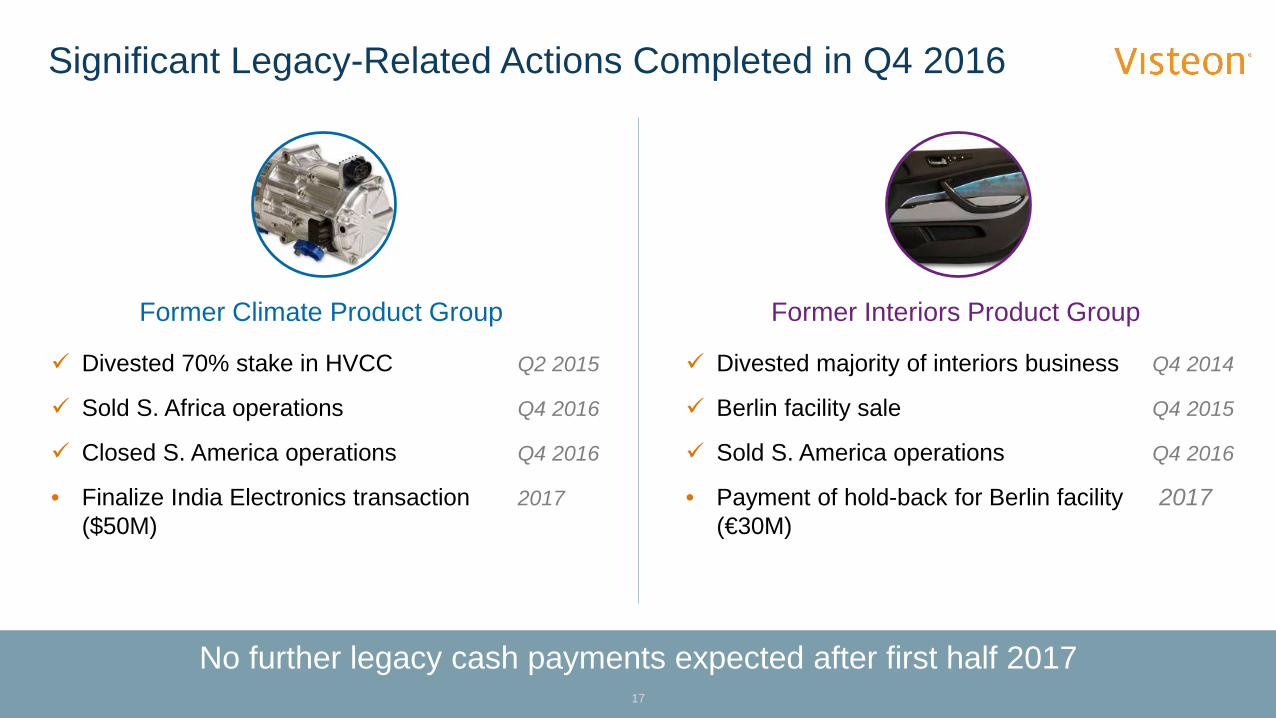
Significant Legacy-Related Actions Completed in Q4 2016
17
Divested majority of interiors business Q4 2014
Berlin facility sale Q4 2015
Sold S. America operations Q4 2016
• Payment of hold-back for Berlin facility 2017(€30M)
Divested 70% stake in HVCC Q2 2015
Sold S. Africa operations Q4 2016
Closed S. America operations Q4 2016
• Finalize India Electronics transaction 2017($50M)
Former Climate Product Group Former Interiors Product Group
No further legacy cash payments expected after first half 2017
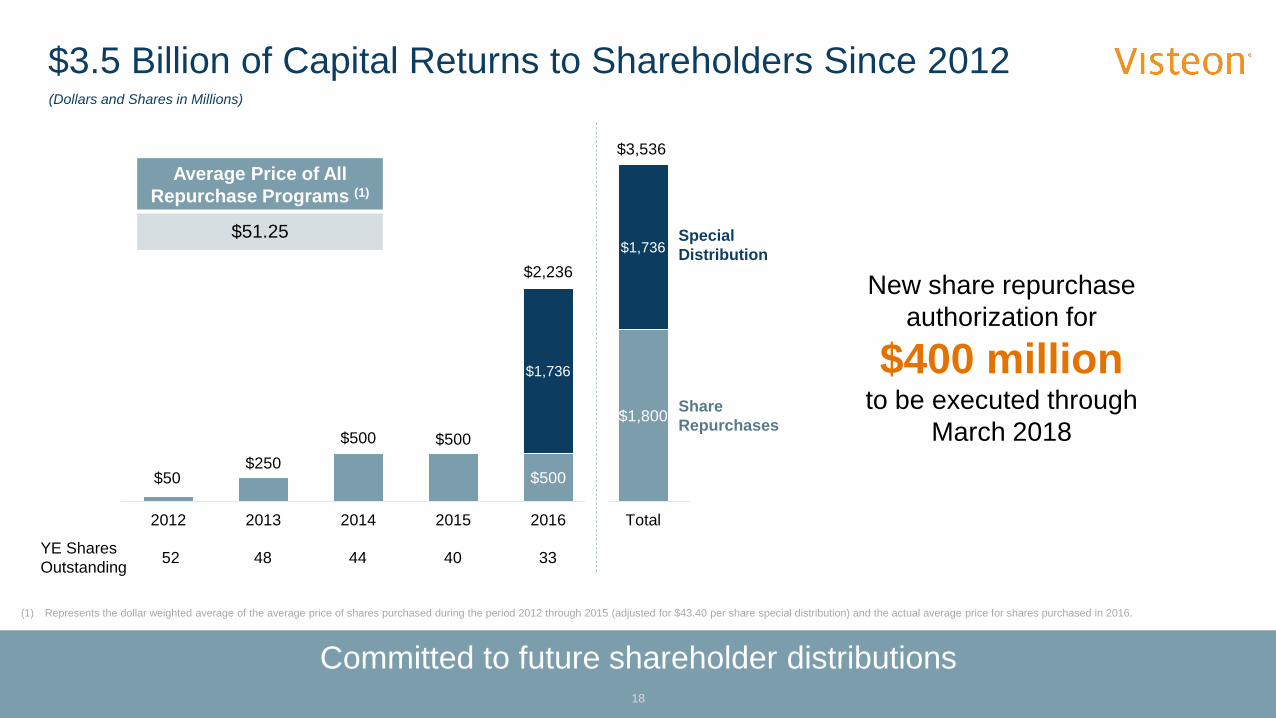
$3.5 Billion of Capital Returns to Shareholders Since 2012
18
(Dollars and Shares in Millions)
(1) Represents the dollar weighted average of the average price of shares purchased during the period 2012 through 2015 (adjusted for $43.40 per share special distribution) and the actual average price for shares purchased in 2016.
Average Price of All Repurchase Programs (1)
$51.25 Special Distribution
Share Repurchases
New share repurchase authorization for
$400 millionto be executed through
March 2018$50
$250 $500 $500
$500
$1,800
$1,736
$1,736
2012 2013 2014 2015 2016 Total
$2,236
$3,536
Committed to future shareholder distributions
YE Shares Outstanding 52 48 44 40 33
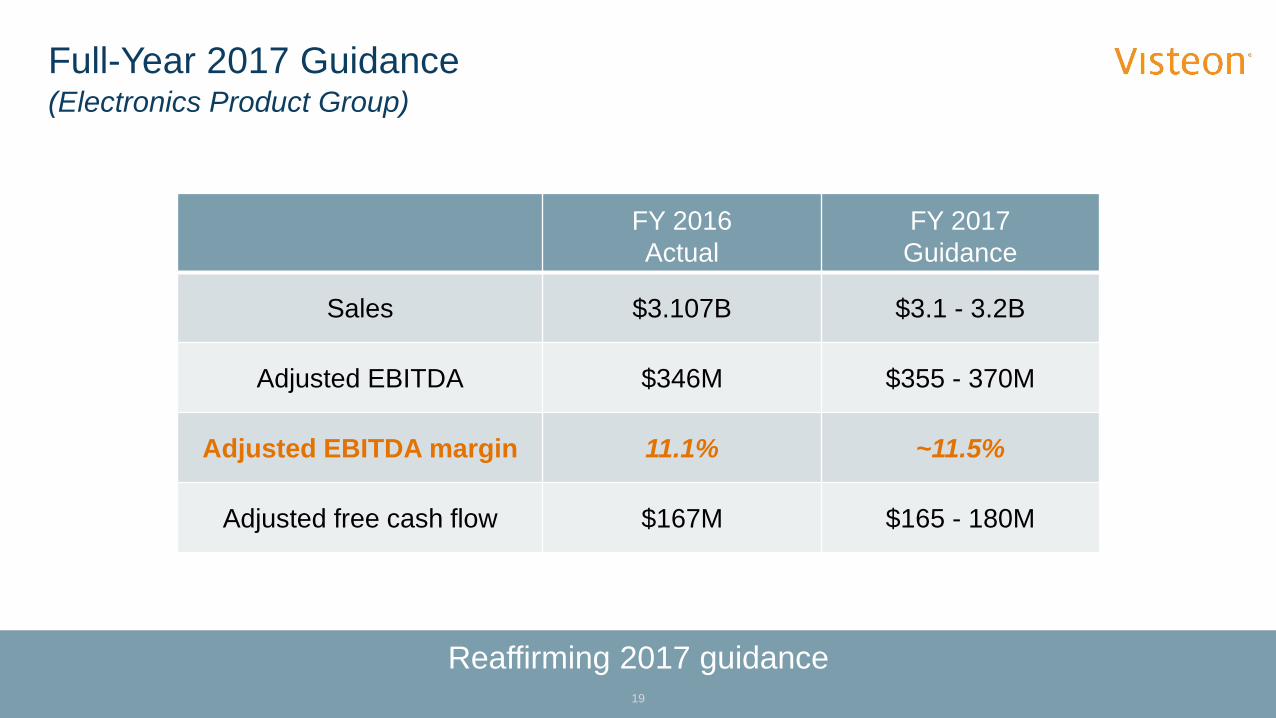
Full-Year 2017 Guidance
Reaffirming 2017 guidance19
(Electronics Product Group)
FY 2016Actual
FY 2017Guidance
Sales $3.107B $3.1 - 3.2B
Adjusted EBITDA $346M $355 - 370M
Adjusted EBITDA margin 11.1% ~11.5%
Adjusted free cash flow $167M $165 - 180M
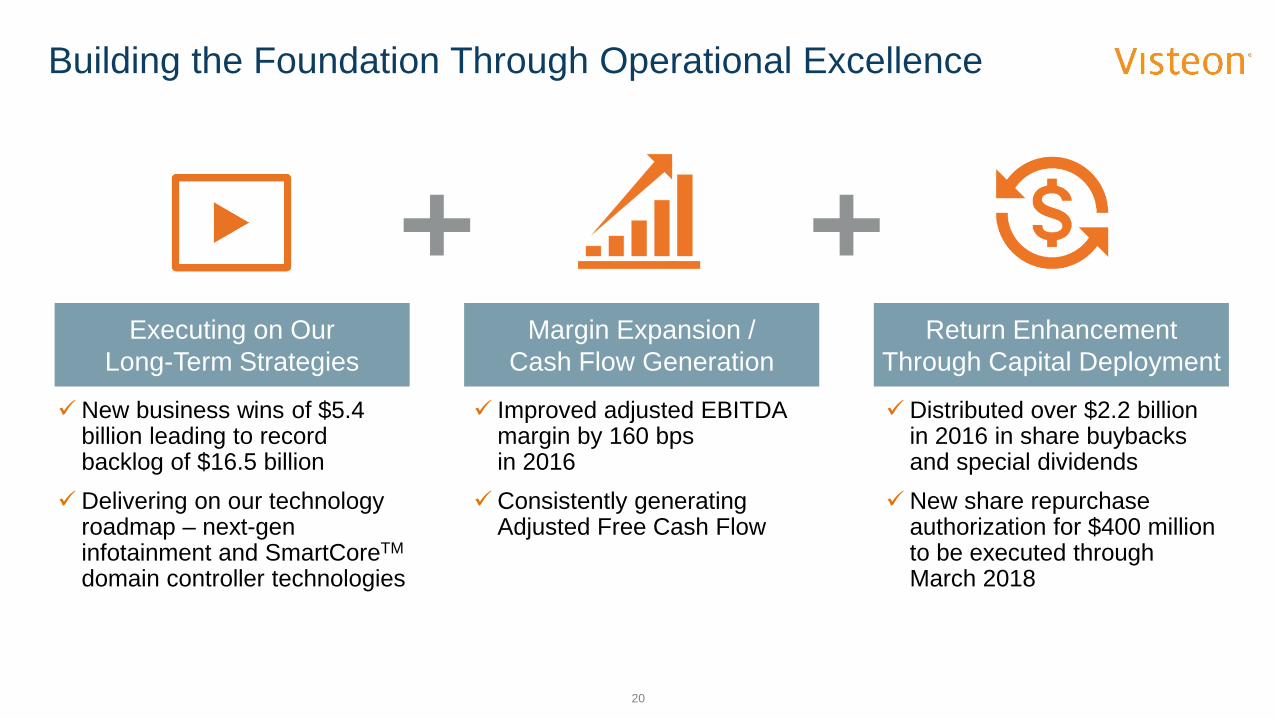
Building the Foundation Through Operational Excellence
20
Executing on Our Long-Term Strategies
Margin Expansion / Cash Flow Generation
Return Enhancement Through Capital Deployment
New business wins of $5.4 billion leading to record backlog of $16.5 billion
Delivering on our technology roadmap – next-gen infotainment and SmartCoreTM
domain controller technologies
Improved adjusted EBITDA margin by 160 bps in 2016
Consistently generating Adjusted Free Cash Flow
Distributed over $2.2 billion in 2016 in share buybacks and special dividends
New share repurchase authorization for $400 million to be executed through March 2018

AppendixFebruary 23, 2017
Forward-Looking Information
• This presentation contains "forward-looking statements" within the meaning of the Private Securities Litigation Reform Act of 1995. Forward-looking statements are not guarantees of future results and conditions but rather are subject to various factors, risks and uncertainties that could cause our actual results to differ materially from those expressed in these forward-looking statements, including, but not limited to:
• conditions within the automotive industry, including (i) the automotive vehicle production volumes and schedules of our customers, (ii) the financial condition of our customers and the effects of any restructuring or reorganization plans that may be undertaken by our customers, including work stoppages at our customers, and (iii) possible disruptions in the supply of commodities to us or our customers due to financial distress, work stoppages, natural disasters or civil unrest;
• our ability to execute on our transformational plans and cost-reduction initiatives in the amounts and on the timing contemplated;• our ability to satisfy future capital and liquidity requirements; including our ability to access the credit and capital markets at the times and
in the amounts needed and on terms acceptable to us; our ability to comply with financial and other covenants in our credit agreements; and the continuation of acceptable supplier payment terms;
• our ability to satisfy pension and other post-employment benefit obligations; • our ability to access funds generated by foreign subsidiaries and joint ventures on a timely and cost effective basis; • general economic conditions, including changes in interest rates and fuel prices; the timing and expenses related to internal
restructurings, employee reductions, acquisitions or dispositions and the effect of pension and other post-employment benefit obligations; • increases in raw material and energy costs and our ability to offset or recover these costs, increases in our warranty, product liability and
recall costs or the outcome of legal or regulatory proceedings to which we are or may become a party; and • those factors identified in our filings with the SEC (including our Annual Report on Form 10-K for the fiscal year ended December 31,
2016).
• Caution should be taken not to place undue reliance on our forward-looking statements, which represent our view only as of the date of this presentation, and which we assume no obligation to update. The financial results presented herein are preliminary and unaudited; final financial results will be included in the company's Annual Report on Form 10-K for the fiscal year ended December 31, 2016. New business wins, re-wins and backlog do not represent firm orders or firm commitments from customers, but are based on various assumptions, including the timing and duration of product launches, vehicle productions levels, customer price reductions and currency exchange rates.
22
Use of Non-GAAP Financial Information
• Because not all companies use identical calculations, adjusted gross margin, adjusted SG&A, adjusted EBITDA, adjusted net income, adjusted EPS, free cash flow and adjusted free cash flow used throughout this presentation may not be comparable to other similarly titled measures of other companies.
• In order to provide the forward-looking non-GAAP financial measures for full-year 2016, the Company is providing reconciliations to the most directly comparable GAAP financial measures on the subsequent slides. The provision of these comparable GAAP financial measures is not intended to indicate that the Company is explicitly or implicitly providing projections on those GAAP financial measures, and actual results for such measures are likely to vary from those presented. The reconciliations include all information reasonably available to the Company at the date of this presentation and the adjustments that management can reasonably predict.
23
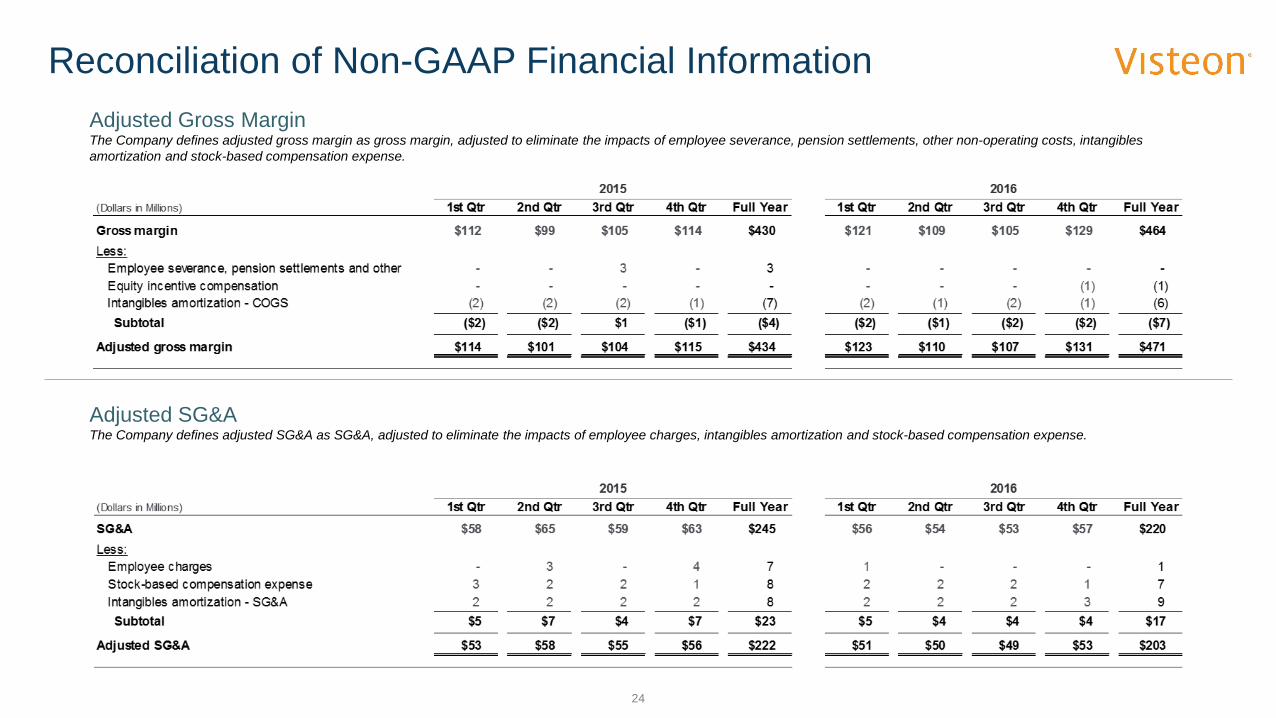
Reconciliation of Non-GAAP Financial InformationAdjusted Gross MarginThe Company defines adjusted gross margin as gross margin, adjusted to eliminate the impacts of employee severance, pension settlements, other non-operating costs, intangibles amortization and stock-based compensation expense.
Adjusted SG&AThe Company defines adjusted SG&A as SG&A, adjusted to eliminate the impacts of employee charges, intangibles amortization and stock-based compensation expense.
24
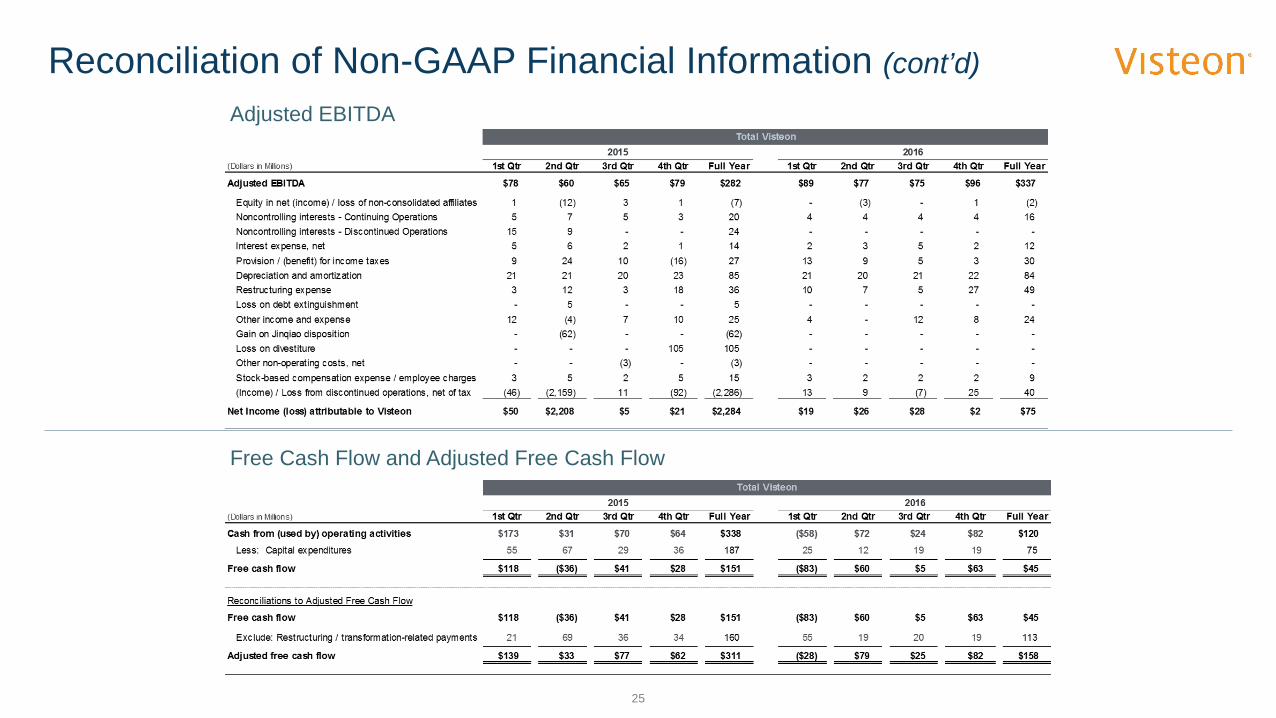
Reconciliation of Non-GAAP Financial Information (cont’d)Adjusted EBITDA
Free Cash Flow and Adjusted Free Cash Flow
25
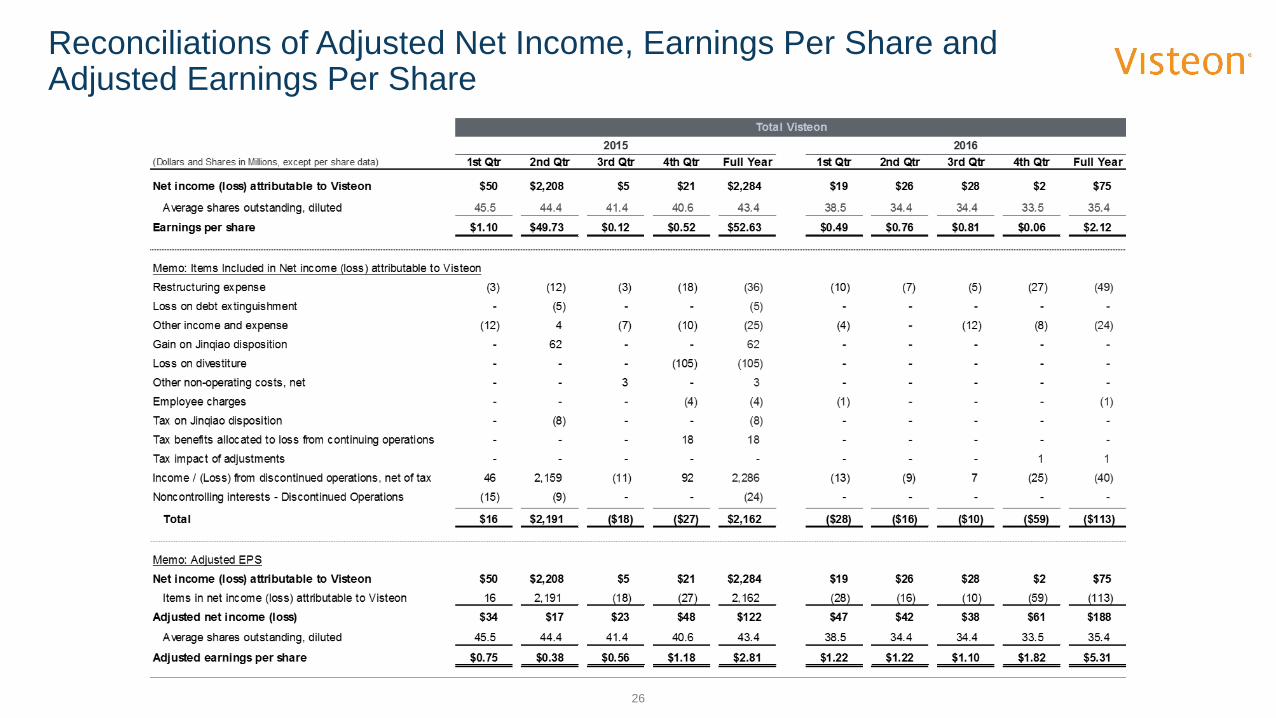
Reconciliations of Adjusted Net Income, Earnings Per Share and Adjusted Earnings Per Share
26
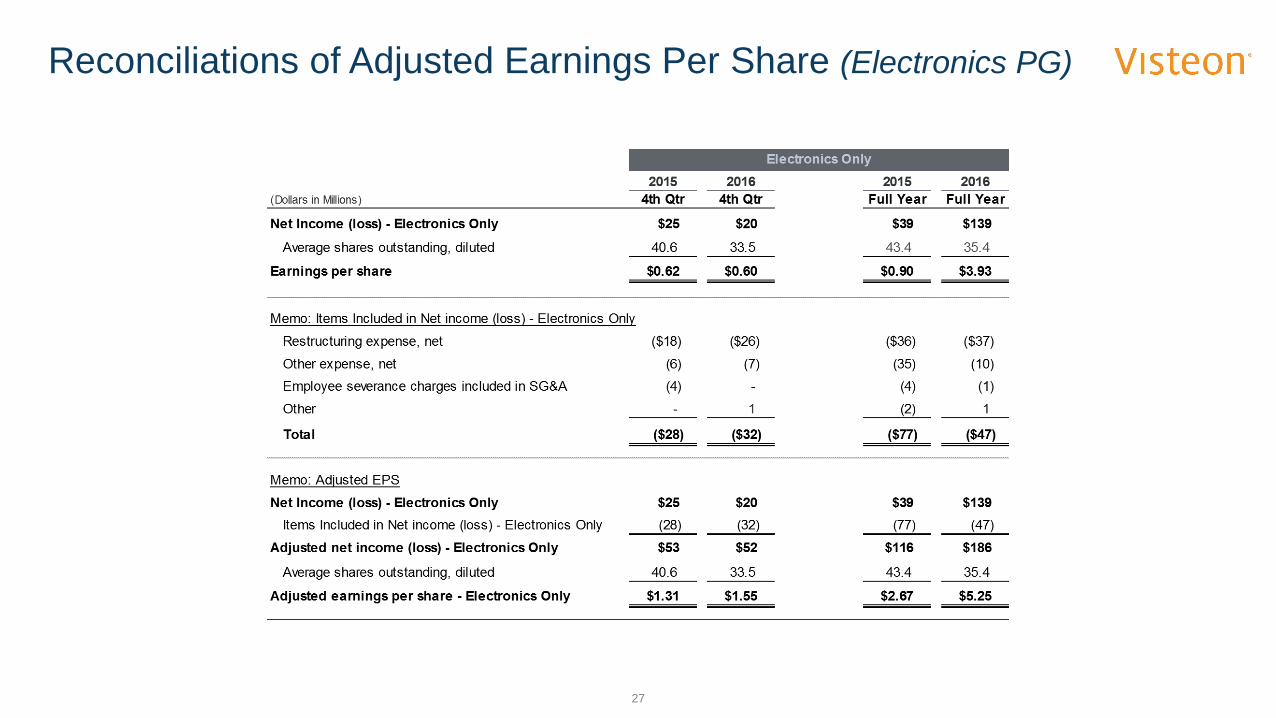
Reconciliations of Adjusted Earnings Per Share (Electronics PG)
27
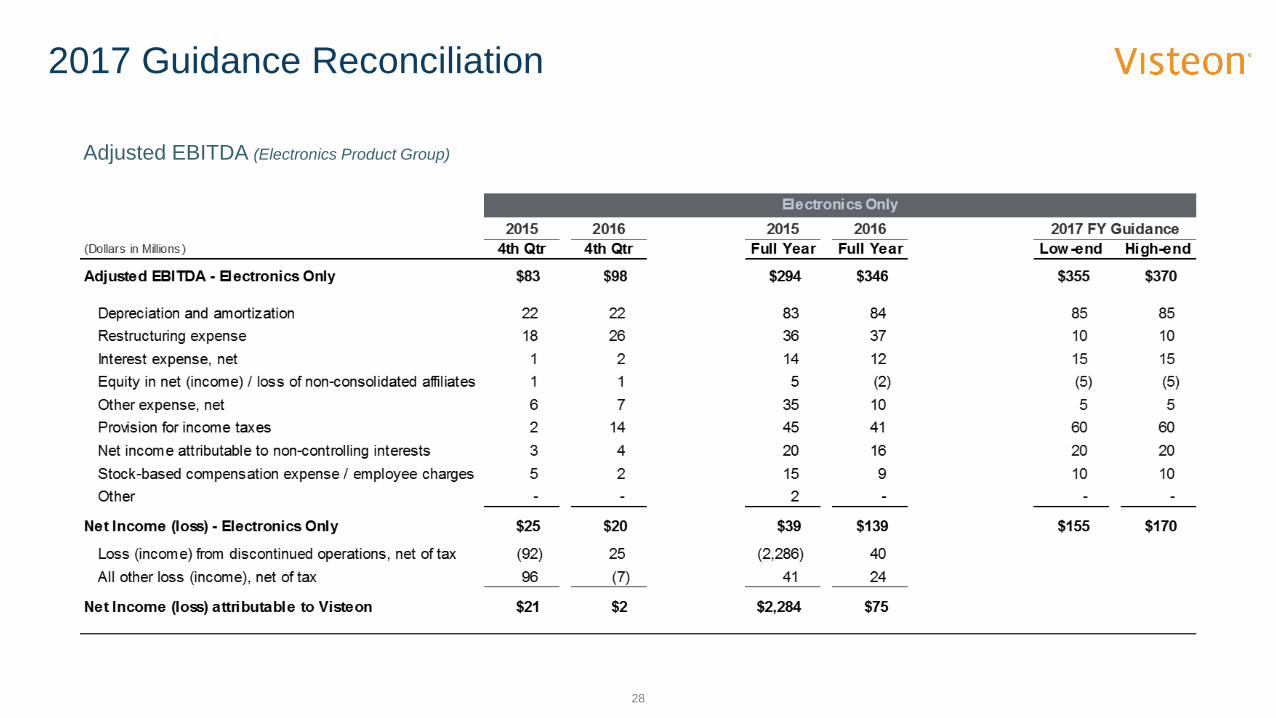
2017 Guidance Reconciliation
Adjusted EBITDA (Electronics Product Group)
28
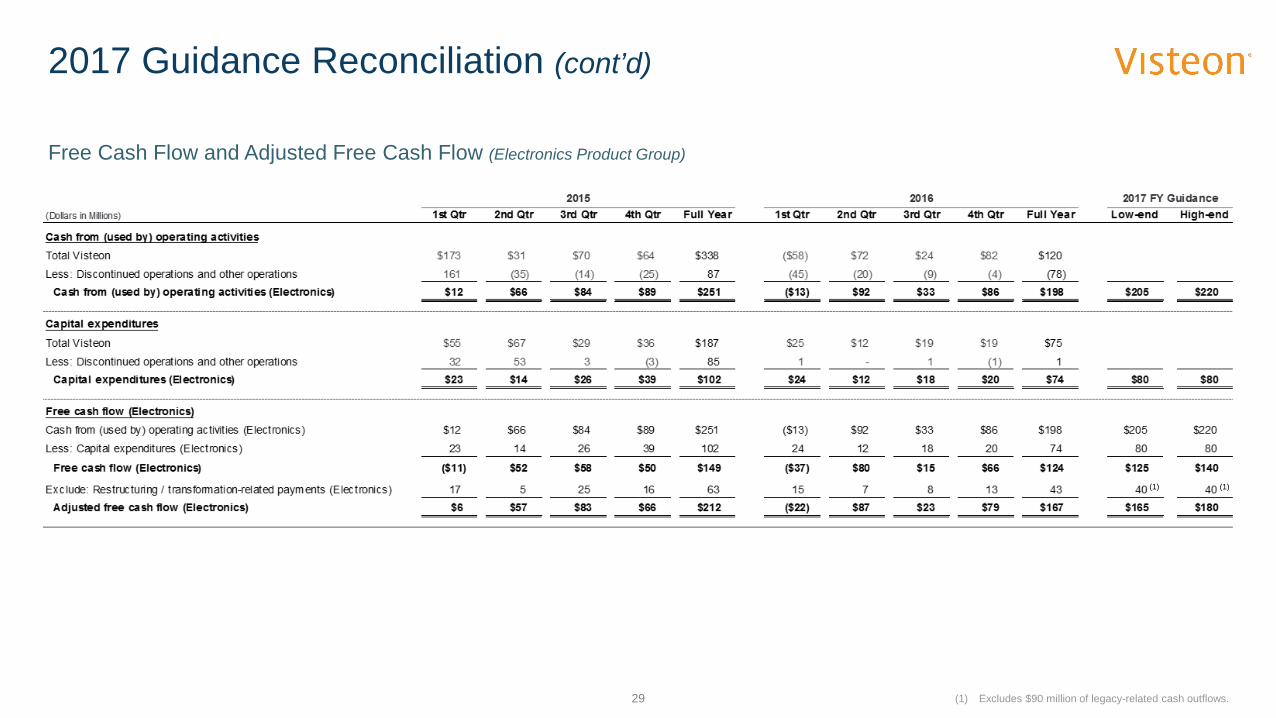
2017 Guidance Reconciliation (cont’d)
Free Cash Flow and Adjusted Free Cash Flow (Electronics Product Group)
29
(1)
(1) Excludes $90 million of legacy-related cash outflows.
(1)
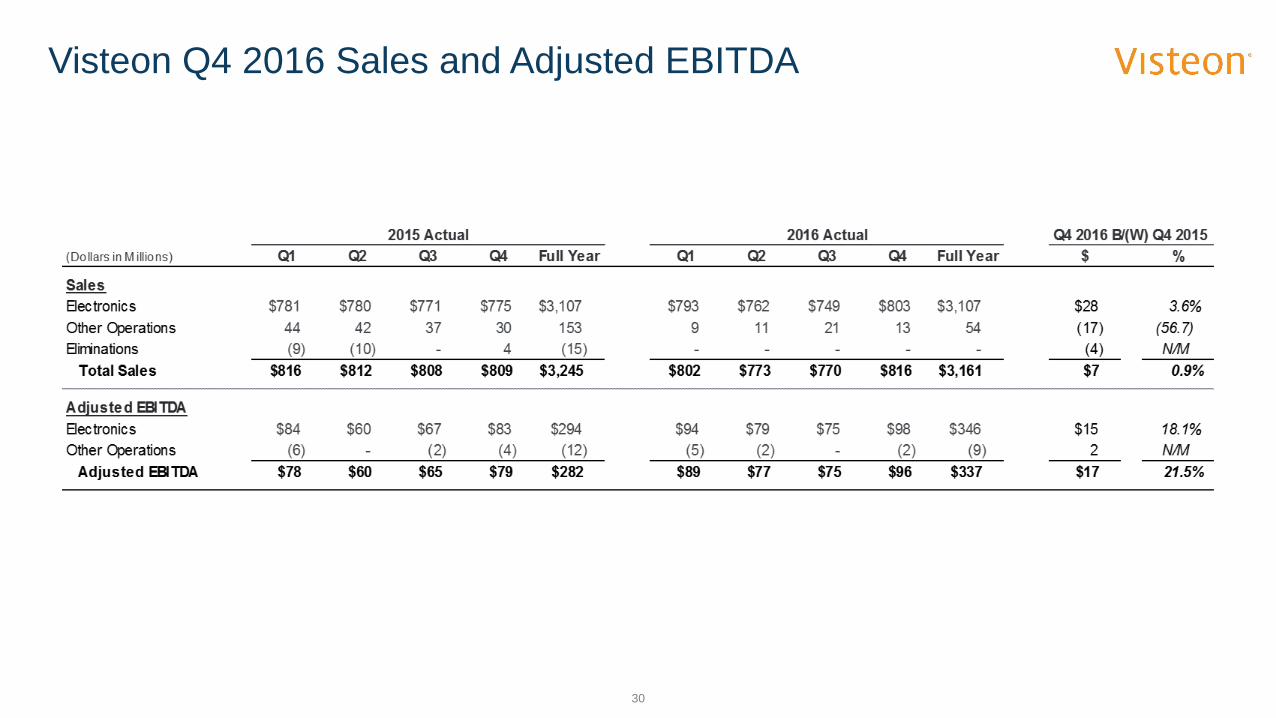
Visteon Q4 2016 Sales and Adjusted EBITDA
30
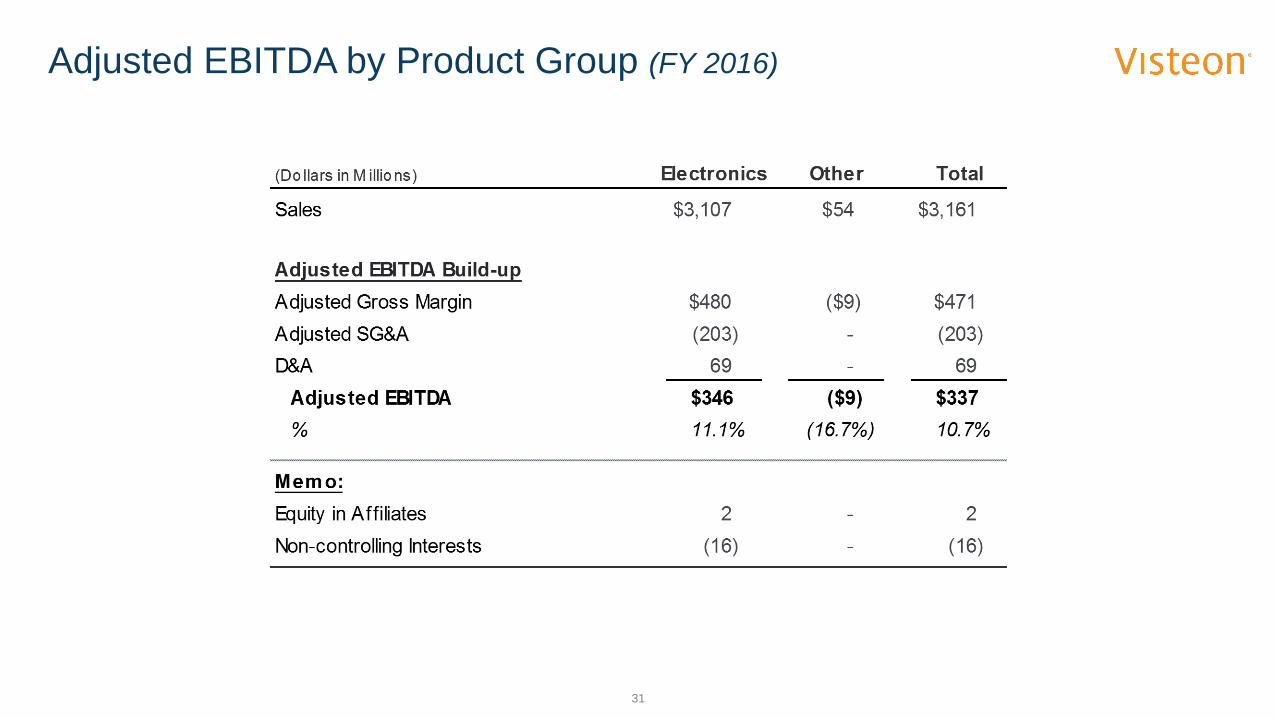
Adjusted EBITDA by Product Group (FY 2016)
31
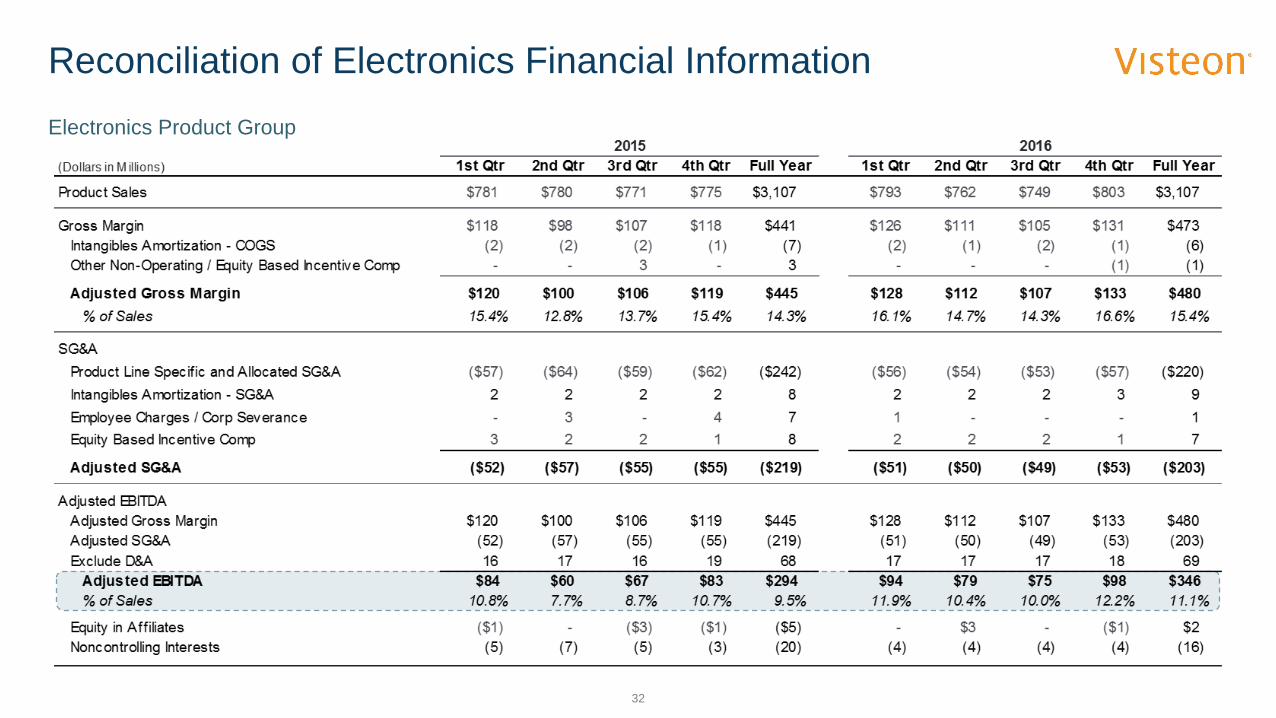
Reconciliation of Electronics Financial InformationElectronics Product Group
32
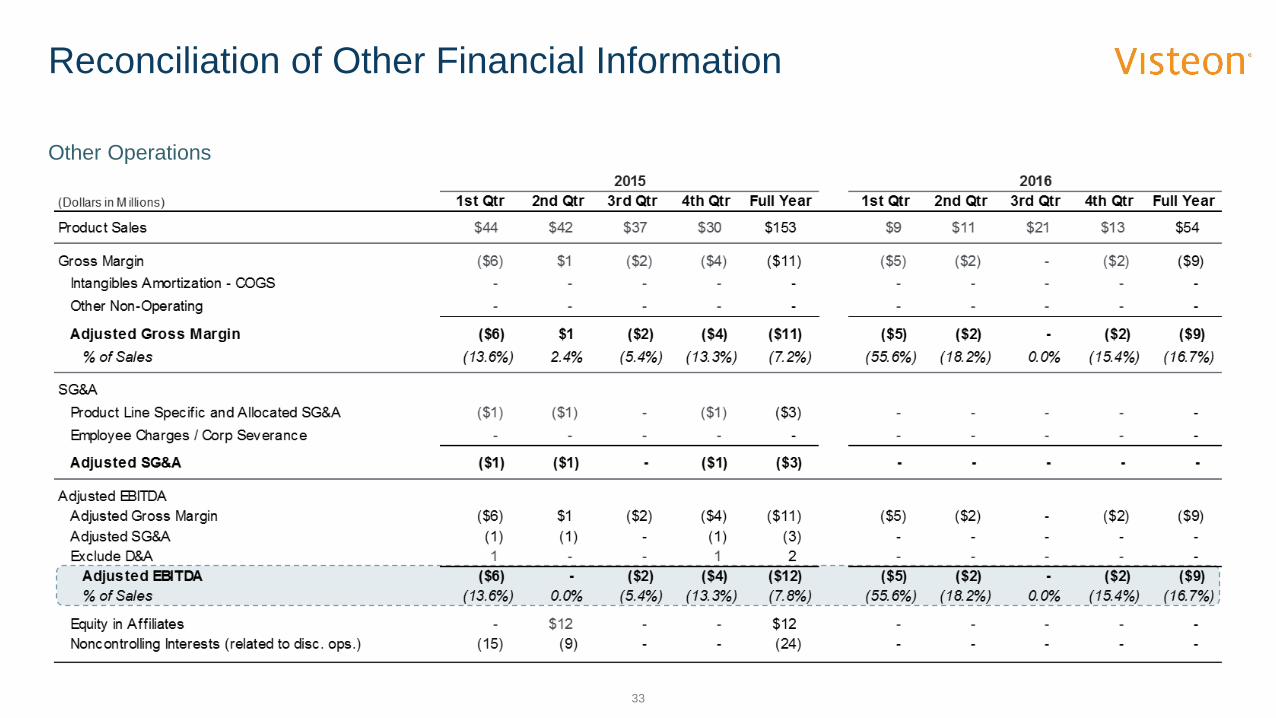
Reconciliation of Other Financial Information
Other Operations
33
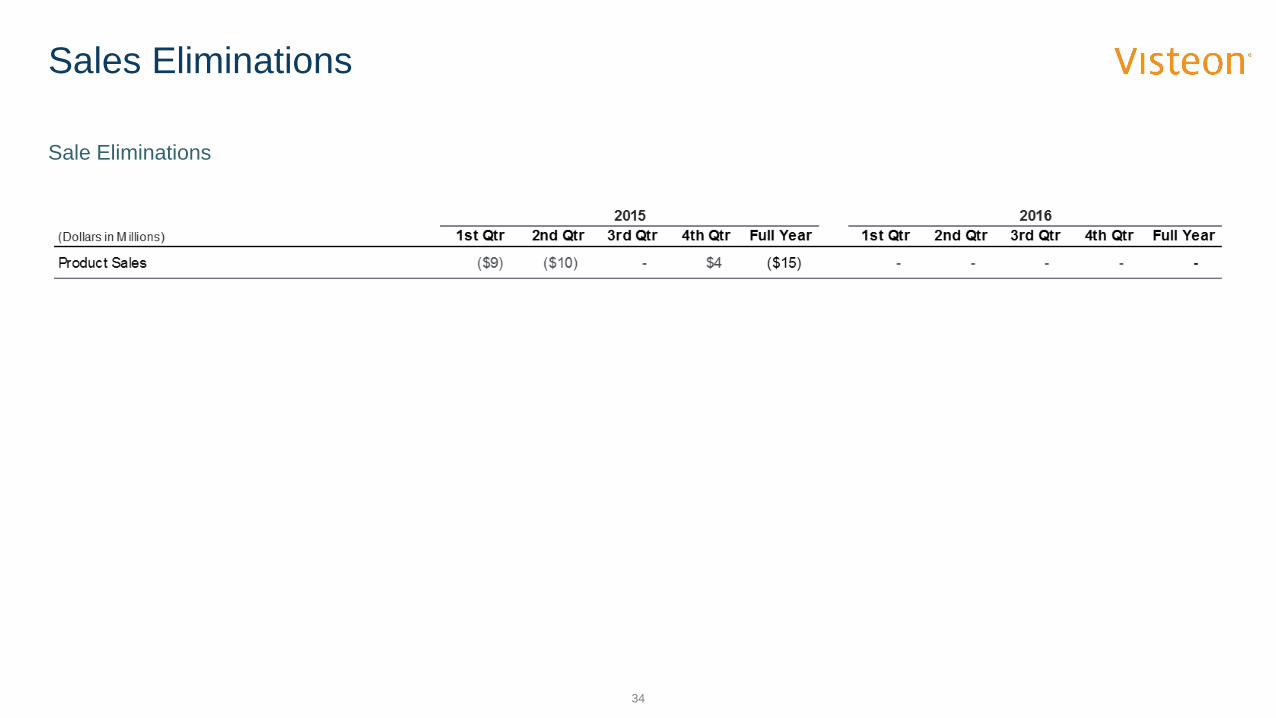
Sales Eliminations
Sale Eliminations
34
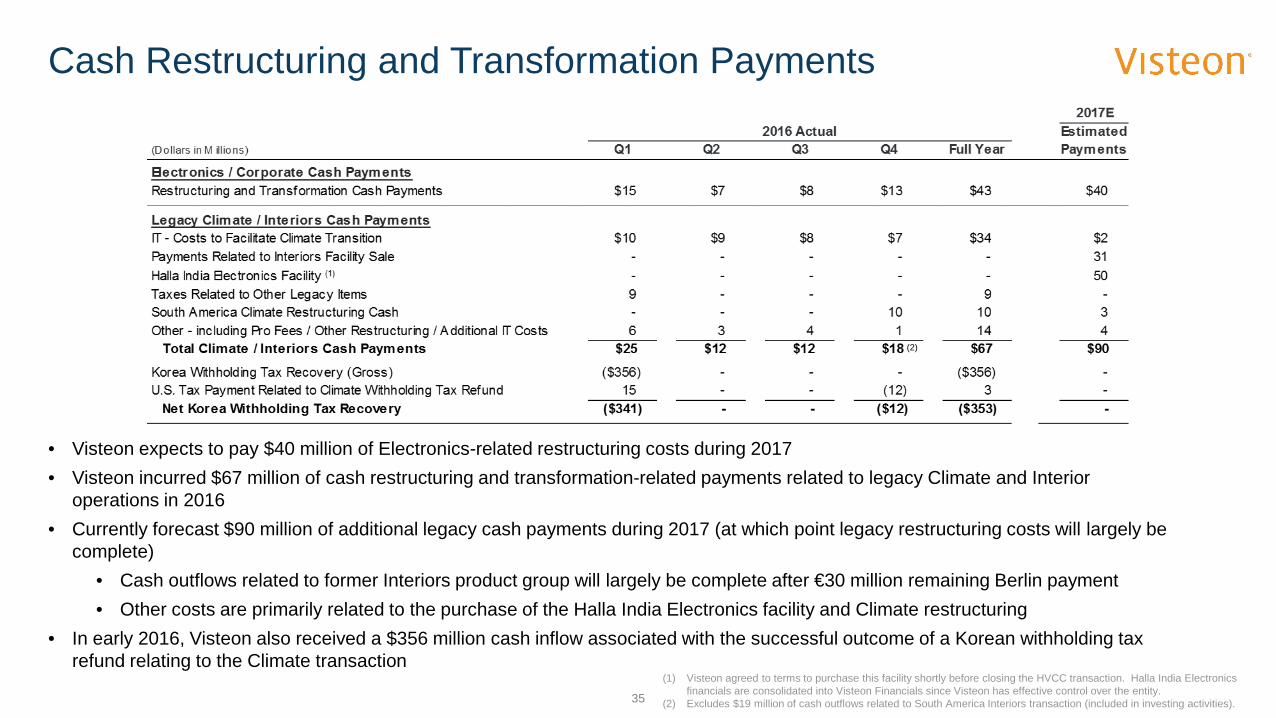
Cash Restructuring and Transformation Payments
• Visteon expects to pay $40 million of Electronics-related restructuring costs during 2017• Visteon incurred $67 million of cash restructuring and transformation-related payments related to legacy Climate and Interior
operations in 2016• Currently forecast $90 million of additional legacy cash payments during 2017 (at which point legacy restructuring costs will largely be
complete)• Cash outflows related to former Interiors product group will largely be complete after €30 million remaining Berlin payment• Other costs are primarily related to the purchase of the Halla India Electronics facility and Climate restructuring
• In early 2016, Visteon also received a $356 million cash inflow associated with the successful outcome of a Korean withholding tax refund relating to the Climate transaction
(1) Visteon agreed to terms to purchase this facility shortly before closing the HVCC transaction. Halla India Electronics financials are consolidated into Visteon Financials since Visteon has effective control over the entity.
(2) Excludes $19 million of cash outflows related to South America Interiors transaction (included in investing activities).35
(2)
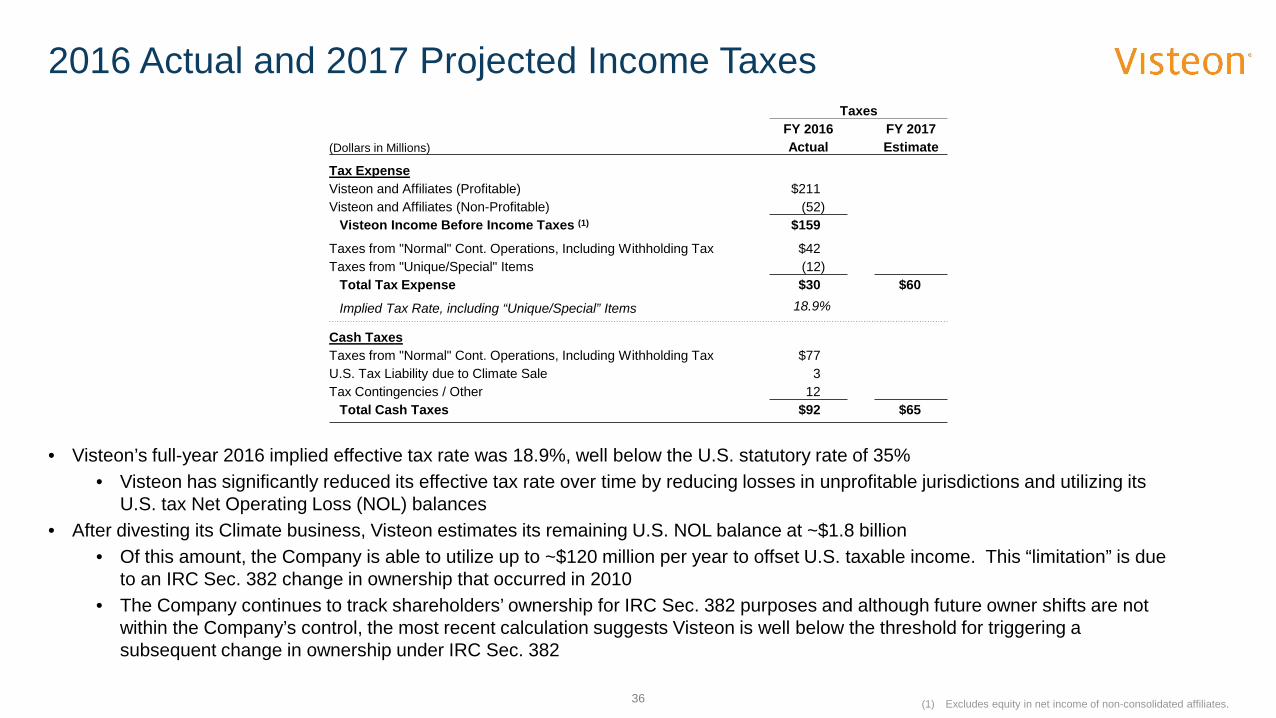
2016 Actual and 2017 Projected Income Taxes
• Visteon’s full-year 2016 implied effective tax rate was 18.9%, well below the U.S. statutory rate of 35% • Visteon has significantly reduced its effective tax rate over time by reducing losses in unprofitable jurisdictions and utilizing its
U.S. tax Net Operating Loss (NOL) balances• After divesting its Climate business, Visteon estimates its remaining U.S. NOL balance at ~$1.8 billion
• Of this amount, the Company is able to utilize up to ~$120 million per year to offset U.S. taxable income. This “limitation” is due to an IRC Sec. 382 change in ownership that occurred in 2010
• The Company continues to track shareholders’ ownership for IRC Sec. 382 purposes and although future owner shifts are not within the Company’s control, the most recent calculation suggests Visteon is well below the threshold for triggering a subsequent change in ownership under IRC Sec. 382
(1) Excludes equity in net income of non-consolidated affiliates.
TaxesFY 2016 FY 2017
(Dollars in Millions) Actual Estimate
Tax ExpenseVisteon and Affiliates (Profitable) $211Visteon and Affiliates (Non-Profitable) (52)
Visteon Income Before Income Taxes (1) $159
Taxes from "Normal" Cont. Operations, Including Withholding Tax $42Taxes from "Unique/Special" Items (12)
Total Tax Expense $30 $60
Implied Tax Rate, including “Unique/Special” Items 18.9%
Cash TaxesTaxes from "Normal" Cont. Operations, Including Withholding Tax $77U.S. Tax Liability due to Climate Sale 3 Tax Contingencies / Other 12
Total Cash Taxes $92 $65
36
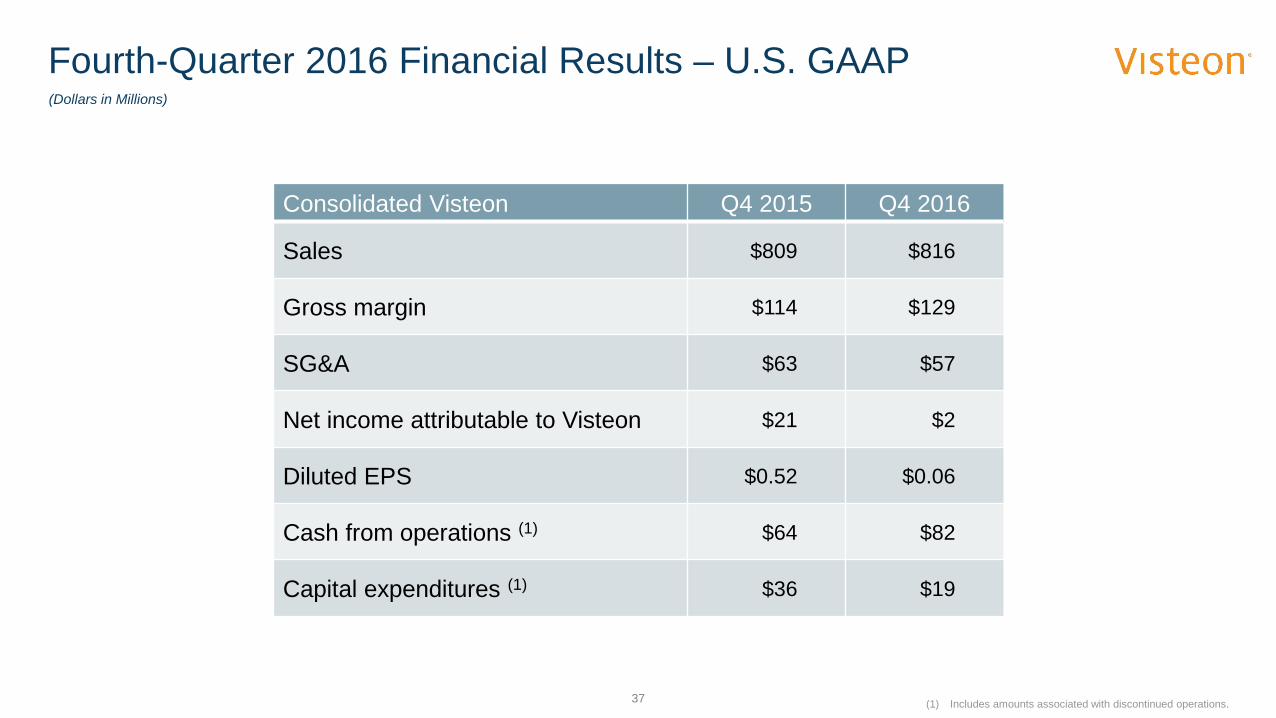
Fourth-Quarter 2016 Financial Results – U.S. GAAP
(1) Includes amounts associated with discontinued operations.
Consolidated Visteon Q4 2015 Q4 2016
Sales $809 $816
Gross margin $114 $129
SG&A $63 $57
Net income attributable to Visteon $21 $2
Diluted EPS $0.52 $0.06
Cash from operations (1) $64 $82
Capital expenditures (1) $36 $19
(Dollars in Millions)
37