visual analytics 1 - georgia institute of technology€¦ · telling the truth about your data...
TRANSCRIPT

1
Visual Analytics 1
CS 7450 - Information Visualization
November 26, 2012
John Stasko
Topic Notes
Agenda
• Today
Overview of what the term means and how it relates to information visualization
Some example VA research projects
• Next time
Specific example, Jigsaw, helping investigative analysis
Related systems
Fall 2012 2 CS 7450

2
3 3
Acknowledgment
Slides looking like this provided
courtesy of Jim Thomas
CS 7450
Visual Analytics
• A new term for something that is familiar to all of us
• Informal description:
Using visual representations to help make decisions
Sounds like infovis, no?
Fall 2012 4 CS 7450

3
Before There was VA
• Growing concern from some that infovis was straying from practical, real world analysis problems
• Infovis typically not applied to massive data sets
• Infovis “competes” with other computational approaches to data analysis
Statistics, data mining, machine learning
Fall 2012 CS 7450 5
Important Paper
• Shneiderman suggests combining computational analysis approaches such as data mining with infovis – Discovery tools
Too often viewed as competitors in past
Instead, can complement each other
• Each has something valuable to contribute
Fall 2012 CS 7450 6
Shneiderman Information Visualization ‘02

4
Fall 2012 CS 7450 7
Alternatives
• Issues influencing the design of discovery tools:
Statistical Algorithms vs. Visual data presentation
Hypothesis testing vs. exploratory data analysis
• Pro’s and Con’s?
Differing Views
• Hypothesis testing Advocates:
By stating hypotheses up front, limit variables and sharpens thinking, more precise measurement
Critics: Too far from reality, initial hypotheses bias toward finding
evidence to support it
• Exploratory Data Analysis Advocates:
Find the interesting things this way, we now have computational capabilities to do them
Skeptics: Not generalizable, everything is a special case, detecting
statistical replationships does not infer cause and effect
Fall 2012 CS 7450 8
5
Fall 2012 CS 7450 9
Recommendations
• Integrate data mining and information visualization
• Allow users to specify what they are seeking
• Recognize that users are situated in a social context
• Respect human responsibility
Further Questions
• Are information visualizations helping with exploratory analysis enough?
• Are they attempting to accomplish the right goals?
Fall 2012 CS 7450 10

6
Fall 2012 CS 7450 11
Another Important Paper
• Information visualization systems inadequately supported decision making:
Limited Affordances
Predetermined Representations
Decline of Determinism in Decision-Making
• “Representational primacy” versus “Analytic primacy”
Telling the truth about your data versus providing analytically useful visualizations
Amar & Stasko InfoVis ‘04 Best Paper TVCG ‘05
Task Level
• Don’t just help “low-level” tasks
Find, filter, correlate, etc.
• Facilitate analytical thinking
Complex decision-making, especially under uncertainty
Learning a domain
Identifying the nature of trends
Predicting the future
Fall 2012 CS 7450 12
7
Fall 2012 CS 7450 13
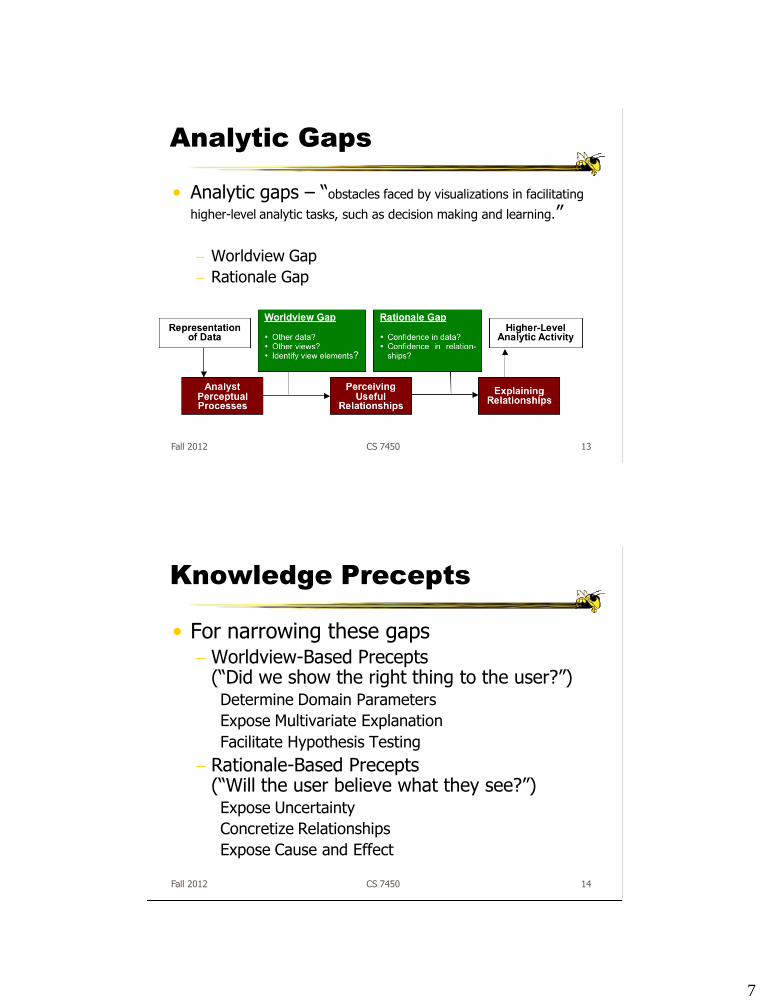
Analytic Gaps
• Analytic gaps – “obstacles faced by visualizations in facilitating
higher-level analytic tasks, such as decision making and learning.”
Worldview Gap
Rationale Gap
Fall 2012 CS 7450 14
Knowledge Precepts
• For narrowing these gaps Worldview-Based Precepts
(“Did we show the right thing to the user?”) Determine Domain Parameters
Expose Multivariate Explanation
Facilitate Hypothesis Testing
Rationale-Based Precepts (“Will the user believe what they see?”) Expose Uncertainty
Concretize Relationships
Expose Cause and Effect
8
Fall 2012 CS 7450 15
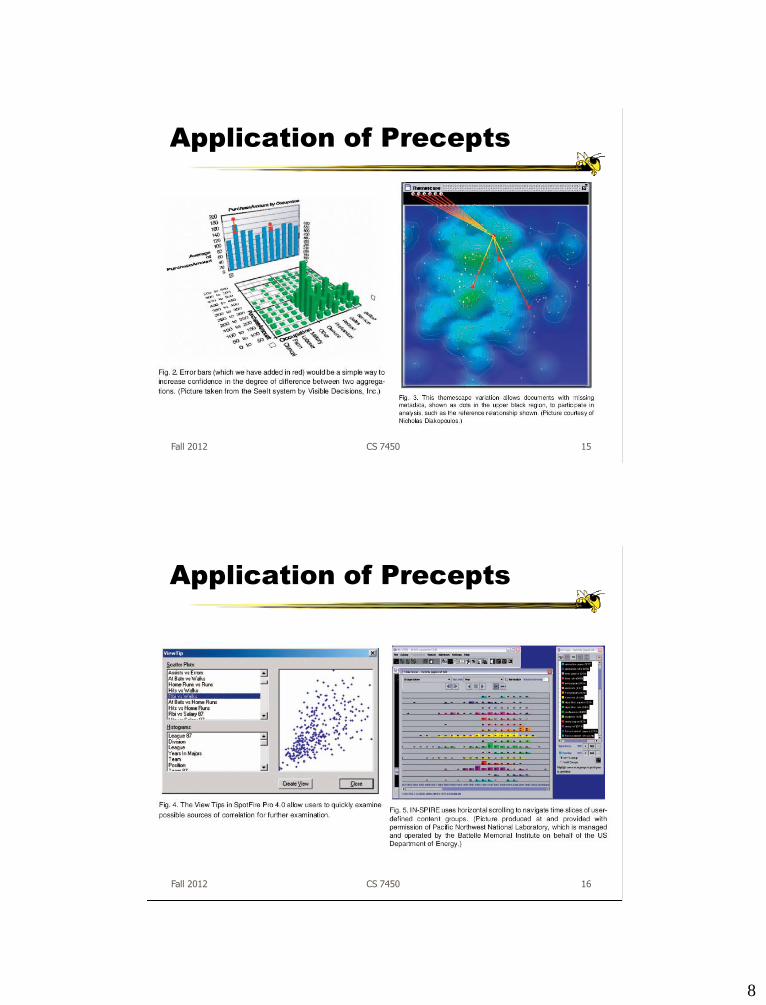
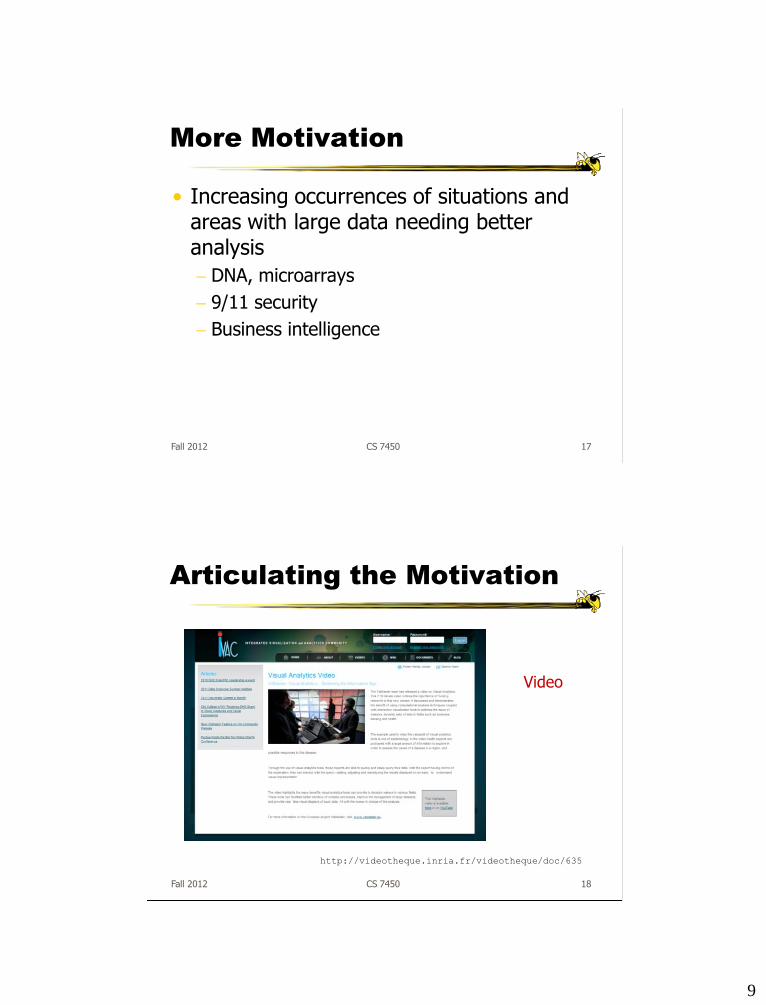
Application of Precepts
Fall 2012 CS 7450 16
Application of Precepts
9
More Motivation
• Increasing occurrences of situations and areas with large data needing better analysis
DNA, microarrays
9/11 security
Business intelligence
Fall 2012 CS 7450 17
Articulating the Motivation
Fall 2012 CS 7450 18
Video
http://videotheque.inria.fr/videotheque/doc/635

10
History
• 2003-04 Jim Thomas of PNNL, together with colleagues, develops notion of visual analytics
• Holds workshops at PNNL and at InfoVis ‘04 to help define a research agenda
• Agenda is formalized in book Illuminating the Path, shown on next slide
Fall 2012 19 CS 7450
#
Visual Analytics Definition
Visual analytics is the science of analytical reasoning facilitated
by interactive visual interfaces.
People use visual analytics tools and techniques to
Synthesize information and derive insight from massive,
dynamic, ambiguous, and often conflicting data
Detect the expected and discover the unexpected
Provide timely, defensible, and understandable assessments
Communicate assessment effectively for action.
“The beginning of knowledge is the discovery of something we do not understand.” ~Frank Herbert (1920 - 1986)
Thomas & Cook 2005
CS 7450
11
Visual Analytics
• Not really an “area” per se
More of an “umbrella” notion
• Combines multiple areas or disciplines
• Ultimately about using data to improve our knowledge and help make decisions
Fall 2012 21 CS 7450
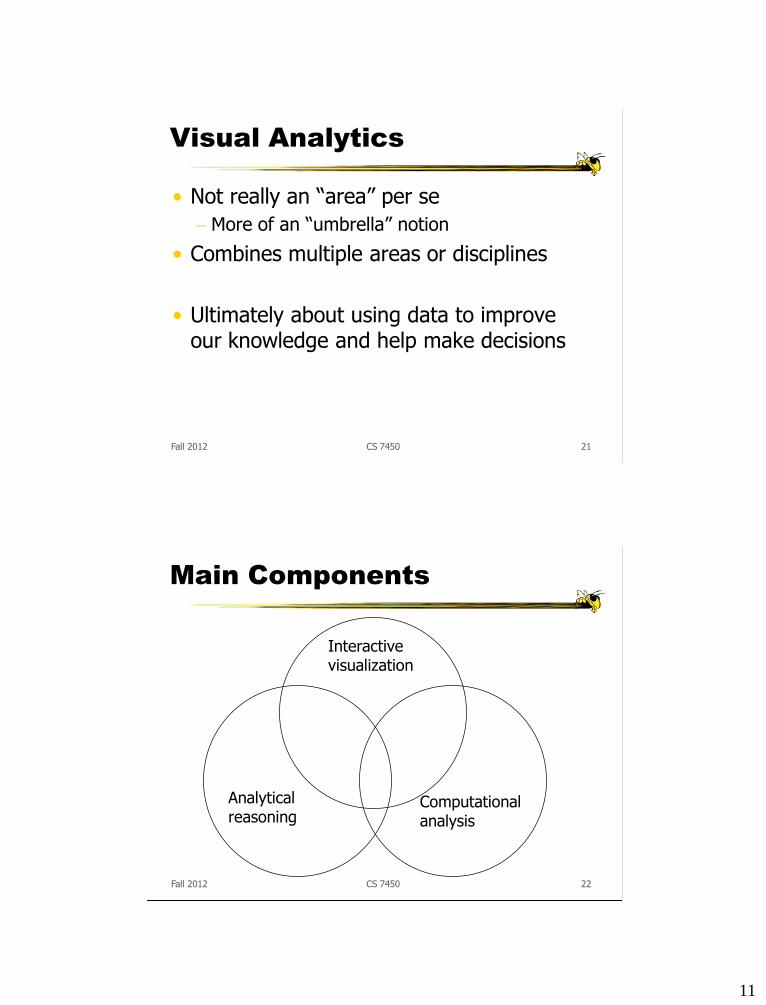
Main Components
Interactive visualization
Computational analysis
Analytical reasoning
22 CS 7450 Fall 2012
12
Alternate Definition
• Visual analytics combines automated analysis techniques with interactive visualizations for an effective understanding, reasoning and decision making on the basis of very large and complex data sets
Keim et al, chapter in Information Visualization: Human-Centered Issues and Perspectives, 2008
Fall 2012 23 CS 7450
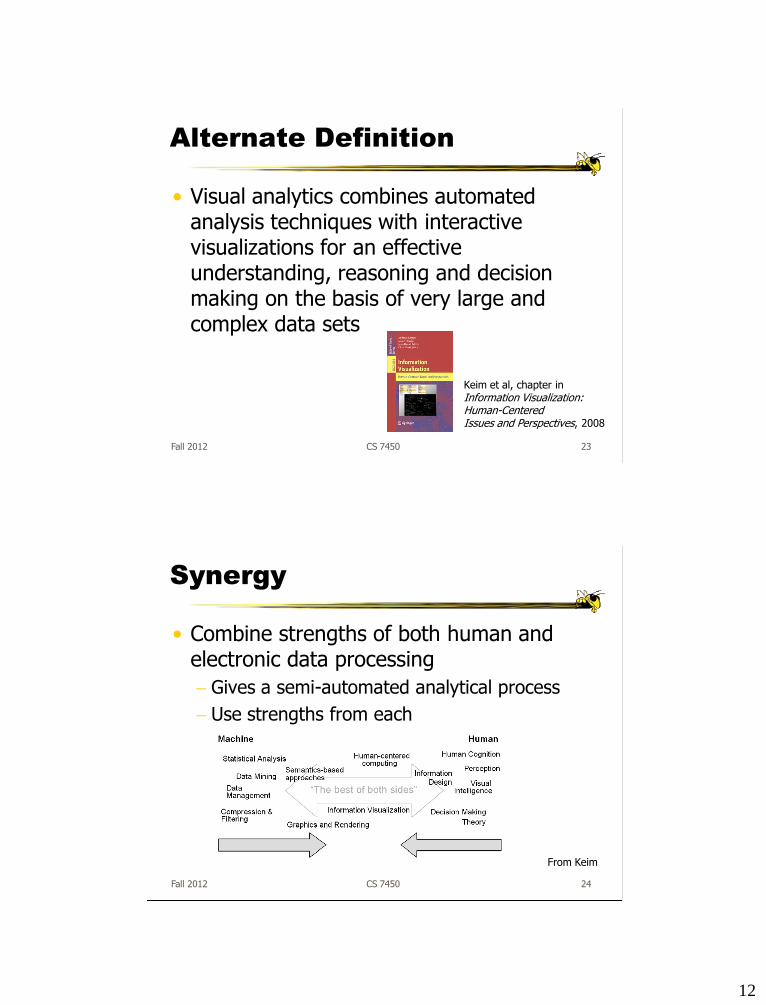
Synergy
• Combine strengths of both human and electronic data processing
Gives a semi-automated analytical process
Use strengths from each
From Keim
Fall 2012 24 CS 7450

13
InfoVis Comparison
• Clearly much overlap
• Perhaps fair to say that infovis hasn’t always focused on analysis tasks so much and that it doesn’t always include advanced data analysis algorithms
Not a criticism, just not focus
InfoVis has a more narrow scope
(Some of us actually do believe that infovis has/should include those topics)
Fall 2012 25 CS 7450
Academic Context
Visual Analytics ~2005
Information Visualization ~1990
Pure analytical reasoning Computational analysis
Artsy casual infovis, etc.
26 CS 7450 Fall 2012
My interpretation
14
Visual Analytics
• Encompassing, integrated approach to data analysis
Use computational algorithms where helpful
Use human-directed visual exploration where helpful
Not just “Apply A, then apply B” though
Integrate the two tightly
Fall 2012 27 CS 7450
Domain Roots
• Dept. of Homeland Security supported founding VA research
• Area has thus been connected with security, intelligence, law enforcement
• Should be domain-independent, however, as other areas need VA too
Business, science, biology, legal, etc.
Fall 2012 CS 7450 28
15
VA-related Research Topics
• Visualization
InfoVis, SciVis, GIS
• Data management
Databases, information retrieval, natural language
• Data Analysis
Knowledge discovery, data mining, statistics
• Cognitive Science
Analytical reasoning, decision-making, perception
• Human-computer interaction
User interfaces, design, usability, evaluation
Fall 2012 CS 7450 29
30
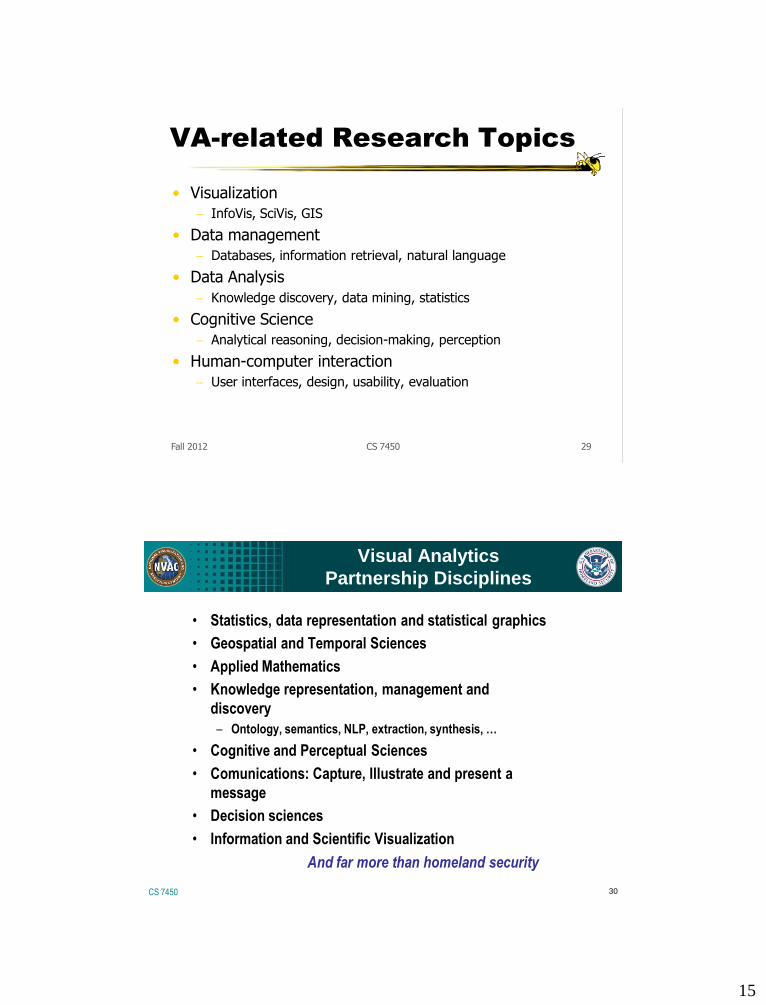
Visual Analytics
Partnership Disciplines
• Statistics, data representation and statistical graphics
• Geospatial and Temporal Sciences
• Applied Mathematics
• Knowledge representation, management and
discovery
– Ontology, semantics, NLP, extraction, synthesis, …
• Cognitive and Perceptual Sciences
• Comunications: Capture, Illustrate and present a
message
• Decision sciences
• Information and Scientific Visualization
And far more than homeland security
CS 7450

16
31
Data Information Knowledge
Aggregation
Integration
Organization
Cognition
Prediction
Extraction
Link Discovery
Pattern Analysis
Graph Matching
Evidence Extraction
Visual Analytics
Connect the
Dots
Content
Management
Synthesis
Analysis
Multiple Techniques Contribute to Threat Assessment
CS 7450
32 32
Uses Today
• Scientific Research • Regulatory and Legal Communities • Intelligence Analysis • DOE and DOD • Market Assessments • Capability Analysis - Resumes • Medical and Pharmaceutical
Communities • National Security and Law Enforcement • Information Assurance, Web Analytics • Technology Scanning, Asset and
Intellectual Property Management CS 7450

17
33
Capabilities Desired
• Reduce the threat of terrorism through the invention, development, evaluation, and deployment of technology to analyze masses of data in different formats and types, from different sources, with highly varying degrees of confidence levels, within time frames required for rapid decision making.
• Better understand the risks and vulnerabilities of our critical infrastructures, trade, ports, and immigration by combining sensor, computational and visual analytics technologies for in-the-field and strategic decision making.
• Enable rapid visual communication technology for response teams for clear understanding of the situation assessment and alternate options for response with geospatial, and multi-jurisdictional situations for WME and natural disasters.
• Ensure effective information communication methods and technologies throughout DHS missions of analysis, risk, levels of alerts, and response, in unwrappable levels of assessment with evidence and communication styles aimed within audience-centric applications for rapid understanding and action.
• Provide an enduring talent base of educated professionals supporting future developments requiring visual communication of integrated information and operational support missions.
CS 7450
34
Research Agenda
• Available at
http://nvac.pnl.gov/ in PDF
form
• At IEEE Press in book form
• Special thanks to IEEE
Technical Committee on
Visualization and Graphics
CS 7450

18
35
Overview of the R&D Agenda
• Challenges
• Science of Analytical Reasoning
• Science of Visual Representations and Interactions
• Data Representations and Transformations
• Production, Presentation, and Dissemination
• Moving Research Into Practice
• Positioning for an Enduring Success
CS 7450
More History
• European Union has become very active in visual analytics area
VisMaster project
Fall 2012 CS 7450 36
19
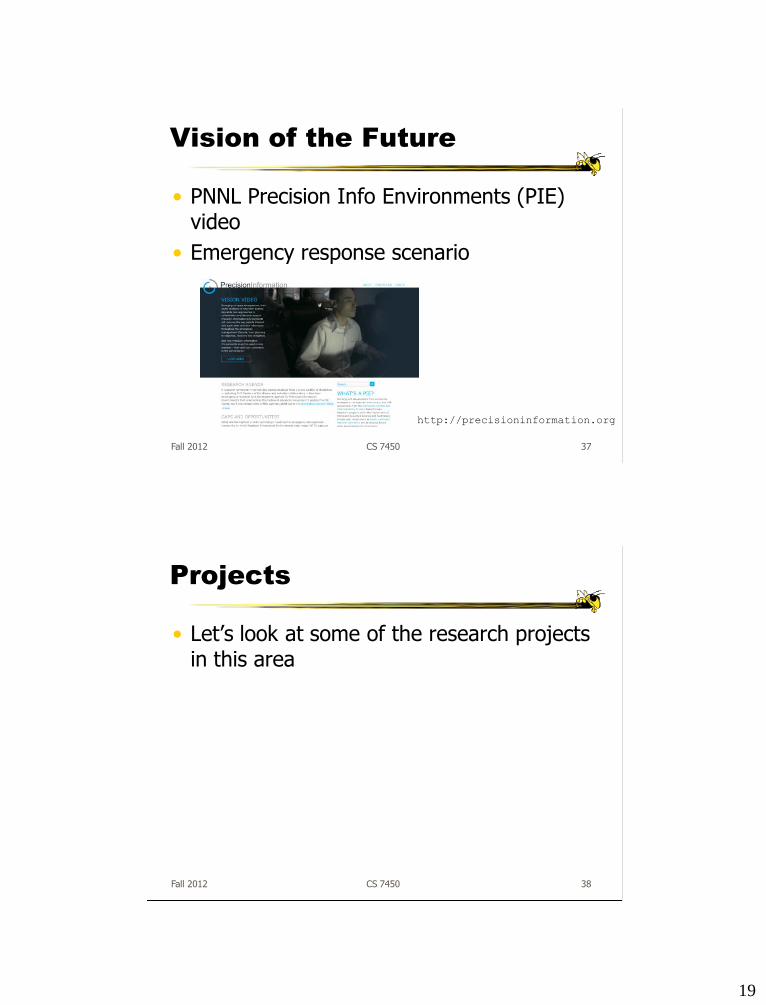
Vision of the Future
• PNNL Precision Info Environments (PIE) video
• Emergency response scenario
Fall 2012 CS 7450 37
http://precisioninformation.org
Projects
• Let’s look at some of the research projects in this area
Fall 2012 38 CS 7450

20
39 39
IN-SPIRE™ Visual Document Analysis
http://in-spire.pnl.gov
Uncovers Common Topics in Large Document Collections
Enganging Displays for Exploration
Multiple Query and Search Tools
Supports Real-Time Streaming Data
Compatible with Foreign Languages
Shows Trends over Time
A “Thinking Aid” for advanced investigation of unstructured text
Video CS 7450
D-DUPE
Fall 2012 CS 7450 40
Bilgic et al VAST ‘06
System for entity resolution in large networks such as bibliographic collections System does computational analysis and provides suggestions and user can augment and correct
Video

21
Fall 2012 CS 7450 41
WireVis
• Another VA investigative analysis project
• Helping Bank of America examine wire transfers of money
• Want to detect fraud and illegal actions
Chang et al Information Visualization ‘08
Thanks to R. Chang for some slide content
Particulars
• Who – Bank analysts
• Problem – Detect money laundering and fraud in wire transfers of money
• Data – Electronic records of wire transactions and information associated with each
Fall 2012 CS 7450 42

22
Background
• Wire transfers of money can be complex
Have a “from” and “to” but often many “middlemen
May not know who intermediaries are
• Millions of transfers per day occur
Vast majority are legal
• Bank has legal responsibility to report suspicious activities
Fall 2012 CS 7450 43
Data
• Each transaction:
Money amount
Payer (could be third party)
Payee (could be an agent)
Potential intermediaries
Addresses of payer and payee, instructions, additional comments are optional
Fall 2012 CS 7450 44

23
Challenges
Fall 2012 CS 7450 45
Indonesia
Charlotte, NC Singapore
London
No Standard Form… When a wire leaves Bank of America in Charlotte… The recipient can appear as if receiving at London, Indonesia or Singapore
Vice versa, if receiving from Indonesia to Charlotte The sender can appear as if originating from London, Singapore, or Indonesia
Challenges
• Scale: BoA may do 200k transfers per day
• No international standard: loosely structured data
• Bad guys are smart and one step ahead
Detection tools are always reactive
Fall 2012 CS 7450 46

24
Existing Detection
• Examine for certain temporal patterns of activity
• Look for keywords in free text
Filter transactions based on these highly secretive words
Typically a few hundred
Updated based on intelligence reports
Fall 2012 CS 7450 47
Current Practices
• Load transactions into large relational DB
• Download some amount to spreadsheets via filtering based on keywords, amounts, dates, …
• Can only look at a week or two this way
• Difficult to notice temporal patterns
Fall 2012 CS 7450 48

25
System Overview
Heatmap View (Accounts to Keywords Relationship)
Strings and Beads (Relationships over Time)
Search by Example (Find Similar Accounts)
Keyword Network (Keyword Relationships)
Fall 2012 49 CS 7450
Heatmap View
List of Keywords
Sorted by frequency from high to low (left
to right)
Hierarchical
clusters of
accounts
Sorted by
activities from big
companies to
individuals (top to
bottom)
Fast “binning”
that takes O(3n) Number of occurrences of keywords
Light color indicates few occurrences Fall 2012 50 CS 7450

26
Strings and Beads
Time
Y-axis can
be amounts,
number of
transactions,
etc.
Fixed or
logarithmic
scale
Each string corresponds to a cluster of accounts
in the Heatmap view
Each bead represents a day
Fall 2012 51 CS 7450
Keyword Network
• Each dot is a keyword
• Position of the keyword is based on their relationships
Keywords close to each other appear together more frequently
Using a spring network, keywords in the center are the most frequently occurring keyword
• Link between keywords denote co-occurrence
Fall 2012 52 CS 7450

27
Search By Example
Target Account
Histogram depicts the occurrences of keywords
User interactively selects features within the histogram used in comparison
Similarity threshold slider
Accounts that
are within the
similarity
threshold
appear ranked
(most similar on
top)
Fall 2012 53 CS 7450
Coast Guard Search & Rescue
Fall 2012 CS 7450 54
Malik et al VAST ‘11
Shows stations, incidents, response times Visualize historical data and support “what if” explorations Calculate risk assessments and then communicate visually
Video

28
55
Other Examples
CS 7450
Many Others
• A number of nice examples shown earlier on Graph & Network visualization day
Wong: Graph Signatures
Perer: Social Action
etc.
Fall 2012 56 CS 7450
29
HW 8
• Due Wednesday
• Turn in: Your paragraph description of “threat” + process description (and any materials you want to submit)
Fall 2012 CS 7450 57
Project
• Deliverables
Demo to Chad & John
Thur & Fri 6th & 7th, sign up on t-square
Video
5 minutes max, due on Monday 10th
Fall 2012 CS 7450 58

30
Video Advice
• Use Camtasia
• Process
1. Develop script (rehearse timing)
2. Record script
3. Capture video of demo to script
4. Add effects
• You’ve seen examples all semester
eg, http://www.cc.gatech.edu/gvu/ii/videos.html
Fall 2012 CS 7450 59
Upcoming
• Visual Analytics 2
Reading
Stasko et al ‘08
• Animation
Reading
Carpendale ‘08
Fall 2012 60 CS 7450