visual and raman spectroscopic observations using fused...
TRANSCRIPT

Visual and Raman spectroscopic observations using fused silica capillary
reactor technique
[email protected] of Environmental Engineering
Zhejiang University of Technology, Hangzhou, China浙江工业大学 2016. 06. 15
Zhiyan Pan 潘 志 彦


FSCR?
Fused Silica Capillary Reactor?
What is

Fused Silica Capillary Reactor (FSCR)
Raw materials
Manufacturing process
FSCR sample
Heating-cooling stage & Raman spectroscopy

Capillary
Fused quartz tubing

Tube with 6cm long
Loaded samples(solid, liquid)
Sealed by hydrogen flame
Centrifuged to the sealed end
Inserted in a glass tube
Connected to a pressure line
Switched the pressure line
Evacuate the air
Loading gas
Sealed the open end
①
②

Schematic Diagram of the Vacuum and Sample Loading System
Vacuum Pump
V-5
V-6
Sample Fluid Tank
V-1 V-2V-3
V-4
Pressure Gauge
Sealed with a Hydrogen Flame
V-7 V-8
Liquid Nitrogen In a Pt Crucible

Photogram of the Vacuum and Sample Loading System

Heating–cooling stage of USGS
Raman Spectroscopy
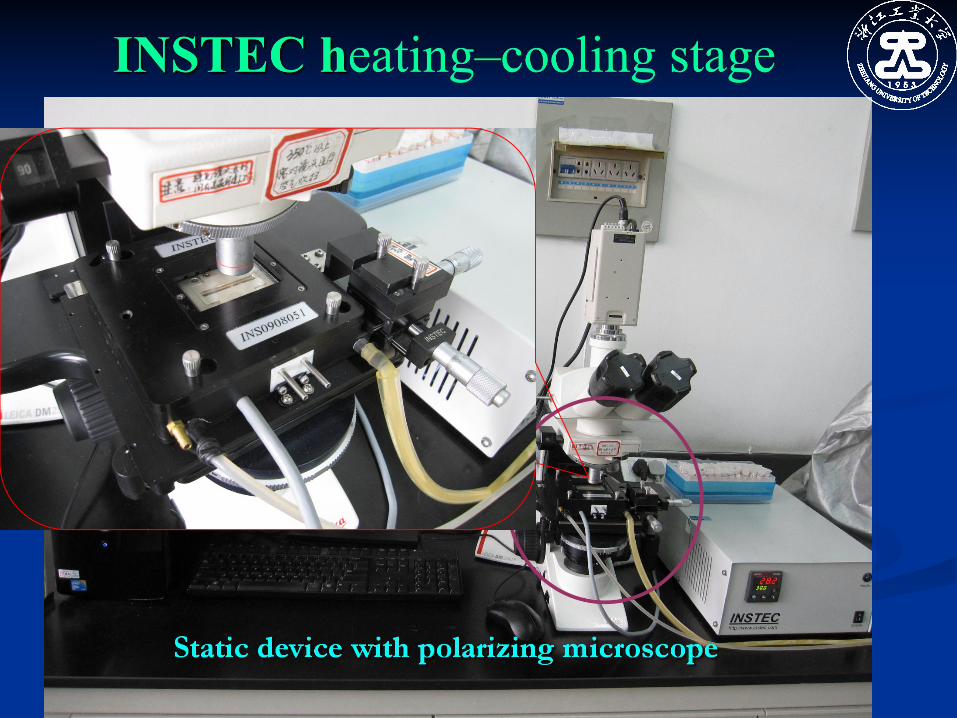

Raman Spectroscopy
Linkam CAP500 Heating-cooling stage

Raman Spectroscopy

FSCR
Photograph of the capillaries (0.3mm ID, 0.66mm OD, and ~25mm long)
ØGreen Chemistry, 2009, 11: 1105-1107.

V=50mL
V=0.001~0.005mL
V=500~5000mL
stainless steel autoclave


An image of a sample in a fused silica capillary reactor, showing chlorobenzene, water, vapour, and silica rod in the FSCR
Dissolution of chlorobenzene in water during heating.The C6H5Cl is shown at the right end of the FSCR. The FSCR is under the microscope.
FSCR was heated to the preset temperature and allowed the sample to equilibrate for a
period between 8 and 10h in the presence of a vapor phase. For
example, the images of a sample containing 58.0 mg of
C6H5Cl/g of H2O, taken during heating from 30.1 to
222.4℃, they show the gradual dissolution of C6H5Cl during
heating and its total disappearance at 222.4 ℃.

maximum relative error is 2.38%
Solubility of C6H5Cl in pure water at temperatures between 173.3 and 266.9 ℃■, experimental data; —, least-squares fit of the data
The results indicate the solubility of C6H5Cl increases with increasing temperature, and can be represented by the linear equation
Industrial & Engineering Chemistry Research, 2011, 50 (20): 11724-11727.

An image of Raman spectra of liquid phase in the FSCR at four spots, at 220.0C, 20 h.
The Figure shows that the Raman spectra of 2,4-dichlorotoluene had bands with the same relative intensities at 457.04 cm-1 and 828.54 cm-1. It can be concluded that the solute diffused uniformly and the system reached phase equilibrium within a certain time, proving that the apparatus is viable.

Sample images were obtained during heating from 24.4 to 274.2℃, as shown in the left Figure; the concentration was 40.7 mg/(gH2O). These images show that 2,4-dichlorotoluene dissolved gradually duringheating and dissolved completely at 274.2℃.

Solubility of 2,4-dichlorotoluene in water at temperatures between 266.3 and 302.4℃: (■)
experimental data; (--) least-squares fit of the data.
AIChE Journal, 2013, 59 (8):2721-2725.
The results indicate that the solubility of 2,4-dichlorotoluene increased from 22.6 to 104.2 mg/(gH2O) when the temperature rose from 266.3 to 302.4℃

2.3 Solubility of ethanol in SC-CO2 with FSCR
13
CO2
V2V1
sealed with a hydrogen flame
4
678
9
11
12
14
5
10
1
3
2
Schematic diagram of the experimental flow to determine the solubility of ethanol in SC-CO2

An image of a sample in a fused silica capillary reactor,showing ethanol, liquid CO2, and vapor in the FSCR
2.3 Solubility of ethanol in SC-CO2 with FSCR
Dissolution of ethanol in supercritical CO2 during heating.The ethanol is shown at the right end of the FSCR, and the FSCR is under the microscope.

Average relative error is 5.8%
Solubility of ethanol in SC-CO2 at temperatures between 87.5 and 183.8℃■, experimental data; —, least-squares fit of the data.

Supercritical water oxidation in FSCR
Supercritical water oxidation of chlorobenzene (CB)
Hydrolysis of CCl4 in HCW
Decomposition of 1,1,1-trichloroethane
(TAC) in HCW

Photomicrographs of chlorobenzene in hydrogen peroxide (30 wt%) in a fused-silica capillary reactor during heating process (a), and cooling process (b).
Ø Environmental Science & Technology, 2012, 46 (6): 3384-3389.

1200 1250 1300 1350 1400 1450 1500
Hot
ban
d
Hot
ban
d
Lowe
r ban
d
Uppe
r ban
d
10 min
8 min
6 min
4 min2 minIn
tens
ity (
arbi
trar
y un
its)
Wavenumber ( cm-1)
0 min
Raman spectra of CO2 produced by oxidation of CB in supercritical water with 150% stoichiometric amounts of oxidizer at 450 OC at different reaction
times.

2 4 6 8 100
22000
44000
66000
88000
110000
132000
350℃ 375℃ 400℃ 425℃ 450℃
CO2 yield350℃375℃400℃ 425℃450℃
Reaction time (min)
Peak
are
aPeak area
0
10
20
30
40
50
60
70
80
90
100
CO
2 yie
ld (
% )
2 4 6 8 100
10
20
30
40
50
60
70
80
90
100
CB
Con
vers
ion
yiel
d (%
)
Reaction time (min)
350℃ 375℃ 400℃ 425℃ 450℃
Raman peak area of CO2 (scattered
symbols) and CO2 yield (lines) vs
reaction time with 150% stoichiometric
amount of oxidizer at different temperatures.
Effects of reaction time on CB conversion yield with 150% stoichiometric amount of oxidizer at different temperatures.

Photomicrographs of CCl4 with water in FSCR during the heating process: (a) CCl4 swells up between 34.1 and 231.0oC and gasifies (b) between 231.3 and 260.0oC. (c) Photomicrographs before and (d) after reaction taken at room temperature.
Ø In Situ Raman Spectroscopic Study of Hydrolysis of Carbon Terachloride in Hot Compressed Water in a Fused Silica Capillary Reactor
ØThe Journal of Supercritical Fluids. 2012, 72:22-27.

Raman spectra of the vapor phase in FSCR at 260oC collected at different reaction times showing bands for Carbon Tetrachloride (459, 314, and 218 cm-1) and product CO2 (1286 and 1389 cm-1) (50x LWD, 600 grooves/mm, 2 × 20s accumulations) .
Raman spectra of the vapor phase produced by the hydrolysis of CCl4 in HCW at 260oC at various reaction times, showing the CO2 bands. and the increase of CO2 signals indicates the progress of hydrolysis.

shows the phase behavior during the oxidation of TCA in H2O2 in the heating process.
shows the hydrolysis of TCA in deionized water during the heating process. B.P.=74-76

Effect of reaction time on TCA conversion at different temperatures in FSCR.
the conversion of TCA increased with increasing temperature in the range 10–50 min, reaching a peak value at 270.℃ for 50 min.

Effect of stoichiometric amount of H2O2 on Raman peak area of CO2 yield from TCA (t=6 min).
Raman peak areas of CO2 and CO2 yields (lines) with 175% stoichiometric amount of oxidizer at different temperatures and reaction times.

Raman spectra of CO2 produced by oxidation of TCA in SCWO with 175% stoichiometric amount of oxidizer at 380 ℃ at different reaction times. The spectra were collected under similar conditions, and the increased CO2 signals indicate the
progress of the oxidation.
Chemical Engineering Science, 2013,94:185-191.
Depolymerization of polyester in FSCR
Depolymerization of PC

RSC Advance, 2014, 4: 19992-19998.
Photomicrographs of PC in water in FSCR1 and FSCR2. (a) heating process, (b) at diferent reaction times at 260 C, and (c) cooling process. Mn(Ac)2 catalyst was present in FSCR1 and not in FSCR2. The heating/cooling/isothermal schedules were identical
for the two FSCRs.

Efect of the Mn(Ac)2/PC ratio on depolymerization yield of PC at diferent temperatures
Efect of the Mn(Ac)2/PC ratio on BPA and phenol yields at diferent temperatures

Efect of reaction time on BPA yield at diferent temperatures
Efect of reaction time on phenol yield at diferent temperatures
Efect of reaction time on depolymerization yield of PC at diferent temperatures


A new method for determining the volume expansion factor of CO2 + petroleum model
compounds
The traditional methods for expansion
A new method for determining volume expansion of CO2 + petroleum model compounds


Fixed PVT method Variable PVT method
In the fixed PVT method, certain amount of organic(s) and excess amount of CO2 were both loaded into the PVT cell successively. When the pressure in the cell kept as constant at certain temperature, the system was considered to have reached the thermodynamic equilibrium. Then, the volume of the CO2 + organic(s) system was measured.
In the variable PVT method, a certain amount of organic(s) and CO2 were loaded into the PVT cell, and increased the pressure to turn the sample into single phase. Then, continuous or discrete depressurize to obtain the pressure/volume curve about the CO2 + organic(s) system. Both the saturation pressure and the volume could be read from its transitioning point.

All of these traditional PVT methods had a high reagents consumption and temperature gradient. The fixed PVT method was easy to cause the vaporization of organic(s) at higher temperatures. The variable PVT method was hard to determine the transitioning point at high CO2 molar fraction and the CO2 + organic(s) system was easy to oversaturation at low temperatures.

A new method using a fused silica capillary reactor (FSCR), combined with heating-cooling stage, pressure generator, and co-focal Raman spectrometer has been applied to measuring the volume expansion of CO2 + petroleum model compounds. This method using micrometer to measure the volume accurately, water seal to prevent the vaporization of organic(s), a microreactor to decrease the temperature gradient and Raman spectroscopy to ensure system reached phase equilibrium, which is shown to be efficient and generally better than the traditional PVT methods.

The schematic diagram of CO2 + petroleum model compounds volume expansion measuring system.
XXX
Vacuumpump
Pressuretransducer
Heating-cooling stage
Laser
Raman spectroscopy
FSCR
CO2
Tank
H2O Organic
FSCR
CO2
H2O Organicpressure generator�
before
after CO2


Experimental section A
30 40 50 60 70 80
R2=0.9998
Temperature (oC)
Vol
ume
(a.u
.)
The procedure for measuring the volume expansion of organic with temperature at atmospheric pressure
Image of octane in FSCR showing octane, liquid water and air
The volume expansion curve of octane from 30 to 80 oC at atmospheric pressure

Experimental section BThe procedure for measuring the volume expansion of CO2 + octane system with temperature at diverse pressure
(a) Image of CO2 + octane system without water seal in FSCR, showing octane and CO2, (b) Image of CO2 + octane system in FSCR before experiment, showing
octane, water and CO2, (c) Image of CO2 + octane system in FSCR after experiment, positions 1 to 3 indicate the spots for Raman spectroscopy analyses
(a)
(b)
(c)

1500 2000 2500 3000 3500 4000
without water seal
position 3
position 2
position 1
Wavenumber (cm-1)
Inte
nsity
(a.u
.)
C O 2 Ferm i dyadνC -H stretching bandν
The Raman spectra of water in FSCR from 1 to 10 MPa at 80 oC and from 40 to 80 oC at 8 MPa.
Raman spectra of CO2 + octane system at 60 oC, 8 MPa
As shown in figure, the Raman spectra of water only contain the H–O–H bending band at 1629 cm–1, the O–H stretching band in the region of 2800–3800 cm–1, and the CO2 Fermi dyad at 1280 cm–1 and 1385 cm–1 during the whole procedure, indicating that octane was not detected in water
The Raman spectra collected from three different positions in the FSCR showed the same relative band intensities between CO2 Fermi dyad and the C–H stretching band of octane at 1280 cm–1, 1385 cm–1 and 2800–3000 cm–1, indicating that CO2 + octane system reached phase equilibrium becomes a homogeneous solutions in FSCR
0 2 4 6 8 10
1
3
5
7
9
35 oC Yang et al.
45 oC Yang et al.
60 oC Yang et al.
70 oC Yang et al.
30 oC
40 oC
50 oC
60 oC
70 oC
80 oC
V
olum
e ex
pans
ion
fact
or (V
T,P / V
T)
Pressure (MPa)0 2 4 6 8 10
0
2
4
6
8 30 oC
40 oC
50 oC
60 oC
70 oC
80 oC
νν
CO
2 /
C-H
Peak
hei
ght r
atio
(
)
Pressure (MPa)
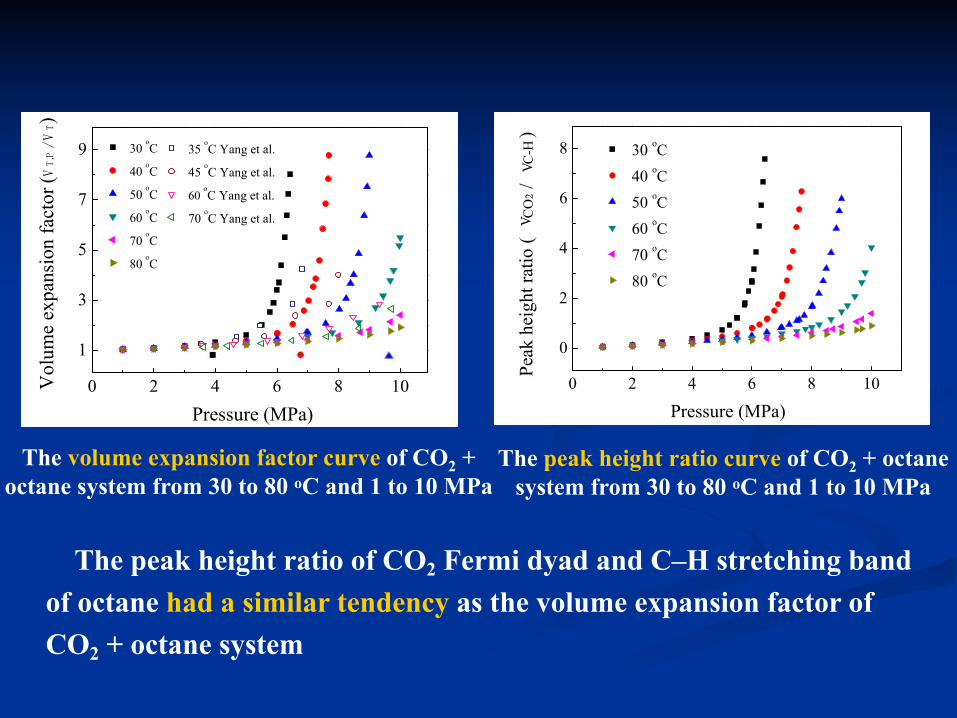
The volume expansion factor curve of CO2 + octane system from 30 to 80 oC and 1 to 10 MPa
The peak height ratio curve of CO2 + octane system from 30 to 80 oC and 1 to 10 MPa
The peak height ratio of CO2 Fermi dyad and C–H stretching band of octane had a similar tendency as the volume expansion factor of CO2 + octane system

0 2 4 6 8 10
1
3
5
7
9 30 oC40 oC50 oC60 oC70 oC80 oC
Vol
ume
expa
nsio
n fa
ctor
(VT,P / V
T)
Pressure (MPa)
1 2 3 4 5 6 7 8 9
0
2
4
6
8 30 oC R2 = 0.9990 40 oC R2 = 0.9992 50 oC R2 = 0.9993 60 oC R2 = 0.9997 70 oC R2 = 0.9998 80 oC R2 = 0.9995
Volume expansion factor (V T,P / V T )
νν
CO
2 /
C-H
Peak
hei
ght r
atio
(
)
The relationship between the volume expansion factor and peak height ratio of
CO2 + octane system
The relationship between volume expansion factor and peak height ratio can be represented by different quadratic equation at different temperature, with R2≥0.999. Indicating that peak height ratio could represent volume expansion factor indirectly.
0 2 4 6 8 10
1
3
5
7
9 30 oC
40 oC
50 oC
60 oC
70 oC
80 oC
V
olum
e ex
pans
ion
fact
or (V
T,P / V
T)
Pressure (MPa)
exp..
cal..
1 2 3 4 5 6 70
2
4
6
8
10
12
14
30 oC
Hexane Octane Decane Dodecane
Vol
ume
expa
nsio
n fa
ctor
Pressure (MPa)1 2 3 4 5 6 7 8 9
0
4
8
12
16
2040 oC
Hexane Octane Decane Dodecane
Vol
ume
expa
nsio
n fa
ctor
Pressure (MPa)
2 4 6 8 100
2
4
6
8
10
50 oC
Hexane Octane Decane Dodecane
Vol
ume
expa
nsio
n fa
ctor
Pressure (MPa)
2 4 6 8 10 12
1
2
3
4
5
6
760 oC
Hexane Octane Decane Dodecane
Vol
ume
expa
nsio
n fa
ctor
Pressure (MPa)2 4 6 8 10 12
1
2
3
4
5
6
770 oC
Hexane Octane Decane Dodecane
Vol
ume
expa
nsio
n fa
ctor
Pressure (MPa)2 4 6 8 10 12 14
1
2
3
4
5
6
780 oC
Hexane Octane Decane Dodecane
Vol
ume
expa
nsio
n fa
ctor
Pressure (MPa)
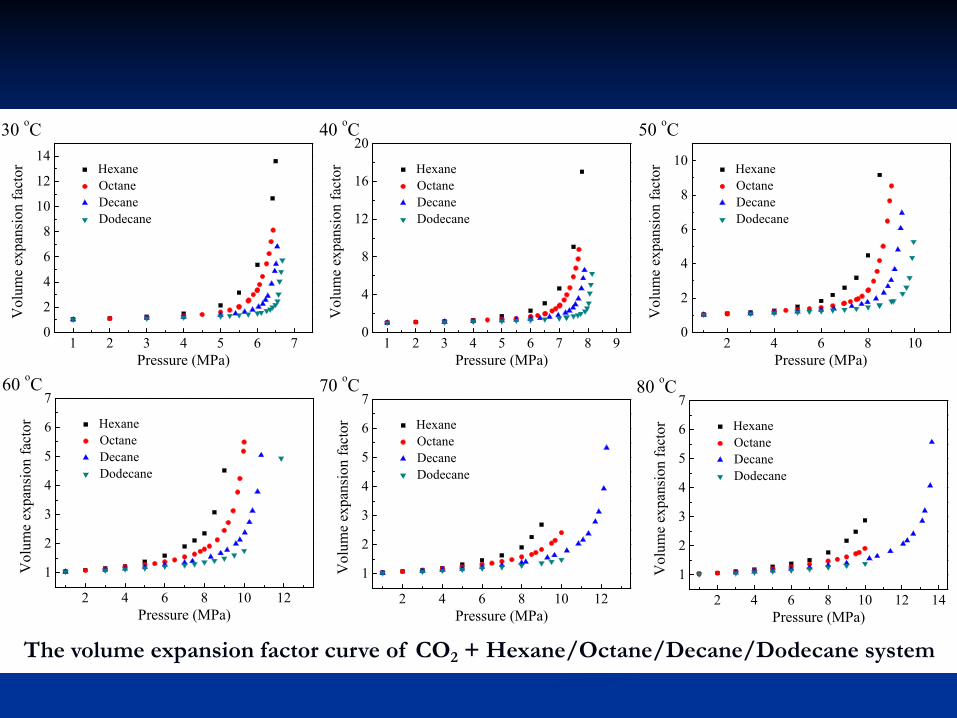
The volume expansion factor curve of CO2 + Hexane/Octane/Decane/Dodecane system
A
B
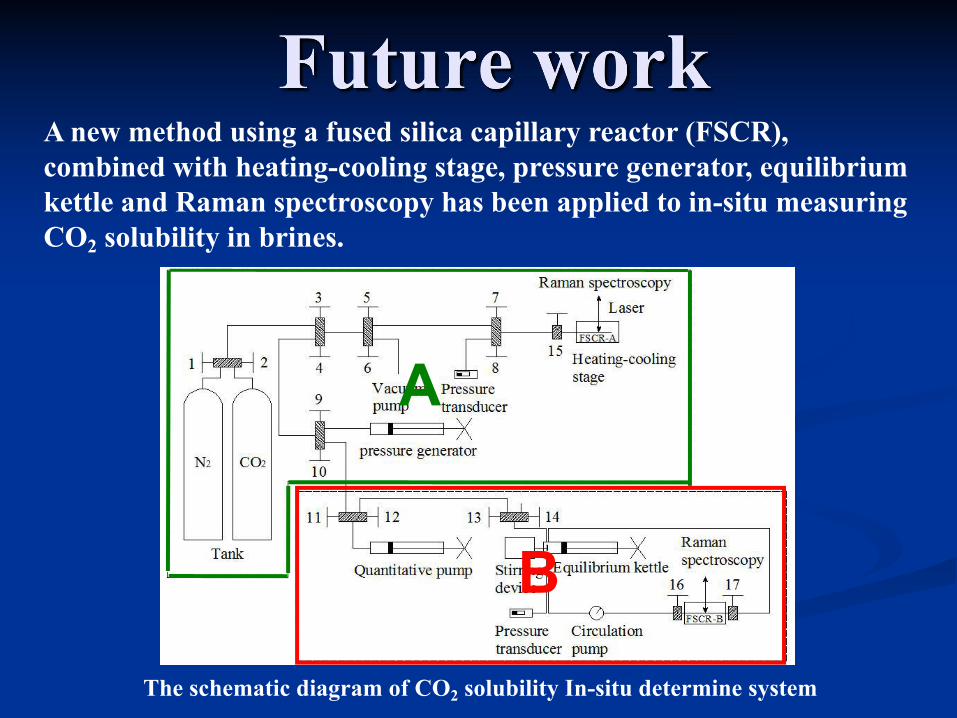
The schematic diagram of CO2 solubility In-situ determine system
A new method using a fused silica capillary reactor (FSCR), combined with heating-cooling stage, pressure generator, equilibrium kettle and Raman spectroscopy has been applied to in-situ measuring CO2 solubility in brines.


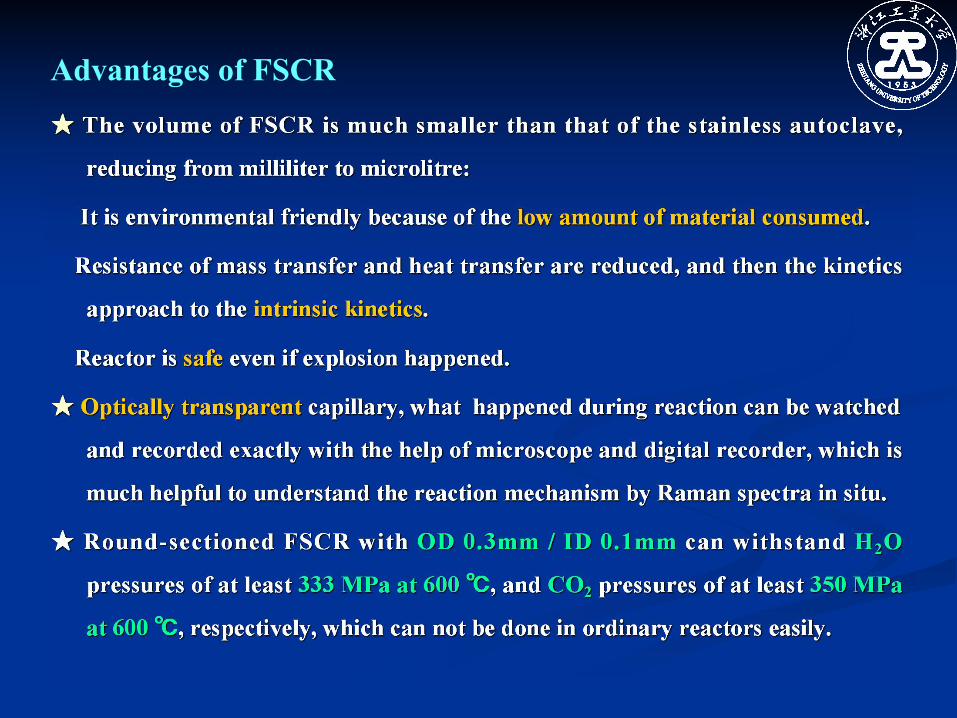
Advantages of FSCR

Ø [1] Ke Bei, Chuanyong Zhang, Junliang Wang, Kai Li, Jinghui Lyu, Jia Zhao, Jie Chen, I-Ming Chou, Zhiyan Pan. Solubility and dissolution mechanism of 4-chlorotoluene in subcritical water investigated in a fused silica capillary reactor by in situ Raman spectroscopy[J].Fluid Phase Equilibria, 2016, 425: 93-97.
Ø [2] Yuan Shen, Haiyan Wu, Yan Li, Zhiyan Pan. Coliquefaction of coal and polystyrene in supercritical water[J].International Journal of Green Energy, 2016, 13(3): 305-308.
Ø [3] Zhiyan Pan, Zhichao Hu, Yinghai Shi, Yuan Shen, Junliang Wang, I-Ming Chou. Depolymerization of polycarbonate with catalyst in hot compressed water in fused silica capillary and autoclave reactors[J]. RSC Advance, 2014, 4: 19992-19998.
Ø [4] Jiaojiao Jin, Junliang Wang, Yuan Shen, Chunmian Lin, Zhiyan Pan, I-Ming Chou. Visual and Raman spectroscopic observations of hot compressed water oxidation of guaiacol in fused silica capillary reactors[J]. The Journal of Supercritical Fluids, 2014, 95: 546-552.
Ø [5] Zhiyan Pan, Yanpei Ma, I-Ming Chou. Solubility of 2,4-Dichlorotoluene in Water Determined in Fused Silica Capillary Reactor by In-Situ Raman Spectroscopy[J]. AIChE Journal, 2013, 59(8): 2721–2725.
Ø [6] Wenjian He, Zanfang Jin, Junliang Wang, Zhiyan Pan. Decomposition of 1,1,1-Trichloroethane in Hot Compressed Water in Anti-corrosive Fused Silica Capillary Reactor and Raman Spectroscopic Measurement of CO2 Product[J]. Chemical Engineering Science, 2013, 94: 185-191.
The papers published in the last five years

Ø [7] Zhiyan Pan, Yinghai Shi, Li Liu, Zanfang Jin. Depolymerization of poly(butylene terephthalate) in sub- and supercritical ethanol in a fused silica capillary reactor or autoclave reactor[J]. Polymer Degradation and Stability, 2013, 98: 1287-1292.
Ø [8] Huicheng Liu, Zhiyan Pan. Visual Observations and Raman Spectroscopic Studies of Supercritical Water Oxidation of Chlorobenzene in an Anti-corrosive Fused-Silica Capillary Reactor [J]. Environmental Science & Technology, 2012, 46(6):3384-3389.
Ø [9] Yongjun Chen, Zanfang Jin, Zhiyan Pan. In situ Raman Spectroscopic study of hydrolysis of Carbon tetrachloride in hot compressed water in a fused silica capillary reactor[J]. The Journal of Supercritical Fluids, 2012, 72: 22-27.
Ø [10] Jing Gao, Zanfang Jin, Zhiyan Pan. Depolymerization of poly(trimethylene terephthalate) in hot compressed water at 240-320 °C[J], Polymer Degradation and Stability, 2012, 97: 1838-1843.
Ø [11] Fen Huang, Yuanyuan Huang, Zhiyan Pan. Depolymerization of ODPA/ODA Polyimide in a Fused Silica Capillary Reactor and Batch Autoclave Reactor from 320 to 350°C in Hot Compressed Water[J]. Industrial & Engineering Chemistry Research, 2012, 51(20):7001-7006.
Ø [12] Yingping Liu, Meixian Wang, Zhiyan Pan. Catalytic depolymerization of polyethylene threphylene in hot compressed water[J], Journal of Supercritical fluids, 2012, 62:226-231.
Ø [13] Yuan Shen, Zhiyan Pan. Co-liquefaction of Coal and Polypropylene or Polystyrene in Hot Compressed Water at 360-430°C[J]. Fuel Processing Technology, 2012, 104: 281-286.


THE END
THANKS
Ø感谢 国家自然科学基金委员会
National Natural Science Foundation of China
Zhiyan Pan 潘 志 彦[email protected]
Department of Environmental Engineering Zhejiang University of Technology, Hangzhou, China
浙江工业大学