visual fuel load guide
TRANSCRIPT

Visual Fuel Load Guidefor the Swan Coastal Plain and Darling Scarp
Environmental Protection Branch
August 2015

Environmental Protection Branch
Department of Fire and Emergency Services, Western Australia
© Department of Fire and Emergency Services, Western Australia
20 Stockton Bend, Cockburn Central, Western Australia, 6164
© Emergency Management Australia,
Australian Emergency Management Institute, Mt Macedon, Victoria 3441
August 2015 – Third Edition
ISBN 978-09872070-7-4
Acknowledgements
The original document was compiled with the fi nancial support of
Emergency Management Australia.
Disclaimer
The information contained in this publication is provided by the Department of Fire and
Emergency Services (DFES) voluntarily as a public service. This brochure has been prepared
in good faith and is derived from sources believed to be reliable and accurate at the time of
publication. Nevertheless, the reliability and accuracy of the information cannot be guaranteed
and DFES expressly disclaims liability for any act or omission done or not done in reliance on
the information and for any consequences, whether direct or indirect, arising from such act or
omission. This publication is intended to be a guide only and readers should obtain their own
independent advice and make their own necessary enquiries.
Visual Fuel Load Guidefor the Swan Coastal Plain and Darling Scarp

ContentsIntroduction 2
Methods of fuel sampling 3
How to use this Guide 4
Limitations of this Guide 4
0–5 tonnes scrub per hectare 5
5–10 tonnes scrub per hectare 17
10–15 tonnes scrub per hectare 26
15–20 tonnes scrub per hectare 40
20–25 tonnes scrub per hectare 45
25–30 tonnes scrub per hectare 46
Glossary 48
Appendix 1: Litter depth and weight 49
VISUAL FUEL LOAD GUIDE FOR THE SWAN COASTAL PLAIN AND DARLING SCARP2
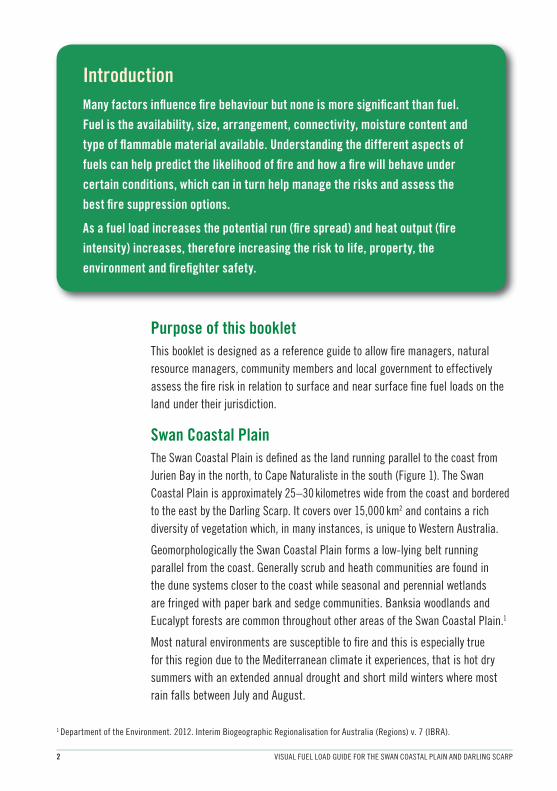
Introduction
Many factors infl uence fi re behaviour but none is more signifi cant than fuel.
Fuel is the availability, size, arrangement, connectivity, moisture content and
type of fl ammable material available. Understanding the different aspects of
fuels can help predict the likelihood of fi re and how a fi re will behave under
certain conditions, which can in turn help manage the risks and assess the
best fi re suppression options.
As a fuel load increases the potential run (fi re spread) and heat output (fi re
intensity) increases, therefore increasing the risk to life, property, the
environment and fi refi ghter safety.
Purpose of this booklet
This booklet is designed as a reference guide to allow fi re managers, natural
resource managers, community members and local government to effectively
assess the fi re risk in relation to surface and near surface fi ne fuel loads on the
land under their jurisdiction.
Swan Coastal Plain
The Swan Coastal Plain is defi ned as the land running parallel to the coast from
Jurien Bay in the north, to Cape Naturaliste in the south (Figure 1). The Swan
Coastal Plain is approximately 25–30 kilometres wide from the coast and bordered
to the east by the Darling Scarp. It covers over 15,000 km2 and contains a rich
diversity of vegetation which, in many instances, is unique to Western Australia.
Geomorphologically the Swan Coastal Plain forms a low-lying belt running
parallel from the coast. Generally scrub and heath communities are found in
the dune systems closer to the coast while seasonal and perennial wetlands
are fringed with paper bark and sedge communities. Banksia woodlands and
Eucalypt forests are common throughout other areas of the Swan Coastal Plain.1
Most natural environments are susceptible to fi re and this is especially true
for this region due to the Mediterranean climate it experiences, that is hot dry
summers with an extended annual drought and short mild winters where most
rain falls between July and August.
1 Department of the Environment. 2012. Interim Biogeographic Regionalisation for Australia (Regions) v. 7 (IBRA).

VISUAL FUEL LOAD GUIDE FOR THE SWAN COASTAL PLAIN AND DARLING SCARP 3
Methods of fuel samplingThe method used in this guide to calculate surface (leaves, twigs, bark and other fi ne fuel lying on
the ground, predominantly horizontal in orientation) and near surface (live and dead fuel, including
suspended leaves, bark or twigs, effectively in touch with the ground but not lying on it, with a mixture
of vertical and horizontal orientation) fi ne fuel loads is based on a 1m2 quadrat fuel sample. Sampling
was undertaken at a subset of locations on the Swan Coastal Plain of Western Australia. These locations
were chosen to ensure samples were taken across different vegetation and soil types. A one metre
square area is marked over an area of vegetation considered representative of the vegetation community
within the sample site. All dead vegetation from within the quadrat, which is less than 6 mm in diameter
(dead material) and all live vegetation that is less than 3 mm in diameter is removed and oven dried to
determine the dry weight of the sample. The dried weight of the vegetation is extrapolated to tonnes per
hectare (t/ha). The one metre white square in the photos (shown overleaf) represents a typical quadrat
sample area of vegetation at each sample site.
Fuel load calculation
Dried weight (grams per metre2) / 100 = fuel load (t/ha)
Figure 1. Swan Coastal Plain1

VISUAL FUEL LOAD GUIDE FOR THE SWAN COASTAL PLAIN AND DARLING SCARP4
How to use this GuideThis guide is intended to assist the user in visually determining surface and near surface fuel loads.
This guide is a non-destructive means of assessing surface and near surface fuel loads in that
vegetation does not need to be removed in order to gain an estimation of the fuel load for a particular
area. By visually assessing the vegetation with reference to this guide, and where possible obtaining
a leaf litter depth (refer to Appendix 1), estimation of the surface and near surface fuel load of the
represented vegetation can be made.
Where leaf litter is present, it must be measured and added to the scrub fuel load to obtain a total fuel
load. The tables to convert the litter depth to tonnes per hectare are in the rear pages of this guide.
The images depicted in this guide indicate only the level of scrub fuel unless otherwise stated. Where
leaf litter is present, the additional fuel load is indicated in the text above the photo.
Limitations of this GuideThis guide only considers surface and near surface fuels and does not consider elevated or bark fuels.
Near surface and surface fuels will burn in any ground fi re, regardless of intensity and therefore are an
important determinant of whether a fi re will ignite and carry. Additionally, some fuel loads represented
in this guide were taken out of the fi re season and therefore the vegetation will appear greener than
during the months of the fi re season.

VISUAL FUEL LOAD GUIDE FOR THE SWAN COASTAL PLAIN AND DARLING SCARP 5
0–
5 t/
ha
0.5 t/ha Sparse pasture on degraded land with little overstorey.
0–5 tonnes scrub per hectare
March 2006

VISUAL FUEL LOAD GUIDE FOR THE SWAN COASTAL PLAIN AND DARLING SCARP6
0.9 t/ha Mixture of scrub fuels and grasses. Leaf litter represents an additional 27.1 t/ha of fuel.
0–
5 t/
ha
January 2007

VISUAL FUEL LOAD GUIDE FOR THE SWAN COASTAL PLAIN AND DARLING SCARP 7
1.8 t/ha Grass fuel understorey. Leaf litter represents an additional 10.5 t/ha of fuel.
0–
5 t/
ha
August 2014

0–
5 t/
ha
VISUAL FUEL LOAD GUIDE FOR THE SWAN COASTAL PLAIN AND DARLING SCARP8
2 t/ha Grass fuel under a sparse tree crown overstorey. The grass is relatively short.
October 2008

VISUAL FUEL LOAD GUIDE FOR THE SWAN COASTAL PLAIN AND DARLING SCARP 9
2.3 t/ha Understorey of native sedges and shrubs.
0–
5 t/
ha
January 2007

0–
5 t/
ha
VISUAL FUEL LOAD GUIDE FOR THE SWAN COASTAL PLAIN AND DARLING SCARP10
2.4 t/ha Seasonally inundated wetland with very light cover of native sedges.
January 2007
VISUAL FUEL LOAD GUIDE FOR THE SWAN COASTAL PLAIN AND DARLING SCARP 11
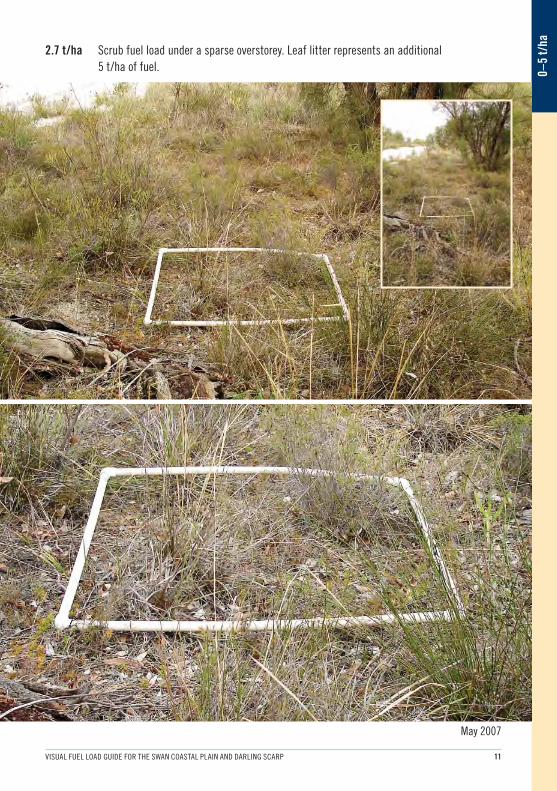
2.7 t/ha Scrub fuel load under a sparse overstorey. Leaf litter represents an additional
5 t/ha of fuel. 0–
5 t/
ha
May 2007

VISUAL FUEL LOAD GUIDE FOR THE SWAN COASTAL PLAIN AND DARLING SCARP12
0–
5 t/
ha
3.3 t/ha Light understorey of introduced grasses and open vegetation with minimal overstorey.
January 2007

VISUAL FUEL LOAD GUIDE FOR THE SWAN COASTAL PLAIN AND DARLING SCARP 13
4 t/ha Light understorey of native sedges and grasses.
0–
5 t/
ha
November 2012

VISUAL FUEL LOAD GUIDE FOR THE SWAN COASTAL PLAIN AND DARLING SCARP14
4.2 t/ha Sparse understorey of introduced grasses and small native shrubs.
June 2009
0–
5 t/
ha

VISUAL FUEL LOAD GUIDE FOR THE SWAN COASTAL PLAIN AND DARLING SCARP 15
4.4 t/ha Light understorey of native grasses. Leaf litter represents an additional 4.7 t/ha of fuel.
0–
5 t/
ha
May 2011

VISUAL FUEL LOAD GUIDE FOR THE SWAN COASTAL PLAIN AND DARLING SCARP16
0–
5 t/
ha
4.9 t/ha Sparse coastal shrub vegetation with no overstorey.
July 2013

VISUAL FUEL LOAD GUIDE FOR THE SWAN COASTAL PLAIN AND DARLING SCARP 17
5–
10 t
/ha
5 t/ha Light to moderate understorey of scrub and grass tress. Leaf litter represents an
additional 8.3 t/ha of fuel.
5–10 tonnes scrub per hectare
December 2014

VISUAL FUEL LOAD GUIDE FOR THE SWAN COASTAL PLAIN AND DARLING SCARP18
5–
10 t
/ha
5.5 t/ha Moderate understorey of introduced grasses with a sparse regrowth overstorey.
June 2009

VISUAL FUEL LOAD GUIDE FOR THE SWAN COASTAL PLAIN AND DARLING SCARP 19
5.9 t/ha Light understorey of native sedges and grass trees. Leaf litter represents an additional
4.9 t/ha of fuel.
5–
10 t
/ha
August 2014

5–
10 t
/ha
VISUAL FUEL LOAD GUIDE FOR THE SWAN COASTAL PLAIN AND DARLING SCARP20
6.9 t/ha Light understorey of native grasses and grass trees. Leaf litter represents an additional
19.2 t/ha of fuel.
February 2012

VISUAL FUEL LOAD GUIDE FOR THE SWAN COASTAL PLAIN AND DARLING SCARP 21
5–
10 t
/ha
7.5 t/ha Light understorey of grass trees. Leaf litter represents an additional 11 t/ha of fuel.
February 2012

VISUAL FUEL LOAD GUIDE FOR THE SWAN COASTAL PLAIN AND DARLING SCARP22
7.8 t/ha Light to moderate understorey of shrubs and grass trees. Leaf litter represents an
additional 17.6 t/ha of fuel.
5–
10 t
/ha
November 2011

VISUAL FUEL LOAD GUIDE FOR THE SWAN COASTAL PLAIN AND DARLING SCARP 23
8 t/ha Understorey of native sedges and shrubs.
5–
10 t
/ha
January 2007

VISUAL FUEL LOAD GUIDE FOR THE SWAN COASTAL PLAIN AND DARLING SCARP24
5–
10 t
/ha
8.1 t/ha Understorey of clumped native sedges with an open overstorey.
January 2007

VISUAL FUEL LOAD GUIDE FOR THE SWAN COASTAL PLAIN AND DARLING SCARP 25
9.2 t/ha Mixture of scrub fuels and grasses. Leaf litter represents an additional 6 t/ha of fuel.
5–
10 t
/ha
January 2012

VISUAL FUEL LOAD GUIDE FOR THE SWAN COASTAL PLAIN AND DARLING SCARP26
10–
15 t
/ha
10.5 t/ha Light to moderate understorey of native shrubs with some sedges.
10–15 tonnes scrub per hectare
February 2007

VISUAL FUEL LOAD GUIDE FOR THE SWAN COASTAL PLAIN AND DARLING SCARP 27
10.7 t/ha Light to moderate understorey of shrub, scrub and grasses. Leaf litter represents an
additional 10.2 t/ha of fuel.
10–
15 t
/ha
November 2011

VISUAL FUEL LOAD GUIDE FOR THE SWAN COASTAL PLAIN AND DARLING SCARP28
11 t/ha Moderate understorey of native scrub and grasses.
10–
15 t
/ha
July 2013

VISUAL FUEL LOAD GUIDE FOR THE SWAN COASTAL PLAIN AND DARLING SCARP 29
11.1 t/ha Scrub fuel load associated with the open Jarrah forest.
10–
15 t
/ha
June 2009

VISUAL FUEL LOAD GUIDE FOR THE SWAN COASTAL PLAIN AND DARLING SCARP30
11.2 t/ha Bracken fern with introduced grasses and blackberry bushes from 90–120 mm high.
10–
15 t
/ha
January 2007

VISUAL FUEL LOAD GUIDE FOR THE SWAN COASTAL PLAIN AND DARLING SCARP 31
11.9 t/ha Moderate understorey of grass trees. Leaf litter represents an additional 11.9 t/ha of fuel.
10–
15 t
/ha
February 2012

VISUAL FUEL LOAD GUIDE FOR THE SWAN COASTAL PLAIN AND DARLING SCARP32
12.5 t/ha Moderate understorey of native scrub.
10–
15 t
/ha
November 2011

VISUAL FUEL LOAD GUIDE FOR THE SWAN COASTAL PLAIN AND DARLING SCARP 33
12.7 t/ha Dense understorey of native grasses and sedges. Leaf litter represents an additional
10 t/ha of fuel.
10–
15 t
/ha
January 2011

VISUAL FUEL LOAD GUIDE FOR THE SWAN COASTAL PLAIN AND DARLING SCARP34
12.8 t/ha Dense understorey of introduced grasses and sedges.
10–
15 t
/ha
January 2007

VISUAL FUEL LOAD GUIDE FOR THE SWAN COASTAL PLAIN AND DARLING SCARP 35
10–
15 t
/ha
12.9 t/ha Moderate understorey of introduced weeds and grasses to 900 mm in height.
January 2007

VISUAL FUEL LOAD GUIDE FOR THE SWAN COASTAL PLAIN AND DARLING SCARP36
13.1 t/ha Moderate understorey of introduced grasses and a Zamia Palm. Leaf litter represents an
additional 11.1 t/ha of fuel.
10–
15 t
/ha
November 2011

13.8 t/ha Sparse coastal shrub vegetation with no overstorey.
VISUAL FUEL LOAD GUIDE FOR THE SWAN COASTAL PLAIN AND DARLING SCARP 37
10–
15 t
/ha
August 2013

VISUAL FUEL LOAD GUIDE FOR THE SWAN COASTAL PLAIN AND DARLING SCARP38
10–
15 t
/ha
14.1 t/ha Dense understorey of native grasses and grass trees. Leaf litter represents an additional
6.7 t/ha of fuel.
December 2012

VISUAL FUEL LOAD GUIDE FOR THE SWAN COASTAL PLAIN AND DARLING SCARP 39
10–
15 t
/ha
14.9 t/ha Moderate understorey of native sedges with open overstorey.
January 2007

VISUAL FUEL LOAD GUIDE FOR THE SWAN COASTAL PLAIN AND DARLING SCARP40
15–
20 t
/ha
15–20 tonnes scrub per hectare
15 t/ha Dense wetland sedges.
June 2013

VISUAL FUEL LOAD GUIDE FOR THE SWAN COASTAL PLAIN AND DARLING SCARP 41
15–
20 t
/ha
15.6 t/ha Heavy understorey of introduced grasses. Note the multiple years of grass fuels in the area.
June 2013

VISUAL FUEL LOAD GUIDE FOR THE SWAN COASTAL PLAIN AND DARLING SCARP42
16.3 t/ha Moderate to dense understory of scrub vegetation. Leaf litter represents an additional
6.8 t/ha of fuel.
November 2013
15–
20 t
/ha

VISUAL FUEL LOAD GUIDE FOR THE SWAN COASTAL PLAIN AND DARLING SCARP 43
15–
20 t
/ha
17.4 t/ha Very dense fuel load of native scrub.
May 2011

VISUAL FUEL LOAD GUIDE FOR THE SWAN COASTAL PLAIN AND DARLING SCARP44
15–
20 t
/ha
19.1 t/ha Very dense coastal shrubs and grasses with no overstorey.
April 2008

VISUAL FUEL LOAD GUIDE FOR THE SWAN COASTAL PLAIN AND DARLING SCARP 45
20–
25 t
/ha
20–25 tonnes scrub per hectare
20 t/ha Very dense coastal shrub vegetation with no overstorey.
April 2008

VISUAL FUEL LOAD GUIDE FOR THE SWAN COASTAL PLAIN AND DARLING SCARP46
25–
30 t
/ha
25 t/ha Very dense vegetation of native sedges and shrubs to 900 mm in height.
January 2007
25–30 tonnes scrub per hectare

VISUAL FUEL LOAD GUIDE FOR THE SWAN COASTAL PLAIN AND DARLING SCARP 47
25–
30 t
/ha
25.3 t/ha Native scrub and grass trees with no overstorey.
November 2011

VISUAL FUEL LOAD GUIDE FOR THE SWAN COASTAL PLAIN AND DARLING SCARP48
Glossary
Available fuel load The amount of fuel in the area that will burn under the current or prescribed
conditions.
Fuel load The oven dry weight of fi ne fuel (<6 mm in diameter dead material, <3 mm live)
per unit area—commonly expressed as tonnes per hectare.
Introduced species Non-native species (not occurring naturally in the area).
Leaf litter The accumulated layer of leaves on the ground from vegetation, generally
considered as a component of the surface fuels.
Near surface Live and dead fuel, including suspended leaves, bark or twigs, effectively
in touch with the ground but not lying on it, with a mixture of vertical and
horizontal orientation.
Overstorey The topmost layer of a forest community, generally the tree crown (or canopy)
layer.
Surface fuels Litter fuels made up of leaves, twigs, bark and other fi ne fuel lying on the
ground, predominately horizontal in orientation.
Total fuel load The total amount of fi ne fuel in the area.
Understorey The vegetation layer between the overstorey or canopy and the ground layer of a
forest or woodland community formed by shade tolerant trees or shrubs.

VISUAL FUEL LOAD GUIDE FOR THE SWAN COASTAL PLAIN AND DARLING SCARP 49
Appendix 1: Litter depth and weightTable 1. Relationship between Litter Depth and Total Litter Weight in Forest Areas.2
Table includes twigs up to 10 mm diameter.
Litter
depth
(mm)
Forest type
Karri dominant
Mixed M., J., K.
Jarrah dominant
P. pinaster needle
P. radiata needle
Wandoo
Litter weight (tonnes/ha)
5 3.2 2.6 2.7 2.5 2.8 4.4
10 6.4 5.1 5.3 4.9 5.2 8.8
15 9.6 7.7 8.0 7.4 7.2 13.2
20 13.0 10.3 11.0 10.0 9.0 17.6
25 16.0 13.0 13.0 12.4 10.7 22.0
30 19.0 15.0 16.0 15.0 12.0 26.4
35 23.0 17.0 19.0 17.0 14.0 30.0
40 26.0 19.0 21.0 20.0 16.0
45 29.0 22.0 24.0 22.0 18.0
50 32.0 25.0 27.0 25.0 20.0
55 35.0 27.0 29.0 27.0 22.0
60 39.0 29.0 24.0
65 42.0 31.0 26.0
70 45.0 33.0 28.0
80 51.0 37.0 31.0
90 58.0 41.0 34.0
100 64.0 45.0 37.0
Enter table with litter depth and forest type and read off the total litter weight.
Leaf litter depth varies depending on the type and age of overstorey vegetation including the period
between burning times. Older fuel will generally have a greater amount of leaf litter available.2 Sneeuwjagt R. J. and G. B. Peet. 1985. Forest Fire Behaviour Tables for Western Australia. third ed. Department of Conservation and
Land Management, Perth, WA.

VISUAL FUEL LOAD GUIDE FOR THE SWAN COASTAL PLAIN AND DARLING SCARP50
Table 2. Relationship between Litter Depth and Total Litter Weight in Banksia Woodlands.3
Litter depth (mm) Litter weight
(tonnes/ha)
5 3
10 6
15 8
20 11
25 14
30 16
35 19
40 21
Table includes dead material (leaves and twigs) less than 6 mm in diameter and all live vegetation
that is less than 3 mm in diameter. To calculate the litter weight using Table 2, choose the closest
measured litter depth and read off the total litter weight.
Methodology to measure leaf litter
Leaf litter depth of Banksia litter can be determined using the following steps:
1. Using your fi nger or probe, carefully clear away the leaf litter down to the mineral earth to create
a hole of around 4 cm in length.
2. Ensure the litter on one side remains completely undisturbed.
3. Remove any large obstructions such as twigs, rocks or nuts greater than 6 mm diameter from
where the litter depth gauge will rest.
4. Push the base of the gauge downwards onto the litter, with as much force as it would take to
hold a tennis ball under water.
5. Press the slide of the litter depth gauge fi rmly against the soil without pushing into the soil
surface. Firmly hold the slide against the case and take note of the measurement revealed on the
ruler.
3 Environmental Protection Branch. 2015. Fuel Loads in Banksia Woodlands. Department of Fire and Emergency Services, Perth, WA.

VISUAL FUEL LOAD GUIDE FOR THE SWAN COASTAL PLAIN AND DARLING SCARP 51
Notes

VISUAL FUEL LOAD GUIDE FOR THE SWAN COASTAL PLAIN AND DARLING SCARP52
Notes
