visual scanning training for older drivers: a literature
TRANSCRIPT

DOT HS 812 514 April 2018
Visual Scanning Training For Older Drivers: A Literature Review

Disclaimer
This publication is distributed by the U.S. Department of Transportation, National Highway Traffic Safety Administration, in the interest of information exchange. The opinions, findings, and conclusions expressed in this publication are those of the authors and not necessarily those of the Department of Transportation or the National Highway Traffic Safety Administration. The United States Government assumes no liability for its contents or use thereof. If trade or manufacturers’ names are mentioned, it is only because they are considered essential to the object of the publication and should not be construed as an endorsement. The United States Government does not endorse products or manufacturers.
Suggested APA Format Citation:
Lococo, K. H., & Staplin, L. (2018, April). Visual scanning training for older drivers: A literature review (Report No. DOT HS 812 514). Washington, DC: National Highway Traffic Safety Administration.

i
Technical Report Documentation Page
Form DOT F 1700.7 (8-72) Reproduction of completed page authorized
1. Report No. DOT HS 812 514
2. Government Accession No.
3. Recipient's Catalog No.
4. Title and Subtitle Visual Scanning Training for Older Drivers: A Literature Review
5. Report Date April 2018 6. Performing Organization Code
7. Authors Kathy H. Lococo and Loren Staplin
8. Performing Organization Report No.
9. Performing Organization Name and Address TransAnalytics, LLC 336 West Broad Street Quakertown, PA 18951
10. Work Unit No. (TRAIS)
11. Contract or Grant No. Contract No. DTNH2216D00018, Task Order No. 02
12. Sponsoring Agency Name and Address National Highway Traffic Safety Administration 1200 New Jersey Avenue, SE Washington, DC 20590
13. Type of Report and Period Covered Literature Review
14. Sponsoring Agency Code NPD-320
15. Supplementary Notes Dr. Kathy Sifrit was the NHTSA Task Order manager on this project. 16. Abstract This literature review focuses on older drivers’ visual scanning ability and on evaluations of training in visual scanning skills for older adults, updating a previous review of studies published from 1997 to 2008 describing age-related functional changes (Staplin, Lococo, Martell, & Stutts, 2012). Researchers performed searches in TRID, PubMed/Medline, PsycINFO, and AgeLine for literature published from 2005 to 2016. The search for studies conducted during that 11-year period yielded the 27 relevant studies in four broad categories:
• 7 describing age differences in visual attention and visual scanning ability; • 6 examining age differences in drivers’ visual scanning behavior;
o 3 on-road and 3 in simulators • 8 that implemented training to improve older driver’s visual search and scanning abilities; and
o 4 driving simulator training protocols, 2 individual video-based training protocols, and 2 occupational-therapist-based training protocols
• 6 on training to improve older adults’ visual scanning abilities in a non-driving context. o 2 evaluated transfer of training to driving
An annotated bibliography in the Appendix provides more detail on the subset of 16 studies performed in a driving context or that used driving performance as an outcome measure (i.e., those most relevant for supporting revisions to a visual training protocol and in developing data collection designs for evaluating training effectiveness). This subset includes the 6 studies on driver age differences in visual scanning behavior, the 8 studies on training to improve older drivers’ visual scanning ability, and 2 of the 6 studies of training in a non-driving context.
17. Key Words older driver, older adult, driver age, visual scanning, visual search, attention switching, visual cognition, training, education, driving
18. Distribution Statement No restrictions. This document is available to the public through the National Technical Information Service, Springfield, VA 22161, www.ntis.gov.
19. Security Classif. (of this report) Unclassified
20. Security Classif. (of this page) Unclassified
21. No. of Pages 74
22. Price

ii
Table of Contents
Introduction ..................................................................................................................................... 1
Age Differences in Abilities Underlying Visual Scanning ............................................................. 3
Driver Age Differences in Visual Scanning Behavior .................................................................... 8
In-Context Training to Improve Older Drivers’ Visual Scanning Ability .................................... 16
Out-of-Context Training to Improve Older Adults’ Visual Scanning Ability .............................. 25
References ..................................................................................................................................... 32
Appendix: Annotated Bibliography ........................................................................................... A-1
List of Tables
Table 1. Overview of OT-Administered Training Program Activities ......................................... 24

1
Introduction
Exposure-based analyses of crash risk have consistently shown increased rates of involvement for drivers as they age into their 70s, 80s and beyond, and further, have identified particular situations where older drivers are most at risk (Stutts, Martell, & Staplin, 2009). These situations often share elevated driving task demands with respect to visual search and visual attention, such as maneuvers at intersections and when merging.
Staplin, Lococo, Martell, and Stutts (2012) reviewed literature published from 1997 to 2008 describing age-related functional changes. They noted that two complementary pre-attentional and attentional functions are essential to safe driving performance and have been associated with significant age differences. The first, selective attention, involves the earliest stage of visual attention used to quickly capture and direct attention to the most relevant events in a driving scene. Because of the vast quantity of information that is continuously available in the driving environment, the ability to selectively attend to information that is of primary relevance for maintaining driving function is key. The second, divided attention, pertains to the ability to monitor and respond effectively to multiple sources of information at the same time. For example, a driver entering a freeway must track the curvature of the ramp and steer appropriately, keep a safe distance behind the car ahead, and check for gaps in traffic on the highway, while at the same time accelerating just enough to permit a smooth entry into the traffic stream.
Driving involves navigating complex environments with moving and potentially distracting stimuli and requires dividing one's attention between central and peripheral vision. Furthermore, older adults tend to process information more slowly than younger adults, and this slowing not only transcends the slower reaction times often observed in older adults but may, in part, explain them (Waugh, Thomas, & Fozard, 1978; Salthouse & Somberg, 1982; Byrd, 1984). Ball, Beard, Roenker, Miller, & Griggs (1988) introduced the useful field of view test, a measure of visual information processing speed consisting of four subtests that increase in cognitive complexity. The test assesses the ability to rapidly detect and localize targets, divide visual attention across central and peripheral locations, and detect relevant targets within a visually cluttered array. As such, it assesses higher-order cognitive abilities including visual search and attentional (dis)engagement. Tests assessing the useful field of view appear to be better predictors of driving errors than standard visual field tests, with poorer performance on the useful field of view test associated with negative driving outcomes. In a meta-analysis of the relationship between useful field of view and driving performance in older adults, Clay, Wadley, Edwards, Roth, Roenker, and Ball (2005) found that the relationship was robust across multiple indices of driving performance (State-recorded crashes, on-road driving, and driving simulator performance) and research laboratories.
As age-related declines in visual attention and visual information processing and their role in safe driving have become better understood, researchers and practitioners have developed different strategies and techniques that seek to ameliorate these deficits. This literature review focused on older drivers’ visual scanning ability and on evaluations of visual scanning training for older adults. Researchers performed searches in TRID, PubMed/Medline, PsycINFO, and AgeLine for literature published from 2005 to 2016 using combinations of the following terms (with asterisks indicating truncation):

2
• older driver* OR older adult* • age • visual scan* OR visual search* • attention switching • visual cognition • training OR education • driving
The search for studies conducted during the past 11 years uncovered 27 relevant studies across four broad categories. This report describes the studies within each category in four separate sections.
The first section focuses on seven studies describing age differences in visual attention and visual scanning ability. The second section reviews six studies (3 on-road and 3 simulator) examining age differences in drivers’ visual scanning behavior. The third section summarizes eight studies that implemented and evaluated training to improve older driver’s visual search and scanning abilities. The driver training evaluations included four driving simulator training protocols, two individual video-based training protocols, and two occupational therapist-based training protocols.
The final section of the literature review describes six studies on training to improve older adults’ visual scanning abilities in non-driving contexts. While computerized cognitive training programs have been found to improve performance on the specific cognitive task being trained, evidence that the improvements transfer to actual driving and other everyday functioning tasks is mixed (Mayhew, Robertson, & Vanlaar, 2014). As stated by Mayhew et al. (2014) in their review of computer-based cognitive training programs for older drivers,
“there is emerging evidence that computer-based cognitive training programs that operate in a driving context hold promise for improving older driver performance, and that these are more likely to have transfer effects that improve older driver performance than programs targeting basic underlying cognitive functions which fail to capture the complexities of driving and the important driving abilities that need to be mastered and maintained to drive safely.”
Of these six studies, only two —the speed-of-processing training studies—evaluated transfer to the driving task.
The Appendix contains an annotated bibliography with more detail on the subset of 16 studies performed in a driving context or that used driving performance as an outcome measure. This includes the six studies on driver age differences in visual scanning behavior, the eight studies on training to improve older drivers’ visual scanning ability, and the two speed of processing training studies.

3
Age Differences in Abilities Underlying Visual Scanning
The seven studies described in this section include five laboratory-based research protocols in a non-driving context, one driving simulator study, and one on-road driving study. The findings of these studies are consistent with earlier studies that have found age-related decrements in attentional visual field and declines in the ability to disengage visual attention (which may present as an attentional visual field decrement), both of which can place older drivers at risk. Several study authors suggested that these deficits could be remediated by advanced cuing and training in attention disengagement.
Hassan, Turano, Munoz, Munro, Roche, and West (2008). These researchers use the term “attentional visual field” (AVF) in referring to the size of the visual field over which a person can effectively divide their attention and extract visual information within a glance. These researchers conducted a study in a large population of older drivers to describe their AVF along the four major meridians (0°, 90°, 180°, and 270°) and to identify demographic, cognitive, and vision factors associated with AVF performance. Participants included 1,386 drivers ages 67 to 87. A custom program assessed the AVF extent out to 20° in a divided attention protocol, as follows: Participants fixated on a circular target in the center of the monitor and attended to two numbers simultaneously presented for 250 ms, one at the center of the circular target and the other located on one of four possible meridians eccentric to the central number. The numbers, between 0 and 9, were randomly selected. At the same time the numbers were presented, seven filled circles (distractors) were presented at the same eccentricity and with the same size as the eccentric number. The distractors were white against a black background. The distractors and peripheral target were arranged into eight evenly spaced radial spokes. Following the presentation of the target and distractors, a masking pattern was displayed. The widest angle out to 20° for which the participant had correct responses for the central and outer numbers and the location of the outer number was recorded in the vertical and horizontal meridians.
Results indicated that AVF extent along the horizontal meridian was significantly larger compared to the vertical meridian. In addition, male participants had a larger AVF compared to female participants, and AVF (overall, horizontal, and vertical) decreased with increases in age. For every year increase in age, the overall AVF extent decreased an average of 0.15°. Furthermore, overall AVF was significantly associated with cognitive functioning, such that for every point increase (better performance) in MMSE and Brief Test of Attention, the overall AVF extent increased by 0.09° and 0.34°, respectively, and for every 5 second increase in Trails B performance (poorer performance), AVF extent decreased by 0.09°. Visual function also significantly affected AVF performance. Overall AVF extent decreased on average by 0.37° for every line of visual acuity lost on the ETDRS chart and 1.05° per 5 points not detected in the central 20° radius visual field. Overall AVF extent increased by 0.58° for every three letters correctly identified on the Pelli-Robson Contrast Sensitivity Letter Chart (in the better eye).
Thirty-four percent of the participants had a symmetrically shaped AVF, meaning that the ratio between the horizontal and vertical AVF extent was between 0.8 and 1.2. The remainder had asymmetric AVF shape profiles. Of the 910 participants with an asymmetric shaped profile, 83% had a horizontal extent greater than their vertical extent. With every 5-year increase in age, there was an increase in percentage of participants with an asymmetric AVF shape where their horizontal extent was greater than their vertical extent. Poorer visual acuity, visual fields, and

4
Trails B performance were significantly associated with having a symmetrical AVF. The study authors state that this indicates that across individuals with the same AVF area, people with failing resources lose the ability to re-distribute their visual attention resources to maximize task performance, which results in a symmetric AVF shape.
Cosman, Lees, Lee, Rizzo, and Vecera (2011). These researchers proposed that people with age-related declines in useful field of view (UFOV) may not suffer from a decrease in attentional breadth and scope but instead from a deficit in attentional disengagement. This was termed “sticky attention,” which slows disengagement from its current locus. They stated that a disengagement deficit and corresponding UFOV decline have consequences for driving when operators must quickly shift attention between in-vehicle tasks and the environment, which requires disengagement from one item before attending to the other. Ten older drivers (mean age 79.1) with UFOV impairments and 10 older drivers (mean age 78.3) without UFOV impairments participated in the study. The UFOV-impaired group was comprised of participants with a score of 500 ms on Subtest 4 and Subtest 3 and 4 totals of 690 ms or greater.
Participants completed two tasks: a flanker interference task and a spatial cuing task. In the flanker interference task, participants focused attention at a fixation point and responded to the identity of a target letter (E or H) while trying to ignore the flanker letters on either side. At the beginning of each trial, a black fixation point appeared on a white background for 500 ms, followed by the stimulus array, which remained on the screen until participants responded. The stimulus array consisted of a single black target letter 1.0 degree by 1.3 degrees centered at fixation and two identical black flanker letters (one to the left and one to the right of the target letter) that were either congruent (e.g., E target/E flankers) or incongruent with the target (e.g., E target, H flankers). The flanker letters could appear at one of four eccentricities (1°, 2°, 4°, and 8°), and each flanker letter was scaled to match the size of the target letter, as the flanker appeared across the various eccentricities. All trial types were intermixed; each trial was equally likely to contain congruent or incongruent flankers, at any of the four eccentricities. Participants performed a 32- trial practice block, and then performed 6 blocks of 32 trials. Flanker interference effects were defined as the difference in response time (RT) between congruent and incongruent trials. The researchers found no difference between flanker interference in UFOV-impaired and unimpaired participants, indicating that UFOV decline may not be the result of attentional constriction. Attentional constriction theory would predict UFOV-impaired persons to show less of a flanker interference effect than unimpaired participants.
For the spatial cuing task, participants identified a single target that appeared at one of
two locations, either 5.0° to the left or right of a fixation point. Prior to the target presentation, a 0.4° diameter red dot appeared 5.0° from fixation (the center of a possible target location) for 100 ms either at the upcoming target location (valid cue) or the opposite location (invalid cue) with equal frequency. Following a fixed stimulus-onset asynchrony (SOA) of 100 ms, a target appeared until participants responded; the short SOA was used to minimize the possibility of eye movements to the cue. The target was a black Landolt square with a gap either in the top or bottom. Participants reported the location of the gap (top or bottom) as quickly and accurately as possible. Valid and invalid trials were intermixed. Participants performed a 24-trial practice block, and then performed 10 blocks of 24 trials. There was a significant difference between groups on invalid trials where UFOV-impaired participants responded significantly slower then

5
unimpaired participants. However, there was no between groups difference in response time to valid trials.
Based on their findings, the study authors suggested that people with UFOV impairments
have difficulty disengaging attention from a cued location, as shown by the significantly longer RTs to invalid trials compared with unimpaired participants. Also, the finding that impaired participants were not significantly slower than unimpaired participants to efficiently shift attention to the cued location on valid trials demonstrated that UFOV impairment is unlikely to be due to the movement of or engagement of attention, but instead to the disengagement of attention. They suggested that training UFOV-impaired drivers in disengaging attention could produce visual improvements which may transfer to everyday tasks such as driving.
Cosman, Lees, Lee, Rizzo, and Vecera (2012). These researchers used the same sample as
in their 2011 study described above to examine whether visual search performance differed between groups performing a feature search (e.g., a red E among black Es) versus a conjunction search task (e.g., a red E among black Es and red Fs). They hypothesized that if attention is constricted in UFOV decline, then the constriction would impair both feature and conjunction search, because less information could be obtained from the periphery to guide search. In contrast, if UFOV decline was the result of ineffective visual search among items in a cluttered scene, then feature search should not differ between groups, but search rates for conjunction targets would be slower for impaired participants compared to unimpaired participants. Participants performed a basic visual search task in which search type (feature versus conjunction) and set size (4, 8, or 12) were varied on a trial-to-trial basis. At the beginning of each trial, a white fixation point appeared for 500 ms on a gray background, followed by a search array, which remained visible until response. The search array consisted of 4, 8, or 12 Landolt squares (one of which was the target) appearing randomly at a location within an imaginary circle. The participants’ task was to search for the green Landolt square with a gap in either the left or right side and to report the gap side. The target either appeared as a single green target among red distractors (feature search) or as a green target with left or right gap among red distractors with gaps on their left or right sides and green distractors with gaps in their tops or bottoms (conjunction search). Search displays remained visible until participants responded. Search task and set size were intermixed. Participants performed a 48-trial practice block and then performed four blocks of 96 trials.
Reaction times did not differ significantly by group for feature search, but for conjunction
search, UFOV-impaired participants searched significantly slower (109 ms per item) than participants without UFOV impairment (74 ms per item). The researchers state that the attentional capture by a color single target requires a broad attentional focus, and the finding that search RT did not differ between groups suggests that attention may not be overly constricted in the UFOV-impaired group. Instead, it appears that the amount of time attention remains focused on an item (“dwell time”) is longer and the time to move attention from one item to another is slower in people with impaired UFOV. The inability to disengage attention from the central target and move quickly to the peripheral target impairs performance on the UFOV test as well as on other tasks of everyday living that require visual search.

6
Pesce, Guidetti, Baldari, Tessitore, and Capranica (2005). Study findings indicated that invalid visual cuing, particularly at short cue-to-target onset duration disproportionately affected reaction time (RT) among participants ages 60-75 compared to that of participants ages 12-15 and 24-38. The researchers conducted two studies using 14 participants in each of three age groups, varying cue onset to target onset duration (also called stimulus-onset asynchrony, or SOA) at either 150 or 500 ms; cue size (an empty box) of 1° x 1° or 5° x5°, and a large letter made up of smaller letters. The large compound letter was either an A, E, F, or H, and the smaller letters making up the compound letter were the remaining 3 letters. The small box was the size of the smaller letters making up the large compound letter, and the large box was the size of the large compound letter. The small box cue could appear in any of the 13 to 17 locations where small letters made up the larger compound letter. A sequence of screens was shown for each trial: (1) the instruction for which letter was the target letter; (2) a blank screen; (3) a fixation point (a mark in the center of the screen); (4) the empty box cue; (5) fixation target in center of screen; and (6) the large compound letter. On 83 percent of the trials, the compound letter contained the target letter (either at the compound level or one of the smaller letters making up the compound letter, split evenly between target present trials). The remaining trials were distractor trials (target absent), for which the participants were instructed to refrain from responding. In 80 percent of the trials, there was a match between cue size and size of the upcoming target it signaled (a large white box was followed by a large compound letter, and small white box was followed by a small target letter that made up the compound letter). In 20 percent of the trials, the cue size and target size were mismatched.
Participants were instructed to gaze at the center of the screen as long as the fixation
point remained, focusing their attention on the area of the visual field delimited by the spatial cue without shifting their gaze. They were also instructed to react as quickly as possible, by pressing an RT key, to the presence of the predefined target letter (which, usually matched cue size). Further instructions were aimed at forcing participants, in the case of cue-target mismatching, to directly switch from the global level (compound letter) to the local level (smaller letters making up the compound letter), or “attentional zooming in,” or from the local level to the global level (“zooming out”), avoiding visual search strategies. Researchers explained that when a large cue was not followed by a global target letter, the target was the local letter at the center of the screen; when a small cue was not followed by a local target letter at the cued location, the target was the global letter. Responses to distractor trials or responses with RTs shorter than 200 ms or longer than 2,500 ms were considered errors (anticipations and delayed responses, respectively) and were discarded. Participants completed a minimum of 40 practice trials or until their accuracy rate reached 80 percent. They then completed two blocks of 76 trials.
Older adults had slower RT than younger adults and teens. There was also an age effect
for SOA and target level: at shorter SOA (i.e., a short window for focusing attention) older adults (but not younger adults or teens) reacted significantly slower to local than to global targets. At longer SOA, all groups showed an inverse trend of faster RT to local targets, but this was significant only for the older adults.
Analyses also revealed age effects for local cueing on local target discrimination: at
longer SOA, all age groups showed a benefit of local cueing for local targets, with faster RTs to local than to global targets. However, at shorter SOA, only young adults benefitted from this

7
cueing effect (with faster RT to local than to global targets). At short SOA and local cueing for local targets, older adults had faster RTs to global than to local targets. Older adults also had a significantly higher rate of delayed responses (those over 2500 ms) overall, with a higher rate of delayed responses to local than to global targets at shorter SOAs. The results of this study suggest that although RT was slowed in older adults, allocation of attention was not different in older adults compared to younger adults, when a relatively long time was provided to adapt to the spatial extent of the attentional focus in advance. Age-related attentional differences occurred when the time window for focusing attention was reduced; at 150 ms SOA older adults performed slower than the other two groups even when attention was cued to focus at the local level.
The researchers then repeated the protocol, only changing the meaning of the cue to force
participants to intentionally focus attention by suppressing the automatic focus provided by the cue. In other words, on 80 percent of the trials, a large cue predicted a local target and a small cue predicted a global target. At both longer and shorter SOA, all age groups reacted faster when the cue meaning validly predicted the target level for discrimination, and reacted more slowly when cue meaning was invalid. Under the 150 ms SOA, older adults were disproportionately impaired in local discrimination when attention was invalidly cued to focus at the global level (“age-related deterioration of attentional zooming in”). And, for older adults, the delayed response rate (those over 2,500 ms) to local targets was much higher when the advanced cue invalidly predicted a global target than when it validly predicted a local target. These findings suggest that the poorer local discrimination shown by older adults depended on whether the spatial extent of the attentional focus was experimentally narrowed in advance (difficulty with disengaging, or “sticky attention”). This finding supports the hypothesis that aging affects the ability to locate relevant information within a field of irrelevant information; however, this deficit can be counteracted with valid advanced cues.
Anstey and Wood (2011). These researchers examined the on-road driving performance as well as several cognitive abilities known to decline in normal aging, of 266 older drivers ages 70 to 88 to determine associations between cognitive factors and specific driving errors. They grouped driving errors into seven categories: (1) general observation (appropriate scanning of the road environment and attention to signs and road markings); (2) observation of blind spots, including shoulder checks; (3) appropriate use of turn signals; (4) driving at appropriate speeds and smooth use of accelerator and brake; (5) maintaining lane position and selecting the correct lane for turning; (6) maintaining safe gaps between vehicles when following and entering traffic); and (7) appropriate planning and preparation on approaches to intersections.
Researchers administered a battery of tests to participants to measure categories of cognitive abilities. Tests that measured speeded selective attention and attention switching included Trail Making Tests A and B, digit-symbol matching, and a visual search test. The digit-symbol matching task was a computer-administered task. A two-row code table was presented at the top of the screen, with nine digits in the top row and nine symbols in the bottom row. On each trial, a digit-symbol pair was presented in the center of the screen. Participants pressed a green button on a response box if the pair matched or a red button if the pair was not represented in the code table. In the visual search test, participants searched rows of numbers for a target number that was presented at the left of each row. Subtest 1 of the UFOV test provided a

8
measure of discrimination. Inhibition was measured using a choice reaction time color test that required participants to inhibit responding to a distractor stimulus that differed only in color from the target stimulus.
Analyses showed that all error types increased significantly with increased age. Tests of speeded selective attention and attention switching, discrimination, and response inhibition were all significantly associated with observation errors. UFOV Subtests 2 and 3 significantly predicted blind spot errors. Tests measuring speeded selective attention and attention switching also significantly predicted errors in speed management/smoothness of braking and acceleration, lane position, gap selection, and approach planning. Tests measuring discrimination ability also significantly predicted lane position and approach errors.
These findings extend those of the studies presented above in highlighting the importance of selective and divided attention, attention switching, and processing speed, in addition to good discrimination and response inhibition abilities for safe driving. All of these functions decline with normal aging. The study’s authors propose targeting these measures in cognitive training programs, if there is potential for improvements in these skill sets to transfer to improvements in driving performance. Horswill, Pachana, Wood, Marrington, McWilliam, and McCullough (2009). These researchers examined differences in response latencies to a video-based hazard perception test in drivers from three age groups. The old-old group (75+) had significantly slower reaction time compared to the young-old (65-74) and middle-aged (35-55) groups. The differences were independently mediated by Wood and Troutbeck’s (1995) UFOV test (which lacked distractors), contrast sensitivity, and simple reaction time measures. In the hazard perception test, the participants viewed traffic footage filmed from the driver’s perspective, and pressed a button in response to potential traffic conflicts. A potential conflict was defined as any situation where the driver would have to take action to avoid a collision with another road user. The video was not interactive. Participants practiced for 2 minutes and the test drive was 20 minutes. The observed 560 ms average slowing in hazard perception response latency between the middle-aged and old-old groups equated to an additional 33 feet traveling at 40 mph. The authors suggested that such slowing could account for differences in crash risk.
Driver Age Differences in Visual Scanning Behavior
Four studies examined drivers’ glance behaviors as they approached, and negotiated through intersections (Romoser, Pollatsek, Fisher, & Williams, 2013; Dukic & Broberg, 2012; Bao & Boyle, 2009; and Scott, Hall, Litchfield, & Westwood, 2013). Overall, compared to younger drivers, older drivers scanned left and right less frequently and were more likely to focus straight ahead or in the intended direction of travel. This behavior may explain older drivers’ over-involvement in angle crashes at intersections as the struck vehicle, as well as their overrepresentation in “looked but did not see” crashes and being charged with “failure to yield” when involved in crashes with other vehicles (Stutts, Martell, & Staplin, 2009).
A simulator study examined driver age differences in glances to mirrors and the blind spot when changing lanes (Lavallière, Laurendeau, Simoneau, & Teasdale, 2011). These researchers found that, compared to younger drivers, older drivers sampled information from
9
their sideview and rearview mirrors significantly less frequently and were also less likely to look directly toward their blind spot. This may explain the findings by Stutts et al. (2009) that older drivers were overrepresented in crashes when changing lanes. Finally, a naturalistic study in which drivers’ own vehicles were instrumented with cameras, found that older drivers with a narrowed attentional visual field (AVF) in the vertical direction were significantly more likely than those with a normal AVF to run red lights (West et al., 2010). This is consistent with a finding that found that older drivers were overrepresented in run light/stop sign violations compared to all ages (Stutts et al. 2009).
Romoser, Pollatsek, Fisher, and Williams (2013). These researchers used a driving simulator and an eye tracker that measured point of gaze and head position as older and experienced younger drivers approached and maneuvered through three intersections. The sample included two age groups: 18 drivers 72 to 87 (mean age 77.7) and 18 drivers 25 to 55 (mean age 35). The study was designed to test three hypotheses explaining why older drivers tend not to properly scan at intersections: (1) difficulty with head movements; (2) decreases in working memory capacity (forgetting to scan or forgetting scanning patterns); and (3) increased distractibility by irrelevant stimuli.
The simulator presented three intersection types and maneuvers:
• Left turn across oncoming traffic at a four-way intersection with a two-way stop on the side roads (the driver did not have to stop);
• Right turn from a stop at a T-intersection; and • Straight through a four -way intersection with a two-way stop on driver’s approach (the
driver had to stop, but cross traffic did not).
Each scenario contained features such as hills or curves that hid vehicles traveling at the posted speed on the cross street that were 3 seconds away from the center of the intersection. Participants were instructed to drive normally and assume a speed limit of 30 mph. They were advised to follow a lead vehicle through the virtual environment. The purpose of the lead vehicle was actually to trigger cross-street and opposing through traffic so it would cross through the intersection before participants’ arrival. This was intended to alert participants to the potential for hidden threats when they themselves navigated the intersection. Eye position was collected three times per second beginning 8 seconds prior to the participant’s arrival at the intersection (designated as -8 s) and ending 5 seconds after crossing through the intersection (designated as +5s, where 0 seconds was the point where the participant entered the intersection). Glance data were collapsed into five categories (far left, near left, center, near right, and far right) for glance angle comparisons between groups. The researchers also compared the time spent looking toward areas of potential conflict versus the intended travel path by group. For the left turn across oncoming traffic scenario, the critical region for potential threats was the central area (the area across the intersection), as cross street traffic had a stop sign. Younger and older participants’ scanning patterns differed during the period 2 seconds prior to the intersection crossing (-2 s) extending to 1 s after entering the intersection (+1 s). During this period, the younger participants looked at the central region (the source of potential threats) significantly longer than the older participants, while the older participants looked significantly longer toward the near and far left areas (in the intended direction of travel). Thus, the hypothesis

10
that older drivers fail to scan appropriately at intersections because of difficulty with head movements could be ruled out in this scenario because the safe response was to scan the area directly ahead. For the right turn at the T-intersection, the major threat was a car approaching from the left as the participant turned right to merge with traffic on the cross street, which had the right-of-way. Potential hazards would come from the far left. Monitoring this area required a large head movement to the left. A hill blocked the view of vehicles approaching the intersection from the left so vehicles traveling 35 mph became visible only 3 s before reaching the middle of the intersection. As in the left-turn scenario, group glance behaviors differed during the period between −2 s and +1 s. During this interval, older participants looked to the near right (in the direction of their turn) significantly longer compared to the younger participants; the younger participants looked into the far left (the source of potential danger) significantly longer than the older drivers. Safely performing the straight through maneuver required continually monitoring both right and left for unexpected traffic coming around the curves on both sides, as potential cross street traffic was not visible until it was 3 s from the center of the intersection. There were significant differences in older and younger participants’ gaze patterns at every interval from -8 s to +3 s. Older participants looked straight (intended direction of travel) significantly longer than younger participants at each interval, while younger participants looked left and right significantly longer than older participants. In the critical −2 s to +1 s interval, 78% of the younger participants looked both to the far left and far right versus 44% of the older participants.
For all three maneuvers in the critical interval -2 s to +1 s, older participants fixated on their intended path of travel a significantly longer percentage of time than the younger participants, as follows:
• Left turn across traffic—percent of time fixated on vehicle path: 78% older versus 54% young/middle-aged (p < 0.01).
• Right turn at T-intersection—fixation on vehicle path: 66% older versus 46% young/middle-aged (p=.013).
• Straight through intersection: older participants fixated the vehicle’s path through the intersection 67% of the time versus 32% of the time for young/middle-aged participants (p<0.001)
The authors proposed that older drivers’ failure to correctly scan at intersections was not
related to decreases in working memory or to increased distraction as there were no distractions in the scenarios; the opposing vehicles crossed before the participant arrived at the intersection. Furthermore, in two of the three intersections, the participant had a stop sign, so there was no concurrent search and vehicle control response. Instead, they propose that older drivers have acquired a habit of fixating on their intended path of travel to avoid hitting anything as compensation for self-perceived age-related diminished capabilities. Additionally, the authors indicated that older drivers may have more difficulty than younger drivers disengaging from their fixation on the intended vehicle path to search for potential threats in other directions than

11
the travel path. They further state that this habit has been reinforced as a safe strategy since crashes are rare events.
Dukic and Broberg (2012). This on-road driving study also found that older drivers spent
more time fixating on their intended path of travel through intersections (looking at lane lines and other road markings), while younger drivers looked longer at moving objects that could become conflicts. Fifty-three younger drivers (27 to 49) and 26 older drivers (73 to 80) drove an instrumented vehicle in traffic on a 12-mile route for 1 hour on roadways with speed limits ranging from 20 to 65 mph. Participants were accompanied by two experimenters assisting with directions and data collection. The dependent measures included neck flexibility as a function of age (measured in-clinic); eye movements (straight, left, right) and object viewed (vehicle, sign); number of head turns left and right during the intersection approach and traversal, distance from the intersection at first gaze left or right, and speed on intersection approach. The researchers selected and analyzed data from the following four intersections/maneuvers/operating conditions to increase visual and attentional consistency between participants (as the study was collected in traffic, without experimental control of other vehicles):
1. T-Intersection with stop sign, no leading vehicle; 2. 4-way signalized intersection; right turn on green, no leading vehicle 3. 4-way signalized intersection; left turn with no waiting for unprotected road users; and 4. 4-way signalized intersection; right turn: all presented scenarios were selected for
analysis, since there were no pedestrians. The younger participants had significantly greater neck extension and rotation than the
older participants; however, this did not result in statistically significant group differences in head rotation frequency. Analyses of first gaze distance from the intersection were limited to the first two intersections and found that older participants were significantly closer to the intersection than younger participants when they looked into it for the first time, indicating that younger drivers planned further ahead. There were no significant differences in gaze direction by group at the first and fourth intersections. However, at both the second and third intersections, older participants looked straight ahead significantly longer than younger participants, while younger participants looked left significantly longer. Older participants also had longer average fixation times than younger participants at the second and third intersections and had greater between-driver variance in fixation times at all but the first intersection. This may indicate that the older participants needed more time to process information. For the analysis of gaze area of interest, older participants spent more time looking at road markings and where their vehicle was positioned on the road laterally and longitudinally with respect to the markings. In comparison, younger participants spent more time looking at possible threats, such as other vehicles that could enter their path. The authors concluded that older drivers appeared to be more concerned about their position in the roadway, as indicated by their increased focus on road markings, whereas younger drivers were more focused on safe intersection negotiation, as indicated by their focus on areas of potential conflict.
Bao and Boyle (2009). These researchers found that older drivers scanned left and right less frequently, and scanned in fewer areas using longer fixations, than younger and middle-aged drivers when negotiating median-divided highway intersections in rural areas. They used an instrumented vehicle to examine the proportion of visual scans (derived from video of head

12
movements rather than using eye tracking) to the far left and right, near left and right, straight ahead, and rear-view mirror, and the randomness of the scanning pattern (entropy rate) for three groups of drivers. The visual scanning data collection began 78 ft before the stop sign and ended at 20 ft after the intersection. Each driver group was comprised of 10 males and 10 females, as follows: younger drivers (18 to 25), middle-aged drivers (35 to 55), and older drivers (65 to 80). Participants completed three maneuvers at each of two, two-way stop-controlled intersections of a minor road with a major expressway. They traversed each intersection three times, approaching on the stop-controlled minor road and then turning right or left onto the expressway or crossing straight through the intersection. Both expressways had a posted speed limit of 65 mph. At one intersection (a high-crash intersection), the posted speed limit on the minor road was 35 mph. At the other intersection (a low-crash intersection), the posted speed limit on the minor road was 55 mph. Results showed that the older drivers scanned significantly less toward the left and right during intersection negotiations when compared to middle-aged and younger drivers. While all driver groups spent more time looking at oncoming traffic than in the direction of the turn, older drivers had significantly fewer glances toward the turning direction compared to the other age groups. This is opposite of the findings of Romoser et al. (2013), who found that older drivers more often scanned towards the intended travel path than younger experienced drivers. Analyses of entropy rates showed that both older and younger drivers were less likely to scan all areas as compared to middle-aged drivers during the approaches to and leaving the intersection. A higher entropy rate represents greater randomness or higher scanning to multiple areas with shorter average fixation duration. A lower entropy rate indicates more focused scanning in only a few areas with longer average fixation duration. Middle-aged drivers checked their rearview mirror a significantly higher proportion of time than older and younger drivers during all three maneuvers, indicating a greater attention to the surrounding traffic situation. Scott, Hall, Litchfield, and Westwood (2013). These researchers conducted a simulator study using an eye tracker to examine drivers’ gaze transitions as they searched for a gap in traffic prior to turning right at a T-intersection. A gaze transition is the movement of the eyes between one fixation and the following fixation, providing information on the positional relationship of fixations. This study was conducted in the United Kingdom, where a right turn is analogous to a left turn in countries like the United States where one drives on the right side of the road. Participants included 14 subjects in each of three age/experience groups: young novice drivers, young experienced drivers, and older experienced drivers. Participants were instructed to make a right turn in their own time and only when they felt comfortable. The scenario started with a convoy of eight cars passing the intersection from both directions, followed by a series of negotiable gaps that increased in 1.5 second increments. Researchers analyzed recordings of two phases: an initial scanning phase that consisted of the first 10 seconds of each scenario (in which there were no negotiable gaps) and a decision phase that consisted of the 5 seconds immediately prior to initiating the turn. In the scanning phase, the researchers identified 12 gaze transitions, four of which were shared by all three driver groups: the preview strategy was to predominately search between the far left/middle left and far right/middle right areas of the intersection. However, the young experienced drivers also showed gaze transitions that extended to the middle and near areas as

13
well, indicating a more even distribution of gaze transitions across the areas of interest. Older drivers did not make any gaze transitions from middle left to near left or from middle right to near right. Novice drivers scanned from middle right to near right, but not from middle left to near left. The novice and older drivers both made “sweeping” transitions, where they bypassed adjacent areas (for example, a sweeping gaze from center to far left). In contrast, young experienced drivers transitioned their gazes to adjacent areas, and created a pattern of evenly distributed gaze behavior across areas of interest (AOI). The authors note that visual input is suppressed during sweeping eye movements, so this was a less efficient scanning strategy as information from adjacent areas could be missed. The sweeping transitions therefore could put young novice and older drivers at elevated risk as compared to the more evenly distributed gaze of young experienced drivers.
In the decision phase, the researchers identified nine transitions, only two of which were shared by all driver groups. These were from far right to middle right and near right to center. Transitions from near right to center may indicate drivers tracking the last car of the formation before initiating the maneuver, to identify the earliest point of departure. The transitions from far right to middle right may reflect a final check to ensure the gap is clear. Younger experienced drivers made multiple transitions from far left to middle left and from middle left to near left, which would allow them to extract information about speed and distance for the vehicle they would need to merge in front of after crossing traffic coming from the right. In comparison, older drivers made only one transition to the left (far left to middle left), indicating their decision to merge in front of traffic approaching from the left was based solely on distance, without accounting for speed. Young novice drivers made no transitions to search for vehicles approaching from the left, other than sweeping transitions to follow traffic crossing through the intersection from the right and continuing to the left. The authors provided suggestions for training driver visual search strategies for intersection negotiation, as follows:
• include practice in applying an evenly distributed search strategy across all areas of the intersection;
• include tasks designed to develop judgment of both speed and distance; • provide opportunity to practice motor responses in parallel to an on-going appropriate
visual search strategy; and • include modules to support the development of strategies that capitalize on preview
scanning techniques, and ensure effective monitoring of vehicles as they pass through the junction from right to left (left to right, in the United States).
Lavallière, Laurendeau, Simoneau, and Teasdale (2011). These researchers examined
differences in older and younger drivers’ lane change strategies, including frequencies glances toward mirrors and the blind spot, and vehicle control measures (speed and lateral displacement) in a simulator. Participants included 10 younger drivers (6 males and 4 females, age 20 to 24) and 11 older active drivers (11 males, age 66 to 75). The driving scenario contained 16 events that required drivers to change lanes, either to avoid a parked vehicle blocking their lane or to overtake a slower vehicle. The outcome measures were difference in speed and vehicle placement from 15 seconds prior to lane change to completion; time to make the lane change;

14
proportion of lane changes where glances were made to the rearview mirror, left side mirror, and blind spot for each driver; and degree of head rotation while checking left mirror and blind spot.
Both groups of drivers changed lanes in an average of 5.26 s when avoiding a parked vehicle and 6.03 s when overtaking a slower vehicle. The only significant difference was that younger drivers moved their car towards the left more than older drivers (on average 0.82 ft) while executing lane changes. Older drivers were significantly less likely to look in their rearview mirrors and blind spots than younger drivers: 51% older versus 83% younger for the rearview mirror and 41% older versus 86% younger for the blind spot. There was no significant difference in drivers’ inspection of the left side mirror (73% older versus 76% younger). Older drivers showed a constant likelihood of visual inspections for both driving contexts (54% avoiding versus 56% overtaking), whereas younger drivers increased their inspection of the environment for all areas of interest when overtaking a slower vehicle compared to avoiding a vehicle parked partially in their lane (93% versus 71%, respectively). The researchers state this indicates that younger drivers adapted to the complexity of the driving context by increasing their visual inspections (overtaking a slower vehicle is a more difficult task than avoiding a parked vehicle). Older drivers may be more at risk when changing lanes, because they make fewer blind spot checks and because they do not increase their blind spot checks as the maneuver complexity increases.
In terms of head rotation magnitude, younger drivers had a significantly larger degree of
head rotation while verifying the blind spot (i.e., they turned their heads further when making a direct look over the shoulder) compared to older drivers, but the difference in head rotation magnitude was not significant for left mirror inspections. However, 52% of all visual inspections to the left mirror by older drivers included a head rotation (rotation greater than 2°), whereas this was observed for only 33% of the left mirror inspections made by younger drivers. The study authors propose that older participants may have needed to turn their heads to bring the left mirror onto the fovea, as a result of age-related decreased acuity of peripheral information on the retina or a loss of capability to move the eye properly to capture the view in the left mirror.
The groups performed similarly in timing of the first visual inspection to the initiation of
the lane change; 9% of lane changes made by older drivers and 8% by younger drivers were executed with a late verification of the blind spot (i.e., during the lane change). However, 59% of the lane changes made by the older drivers were executed without any look to the blind spot, compared to 14% of the younger drivers’ lane changes.
The authors suggest that since the times to complete lane changes were similar for both
groups, older drivers may have relied on the easily accessible visual information (e.g., rearview mirror and left mirror instead of the blind spot) before changing lanes. The lower likelihood of inspection of the blind spot and rearview mirror could also be explained by older drivers’ perceptual narrowing during lane changes. This may have been a specific strategy to focus on the visual information available in central vision to avoid any front-to-rear or side collisions that may appear more likely because of the rate of expansion on the retina of the vehicle that needs to be overtaken. They suggest that the less optimal inspection strategy observed for the older participants could be modified and improved with appropriate active training programs.

15
West, Hahn, Baldwin, Duncan, Munoz et al. (2010). This naturalistic driving study included a sample of 1,425 older licensed drivers (age range 67 to 87), recruited from the Salisbury Eye Evaluation (SEE) study. The study examined the rate of running red lights and explored the associations with visual and cognitive risk factors. Red light failure rate was defined as the number of failures to stop divided by the number of red traffic lights encountered. A failure was coded as traversing an intersection when the light was already red or turned red within the first third of the intersection. Measures of vision function (acuity, contrast sensitivity, and visual field), visual attention (horizontal and vertical extent), and cognition (MMSE, Brief Auditory Test of Attention, and Trail Making Test Part B) were measured during the baseline examination of the SEE study (Round 1), and real-time driving video was collected in drivers’ own vehicles over a 5-day period. At Round 2 (1 year later) only driving video data were collected. Visual attention was measured using the Attentional Visual Field (AVF) test, which measured the extent of peripheral vision out to a 20° radius in which stimuli were presented at the four meridians (horizontal: 0° and 180°, and vertical: 90° and 270°) while attention was centrally fixated, in a divided attention protocol (see Hassan et al., 2008).
Variables found to be associated with failure in Round 1 were used in predictive models of failure to stop at a red light in Round 2. Driving data were captured in Round 2 for 738 of the 1244 participants for whom driving data were captured in Round 1. Of those who encountered a traffic light at Round 1, 3.8% failed to stop appropriately. Fifteen percent of offenders failed to stop at 10% or more of the traffic lights they encountered. In Round 1, the brief auditory test of attention, Trails B, and AVF (both horizontal and vertical) were associated with running red lights. The researchers did not include the auditory test of attention in the predictive model for Round 2 because of its strong correlation with the visual test of attention, and because the AVF was more relevant to detecting visual targets than the auditory test. Vertical AVF was included in the model (over horizontal) based on the size of the association. For Round 2, only loss of AVF was related to failure to stop at red lights. The median AVF in those who failed to stop at least once at a red light was close to 7° compared to 12° in those with no failures. Drivers who failed to stop at more than 10% of the traffic lights encountered had a median AVF of 6°.
The authors note the finding that a reduction in AVF was related to stopping failure at red
lights, whereas missing points in the visual field alone (Humphrey Field analyzer II) was not, indicates that it is the cognitive component of visual attention that increases risk of running red lights. The relationship between auditory attention and red light running further supported the role of attention in failure to stop. The authors hypothesized that as older drivers approach an intersection and are attending to surrounding cars and traffic flow, a reduction in vertical attentional field would impair detection of change in the high-hanging traffic signal. As the driver with this deficit approaches the intersection with a high-hanging traffic signal, the traffic signal moves to an increasingly peripheral location in the vertical meridian. If this location is outside of the driver’s attentional field, the driver may not detect a change in color of the signal that occurred on their approach. The authors note that drivers who have decrements in their vertical meridians to 7 ° may benefit from evaluation of their driving performance and advice to avoid driving in high-traffic situations to reduce their risk.

16
In-Context Training to Improve Older Drivers’ Visual Scanning Ability
The eight studies summarized below implemented training to improve older drivers’ visual search and scanning abilities. The most salient finding was that training must include active practice of the visual search skills being trained, and driving-specific feedback to achieve positive transfer of training to on-road performance.
Romoser, Fisher, Mourant, Wachtel, and Sizov (2005). These researchers found that
drivers who received post-drive feedback on their simulated driving performance (advice on compensatory visual scanning behaviors) increased their primary and secondary looks toward oncoming traffic and increased their overall situational awareness. Participants included 18 older (70+) and 18 younger (25 to 55) drivers. The driving simulator was a sedan surrounded by three projection screens subtending 135° of visual angle. A head-mounted eye tracker was used along with a magnetic head tracker to determine the participant’s point of gaze, which was then overlaid on the video output of the simulator and recorded for later replay. Ten simulator scenarios represented situations where angle impact crashes were likely to occur if an error was made. Most of the scenarios involved left and right turns at intersections, although several also evaluated the driver’s ability to detect peripheral cues as well as make safe lane changes. During the drive, the experimenter rated the driver’s handling as “acceptable” or “unacceptable” (coded as a “red flag”). Red flags included failure to take primary and secondary looks when approaching intersections and initiating turns, taking too long to turn, unsafe merges, failure to detect critical targets moving into the periphery, collisions, and reckless driving behaviors. After the experimental drive, participants viewed a replay of their 10 scenarios on a large screen television with the experimenter, who paused the video at each error, discussed what the driver did wrong and why it could have led to a collision, and suggested compensatory strategies to incorporate into their on-road driving behavior to help avoid missing peripheral hazards. Suggested strategies included taking secondary looks or waiting for vehicles to move to provide a clear sight line.
Six months following the first simulator drive, the five older participants with the highest
and the five with the lowest error counts completed a second simulator drive with the 10 scenarios that evaluated performance turning left and right and lane changing as well as ability to detect peripheral cues. The researchers significantly changed the scenario scenery for the second simulator drive to prevent recognition of the scenarios. Both older driver groups showed a reduction in errors (12.5% average reduction for low error count group and 20.8% for the high error count group). Romoser and Fisher (2009). These researchers found that older drivers made significantly fewer secondary glances compared to younger drivers. The researchers also found that active training with feedback and practice in a simulator significantly increased secondary looking behavior in both post-training simulator and on-road drives whereas passive training using the same content did not increase secondary looking behavior. In fact, the passive training group showed no difference in secondary looks compared to a control group that received no training. The researchers cited studies by Marottoli et al. (2007) and Bédard et al. (2008) showing that active learning methods (practice and feedback in a contextually face-valid environment) are favorable to solely passive learning methods (lecture or video only) for training older drivers.

17
In this study, secondary looks were defined as looks that take place as or just after a
driver begins to turn and are directed toward the oncoming traffic flow most likely to come into conflict with the driver’s vehicle. For left turns, secondary looks should occur both to the left and to the right, because vehicles approaching in both lanes are potential threats. For right turns, secondary looks should be made to the left. Primary looks are those that occur when a driver is stopped at an intersection, waiting for a gap in traffic to execute a turn.
These researchers conducted two studies using the driving simulator described above. A head-mounted eye tracker and a magnetic head tracker were used to determine the participant’s point of gaze, which was then overlaid on the simulator video. In the first study, participants included 18 older drivers (72 to 87) and 18 younger drivers (25 to 55) with 10 or more years of driving experience. In the first study, participants drove through 10 scenarios in which hazards could appear from outside of the driver’s field of view, requiring a head movement. Following the drive, the participant’s drives were replayed during a review-and-feedback session. Researchers pointed out when the participant drove safely. If participants made errors, the researcher:
• Replayed the error portion of the drive, pausing to point out the participant’s error and potential consequences (e.g., crash with oncoming car or bicyclist, near-crash.).
• Played video of an experimenter’s drive through the intersection showing experimenter making the same error, which resulted in a crash.
• Replayed a drive through the same intersection demonstrating correct gaze performance.
Participants’ scores reflected six vehicle handling and scanning errors:
• failed to take a secondary look during a turn; • took too long to complete the turn (3 seconds or longer); • merged too close to another vehicle; • failed to glance into the target lane while changing lanes on a highway; • failed to fixate a peripheral risk (bicycle-at-the-crosswalk scenario); and • other risky maneuver (e.g., such as running a stop sign, leaving their lane or the road, or
rear-ending the lead vehicle).
The researchers found that the older participants were three times more likely than the younger participants to require review and feedback (59 versus 18 scenarios, respectively). They also found significant differences between older and younger participants in failure to make secondary looks (32 failures versus 10 failures) and proportion of turns that were too slow (10 failures versus 1 failure).
The researchers used these findings to develop an active training program to increase secondary scanning among older drivers. In the second study, they compared the performance of older participants who received the active training program to a group of older participants who received a passive training program with the same content and to a control group of older participants who received no training. The study sample included 54 older participants (70 to

18
89), equally distributed in the following age groups: 70 to 74, 75 to 79, and 80 to 89. Six participants from each age group were assigned to the active training group, the passive training group, and the control group.
The content of training for both training groups included raising awareness of the crash statistics for older drivers, discussing how physical and cognitive declines can make negotiating intersections more dangerous, providing examples of intersections that pose increased risk to older drivers, and introducing and discussing the concept of a secondary look. The active training was conducted in the driving simulator used in the first study. Participants followed a lead vehicle through 10 intersections that contained potential peripheral hazards. Before making each turn, the instructor asked participants to point where the hazards might develop and then, after they began the turn, to direct a secondary glance in that direction to check for newly arrived traffic. The passive training group received a traditional lecture-style training session in a classroom. Training consisted of PowerPoint slides, text, figures, and animations. The passive training participants were also given a demonstration of how to execute a secondary look while turning.
The researchers evaluated participants’ performance in the simulator prior to training and
post-training. All but the 80-and-older participants were also evaluated pre- and post-training in the field, driving their own vehicles on a self-selected route, with no experimenter present1. The on-road drives lasted 30 minutes. Participants’ vehicles were instrumented with cameras to record the environment around the vehicle, and participants wore a headband-mounted camera to document head movements. Reviewers scored participants’ secondary glances at each intersection for the pre- and post-training simulator and field drives. All participants underwent a battery of visual, physical, and cognitive tests, including near and far visual acuity, Grooved Pegboard Test, Trails A and B, Rey Auditory Verbal Learning Test, Rey-Osterreith Complex Figure Test (ROCFT), Get Up and Go test, and a test of head/neck upper torso flexibility.
A comparison of secondary glances taken in the simulator versus in the field prior to training showed little difference; 34.4% of drivers took a secondary look before turning in the simulator compared to 44.5% of drivers who took secondary looks before turning in the field. The correlation between looks in the simulator and in the field prior to training was positive and statistically significant.
The active training group showed a significantly larger increase in secondary looks from
pre-to post-training simulator and field drives compared to the passive training group and the control group. There were no significant differences in secondary looks from pre- to post-training for the passive training and control groups nor significant effects of age group or sex on training effectiveness. The active training group showed a 35 percentage point increase in secondary looks from their pre- to post-training simulator drive and a 38 percentage point increase from pre- to post-training field drive.
Passive training and control group data showed no significant correlation between visual,
cognitive, and physical measures and change in pre- to post-training secondary looks in the simulator or in the field. For the active training group, only ROCFT was significantly correlated
1 Drivers 80 and older were excluded to satisfy the institution’s IRB requirements

19
with change in secondary looks in both simulator and field evaluations; those who scored high on ROCFT had a larger increase in secondary looks from pre- to post-training. This could indicate that a decline in visuospatial memory and other executive functions, as opposed to physical and visual functional decrements, could affect the ability to learn to increase side-to-side glances.
Participants in the active training group provided higher ratings than did those in the
passive training group for overall effectiveness of the training program as well as effectiveness in raising awareness of how age-related decline in mental and physical functioning can impact driving, teaching how to better scan the road for hazards, and teaching how to better incorporate head turning into driving habits.
One drawback of the simulator training was the high dropout rate resulting from
simulator sickness (34 of 88 of the older drivers recruited for the first study). The study authors recommended developing field versions of the active training protocol to accommodate older drivers who are prone to simulator sickness. Based on their findings and consistent with adult learning theory (Knowles, Holton, & Swanson, 2005), the authors concluded that training programs for older drivers should be immersive in the domain in which they will be using the skills that are being trained, including practice of the skills being trained, because passive classroom-style instruction techniques are not effective.
Romoser (2013). This follow-up study to examine the scanning behavior (secondary
looks) of participants in the active training and control groups 2 years post training, found that the active trained group maintained their post-training scanning behavior, while there was no change in the control group members’ scanning behavior. The researcher used the same 4-camera system and recruited 11 of the 12 participants who received active training in the Romoser and Fisher (2009) study who participated in the field drives (age range 73 to 82, mean 77.4 years) and 10 of the 12 participants from the control group who received no training, but participated in the field drives (age range 72 to 81, mean age = 76.5). Participants drove the same 30-minute route they selected in the 2009 study. In the active training group, the average pre-training percentage of intersections with secondary looks was 46.3%, which increased to 79.6% in the 6 to 8 weeks post training. Two-years post-training, their secondary look rate was 72.7%, significantly higher than the pre-training rate, and not significantly lower than the immediate post-training rate. In contrast, the control group showed an initial secondary look rate of 40.7%, a 6 to8-week rate of 38.5%, and a 2-year follow-up rate of 42.9%. Six of the 11 active training group drivers remained within 10% of their post-training performance 2 years later. Only three drivers regressed by more than 10%; however, their 2-year post training performance was on average 24% higher than their 2009 pre-training performance.
The researcher proposed that older drivers compensate for physical and cognitive decline
by simplifying the driving task and foregoing parallel processing in favor of serial processing. With serialization, they focus primarily on what is directly in front of them to maintain their vehicle in the desired path throughout the turn. Providing video-based feedback and an opportunity to practice secondary looks in a simulator was effective in helping older drivers re-incorporate looking skills into their driving habits.

20
Lavalliѐre, Simoneau, Trembley, Laurendale, and Teasdale (2012). These researchers provided evidence that active practice was a necessary but not sufficient addition to classroom-style education for older drivers. They found that driving-specific feedback coupled with active practice were both necessary additions to classroom-style education for positive transfer of training to on-road driving. The researchers used the driving simulator to administer active lane change practice for two groups of older participants: 10 who received driving-specific feedback and 12 controls who received no feedback. All participants completed two on-road driving evaluations that each included 10 lane changes. The driving evaluations occurred before and after three active practice sessions (all participants) and feedback (for the feedback group) sessions in the driving simulator. In addition to the three active practice simulator sessions, both groups attended three classroom sessions based on the then-current AARP 55-Alive Refresher Training, with a focus on visual search to side-view and rearview mirrors as well as direct over-the-shoulder looks, including specific graphical support. The feedback group received additional training at the end of the classroom training consisting of video playback of their pre-training on-road and simulator drives, with discussions of errors in their visual scanning habits, demonstrations of the proper response, and opportunities to re-drive the scenario sessions where the errors occurred.
The driving specific feedback focused on “the role of preventive rather than reactive
driving” to increase mirror and blind spot checks prior to lane changing. The information provided was based on the Risk Awareness and Perception Training Program (RAPT) described by Fisher, Pollatsek, and Pradhan (2006). The feedback in this program encourages “deep processing in scenarios where risks are hidden.” Drivers are first asked to visualize where risks may be located, rather than presenting the risks. Then, risky scenarios are presented with explanations about why they are risky, and where risks may be hidden when areas of the visual field are obstructed. For this study, a split screen displayed video of the driver’s face (to identify eye movements and head turns); the forward views; the mirror views and blind spot view; and the vehicle position and speed overlaid on a map from their first on-road drive and their earlier simulator driving sessions. This display was used to show drivers their sub-optimal scanning strategies. Each driver’s at-risk response was then compared to the researcher’s demonstration of the proper response.
The outcome measures consisted of the proportion of lane changes during the on-road
drives (pre- versus post-training) at each area of interest (sideview mirrors, rearview mirror, direct look over the shoulder toward the blind spot) as well as participants’ first looks with respect to the initiation of the maneuver (15 seconds before the lane change versus at initiation and for up to 5 seconds after initiation of the lane change). There was no significant effect of training on looks to the rear-view and sideview mirrors (possibly due to a ceiling effect pre-training, where 91% of lane changes occurred with looks to the rearview mirror and 85% with looks to the sideview mirrors). However, the feedback group significantly increased their direct looks to the blind spot from pre- to post-training road test (from 32.3% to 64.9%) whereas the control group did not (12.5% to 13.8%). The feedback group also increased the percentage of their visual inspections toward the blind spot that occurred prior to the maneuver initiation from pre- to post-training road test. The control group changed neither the frequency nor the timing of their looks toward the blind spot. The researchers concluded that simulator training combined with driving-specific feedback improved on-road driving skills and could be an effective

21
substitute for on-road training. However, they reported that 9% of the study sample experienced simulator sickness and were unable to participate in the active practice sessions.
The researchers hypothesized that drivers who did not receive feedback may have
considered themselves as good drivers and, without receiving such feedback as evidence of their visual scanning defects, were not motivated to incorporate the information provided about blind spots during the refresher training into their on-road driving. Thus, training programs that point out a sub-optimal strategy, provide specific feedback for how to change it, and provide practice and reinforcement of proper driving strategies are important tools for modifying driver behavior.
Horswill, Kemala, Wetton, Scialfa, and Pachana (2010). These researchers similarly
suggested that while experienced drivers may have better hazard perception ability than novice drivers, it is less than optimal because most drivers consider themselves more skilled than average. This provides little incentive for skill improvement. In addition, drivers’ self-perceptions of competence are reinforced because crash involvement is rare, and if crash-involvement is used as feedback about crash-avoidance, there is little opportunity for learning. The researchers proposed that older drivers may have higher crash rates per mile driven than middle-aged drivers because of declines in their hazard perception ability, and that training (consisting of an expert driver’s commentary on a series of hazardous traffic scenarios), may allow them to compensate for age-related cognitive, motor, and sensory declines.
Study participants included 24 drivers 65 to 94 (mean age = 75.3) randomly assigned to
either a hazard perception training group or a control group. The hazard perception training consisted of a 17-minute video of driving footage presenting a variety of hazardous situations, with a running commentary by an expert driving instructor indicating what he was paying attention to and giving general advice about anticipating hazards. The control group viewed the video without the expert commentary. A validated version of the Hazard Perception Test2 (HPT) was split into two test versions, one administered before training and the other after training (reliability correlation .72) to identify changes in response time latencies to hazards as a result of the training. Test order was counterbalanced across the groups. In the HPT, participants viewed video footage of un-staged hazardous traffic situations on a touch screen computer and touched any road user likely to come into conflict with the camera car as quickly as possible. A traffic conflict was defined as a situation where the camera car would need to brake or steer to avoid a collision. The post-training HPT was given 15 minutes following training completion. On the pre-training HPT, there was no significant difference between the training and control groups’ hazard perception latencies. The training group was significantly faster than the control group on the post-training HPT. On the post-training HPT, the trained group identified hazards 513 ms earlier than they did on the pre-training HPT, whereas the control groups’ latencies remained unchanged. The time difference equated to 30 feet if traveling 40 mph. The researchers did not evaluate whether the hazard perception training improved hazard perception latencies on-road or if training effects were sustained.
2 Horswill et al. (2008) and Wetton, Horswill, Hatherly, Wood, Pachana, & Anstey, 2009)

22
Horswill, Falconer, Pachana, Wetton, and Hill (2015). These researchers conducted a follow-on study to the study described above using 75 older drivers (65 to 89) who had never taken a hazard perception test. The researchers examined training effects by assessing HPT latencies pre-training (baseline), immediately post-training, 1 month post-training, and 3 months post-training. Participants were randomly assigned to a control group or to one of two training groups (hazard perception training only or hazard perception training plus booster training).
The hazard perception training was similar to that conducted in the prior study but was
more focused on providing drivers with insight about their observation skills relative to those of an expert driver. The training included an instructional video defining traffic conflicts and how they could be anticipated by searching for relevant cues. Participants then completed four examples of the following two video-based training exercises. In the first exercise, participants generated a running commentary as they viewed a traffic scene filmed from the driver’s perspective. The traffic scene was replayed, accompanied by a prerecorded expert driver commentary, for comparison with their own. The second exercise involved a traffic scene that suddenly cut to a black screen. Participants described possible outcomes. The clip was replayed and frozen at the same moment, followed by a recording of the expert driver listing all possibilities. The clip was played past the cut point so that participants could see what actually happened. Control-group participants viewed video clips of a driving instructor discussing aspects of safe driving not directly related to hazard perception. Between these clips, participants viewed the same traffic clips that appeared in the training package, but without expert commentary or instruction. The booster session group saw 22 minutes of additional training video at the end of the 1-month follow-up session, which were shortened instructions explaining the video exercises, and they completed four new examples of each training exercise.
Training significantly reduced hazard response latencies on all three post-training tests
compared to baseline. Trained participants responded 0.81 s faster than controls immediately following training3, 0.67 s faster at 1 month post-training, and 0.45 s faster 3 months post-training. The booster training did not affect hazard perception performance. Analyses found no significant decay in training effect across the three post-training test sessions. The researchers proposed that booster training was not effective because it was administered before any significant training decay had occurred. Whether training would transfer to improvements in real-world driving performance was not evaluated.
Classen, Cormack, Winter, Monahan, Yarney, Lutz, and Platek (2014). Feedback on
driving errors, visual scanning training, and commentary driving were effective in reducing driving errors on a pre- and post-training simulator drive in a study of eight combat veterans returning from active duty with a diagnosis that could impair cognitive functions (e.g., PTSD, TBI), particularly attention, executive function, and processing speed. Although this study's sample was small and did not include older drivers, it deserves mention because the visual scanning training was successful in reducing visual scanning errors on pre- to post-training simulator drives. Also, it was effective in assisting the veterans to ignore stimuli that had relevance in a combat environment but not in civilian life. Since age-related impairments in cognition often include reductions in attention and processing speed, such training may be effective for older drivers. The visual scanning component of the training included a CD “Visual 3 Average difference between pre- and post-training response latency.

23
Search Skills” (Monahan, 2009) that depicted roadways typical of those in the United States. The combat veterans identified distractions they were taught to attend to while in combat (e.g., trash bags, roadkill, helicopter flying overhead, loud backfire noise) and then to identify the critical roadway information to manage safe driving in civilian life (e.g., car pulling out of a driveway, traffic signal turning red upon the approach to an intersection). They also performed a narrated drive in the simulator (DriveSafety CDS 250 Mobile VA Simulator) and demonstrated strategies taught by an occupational therapist/driver rehabilitation specialist who provided feedback following their baseline simulator drive.
Staplin, Lococo, Brooks, and Srinivasan (2013). These researchers found some evidence
that an occupational-therapy-based program designed to improve visual skills and attention was effective in improving on-road driving performance of healthy aging drivers from pre- to post-training, and in maintaining driving skills assessed three months post-training. The occupational-therapy-based Visual Training Program (OT-VTP) was developed using principles found in the book Disciplined Attention (Mills, 2005). The idea of Disciplined Attention is that the eyes and brain work together to process visual information and that visual techniques can be used to achieve mastery over attention while performing complex and challenging activities such as driving. Such exercises may help a driver to allocate attention in a way that reduces crash risk. Drivers can develop visual habits including target fixation, tunnel vision, and narrowed attention that may reduce their ability to detect traffic hazards in time to respond appropriately. These habits in combination with distractions and other factors may affect both what drivers see and how they react to stimuli.
The research team collaborated with a certified driver rehabilitation specialist (CDRS)4 who developed the visual training protocol for the 2013 study using the principles outlined by Mills, as well as knowledge of the visual system, to enhance participants’ visual attention with the ultimate goal of improving driving safety.
The three critical visual processes for safe driving outlined by Mills and for which specific in-clinic training exercises were developed included switching states of attention, expanding field of view, and "clean visual routines" (ocular skills). Switching states of attention was addressed through activities that require awareness to ambient (peripheral) and focused (central) vision. These activities are geared towards minimizing a tunnel vision focus and gathering a wide visual analysis of the driving environment. The principle of expanded field of view invokes exercises that bring a heightened and conscious awareness to peripheral responsiveness, drawing attention to valuable information that can be gleaned through the faster-acting peripheral visual system. Earlier recognition of potential driving hazards can be improved through these activities, allowing time to take action and avoid trouble. By "connecting the mind to the eyes," recognition can occur in advance that a vehicle approaching on an intersecting roadway or driveway may not stop. Activities designed to enhance clean visual routines focus on visual skills for particular driving maneuvers including lane changes, turns, and merges. These exercises train the proper visual sequence to maximize safety with these maneuvers.
All tasks in the visual training protocol were tied directly to relevant roadway scenarios, to enhance the participants’ understanding and carry-over of the activity to enable “the eyes to 4 Cyndee Crompton, CDRS, OTR/L, SCDCM, post-professional certification in low vision rehabilitation; President, owner, and lead therapist of Driver Rehab Services, McLeansville, NC.

24
see and the mind to analyze” potential dangers. Eight, one-hour individual training sessions were divided between in-clinic and in-vehicle settings (see Table 1).
Table 1. Overview of OT-Administered Training Program Activities
Subject in Clinic Subject in Vehicle as Front Passenger
(OT or Driving Instructor Drove Vehicle)
Subject in Vehicle as Driver
Session One: Field Expansion Exercises
Session Two: Field Expansion training in dynamic environment
Session Eight: Behind-the-wheel training session with integration of all learned skills. This session included the OT as a back seat observer, while a licensed driving instructor rode in the front seat with the trainee. The driving instructor was a silent participant in this session, being present only to intervene with a vehicle control action if necessary to insure the safety of the vehicle occupants.
Session Three: Simultaneous Processing Exercises
Session Four: Simultaneous Processing training in dynamic environment
Session Five: Ocular Skill Exercises
Session Six: Ocular Skill training in dynamic environment. Session Seven: Review and integration of skills practiced in clinic, using a combination of exercises.
This study compared the effectiveness of the OT-VTP training for a group of 16 older participants (65 to 84) to a control group of 17 older participants (66 to 81) who received 8 hours of direct contact with the research team in activities unrelated to driving performance or driving safety. The outcome measure, performance on an on-road driving evaluation, was assessed by a CDRS, who was not the developer of the training program. Each driver was evaluated before participating in the OT-VTP training or Control group activity (Drive 1), and again immediately after the intervention was completed (Drive 2), and three months following completion of the intervention (Drive 3). Each of the three drives was conducted on a separate route, ranging from 11 to 23 miles, where drivers made left, right, and through movements at signalized and stop-controlled intersections, and performed lane changes. The routes included school zones with pedestrian crossings, bicycle lanes, roads with horizontal and vertical curvature, and interchange ramps. The CDRS scored competence on 33 subscales comprising tactical (visual search and scanning tasks; vehicle positioning tasks; vehicle handling tasks) and strategic (cognitive and executive function tasks) domains of driving performance. The CDRS provided feedback to study participants about their driving only after the delayed post-treatment assessment (Drive 3).
In both the OT-VTP and control group, very high proportions of participants achieved the highest score possible on the baseline assessment. Since the stated goal of the training activity was to preserve or enhance safe driving behavior, the research hypotheses of Staplin et al. (2013) were that (1) the OT-VTP training group would have a higher percentage than the control group of drivers without deficits at baseline who maintained their performance at the immediate and/or delayed post-treatment assessments; and (2) the OT-VTP group would have a higher percentage than the control group of drivers with deficits at baseline who improved their performance on Drive 2 and/or Drive 3.
The OT-VTP group demonstrated a significant gain relative to the control group in the percentage of drivers without performance deficits at baseline who maintained their skills on

25
subsequent evaluations (Drives 2 and 3). This effect was significant at p < .05 on the immediate post-treatment assessment and at p < .01 on the delayed assessment.
For the relatively few drivers who demonstrated some deficiency on the baseline assessment, the OT-VTP group achieved significant (p < .05) gains relative to the control group in the percentage of participants who improved their performance on the immediate post-treatment evaluation (Drive 2). However, the OT-VTP training gains (with respect to the control group) were not significantly sustained on Drive 3.
Out-of-Context Training to Improve Older Adults’ Visual Scanning Ability
Recent studies have explored whether speed of processing training (SOPT) translates to a reduction in at-fault crashes (Ball, Edwards, Ross, & McGwin, 2010; Ball, Ross, Roth, & Edwards, 2013) or to improved driving performance as evaluated during on-road assessments (Roenker, Cissell, Ball, Wadley, & Edwards, 2003). Ball et al. note that speed of processing training is based upon principles of the UFOV test but goes beyond simple practice of the test. A qualified trainer follows a specified training program for each trainee to achieve specific individualized processing speed goals for four speeded tasks. These four tasks are similar to the UFOV subtests but include variations of target type (visual or auditory), location, conspicuity, and complexity with the primary manipulation throughout training being display speed. Through guided practice and feedback, the training aims to increase the speed and accuracy with which individuals can process information. The primary aim of SOPT is to improve the fluid ability of mental processing speed (as opposed to psychomotor reaction time) so that trainees can process increasingly more information and increasingly more complex information over shorter periods of time (Ball, Edwards, & Ross, 2007). In each subtest, visual targets are presented at display durations between 16 and 500 ms. The first subtest requires identification of a central target against an otherwise black background. The second subtest requires both central target identification and simultaneous localization of a peripheral target. This peripheral target is at a fixed eccentricity of 12.5 cm from the center target and is presented at one of eight radial locations from the central target. The third subtest requires both of these tasks with the addition of distractors surrounding the peripheral target. The fourth subtest requires discrimination of two central targets as same or different along with the simultaneous localization of a peripheral target in the presence of the distractors. Scores on each subtest represent the threshold display duration in ms at which the participant can perform the task correctly 75% of the time.
As stated in Ball et al. (2007), each basic task has a speed of processing criterion goal. Training proceeds at individualized levels of complexity until the trainee can identify a single visual target at a display duration of 30 ms, can identify a visual target and simultaneously localize a peripheral target at a display duration of 40 ms, and can perform this task when the peripheral target is embedded in distractors at a display duration of 80 ms. Repeated practice of tasks of incrementally increasing complexity and decreasing display speed helps trainees to reach these goals. The overall goal of the training technique is to enhance cognitive processing speed by gradually increasing task difficulty while decreasing display duration until trainees achieve mastery through practice. Ball, Edwards, Ross, and McGwin (2010). In the Advanced Cognitive Training for Independent and Vital Elderly (ACTIVE) clinical trial, these researchers found that older drivers
26
who participated in speed of processing training (SOPT) had significantly fewer at-fault crashes in the 6-year follow-up period compared to a no-contact control group of older drivers who received no training. The SOPT group was comprised of 179 participants 65 and older (mean age = 72.8 years), and the control group consisted of 409 participants 65 and older (mean age = 73 years). The SOPT intervention was led by a trainer and conducted in small groups of two to four participants at the study sites during approximately 70-minute sessions over a period of five to six weeks. Ten training sessions were administered, occurring twice a week over a five-week period. SOPT involved practicing visual attention skills and the ability to identify and locate visual information quickly in increasingly demanding visual displays. Participants practiced speeded visual tasks on a computer, and task difficulty was increased each time a participant achieved criterion performance on a particular task. For example, participants were asked to identify an object on a computer screen at increasingly brief exposures, followed by dividing attention between two tasks, and then performing both tasks in the presence of distractions (with the primary modification being display duration).
State recorded crash data over the 6-year post-training period showed that the SOPT group experienced a significantly lower rate of at-fault crashes per year of driving exposure compared to the control group (RR – 0.52, 96% CI, 0.31-0.87) and per person mile driven (RR = 0.57, 95% CI 0.34-0.96), following adjustments for age at baseline, sex, race, education, study site, visual acuity, health, depression, and mental status. SOPT was associated with a cognitive training gain relative to controls of 1.46 standard deviations at immediate post-test and 0.76 at year 5 (Ball et al., 2013), suggesting that cognitive improvement is a mediating factor in at-fault crash reduction.
Roenker, Cissell, Ball, Wadley, and Edwards, 2003. These researchers evaluated the
effectiveness of 4.5 hours of SOPT training for improving on-road driving performance in older drivers with 30% or more reduction in UFOV compared to classroom-type driver education training using a non-interactive simulator and to no training (control). The older participants in the simulator trained group served as a control for social contact and instructional aspects of training. For simulator training, a CDRS conducted two, two-hour educational sessions with groups of three to four participants, consisting of an overview of rules of the road and safe driving practices, after which participants practiced with simulator films demonstrating crash avoidance techniques, managing intersections, and scanning. The last hour included an in-vehicle demonstration by the driving instructor of safe driving skills. The older participants in the control group had intact UFOV and served as a low-risk reference group.
All participants completed driving evaluations at baseline, immediately after training, and
18-month post-training. They were also tested on the UFOV at all three testing sessions. The SOPT group comprised 48 participants 59 to 86 (mean age = 72 years). The simulator training group was comprised of 22 participants 63 to 81 (mean age = 72 years). The no training control group was comprised of 25 participants 55 to 80 (mean age = 69 years). The on-road driving evaluations consisted of two loops of a 7-mile urban/suburban route with maneuvers that have been shown to be risky for older drivers (e.g., left turns across traffic). Two evaluators in the back seat rated 455 items while a driving instructor in the passenger seat provided instructions to the study participant. At locations with potential conflicts, evaluators coded whether the participant’s maneuver was “dangerous” (defined as either the driving instructor had to take

27
control of the vehicle, or other traffic had to alter their course to avoid a collision). Raters provided a global rating after each drive ranging from 1 (drive aborted/very unsafe) to 6 (very competent driver). The 455 items were combined into 8 composites5: (1) dangerous maneuvers; (2) proper and timely use of turn signals; (3) position in traffic relative to surrounding traffic while moving; (4) vehicle speed control relative to posted speed limits; (5) vehicle position when required to stop at a traffic control device; (6) tracking, or position of vehicle in proper lane; (7) changing lanes on multi-lane roads; and (8) position of vehicle when turning.
The SOPT significantly improved UFOV performance for the SOPT group from baseline
to immediate-post training, to the level of that shown by the control group, which was intact. There was no improvement in UFOV score for the simulator-trained group at either the immediate or the 18-month post-training assessment. The improvement in UFOV for the SOPT group was sustained at 18 months post training.
At baseline, the control group had better global driving ratings compared to the simulator
and SOPT groups. The global driving ratings for the control group remained unchanged for all three assessments. Both the simulator training and SOP training group showed improved on-road scores at the immediate post-training evaluation, at the level of the control group. At 18 months post-training the simulator group’s global rating fell to their baseline level. Similarly, the SOPT group global rating did not significantly differ from baseline at 18 months post-training.
In terms of significant improvements in composite scores, for dangerous maneuvers, both
the simulator and SOPT training groups improved (reduced numbers of dangerous maneuvers) from baseline to immediate post-test, reaching the level of the control group (which was lower than both groups at baseline). However, only the SOPT group sustained the reduction at 18 months post-training. Interestingly, the control group showed increasing counts of dangerous maneuvers at each assessment while the SOPT group showed continued reductions over the three assessments. By the 18-month post-training assessment, the SOPT group showed significantly fewer dangerous maneuvers (average 0.65) than both the control (1.14) and simulator-trained (1.34) groups. The researchers state that the dangerous maneuvers component consisted of items that tapped visual detection and judgment abilities in visually cluttered and cognitively demanding high-risk driving situations, such as scanning intersections for traffic control devices and selecting gaps to turn across oncoming traffic. The SOPT group improved on untrained tasks that relied on visual attention and higher-order processing speed. The SOPT group showed no other significant improvements over time, relative to the control or simulator-trained groups. The simulator-trained group improved in only two areas relative to the other two groups at baseline: proper use of turn signals and turning into the correct lane. The researchers stated that this was not surprising given that some of the simulator training was devoted to proper signaling and turning. However, these improvements were not retained at 18 months post-training.
5 Of particular interest is that 13 driving performance composites were initially developed, but 5 had to be dropped. Four were dropped due to ceiling effects (gap selection, acceleration, deceleration, and right-of-way), and one was dropped for lack of sufficient data (search: head and eye movements at intersections). Roenker et al. (2003) stated that although additional mirrors were placed in the vehicle to aid in the detection of eye movements, certain situations made this assessment difficult (e.g., driver wearing sunglasses, movement of sun visor).

28
Scalf, Colcombe, McCarley, Erickson, Alvarado, Kim, Wadhwa, and Kramer (2007). These researchers found significantly improved performance pre- to post-practice in functional field of view (FFOV) testing in a group of 18 older participants (55 to 85) exposed to practice with the FFOV task compared to a group of 10 older controls who did not receive FFOV practice. Neuroimaging data also showed practice-related changes in the activation of brain regions associated with orienting visual attention; the increased recruitment of the right ventral precentral gyrus and right inferior frontal gyrus were correlated with improvements in task performance measured outside of the scanner, indicating that they play a significant role in increasing older adults’ ability to orient attention to stimuli throughout the visual field. As noted by Ball, Edwards, and Ross (2007) and citing Kramer and Willis (2002), cognitive training is effective even in individuals of advanced age, indicating that human brains continue to have plasticity.
In this study, the FFOV test and practice were performed on a computer that displayed the letter “T” in one of four boxes in the center of the screen, with or without 18 slanted lines distributed throughout the periphery, of which one was slanted in the opposite direction. Participants identified the location of the T in single-task trials for the central target, identified the location of the line slanted the opposite way in the single-task peripheral target condition, and the location of both the central and peripheral targets in the dual-task condition. Display durations were 160, 213, and 266 ms. The FFOV practice consisted of five sessions lasting 45 minutes, each with 70 single-task trials for central and peripheral task performance and 210 dual-task trials. Participants received feedback for both trial types. For exposure durations of 160 ms and 213 ms, performance (accuracy) improved for all conditions equally for the practice group (single task central target, single task peripheral target, and dual task central and peripheral targets), but for exposure durations of 266 ms, performance improved most for peripheral targets under dual-task conditions. Both study groups were also evaluated pre- and post-practice in an MRI scanner, performing a FFOV task similar to the FFOV task performed outside of the MRI. FFOV performance while in the MRI improved from pre- to post-practice only for the practice group, and only for the peripheral task performance under the dual-task condition.
The researchers then analyzed the neuroimaging data to identify the brain regions in
which pre-post practice differences in activity differed between the practice group and the control group. Improvements in accuracy were significantly correlated with increases in brain activation in the right inferior gyrus and the right ventral precentral gyrus. Participants in the practice group increased activation in these brain regions to a larger extent than control participants. The researchers explain that shifting and reorienting the focus of attention often produces activation in these regions. They stated that “the midlateral region of the precentral gyrus are believed to be the human homologues of the frontal eye fields, which are long thought to mediate covert attentional shifting” (e.g., Nobre et al.,1997). The study authors cited research that indicates that the frontal eye fields are important in providing top-down control over visual search mechanisms, maintaining target defining features during search (Corbetta & Shulman, 2002; Grosbras, Laird, & Paus, 2005; Serences & Yantis, 2006), and in shifting attention to targets when they appear (Serences, Shomstein, Leber, Golay, Egeth, & Yantis, 2005; Serences & Yantis, 2006).

29
O’Brien, Edwards, Maxfield, Peronto, Williams, and Lister (2013). These researchers also found changes in areas of the brain responsible for attention allocation and capacity (event-related potentials in the N2pc and P3b components) of 11 older participants (56+) following 16 hours of SOPT over 10 weeks, compared to 11 older participants who served as no-contact controls. The N2pc reflects allocation of attention to a target among distractors during visual search. The P3b reflects the attentional capacity needed to categorize a target. Both show decreases in amplitude with age. The researchers stated that their findings of increased N2pc and P3b amplitudes following SOPT supports the hypothesis that there is plasticity in the attentional control and inhibitory systems of older adults. The SOPT represented process-based training—training a process system usually through perceptual practice—as opposed to strategy-based training of specific cognitive abilities (e.g., mnemonics for memory) that transfers to the trained tasks and those similar, but not to tasks such as those encountered in everyday activities. The study authors, citing Jonides (2004), stated that process-based training is hypothesized to target a certain neural circuit that leads to transfer to other tasks that use the same or overlapping neural circuits, regardless of whether the other tasks are specifically trained. The SOPT used in this study included five exercises designed to improve perception, processing speed, attention, and memory; exercises were embedded in a videogame environment. The pre- and post-training test included response time and accuracy in identifying a target embedded within a set of distractors, under target absent and present conditions. While no outcome related specifically to driving safety was measured as a function of this training, the researchers state that the results help define the underlying neural mechanisms by which training can reverse declines in selective attention control that result from normal aging.
Finally, two studies (described below) found that training resulting in fewer eye
movements to fixate a target improves detection and recognition performance of older adults. Becic, Boot, and Kramer (2008). These researchers found that older adults who made few
eye movements during a search (what the authors termed “covert searchers”) more accurately and quickly detected a change in a dynamic display, compared to older adults who made many eye movements (“overt searchers”). They also found that with training, older “overt searchers” were able to modify their search strategy to search covertly, bringing their search performance in line with older adults who were naturally covert searchers. The researchers investigated the search strategies of 30 participants 55 to 87(mean age = 72) who viewed consecutive 8-second displays, each consisting of 23 dots of various colors moving across a grey background. The task was to report the appearance of a new dot by pressing a button. A target appeared on two-thirds of the 216 trials (target present); the rest were target-absent (control) trials, to which participants should not respond. Participants wore an eye tracker, and viewed stimuli on a 19-inch monitor with their chin in a chin rest to minimize head movements.
In the first session, participants were told only to detect and report the new target as
quickly and as accurately as possible. No instructions were provided to influence participants’ search strategy. Researchers classified participants as overt or covert searchers, based on the number of eye movements they made. Spontaneous overt searchers made an average of 19.22 saccades per target-absent trial, while spontaneous covert searchers who averaged 10.07 saccades per target-absent trial. This difference was statistically significant.

30
Participants completed two additional sessions of 216 trials each but were given instructions about how to search for the target. The 16 spontaneous overt searchers were advised that in previous studies, a covert search strategy was found to be the most efficient; they were instructed to keep their gaze at the center of the screen and to try not to move their eyes during a trial during the second and third sessions. The 14 spontaneous covert searchers were told that, based on the findings of previous studies, the best strategy is to actively search the display for the target. They were told to make frequent eye movements to search the display for the target for the second and third sessions.
There was a significant main effect of session on eye movements for both groups,
indicating that both were able to modify their search strategy as instructed: overt searchers assigned to a covert strategy made significantly fewer eye movements from session 1 to 2 and from session 1 to 3; covert searchers assigned to an overt strategy made significantly more eye movements from session 1 to 2 and from 1 to 3. There was also a significant main effect of session on target accuracy for both groups. Overt searchers instructed to search covertly were significantly more accurate (more hits and fewer false alarms) from session 1 to 2 and from session 1 to 3. Covert searchers instructed to search overtly were significantly less accurate in session 2 compared to session 1, but there was no difference in accuracy between sessions 1 and 3. There was a significant main effect of response time for both groups: overt searchers assigned to a covert strategy detected the targets significantly faster on sessions 2 and 3 compared to session 1, as well as on session 3 compared to session 2. However, covert searchers instructed to search overtly also showed faster target detection time for sessions 2 and 3 compared to session 1, as well as between sessions 2 and 3. The reduction in response time at session 2 came at the expense of detection accuracy, but both detection time and accuracy improved from session 2 to session 3 for the covert to overt searchers. The researchers concluded that spontaneous use of a covert strategy (optimal strategy) provided some protective effect while using the maladaptive strategy in the following sessions. In addition, their findings indicated that when provided with instruction, the performance of spontaneous overt searchers can reach that of spontaneous covert searchers.
Neider, Boot, and Kramer (2010). These researchers studied age-related differences in
ability to locate a target that blends in with its surrounding environment, whether any differences could be attenuated with training using a camouflage search paradigm, and whether the camouflage training paradigm would transfer to improved target search and identification for novel objects in novel backgrounds. The study found that camouflage-trained participants required fewer eye movements to fixate a target and less time to recognize the target than non-camouflaged trained participants, and the differences were more robust for older participants (n=16, 55 to 78) than for the younger participants (n=16, 18 to 25).
The camouflage search task was constructed using 40 targets plus distractor images of
children’s toys (e.g., stuffed animals, toy vehicles, and games) selected from a photo object database, and sized to fit within an 80 x 80 pixel box. A 35 x 35 pixel tile was copied from the center of each target and repeated over a blank 800 x 600 pixel canvas, creating a corresponding target-similar camouflaged background. All search displays were presented in full color. For the non-camouflaged displays all search objects (in color) were presented on a gray background. Half of each age group was trained on camouflage targets and the other half on non-camouflaged
31
targets. All participants completed three training sessions of 300 trials each, and one transfer session with 300 trials. Target presence/absence (50% each) and distractor set size (9 and 19) were manipulated. In each trial, the search objects were randomly assigned to locations on an imaginary 10 x 7 grid spanning the entire display, with the central six locations kept empty to minimize the likelihood that the target would be fixated directly following the onset of the search display. Two subsets of objects were created from the full set of 40 toy images by randomly assigning objects to one subset or the other. The subset of objects on which participants were trained was counterbalanced between participants, and at the transfer session, participants searched for objects from the opposite subset (i.e., novel objects). An eye-tracker recorded eye movements (fixations and saccades). Response times and accuracy were recorded with a gamepad, with the left trigger indicating a target present response, and the right trigger indicating a target absent response. Participants began each trial by fixating a centrally located dot on a gray background and pressing a button. The dot was then replaced by the target object. After 1.5 s the target was replaced by the search display. Participants were instructed to locate the target as quickly as possible without compromising accuracy, and to make a target present or target absent button-press response. Participants received feedback on accuracy after each trial and on average speed and accuracy every 20 trials. Participants were instructed to improve speed while not sacrificing accuracy.
The pre-trained older participants performed poorly on the initial camouflage search task;
however, they showed large response time and accuracy improvements over three training sessions. On the transfer task, camouflage-trained older participants recognized the target approximately 1,200 ms faster than non-camouflage trained older adults, once the target was fixated. Training benefits for the older participants were larger (102% improvement in search efficiency) than for the younger participants (19% improvement)
The findings provided evidence that the training improved visual processes underlying a
difficult search task. While some visual processing functionality declines with age, training can reduce the deficit. While training on camouflage search tasks significantly improved search performance across training trials compared to training in non-camouflaged tasks, camouflage training also transferred to improved search performance on novel camouflaged displays. The authors acknowledge that the transfer was narrow (subjects performed the same task in training as in transfer, except that different targets were presented).
It is unknown whether practice on a camouflage search task would transfer to driving tasks such as searching for hazards (e.g., pedestrians who may blend in with the background) or locating a street sign that blends in with surrounding trees. However, if improvements in
pre-attentive visual processes underlie training (as shown by Scalf et al., 2007) and improve the ability to zoom out and gather visual information more efficiently (as shown by Pesce 2005), and transfers to better performance for novel targets in a camouflaged search task
as per Neider et al. (2010), then the possibility exists.

32
References
Anstey, K., & Wood, J. (2011). Chronological age and age-related cognitive deficits are associated with an increase in multiple types of driving errors in late life. Neuropsychology, 25(5), 613-621
Ball, K., Beard, B., Roenker, D., Miller, R., & Griggs, D. (1988). Age and visual search: expanding the useful field of view. Journal of the Optical Society of America, 5(12) 2210-2219.
Ball, K., Edwards, J., & Ross, L. (2007). The impact of speed of processing training on cognitive and everyday functions. Journals of Gerontology, 62B (Special Issue I), 19-31.
Ball, K., Edwards, J., Ross, L., & McGwin, G. (2010). Cognitive training decreases motor vehicle collision involvement among older drivers. Journal of the American Geriatrics Society, 58(11), 2107-2113.
Ball, K., Ross, L., Roth, D., & Edwards, J. (2013). Speed of processing training in the ACTIVE study: who benefits? Journal of Aging and Health, 25(8) 65S-84S.
Bao, S., & Boyle, L. N. (2009). Age-related differences in visual scanning at median-divided highway intersections in rural areas. Accident Analysis and Prevention, 41, 146-152.
Becic, E., Boot, W., & Kramer, A. (2008). Training older adults to search more efficiently: scanning strategy and visual search in dynamic displays. Psychology and Aging, 23(2), 461-466.
Bédard, M., Porter, M. M., Marshall, S., Isherwood, I., Riendeau, J., Weaver, B., … Miller-Polgar, J. (2008). The combination of two training approaches to improve older adults’ driving safety. Traffic Injury Prevention; 9:70–76. [PubMed: 18338298]
Byrd, M. (1984). Age differences in the retrieval information from semantic memory. Experimental Aging Research, 10(1), pp. 29-33.
Classen, S., Cormack, N. L., Winter, S., Monahan, M., Yarney, A., Lutz, A.L., & Platek, K. (2014). Efficacy of an Occupational Therapy Driving Intervention for Returning Combat Veterans. Occupational Therapy Journal of Research: Occupation, Participation, and Health, 34(4), 176-182.
Clay, O. J., Wadley, V. G., Edwards, J. D., Roth, D. L., Roenker, D. L., & Ball, K. (2005). Cumulative meta-analysis of the relationship between useful field of view and driving performance in older adults: current and future implications.” Optometry and Visual Science, 82(8), 724-731.
Corbetta, M., & Shulman, G. (2002). Control of goal-directed and stimulus driven attention in the brain. Nature Reviews Neuroscience, 31, 201–215.
Cosman, J., Lees, M., Lee, J., Rizzo, M., & Vecera, S. (2011). Impaired attentional disengagement in older adults with useful field of view decline. The Journals of Gerontology, Series B: Psychological Sciences and Social Sciences, 67(4), 405-412.
Cosman, J., Lees, M., Lee, J., Rizzo, M., & Vecera, S. (2012). Visual search for features and conjunctions following declines in the useful field of view. Experimental Aging Research, 38: 411-421.

33
Dukic, D., & Broberg, T. (2012). Older drivers’ visual search behavior at intersections. Transportation Research Part F, 15, 462-470.
Fisher, D. L., Pollatsek, A. P., & Pradhan, A. (2006). Can novice drivers be trained to scan for information that will reduce their likelihood of a crash? Injury Prevention, 12(Suppl 1), i25-i29.
Grosbras, M., Laird, A. R., & Paus, T. (2005). Cortical regions involved in eye movements, shifts of attention and gaze perception. Human Brain Mapping, 25, 140–154.
Hassan, S., Turano, K., Munoz, B., Munro, C., Roche, K., & West, S. (2008). Cognitive and vision loss affects the topography of the attentional visual field. Investigative Ophthalmology & Visual Science, 49(10), 4672-4678.
Horswill, M. S., Marrington, S. A., McCullough, C. M., Wood, J., Pachana, N. A., McWilliam, J., & Raikos, M. K. (2008). The hazard perception ability of older drivers. Journals of Gerontology, Series B: Psychological Sciences and Social Sciences, 63, P212–P218.
Horswill, M., Falconer, E., Pachana, N., Wetton, M., & Hill, A. (2015). The longer-term effects of a brief hazard perception training intervention in older drivers. Psychology and Aging, 30(1), 62-67.
Horswill, M. S., Kemala, C. N., Wetton, M., Scialfa, C. T., & Pachana, N. A. (2010). Improving Older Drivers’ Hazard Perception Ability. Psychology and Aging, 25(2), 464-469.
Horswill, M., Pachana, N., Wood, J., Marrington, S., McWilliam, J., & McCollough, C. (2009). A comparison of the hazard perception ability of matched groups of healthy drivers aged 35 to 55, 65 to 74, and 75 to 84 years. International Neurological Society Journal, 15(5), 1-4.
Jonides, J. (2004). How does practice make perfect? Nature Nauroscience, 7, 10-11.
Knowles, M., Holton, E., & Swanson, R. (2005). The adult learner: the definitive classic in adult education and human resource development. Sixth Edition. London: Elsevier Butterworth-Heinemann.
Kramer, A., & Willis, S. (2002). Enhancing the cognitive vitality of older adults. Current Directions in Psychological Science, 11(5), 173-177.
Lavalliѐre, M., Laurendeau, D., Simoneau, M., & Teasdale, N. (2011). Changing lanes in a simulator: effects of aging on the control of the vehicle and visual inspection of mirrors and blind spot. Traffic Injury Prevention, 12(2), 191-200.
Lavalliѐre, M., Simoneau, M., Tremblay, M., Laurendeau, D., & Teasdale, N. (2012). Active training and driving-specific feedback improve older drivers; visual search prior to lane changes. BMC Geriatrics, 12(5).
Lindenberger, U., Mayr, U., & Kliegl, R. (1993). Speed and intelligence in old age.” Psychology and Aging, 8, pp. 207-220.
Marottoli, R. A., Ness, P. H., Araujo, K., Iannone, L. P., Acampora, D., Charpentier, P., & Peduzzi, P. (2007). A randomized trial of an education program to enhance older driver performance. Journal of Gerontology: Medical Science,10:1113–1119.

34
Mayhew, D., Robertson, R., & Vanlaar, W. (2014). Computer-based cognitive training programs for older drivers: what research tells us. Traffic Injury Research Foundation. Retrieved from: www.tirf.ca/publications/PDF_publications/Computer-based-cognitive-training-for-older-adults_6.pdf).
Mills, K. (2005). Disciplined Attention. Chapel Hill, NC: Profile Press.
Monahan, M. (2014). Visual search skills. Richmond, VT: Driver Rehabilitation Institute.
Neider, M., Boot, W., & Kramer, A. (2010). Visual search for real world targets under conditions of high target-background similarity: exploring training and transfer in younger and older adults. Acta Psychologica, 134, 29-39.
Nobre, A. C., Sebestyen, G. N., Gitelman, D. R., Mesulam, M. M., Frackowiak, R. S., & Frith, C. D. (1997). Functional localization of the system for visuospatial attention using positron emission tomography. Brain, 120, 515–533.
O’Brien, J., Edwards, J., Maxfield, N., Peronto, C., Williams, V., & Lister, J. (2013). Cognitive training and selective attention in the aging brain: an electrophysiological study. Clinical Neurology, 124, 2198-2208.
Pesce, C., Guidetti, L., Baldari, C., Tessitore, A., & Capranica, L. (2005). Effects of aging on visual attentional focusing. Gerontology, 51, 266-276.
Roenker, D., Cissell, G., Ball, K., Wadley, V., & Edwards, J. (2003). Speed-of-processing and driver simulator training result in improved driving performance. Human Factors, 45(2), 218-233.
Romoser, M., Pollatsek, A., Fisher, D. L., & Williams, C.C. (2013). Comparing glance patterns of older versus younger experienced drivers: scanning for hazards while approaching and entering the intersection. Transportation Research, Part F, Traffic Psychology Behavior, 16, 104-116.
Romoser, M. (2013). The long-term effects of active training strategies on improving older drivers’ scanning at intersections: a two-year follow-up to Romoser and Fisher (2009). Human Factors, 55(2), pp. 278-284.
Romoser, M. & Fisher, D. L. (2009). The effect of active versus passive training strategies on improving older drivers’ scanning in intersections. Human Factors, 51(5), 652-668.
Romoser, M., Fisher, D. L., Mourant, T., Wachtel, J., & Sizov, K. (2005). The use of a driving simulator to assess senior driver performance: increasing situational awareness through post-drive one-on-one advisement. Proceedings of the Third International Driving Symposium on Human Factors in Driver Assessment, Training, and Vehicle Design. Pp. 456-463.
Salthouse, T. A. & Somberg, B. L. (1982). Isolating the age deficit in speeded performance. Journal of Gerontology, 37(1), pp. 59-63.
Scalf, P., Colcombe, S., McCarley, J., Erickson, K., Alvarado, M., Kim, J., … Kramer, A. (2007). Journals of Gerontology, 62B (Special Issue I), 32-44.

35
Scott, H., Hall, L., Litchfield, D. & Westwood, D. (2013). Visual information search in simulated junction negotiation: gaze transitions of young novice, young experienced, and older experienced drivers. Journal of Safety Research, 45, 111-116.
Serences, J. T., & Yantis, S. (2006). Spatially selective representations of voluntary and stimulus-driven attentional priority in human occipital, parietal and frontal cortex. Cerebral Cortex, Epub. March 2, PMID 16514108.
Serences, J. T., Shomstein, S., Leber, A. B., Golay, X., Egeth, H. E., & Yantis, S. (2005). Coordination of voluntary and stimulus-driven attentional control in human cortex. Psychological Science, 16, 114–122.
Staplin, L., Lococo, K., Brooks, J., & Srinivasan, R. (2013, April). Validation of rehabilitation programs for older driversReport No. DOT HS 811 749): Washington, DC: National Highway Traffic Safety Administration. Available at www.nhtsa.gov/sites/nhtsa.dot.gov/files/811749.pdf
Staplin, L., Lococo, K., Martell, C., & Stutts, J. (2012). Taxonomy of older driver behaviors and crash risk, Appendix D [Literature review: Effects of functional aging, medical conditions, and medications on driving performance and behavioral countermeasures to reduce crash risk] (Report No. DOT HS 811 468C). Washington, DC: National Highway Traffic Safety Administration. Available at https://rosap.ntl.bts.gov/view/dot/1927/dot_1927_DS1.pdf?
Stutts, J., Martell, C., & Staplin, L. (2009, June). Identifying behaviors and situations associated with increased crash risk for older drivers (Report No. DOT HS 811 093). Washington, DC: National Highway Traffic Safety Administration. Available at www.nhtsa.gov/DOT/NHTSA/Traffic%20Injury%20Control/Articles/Associated%20Files/811093.pdf
Waugh, N. C., Thomas, J. C., & Fozard, J.L. (1978). Retrieval time from different memory stores. Journal of Gerontology, 33(5), pp. 718-724.
West, S. K., Hahn, D. V., Baldwin, K. C., Duncan, D. D., Munoz, B.E., Turano, K. A., … Bandeen-Roche, K. (2010). Older drivers and failure to stop at red lights. Journal of Gerontology, 65A(2), 179-183.
Wetton, M. A., Horswill, M. S., Hatherly, C., Wood, J., Pachana, N. A., & Anstey, K. J. (2009). The development and validation of two complementary measures of drivers’ hazard perception ability. Accident Analysis and Prevention, 42(4):1232-9.
Wood, J., & Owsley, C. (2014). Gerontology viewpoint: useful field of view test. Gerontology, 60(4), 315-318.
Wood, J. M., & Troutbeck, R. (1995). Elderly drivers and simulated visual impairment. Optometry and Vision Science, 72(2), 115-124.

A-1
Appendix A: Annotated Bibliography
This annotated bibliography provides more detail describing the objectives, methods, results, strengths and weaknesses of the subset of 16 studies most relevant for supporting enhancements to a visual training protocol and in developing data collection designs for evaluating training effectiveness.

A-2
Literature Review Topic: Differences in Younger and Older Drivers’ Visual Scanning Behavior While Driving
Reference Bao, S., and Boyle, L.N. (2009). Age-related differences in visual scanning at median-divided highway intersections in rural areas. Accident Analysis and Prevention, 41, 146-152.
Study Type Field study: on-road, in traffic with instrumented vehicle
Study Objective To examine age-related differences in visual scanning as drivers performed three maneuvers at two median-divided highway intersections with different crash frequencies.
Independent Measures
• Intersection crash rate (high versus low) • Driving maneuver (a left turn and right turn from the minor rural road onto the major
expressway, and a straight across maneuver through the intersection). • Driver age group (young, middle-aged, older)
Both intersections were two-way stop-controlled intersections, with a major expressway and a minor rural road. The major expressways were divided highways with two lanes of traffic on each side. The posted speed limit of the expressways was 65 mph (or 105 km/h).
• High-crash intersection: average of five crashes per year; mean traffic volume 18,225 vehicles per year; 2-lane rural road had posted speed limit of 35 mph.
• Low-crash intersection: less than one crash per year; mean traffic volume 16,850 vehicles per year; 2-lane rural road had posted speed limit of 55 mph.
Dependent Measures
• Proportion of visual scanning to the following areas: 1. Far left hand side (head movements greater than 45◦ to the left, 2. Close left hand side (head movement less than or equal to 45◦ to the left), 3. Far right hand side (head movement greater than 45◦ to the right), 4. Close right hand side (head movement less than or equal to 45◦ to the right), 5. Opposing direction, (straight ahead without head movements), 6. Rearview mirror (as a measure of driver’s visual attention toward the environment), 7. Other (e.g., speedometers).
• Randomness of visual scanning (entropy rate): A higher entropy rate represents greater randomness or higher scanning to multiple areas with shorter average fixation duration. A lower entropy rate indicates more focused scanning in only a few areas with longer average fixation duration. Based on the entropy rate calculation, the entropy rate could range from 0 (minimum randomness as defined by repeated samples fixated in only one area) to 7.52 (if the driver checks all seven areas with equal probability).
Sample Characteristics
60 active drivers (all crash-free in prior 3 years) from 3 age groups, with 10 males and 10 females in each group:
• Younger drivers 18 to 25 (mean age =21, S.D. = 2.1); • Middle-aged drivers 35 to 55 (mean age = 46, S.D. = 4.8); • Older drivers 65 to 80 (mean age = 73, S.D. = 5.2).
Methods/Procedures
• 2002 Ford Taurus instrumented sedan, with two LP-850 weather proof cameras and four MB-750 pinhole lens cameras installed in the vehicle to capture foot movements, face views, hand steering position, and vehicle to lane position.
• The visual scanning data were collected from 24m before the stop sign (the point at which most drivers began checking their right or left side for traffic) to 6m after the intersection (the point at which most drivers stopped checking their right or left side for traffic).
• The proportion of visual scanning towards the left (regions 1 and 2) or right (regions 3 and 4) within the three locations was calculated in 3-m intervals: (1) on the approach to the intersection, (2) on the approach to the median, and (3) upon exiting the intersection.
• The separation of the three locations was defined by drivers’ foot movement (e.g., approach to the intersection started at 24m from the stop sign and ended when the driver started depressing the accelerator pedal to begin entrance into the intersection).

A-3
Reference Bao, S., and Boyle, L.N. (2009). Age-related differences in visual scanning at median-divided highway intersections in rural areas. Accident Analysis and Prevention, 41, 146-152.
Results
• Older drivers scanned significantly less toward the left and right during intersection negotiations when compared to middle-aged and younger drivers.
• The older drivers also focused more on one traffic stream before executing a right or left turn and this was shown also by the lower proportion of time looking toward the turning direction when compared to the other age groups. [This is opposite of the findings of Romoser et al, 2013, who found that older drivers more often scanned towards the intended travel path than younger experienced drivers].
• Both older and younger drivers were less likely to scan all areas as indicated by their lower entropy rate than middle-aged drivers during the approaches to and leaving the intersection. • Middle-aged drivers checked their rearview mirror a significantly higher proportion of time than older
and younger drivers during all three maneuvers. Approach to the intersection: • Middle-aged and younger drivers had significantly higher proportions of visual scanning to the left
compared to older drivers. No difference was observed between younger and middle-aged drivers. • Middle-aged drivers spent a significantly higher proportion of time visually scanning to the right than
younger and older drivers. At the low crash intersection, older drivers spent significantly less time visually scanning the right side before a left turning maneuver when compared to both younger and middle-aged drivers. Older drivers visually scanned the right side significantly less at the high crash intersection than at the low crash intersection.
• Middle-aged drivers had significantly higher entropy rate than both older and younger drivers before two turning maneuvers.
Approach to the median: • Older drivers performed significantly less visual scanning toward the left (the oncoming traffic flow) than middle-aged drivers and younger drivers. No difference was observed between middle-aged drivers and younger drivers. All drivers scanned the left significantly more while preparing for left turns than for going straight across. • No age differences for proportion of time scanning right or visual scanning randomness Exiting the Intersection • Older drivers spent less time visually scanning to the left (oncoming traffic flow for a right turn) than
both younger and middle-aged drivers. • Middle-aged drivers had a significantly higher proportion of time scanning the right (oncoming traffic
flow for completion of through movement or left turn from median) than both younger and older drivers. No differences were found between younger and older drivers.
• Middle-aged drivers had significantly higher entropy rate of visual scanning after left turning than both older and younger drivers.
Study Strengths and Weaknesses
Strengths: • The study provides evidence that older drivers scan left and right less frequently than younger and
middle-aged drivers in real-world settings, with actual crash risk, so the visual scanning findings comparing old versus younger and middle-aged drivers may be more reflective than studies conducted in simulators.
Weaknesses/Limitations: • While this study provided information about median-divided highway crossings, the median
permitted drivers to treat the intersection as two separate intersections, thus simplifying the crossing and left turn maneuvers, making it difficult to generalize the findings to non-median-divided intersections.
• Findings comparing visual scans straight ahead by age group were not reported. • There was no eye tracker apparatus, so drivers may have scanned left and right at higher rates than
reported using eyes only, particularly on the approach to the intersection/stop sign.

A-4
Literature Review Topic: Differences in Younger and Older Drivers’ Visual Scanning Behavior While Driving
Reference Dukic, D., & Broberg, T. (2012). Older drivers’ visual search behavior at intersections. Transportation Research Part F, 15, 462-470.
Study Type Field study: on-road, in traffic with instrumented vehicle
Study Objective To determine whether there is a difference between older and younger drivers’ visual search behavior at intersections.
Independent Measures
4 intersection types/maneuver and traffic condition selected for analysis: 1. T-Intersection with stop sign, no leading vehicle; 2. 4-way signalized intersection; right turn with priority (no stop at light), no leading vehicle 3. 4-way signalized intersection; left turn with no waiting for unprotected road users 4. 4-way signalized intersection; right turn: all scenarios selected for analysis
Driver age group Older versus younger
Dependent Measures
• Neck flexibility (extension, left and right side flexion, and left and right rotation) • Eye movements: location (straight, left, right) and object (vehicle, sign) • Number of head turns left and right during intersection approach and traversal • Distance from intersection at first gaze left or right • Speed on approach to intersection
Sample Characteristics
• 53 younger drivers (10 females and 43 males): 27 to 49 (average 39.8 years); annual driving distance = 12,987 miles, average years licensed = 22
• 26 older drivers (9 females, 17 males); 73 to 80 (average 77 years); annual driving distance = 5,717 miles, average years licensed = 55
Methods/Procedures
• The SMI Iview eye tracker was used to record eye movements during driving with 50 Hz sampling frequency. An instrumented vehicle was used to drive through the experimental route where speed, brakes, turn signal and steering wheel were recorded at 10 Hz.
• Two experimenters accompanied each participant on the 1-hour drive, one sitting in the front reading the map for the subject and the other sitting in the back to secure online measurements.
• For each intersection, three zones were identified in relation to intersection start (1) preparation phase = point where the intersection became visible to the driver; (2) execution phase, which began when the driver began braking; and (3) control phase when the driver passed the intersection point (crossed into the intersecting roadway).
Results
• The younger drivers were more flexible than the older drivers in neck extension (+11.4), side flexion right (+17) and left (+14) and rotation right (+18.2) and left (+19.9). Differences were statistically significant for all measures but flexion.
• At the first and fourth intersections older drivers made more head rotations than younger drivers; however, at intersections 2 and 3, younger drivers made more head rotations than older drivers [(no test of significance was reported, but the means did not appear very different (< 1.1)].
• Analyses of first gaze distance from intersection were limited to the first 2 intersections. Only at the 2nd intersection was there a significant difference in distance by age group: Older drivers were closer to the intersection when they looked into it for the first time, indicating that younger drivers prepared their driving into the intersection by looking earlier compared to the old drivers.
• Analyses of speed on approach and up to the intersection line showed significant differences for age only at the T-intersection where there was a stop sign: The young drivers had a statistically significant higher speed when going into the intersection compared to the old drivers and they also had a higher speed when starting to brake.
• There was no significant difference for gazes left, right, and to the rear-view mirror, by age group at the T-intersection (controlled by the stop sign). Drivers looked straight most often, followed by to the left, then to the right, and to the rear-view mirror.
• At the 2nd intersection (right turn with priority at signalized 4-way intersection, gazed straight ahead were the most frequent, followed by gazes to the right (in the direction of the intended turn), and then into the rear-view mirror. Older drivers looked significantly longer straight ahead than younger

A-5
Literature Review Topic: Differences in Younger and Older Drivers’ Visual Scanning Behavior While Driving
Reference Dukic, D., & Broberg, T. (2012). Older drivers’ visual search behavior at intersections. Transportation Research Part F, 15, 462-470.
drivers, and younger drivers looked left (in the direction of potentially conflicting traffic if opposing traffic had run their red) significantly longer than older drivers.
• For the left turn at the 4-way signalized intersection, drivers looked straight ahead most of the time, followed by to the left (in the intended direction of travel) and then into the rearview mirror. Younger drivers spent significantly more time looking to the left than the older drivers, and older drivers looked straight ahead significantly more than younger drivers.
• At the 4-way intersection regulated with a traffic signal for turning right, drivers looked longer straight ahead, and then to the right (in the intended direction of travel). There were no significant differences as a function of age group.
• In terms of the area of interest for gazes, overall, younger drivers spent more time looking at possible threats, such as other vehicles that could cut their path in the intersection whereas older drivers spent more time looking at road markings, where they were positioned on the road in relation to these and other road users and any information that helped in positioning their own vehicle both laterally and longitudinally.
• Older drivers had a significantly longer mean fixation time than younger drivers at the 2nd and 3rd intersection. Older drivers had a larger between-drivers variance in fixation time compared to younger drivers at all intersections except at the stop-controlled T-intersection.
Study Strengths and Weaknesses
Weakness: • To make equal comparisons for all subjects, maneuvers with control of opposing traffic were selected
for analyses, and therefore drivers had the right-of-way for maneuvers at 3 of the 4 intersections, which may have resulted in fewer head turns and gazes than would be observed if drivers did not have the right-of-way, and may have obscured larger between-groups differences.
• Strengths: • Study confirmed the findings of others who observed older drivers look more often at lane markings and
into their path of travel than younger drivers, and that younger drivers more often look in the direction of potential threats than older drivers (Romoser et al., 2013).

A-6
Literature Review Topic: Differences in Younger and Older Drivers’ Visual Scanning Behavior While Driving
Reference Lavalliѐre, M., Laurendeau, D., Simoneau, M., and Teasdale, N. (2011). Changing lanes in a simulator: effects of aging on the control of the vehicle and visual inspection of mirrors and blind spot. Traffic Injury Prevention, 12(2), 191-200.
Study Type Driving Simulator
Study Objective To examine differences between older and younger drivers’ lane change strategies, including frequencies of visual inspections of mirrors and the blind spot, and vehicle control (speed and lateral displacement) in a simulator environment.
Independent Measures
• Stimulus for lane change: (1) avoiding a parked vehicle partially or completely blocking the lane (e.g., a motionless car parked halfway into the shoulder, n = 7), or (2) overtaking slower moving vehicles (n = 9).
• Driver age group (older versus younger)
Dependent Measures
• Vehicle control: difference in speed and vehicle placement from 15 s prior to lane change to completion, and time to make the lane change
• Visual inspections to areas of interest: frequency of looks to rearview mirror, left side mirror, and blind spot for each driver, divided by the number of lane changes
• Degree of head rotation while checking left mirror and blind spot
Sample Characteristics
• 10 younger drivers (6 males and 4 females, age range = 20–24 years) • 11 older active drivers (11 males, age range = 66–75 years). All scored > 27 on MMSE and had
normal or corrected to normal vision.
Methods/Procedures
• Fixed-based open-cab simulator powered by STISIM Drive 2.0, with projected images on a flat wall (1.45mhigh×2.0mwide) located 2.2m from the steering wheel. Simulator displayed a 40° horizontal by 30°vertical field-of-view. The left side mirror and a panel positioned in the left blind spot were instrumented with green and a red LEDs. The green LEDs informed the driver that a lane change was possible, whereas the red LEDs informed the driver to continue driving until green LEDs became active. The LEDs in each view area (left mirror and blind spot) illuminated as a function of the driving context (i.e., an approaching vehicle seen in the rearview mirror would trigger a red LED once the vehicle reached the blind spot and, assuming a constant speed, subsequently the red LED in the left side mirror). Participants were informed to use this information prior to executing a lane change; if a participant engaged in a lane change while an LED was still red, a “crash” would occur.
• 3 digital video (DV) cameras were mounted on the cab facing the subject and zoomed to fully capture head and eye movements during lane changes.
• Head movements (panning) were recorded with an electromagnetic system fixed on a small headband.
• A fourth camera captured the scenario displayed on the screen.
Results
• Vehicle control was similar for both groups of drivers, who changed lanes on average in 5.26 s when avoiding a parked vehicle and 6.03 s when overtaking a slower vehicle. The only significant difference was that younger drivers moved their car towards the left more than older drivers (on average .82 ft) while executing lane changes.
Visual inspection: • Older drivers looked in their rearview mirrors and blind spots significantly less frequently than
younger drivers: 51% older vs. 83% younger for the rearview mirror; 41% older vs. 86% younger for the blind spot.
• No difference was observed in the inspection frequency of the left side mirror: 73% older vs. 76% younger.
• Older drivers showed a constant frequency of visual inspections for both driving contexts (54% avoiding versus 56% overtaking), whereas younger drivers increased their inspection of the environment for all areas of interest when overtaking a slower vehicle compared to avoiding a vehicle parked partially in their lane (93% versus 71%, respectively).
Head rotations during visual inspections: • All drivers inspected their blind spots at least once.

A-7
Literature Review Topic: Differences in Younger and Older Drivers’ Visual Scanning Behavior While Driving
Reference Lavalliѐre, M., Laurendeau, D., Simoneau, M., and Teasdale, N. (2011). Changing lanes in a simulator: effects of aging on the control of the vehicle and visual inspection of mirrors and blind spot. Traffic Injury Prevention, 12(2), 191-200. • Younger drivers had a significantly larger magnitude of the head rotation while verifying the blind
spot than that of older drivers. • For the left side mirror, the difference in head rotation magnitude between the 2 groups was not
significant. However, when looking at the left side mirror, older drivers showed a greater frequency of visual inspection combined with a head turn than the younger drivers. For older drivers, 52% of all visual inspections to the left mirror included a head rotation (rotation greater than 2°), whereas this was observed for only 33 percent of the time for younger drivers.
Temporal occurrence of first visual inspection to maneuver initiation: • 68% of the lane changes made by the older drivers were executed with either a late verification of
the blind spot (i.e., during rather than before the lane change, 9%) or without any look to the blind spot (59%). This compares to 22% of the younger driver lane changes (8% with late verification and 14% with no verification).
Study Strengths and Weaknesses
Limitations: • Participants were specifically requested to change lanes with recorded messages. There was a
possibility that this could have triggered inspection strategies (particularly for younger drivers) that may not occurred as often in more naturalistic conditions.
• The simulation did not allow prediction of the occurrence of a lane change resulting from specific visual inspection sequences.

A-8
Literature Review Topic: Differences in Younger and Older Drivers’ Visual Scanning Behavior While Driving
Reference Romoser, M., Pollatsek, A., Fisher, D. L., and Williams, C.C. (2013). Comparing glance patterns of older versus younger experienced drivers: scanning for hazards while approaching and entering the intersection. Transportation Research Part F: Traffic Psychology and Behaviour [sic], 16, 104-116.
Study Type Driving Simulator
Study Objective
To investigate the glance protocols (viewing direction at each point in time during a turn) of older and younger experienced drivers when negotiating intersections during an interval that extended from 8 s before crossing into the intersection to 5 s after, to evaluate the following hypotheses for why older drivers fail to scan for threats at intersections as frequently as do younger drivers: difficulty with head movements; decreases in working memory capacity (forgetting to scan or forgetting scanning patterns); and increased distractibility by irrelevant stimuli.
Independent Measures
Three intersection types that require different driving maneuvers: • Left turn across oncoming traffic at a 4-way intersection with a 2-way stop on the side roads (the
driver did not have to stop); • Right turn from a stop at a T-intersection; and • Straight through a 4-way intersection with 2-way stop on driver’s approach (the driver had to stop, but
cross traffic did not). Each scenario contained features that could hide moving vehicles that were 3 s away from the center of the intersection if they traveled at the posted speed limit (e.g., sharp vertical or horizontal curves in the roadway).
Driver age group: older versus younger
Dependent Measures
• Horizontal angle of the driver’s point-of-gaze relative to the centerline of the vehicle at successive points in time. Measure was derived from eye tracker tapes scored by hand, by overlaying a grid on the video image and recording the angular deviation from the centerline of the vehicle every 1/3 of a second. Glance angles were collapsed into 5 categories: (1) far left (-27 degrees or more to left); (2) near left (-11 to -26 degrees); (3) central (-10 to +10 degrees relative to the driver’s car); (4) near right (+11 to +26 degrees); and (5) far right (+ 27 or more degrees to the right).
• Time spent looking (1) toward an area from which the most probable hazard could emerge; and (2) toward an area along the projected path of the vehicle through the intersection.
Sample Characteristics
• 18 older drivers (age 72 to 87; mean age = 77.7; SD = 4.6) and 18 younger experienced drivers (age 25 to 55; mean age = 35.0; SD = 9.0).
• All had 10+ years driving experience, drove 5,000+ miles/year, and had valid driving licenses with no medical or time-of-day restrictions.
• All had 20/20 corrected vision, scored within +/- 1 SD of the population mean for their age groups on the Trails B test, and could easily turn to read a sign presented behind them while holding onto a chair with both hands or letting go with one hand.
Methods/Procedures
Simulator: advanced driving simulator at the University of Massachusetts, Amherst, consisting of a full-body Saturn sedan cab, automatic transmission gearshift, and 3 large screens subtending 135 degrees of visual angle. Roadway was virtually projected onto the screens and refreshed at 30 Hz. Eye Tracker: ASL 5000 eye tracker measured point-of-gaze and head position, and sampled eye position at 60 Hz. Procedure: Practice drive followed by 45-min experimental session. Participants were instructed to drive normally and assume a speed limit of 30 mph. They were advised they would be following a lead vehicle through the virtual environment so they would know where to turn. The lead vehicle triggered the timing of other traffic, such that participants entered the intersection soon after other vehicles traversed the intersection; this should have indicated the potential for hidden threats when they themselves navigated the intersection (but they were not advised of this fact).
Results
For all 3 maneuvers, time0 (time zero) was defined as the moment when the driver crossed into the intersection at the point where the roads crossed. Left Turn Across Traffic: Major threat was that participant’s car could come into conflict with oncoming traffic during the left turn. A hill blocked the driver’s view of oncoming cars across the intersection until these oncoming cars were within 3 s of the intersection. The location critical for scanning (i.e., the region

A-9
Literature Review Topic: Differences in Younger and Older Drivers’ Visual Scanning Behavior While Driving
Reference Romoser, M., Pollatsek, A., Fisher, D. L., and Williams, C.C. (2013). Comparing glance patterns of older versus younger experienced drivers: scanning for hazards while approaching and entering the intersection. Transportation Research Part F: Traffic Psychology and Behaviour [sic], 16, 104-116. in which a potentially threatening vehicle could appear) was the central area approximately −10 to +10 degrees relative to the driver’s car before the turn and early in the turn. • No significant difference between groups in glance angle during approach to intersection (-8s to -2s).
Both groups primarily looking in the direction of travel (straight ahead). • Significant difference between groups in interval -2s to +1s (the critical interval just before and after
entering the intersection): younger drivers spent significantly more time than older drivers looking at the central region, where the potential threat vehicle might appear (1.1 s versus 0.4 s); the older drivers fixated more on the two left regions (significantly on the far left region) on the future travel path than the younger drivers (2.4 s versus 1.6 s).
• Since the “correct” response for hazard detection in this scenario was maintaining a glance straight ahead before the turn and early into the turn, study authors state it is unlikely that the failure of the older drivers to monitor this area resulted from difficulty in hear turning.
• No significant differences between groups during period +1 to +5 s (both groups looking in direction of travel, after they entered the intersection.
Right Turn at T-Intersection: The major threat was a car coming from the left, as the participant turned right to merge with traffic on the cross street which had the right-of-way. The “correct response for hazard detection was maintaining far left glances prior to and just into the right turn (large head movement to the left). A hill blocked the view of a vehicle approaching the intersection from the left traveling 35 mph, becoming visible only 3 s before it reached the middle of the intersection. The lead vehicle was programmed to begin its right turn when the participant was within 10 yards of its rear bumper (i.e., the right turning lead vehicle could have attracted visual glances). • No significant differences between groups either before −2 s or after +1 s. • Significant differences between the two groups in the critical interval (−2 s to +1 s): older drivers
looked into the far left (potential danger) region much less than the younger drivers (0.82 s versus 1.4 s), and instead were looking to the near right (in the direction of their turn) much more than the younger drivers (0.74 s versus 0.32 s).
Straight Through Intersection: the line of sight for the driver was limited both to the right and left by horizontal curves, so cross traffic from both directions not visible until it was 3 s from the center of the intersection. “Correct” response for hazard detection was continually monitoring both right and left for unexpected traffic coming around the curve. No traffic approaching in the opposing lane (through traffic opposite side of intersection) as a potential threat. • Significant differences between groups in −8 s to −2 s interval: younger drivers spent more time
looking to both the far left and the far right than the older drivers; but older drivers looked to the near left region significantly more during this interval than the younger drivers, so that most of the difference between the groups was in looking to the right (younger drivers looked far right longer than older drivers).
• Significant difference between the groups in -2s to +1s interval: younger drivers glancing both to the far left and far right much more than the older drivers (1.85 s vs 0.80 s), and older drivers glancing to center zone (direction of travel) more than younger drivers.
• In critical −2 s to +1 s interval, 77.7% of the younger drivers looked both to the far left and far right versus 44.4% of the older drivers.
• Older drivers looked significantly more to the center region in the +1 s to +3 s interval than younger drivers (1.9 s versus 1.5 s).
• For the interval 0 s to +5 s, 72.2% of the younger drivers looked both far left and far right versus 5.5% of the older drivers.
Overall for Interval -2 s to +1s: • Straight through intersection: older drivers fixated the vehicle’s path through the intersection 66.7%
of the time versus 31.7% of the time for middle aged drivers (p<0.001) • Left turn across traffic—fixation on vehicle path: 77.8% older versus 54.4% middle aged (p < 0.01).

A-10
Literature Review Topic: Differences in Younger and Older Drivers’ Visual Scanning Behavior While Driving
Reference Romoser, M., Pollatsek, A., Fisher, D. L., and Williams, C.C. (2013). Comparing glance patterns of older versus younger experienced drivers: scanning for hazards while approaching and entering the intersection. Transportation Research Part F: Traffic Psychology and Behaviour [sic], 16, 104-116. • Turn at T-intersection—fixation on vehicle path: 66.1% older vs. 46.1% middle aged (p=.013).
Study authors’ conclusions regarding reason for fixating on projected travel path at the expense of monitoring for hazards: • Older drivers have acquired the “bad habit” of oversimplifying the task of dealing with potential
hazards to ensure they don’t hit anything, which includes both looking straight ahead and slowing down, but not being sure enough that the vehicle won’t hit them.
• In driving, the predominant response is to monitor the roadway ahead. As a result, the “bad habit” pattern of not scanning at intersections may result from a failure to inhibit the globally dominant action pattern (looking ahead) when a weaker, but more situationally appropriate, action pattern is called for (scanning left and right).
• Crashes are rare, and if older drivers have not been in any crashes at intersections, they have “learned” that their strategy of dealing with intersections (slow down and fixate on the travel path to avoid hitting anything) is a successful one.
• Older drivers may develop a habit that causes them to not perform a response of which they are perfectly capable and only need to reinstate.
Study Strengths and Weaknesses
Strengths: • Compares proportion of time older and younger experienced drivers spend looking to the left, right,
and center as they approach, navigate, and exit intersections. • Carefully controlled timing of potential conflict vehicles for leading vehicle to give drivers a preview
of possible hazards. Weaknesses: • Drivers may perform differently in an actual traffic environment compared to simulator environment.

A-11
Literature Review Topic: Differences in Younger and Older Drivers’ Visual Scanning Behavior While Driving
Reference Scott, H., Hall, L., Litchfield, D., and Westwood, D. (2013). Visual information search in simulated junction negotiation: gaze transitions of young novice, young experienced, and older experienced drivers. Journal of Safety Research, 45, 111-116.
Study Type Driving Simulator (Note: Study conducted in the United Kingdom and maneuver was a “right turn” which has the difficulties associated with a “left turn” for the United States and countries that drive on the right side of the road).
Study Objective
To examine the gaze transitions of young novice, young experienced, and older experienced drivers to discover differences in search strategies when selecting safe gaps to turn right at a T intersection. A gaze transition is the movement of the eyes between one fixation and the following fixation, providing information on the positional relationship of fixations.
Independent Measures
• Driver age group (younger versus older) • Driving experience (novice versus experienced)
Younger novice and older experienced drivers were considered “at risk” groups due to their higher crash rates at intersections, while younger experienced drivers were considered “lower risk”
Dependent Measures
7 areas of interest (AOI) for visual fixation (“Far” AOIs represent distances of more than 60 m from the driving position, ‘middle’ AOIs 20-60 m, “near” AOIs less than 20 m and the “center” AOI within 10 m): • Far Right • Middle Right • Near Right • Center • Near Left • Middle Left • Far Left
Sample Characteristics
• 14 young novice drivers (mean age = 20.57 years, SD=2.47; mean driving experience: 6.6 months; mean mileage prior 12-month period = 3680 miles);
• 14 young experienced drivers (mean age = 23.79 years, SD=3.04; mean driving experience 6.8 years, mean mileage prior 12-month period = 8425 miles);
• 14 older experienced drivers (mean age = 66.43 years, SD=5.03; mean driving experience 38.9 years, mean mileage prior 12-month period = 7250 miles).
All participants reported that they were free from any medical condition or prescribed medication that might impair driving performance, and reported having normal or corrected-to-normal eyesight.
Methods/Procedures
A SensorMotoric Instruments (SMI) head-mounted eye tracking system was used to collect data relating to gaze. The simulation environment comprised a fixed based driver assessment rig and a simulated intersection scenario.
Following 5 minutes of practice in using the simulator, a simulated intersection scenario was presented. Drivers were instructed to make a right turn maneuver in their own time and only when they felt comfortable doing so. The scenario started with a convoy of eight cars passing the intersection from both directions followed by a series of negotiable gaps that increased in 1.5 s increments.
The duration of recordings for drivers differed according to which gap they selected. For this reason and to allow comparison, recordings were analyzed in two phases. An initial scanning phase consisted of the first 10 seconds of each scenario in which there were no negotiable gaps. A decision phase consisted of the 5 seconds immediately prior to initiating the maneuver, so although each person's decision phase occurred at a different point in the scenario, they were functionally matched in representing the gaze patterns associated with each driver's accepted gap. Cursor position taken from the video recordings was coded frame-by-frame and categorized by AOI. Each code represented 40 ms of observable scanning and subsequent analysis converted these codes into gazes if maintained for longer than three frames (120 ms).
Results
Scanning Phase • 12 reliable transitions were found in the scanning phase, of which 4 were shared by all driver
groups: all drivers adopted a preview strategy in which they predominately searched between the far left/middle left and far right/middle right areas of the intersection. However, the young

A-12
Literature Review Topic: Differences in Younger and Older Drivers’ Visual Scanning Behavior While Driving
Reference Scott, H., Hall, L., Litchfield, D., and Westwood, D. (2013). Visual information search in simulated junction negotiation: gaze transitions of young novice, young experienced, and older experienced drivers. Journal of Safety Research, 45, 111-116.
experienced drivers also showed gaze transitions that extended to the middle and near areas as well, equating to a more even distribution of gaze transitions across the areas of interest for young experienced group.
• Novice and older drivers both made ‘sweeping’ transitions, bypassing adjacent areas in favor of the next AOI. In contrast, the transitions of young experienced drivers were restricted to adjacent areas, creating a pattern of more evenly distributed gaze behavior across AOIs. Authors state that visual input is suppressed during sweeping eye movements, indicating a less efficient scanning strategy in which information from adjacent areas may be missed, for ‘at risk’ young novice and older drivers, compared to the more evenly distributed gaze of young experienced drivers.
• Older drivers did not make any gaze transitions from middle left to near left or from middle right to near right (unlike the young-experienced drivers).
Decision Phase: • 9 reliable transitions were found during the decision phase, of which only 2 were shared by all
driver groups. These were from far right to middle right and near right to center. Transitions from near right to center may represent drivers tracking the last car of the formation before initiating the maneuver to ensure the earliest point of departure. Whereas the transitions from far right to middle right may reflect a final check to ensure the gap is clear.
• Younger experienced drivers made multiple transitions from far left to middle left and from middle left to near left, which would serve to extract information about speed and distance (for the vehicle they would need to merge in font of after crossing traffic coming from the right. In comparison, older drivers made only 1 transition to the left (far left to middle left), indicating their decision to merge in front of traffic approaching from the left was based solely on distance, not taking speed into account, Young novice drivers made no transitions to search for vehicles approaching from the left; other than sweeping transitions to follow traffic crossing through the intersection from the right and continuing to the left.
Study Authors’ conclusions related to older at-risk drivers: • Future interventions aimed at training driver's visual search strategies for intersection negotiation
should include practice in applying an evenly distributed search strategy across all areas of the intersection, and should include tasks designed to develop judgment of both speed and distance.
• The opportunity to practice delivering motor responses in parallel to an on-going appropriate visual search strategy should be an essential part of such training interventions.
• Interventions aimed at older experienced ‘at risk’ drivers should include modules to support the development of strategies that capitalize on preview scanning techniques, and ensure effective monitoring of vehicles as they pass through the junction from right to left (left to right, in the United States and countries that drive on the right side of the road).
Study Strengths and Weaknesses
• Scenarios did not include 4-way intersections where gaze fixations for oncoming traffic could be monitored for turns against oncoming traffic.

A-13
Literature Review Topic: Differences in Younger and Older Drivers’ Visual Scanning Behavior While Driving
Reference West, S. K., Hahn, D. V., Baldwin, K. C., Duncan, D. D., Munoz, B. E., Turano, K. A., … Bandeen-Roche, K. (2010). Older drivers and failure to stop at red lights. Journal of Gerontology, 65A(2), 179-183.
Study Type Field study: naturalistic instrumented vehicle study
Study Objective To examine the rate of running red lights in an older cohort of drivers and to determine associated visual and cognitive risk factors
Independent Measures
Demographics • Age (per year increment) • Sex • Race (Blacks/whites)
Medical history • History of arthritis • History of stroke • Pain (0 – 5 score; per unit increment)
Cognitive • MMSE (per unit increment) • Brief Auditory Test of Attention (per unit increment
better) • Trail Making Test Part B (per 10 s worse)
Visual function • Visual acuity (per line loss) • Contrast sensitivity (per letter seen) • Visual Field (per point missed) Visual attention • Vertical extent (per degree increased) • Horizontal extent (per degree increased)
Dependent Measures • Red light running failure rate: the number of failures per number of traffic lights encountered. • A failure was coded as traversing an intersection when the light was already red, or turned red within
the first third of the intersection Sample
Characteristics • 1,425 older licensed drivers in Maryland, recruited from the Salisbury Eye Evaluation Study. Age
range 67 to 87, mean age = 75.2, SD=5.2
Methods/Procedures
• Measures of vision and cognition were measured at Round 1, as well as real-time driving video collected in drivers’ own vehicles over a 5-day period. At Round 2 (1 year later) only driving video data were collected.
• The Attentional Visual Field (AVF) test measured the extent of peripheral vision in which objects were detected while attention was also centrally fixated. The test assessed the AVF extent out to a 20° radius in a divided attention protocol. Participants fixated on a circular target in the center of the monitor and attended to two numbers simultaneously presented for 250 ms, one at the center of the circular target and the other located at fixed degrees out to 20° along one of four possible meridians (horizontal meridians: 0° and 180°, and vertical meridians: 90° and 270°) eccentric to the central number. At the same time the numbers were presented, 7 filled circles were presented at the same eccentricity and with the same size as the eccentric number. Participants had to report correctly the central and outer numbers and the location of the outer number. The widest angle out to 20° for which the participant had correct responses was recorded in the vertical and horizontal meridians.
• Each participant’s car was outfitted with a Driving Monitor System (DMS) for 5 days. Each DMS unit utilized 5 sensors, which were monitored by a custom-developed computer system, consisting of 2 cameras, a GPS receiver, a magnetic compass, and a two-axis accelerometer. The color camera was oriented to capture images of the road; the monochrome camera was positioned to capture images of the driver. The GPS receiver provided location and velocity data, the magnetic compass provided heading information, and the accelerometers provided lateral and axial accelerations. The GPS record of the participant’s travels for the 5 days was compared against a database of traffic light locations. When the participant was within 30 m of a traffic light, the time was noted and the analysis software cued the recorded driver and road video to that time. If the accelerometer or GPS data indicated evidence of stopping, the instance was given an automatic “pass” by the program. Pass was defined as follows: if the speed at the light was less than 5 mph or if deceleration was greater than 10 mph. If a pass was not given, the

A-14
Literature Review Topic: Differences in Younger and Older Drivers’ Visual Scanning Behavior While Driving
Reference West, S. K., Hahn, D. V., Baldwin, K. C., Duncan, D. D., Munoz, B. E., Turano, K. A., … Bandeen-Roche, K. (2010). Older drivers and failure to stop at red lights. Journal of Gerontology, 65A(2), 179-183.
technician observed the road videos. If the technician observed in the road video a red light at any time the driver was going through the intersection, the encounter was graded as “fail.” If a green or yellow light was observed, the encounter was graded as “pass.” The camera was positioned in the vehicle such that the traffic light was only visible within the first third of the intersection, so a failure meant traversing the intersection when the light was already red or was turning red almost immediately upon entering the intersection.
• Each traffic light encounter, and “pass” or “fail” for that encounter, was counted for each person. A failure rate was calculated as the number of failures per number of traffic lights encountered. Variables found to be associated with failure in Round 1 were used in predictive models of failure to stop at a red light in Round 2. Driving data were captured in Round 2 for 738 of the 1244 participants for whom driving data were captured in Round 1.
Results
• Of those who encountered a traffic light at Round 1, 3.8% failed to stop appropriately. 15% of offenders failed 10% or more of the traffic lights they encountered.
• In Round 1, race, the brief auditory test of attention, Trails B, pain score, and AVF (both horizontal and vertical) were associated with running red lights The auditory test of attention was not included in the predictive model for Round 2 because of the strong correlation with the visual test of attention, and because the AVF was more relevant to detecting visual targets than the auditory test. Vertical AVF was included in the model (over Horizontal) based on the size of the association.
• For Round 2, only loss of AVF was related to failure to stop at red lights. • The median AVF in those who failed to stop at least once at a red light was close to 7° compared
with that in those who had no failures at 12°. Those who failed more than 10% of the traffic lights encountered had a median AVF of 6°.
• Study authors state that they previously showed that AVF was associated with both cognition and the visual field. However, they did not find that, by itself, missing points in the visual field was related to stopping failure at red lights, which suggests that the cognitive component of the AVF is the component of interest. Furthermore, the test of auditory attention was also related to red light running, further supporting the role of attention in failure to stop.
• Study authors hypothesized that, as older drivers approach an intersection and are paying attention to surrounding cars and traffic flow, the loss of vertical attentional field would hamper detection of the high-hanging traffic signal, which may have changed color. As the driver approaches the intersection, the traffic light moves to an increasingly more peripheral location in the vertical meridian, and if this location is part of the attentional field dropout, the older driver may not detect the change.
Study Strengths and Weaknesses
Weaknesses • Potential for self-selection bias: possible that only older drivers with good vision and good
measures of cognition participated in the study. • DMS may have influenced more “good” driving as participants were aware their driving
behavior would be observed. However, participants uniformly stated that they forgot about the system while driving.
• Red light running may be related to the time allotted in the traffic signals to the amber color. Researchers had no data on the time allotted to the amber color.
Strengths • Objective assessment of actual driving performance using road conditions and routes routinely
encountered in our older population, without observer present.

A-15
Literature Review Topic: Training to Improve Older Drivers’ Visual Scanning Ability
Reference Ball, K., Edwards, J., Ross, L., and McGwin, G. (2010). Cognitive training decreases motor vehicle collision involvement among older drivers. Journal of the American Geriatricsl Society., 58(11), 2107-2113.
Training Type Computer-Based Speed of Processing Training
Study Objective To test the effect of speed of processing raining on subsequent at-fault motor vehicle collision involvement among older drivers
Independent Measures
Study Group: • Speed of Processing Training (SOPT) • Control (no training)
Dependent Measures State-recorded, at-fault motor-vehicle crash involvement up to 6 years following study enrollment
Sample Characteristics
• The SOPT group: 179 drivers 65 and older (mean age = 72.8 years) • No contact control group: 409 drivers 65 and older (mean age = 73 years)
Inclusion/exclusion criteria: > 65 years; no evidence of substantial functional (< 2 ADL disabilities) or cognitive decline (MMSE score > 23), and no self-reported diagnosis of Alzheimer’s disease or any other health conditions with potential concomitant functional decline or increased mortality risk. Excluded those with severe losses in vision (acuity worse than 20/50) or hearing (self-report), or communicative difficulties (based on the interviewer’s perception that participant could understand and be understood by others). None of the participants reported recently participating in any cognitive training studies.
Methods/Procedures
Trainer conducted SOPT in small groups of two to four participants at the study sites during approximately 70-minute sessions over a period of five to six weeks. Ten training sessions were administered (2 times/week for 5 weeks). SOPT involved practice of visual attention skills and the ability to identify and locate visual information quickly in increasingly demanding visual displays, using UFOV paradigm with the 3 subtests. Participants practiced speeded visual tasks on a computer, and difficulty was increased each time a participant achieved criterion performance on a particular task. For example, participants were asked to identify an object on a computer screen at increasingly brief exposures, followed by dividing attention between two tasks, then performing both tasks in the presence of distractions (with the primary modification being display speed).
Involvement in motor vehicle crashes from study enrollment to 6 years following study enrollment was obtained from the Department of Motor Vehicles. Determination of fault was obtained from the crash report. Determinations of fault are made by the police officer completing the report based upon information received regarding the circumstances of the incident and the role of the driver(s).
Results
• the SOPT group experienced a significantly lower rate of at-fault crashes per year of driving exposure compared to the control group (RR= 0.55, 96% CI 0.33-0.92) and per person mile driven (RR = 0.58, 95% CI 0.35-0.97);
• the associations were unchanged following adjustments for age at baseline, sex, race, education, study site, visual acuity, health, depression, and mental status. (RR= 0.52, 96% CI 0.31-0.87) and per person mile driven (RR = 0.57, 95% CI 0.34-0.96).
• SOPT was associated with a cognitive training gain relative to controls of 1.46 standard deviations at immediate post-test (measured pre- and post-training on UFOV test), suggesting that cognitive improvement is a mediating factor in the crash reduction results.
Study Strengths and Weaknesses
• Strength: showed the improvements in cognitive function translated to improved driving safety (reduced crash involvement).
• Weakness: no quantitative health rating scale or index of cumulative illness to compare groups at baseline; no driving exposure measures to compare groups for confounds of exposure in crash reduction

A-16
Literature Review Topic: Training to Improve Older Drivers’ Visual Scanning Ability
Reference Classen, S., Cormack, N.L., Winter, S., Monahan, M., Yarney, A., Lutz, A.L., and Platek, K. (2014). Efficacy of an Occupational Therapy Driving Intervention for Returning Combat Veterans. Occupational Therapy Journal of Research: Occupation, Participation, and Health, 34(4), 176-182.
Training Type OT-Based Training
Study Objective To determine whether an occupational therapy intervention (OT-DI) which included visual search training, reduced driving errors in a simulator.
Independent Measures
Case Study (no control group, no groupings by age)
Dependent Measures
Number of driving errors and type: • gap acceptance (determining safe time to cross in front of oncoming vehicle), • signaling (appropriate use of turn signals), • adjustment to stimuli (properly responding to road signs, other vehicles, pedestrians, or hazards) • vehicle positioning (space between vehicles), • speed regulation (too fast or too slow), • lane maintenance (lateral positioning of the vehicle), • visual scanning checking mirrors before lane changes and checking cross streets at intersections)
Sample Characteristics
NOTE: Sample did not include older drivers, however, this study is included in this annotated bibliography because returning combat veterans (CV) often have poly trauma that impairs visual, cognitive, perceptual and motor skills. PTSD mainly influences cognitive functions including attention, executive function, and processing speed, which may impair fitness to drive. Age-related diminished cognitive impairment is associated with similar impairments, but it is unknown whether the training would transfer to an older population. Sample included 8 combat veterans 30 to 55 (mean age = 39.8) who served in either Operations Enduring Freedom or Iraqi Freedom, a diagnosis of mild traumatic brain injury or PTSD, or an orthopedic injury, a valid driver’s license, MMSE at least 24/30.
Methods/Procedures
• DriveSafety 250 simulator was used to administer baseline and post-training driving assessments. Occupational therapy driver rehabilitation specialists (OT-DRS) scored drivers on 7 driving errors using a standardized scoring sheet. Drives consisted of suburban setting with residential neighborhoods and rural roads (6 min) and city and highway settings lasting 10 minutes. Stimuli with potential to elicit hypervigilance were built into scenarios (trash bags, roadkill, helicopters flying overhead, loud backfire noise).
• OT-DI consisted of three sessions 60 to 90 minutes each, occurring over a 6- to 8-week period. • Session 1: OT-DRSs discussed baseline driving errors with the CV and explained
strategies to diminish these errors. • Session 2: OT-DRSs used a visual search CD that depicted roadways typical of those
found in the United States (Visual Search Skills, developed by Miriam Monahan, Driver Research Institute, Richmond, VT). The CVs first identified distractions they were taught to attend to while in combat (i.e., scanning their environment instead of scanning the roadway) and then verbally called out the critical roadway information (e.g., a car pulling out of a driveway, a traffic light turning red as they are approaching) to manage safe driving in civilian life.
• Session 3: CVs performed a narrated drive applying and demonstrating the strategies taught previously. The OT-DRSs assessed driving errors and addressed those observed errors via feedback.
Results • All errors decreased from pre to post-test, but only total errors and lane maintenance errors were
significantly reduced (possibly due to small sample size and Type 2 error). Visual scanning mean errors decreased from 0.63 to 0.00 (p=.06)
Study Strengths and Weaknesses
Limitations: Small sample size, unknown whether training would transfer to reduction in errors on the road, no control group. Strength: The fact that lane maintenance errors decreased, even in the presence of triggers that would normally have diverted their attention from the roadway, indicates the OT-DI was effective in helping CVs adapt their driving behaviors (ignore triggers) for improving driving safety in a civilian environment.

A-17
Literature Review Topic: Training to Improve Older Drivers’ Visual Scanning Ability
Reference Horswill, M. S., Kemala, C. N., Wetton, M., Scialfa, C. T., and Pachana, N. A. (2010). Improving Older Drivers’ Hazard Perception Ability. Psychology and Aging, 25(2), 464-469.
Training Type Individualized Video-Based Training
Study Objective To determine whether older drivers’ hazard perception latencies could be improved by training with expert commentary on a video drive depicting hazardous conditions
Independent Measures
Study Group • Video presentation with expert commentary (Training Group) • Video presentation without expert commentary (Control Group)
Dependent Measures • Latency to identify potential traffic conflicts on the Hazard Perception Test, presented on a touchscreen computer.
Sample Characteristics
• 24 drivers (14 males, 10 females) 65 to 94 (mean age = 7.83 years) randomly assigned to Training or Control Group.
• Average mileage 4,805 miles/year • None had scores in the clinical range for depression, anxiety, or cognitive status • No significant difference between groups on acuity, contrast sensitivity, UFOV, Stroop test,
Trails A or Trails B.
Methods/Procedures
Study was conducted in 1 session which took approximately 2 hours (which included cognitive and visual performance testing, as well as anxiety and depression scales, pre- and post HPT administration, and hazard perception training intervention).
Hazard Perception Test (HPT): • Video footage of a driver’s eye view of unstaged hazardous traffic situations, presented on a 15-
in. touch screen. Participants were instructed to touch any road user (e.g., cars, cyclists, pedestrians) who was likely to become involved in a traffic conflict with the camera car as early as possible. A traffic conflict was defined as a situation in which the camera car was required to brake or steer to avoid a collision.
• 2 versions of the HPT were designed by splitting scenes from a validated test (Horswill et al, 2008; Wetton et al., 2009) into 2 sets (1 with 22 conflicts lasting 14 minutes and the other with 19 conflicts lasting 16 minutes). Reliability correlation = .72.
• Response time to each traffic conflict was calculated as the time elapsed between the first possible moment the relevant road user was visible and the point at which the participant touched the road user.
• Because this test was designed to be a latency rather than a hit rate measure, conflicts were chosen such that nearly all participants would be expected to respond eventually.
• One HPT was given pre-training and the other post-training (order counterbalanced across both study groups).
Hazard Perception Training Video and Control Video
• A 17-min video of real driving, depicting a variety of hazardous situations was presented to participants.
• Theo training group also heard an expert driving instructor giving a running commentary on the footage, indicating what he was paying attention to and giving general advice about anticipating hazards. For example: “Scanning ahead. Looking over the crest of the hill. Car turning left. Approaching traffic. More cars coming toward us. Cars on the right. Checking amongst the trees.” Before hearing the commentary, those in the trained group were given written instructions, explaining the training and giving additional advice (e.g., “While you are watching the video consider: what can be seen; what cannot be seen; what may reasonably be expected to happen?”).
• Those in the Control group viewed the video sequences but without hearing the commentary. They were given instructions beforehand, telling them to pay attention to the video “as if they were the driver of the vehicle depicted” but were not given any advice on hazard perception

A-18
Literature Review Topic: Training to Improve Older Drivers’ Visual Scanning Ability
Reference Horswill, M. S., Kemala, C. N., Wetton, M., Scialfa, C. T., and Pachana, N. A. (2010). Improving Older Drivers’ Hazard Perception Ability. Psychology and Aging, 25(2), 464-469.
Results
• Latencies of Training group improved significantly between pre- and post-training test (4.93 s versus 4.40 s) • No significant difference in Control group latencies between pre- and post- training test (5.43 s versus 5.51 s) • No significant difference between groups on pre-intervention test (Training group = 4.93 versus Control group = 5.43 s) • Significant difference between groups on post-training test (Training Group = 4.40 s versus Control Group = 5.51 s) • Training group responded to traffic conflicts 513 ms earlier than they had prior to the training
(latencies of Control group were unchanged following the intervention). • The time difference as a result of the training would equate to a distance of approximately 8.9 meters
(29 ft) on the road if one was travelling at 60 kph (37 mph), which could plausibly be the difference between having and not having a crash.
Study Strengths and Weaknesses
• Whether training would transfer to shorter hazard identification latencies in actual driving was not tested in this study.
• Longevity of training effect was not tested.

A-19
Literature Review Topic: Training to Improve Older Drivers’ Visual Scanning Ability
Reference Horswill, M., Falconer, E., Pachana, N., Wetton, M., and Hill, A. (2015). The longer-term effects of a brief hazard perception training intervention in older drivers. Psychology and Aging, 30(1), 62-67.
Training Type Individualized Video-Based Training
Study Objective
To determine whether the reduction in response latencies shown on the HPT immediately following a hazard perception training intervention would be sustained at 1 month and 3 months post training, and whether a booster training 1 month post-training would reduce latencies at 3 months compared to no booster training.
Independent Measures
Study Group: • Hazard perception training (25 subjects; mean age 71.05 years; 36.4 % female; mean MMSE =
94.9) • Hazard perception training plus booster training (26 subjects; mean age 72.32 years; 45.5%
female mean MMSE = 94.45) • Control – no training (24 subjects; mean age 73.46 years; 37.5% female; mean MMSE = 94.91)
Dependent Measures • Latency to identify potential traffic conflicts on the Hazard Perception Test, presented on a touchscreen
computer. Four unique tests were developed from a pool of 153 video clips, pre-intervention test had 39 clips, and each post-training test (immediate, 1-month, 3-month) had 38 clips. Internal consistency of each test = 0 .73.
Sample Characteristics
75 older drivers (ages 65 to 89) recruited from local newspapers, and randomly assigned to group. • None had ever taken a Hazard Perception Test (HPT) • Drove an average 6,258 miles per year • Scores > 75 on MMSE (all cognitively healthy) • No significant differences between groups on simple RT on touch screen or MMSE, age, miles
driven, % female
Methods/Procedures
Study performed in 3 sessions: • Session 1 duration: 2 to 2.5 hours: demographics, driving history, simple RT, pre-intervention
HPT, hazard perception training or control videos, immediate post-intervention HPT • Session 2 duration 1.5 to 2 hours: 1-month post-intervention HPT; booster training for booster
training group • Session 3: 3-month post-intervention HPT
Hazard-Perception Training: • Began with an instructional video defining traffic conflicts and how they could be anticipated by
searching for relevant cues. Instructions for training exercises that would follow, but no mention of HPT or how to achieve a high score on the test.
• Participants completed 4 trials each of the following 2 types of video-based training exercises. • Participant-generated running commentary while viewing a traffic scene filmed from the driver’s
perspective. The traffic scene was replayed accompanied by a prerecorded expert driver commentary, for comparison with their own.
• Participants viewed a traffic scene that suddenly and without warning cut to a black screen. Participants were asked to describe all of the possibilities for what could happen next. The clip was replayed and frozen at the same moment, followed by a recording of the expert driver listing all possibilities. The clip was played past the cut point so that participants could see what actually happened.
Control Group Placebo Intervention: Participants viewed video clips of a driving instructor discussing aspects of safe driving not directly related to hazard perception. Between these clips, participants viewed the same traffic clips that appeared in the training package, but without expert commentary or instruction.
Hazard Perception Training Booster: Participated in the initial hazard perception training and saw 22 min of additional training video at the end of the 1-month follow-up session, which consisted of a shortened instructional video explaining the video exercises.

A-20
Literature Review Topic: Training to Improve Older Drivers’ Visual Scanning Ability
Reference Horswill, M., Falconer, E., Pachana, N., Wetton, M., and Hill, A. (2015). The longer-term effects of a brief hazard perception training intervention in older drivers. Psychology and Aging, 30(1), 62-67. Hazard Perception Test (Outcome Measure):
• Video footage of a driver’s eye view of unstaged hazardous traffic situations, presented on a 15-in. touch screen. Participants were instructed to touch any road user (e.g., cars, cyclists, pedestrians) who was likely to become involved in a traffic conflict with the camera car as early as possible. A traffic conflict was defined as a situation in which the camera car was required to brake or steer to avoid a collision.
• 4 unique versions were created using 105 clips from a previously validated HPT plus 48 new clips (correlation between response times to old and new clips = .77). Pre-intervention test had 39 clips, and all post-training tests had 38 clips.
Results
• Significant immediate effect of training on hazard perception response times: trained participants responded an average of 0.81 s faster than controls.
• Effect of training on hazard perception response times remained significant at 1 month post-training: trained participants responded an average of 0.67 s faster than controls.
• Effect of training on hazard perception response times remained significant at 3months post-training: trained participants responded an average of 0.45 s faster than controls.
• No significant effect of training decay over time. • Booster session at 1 month post training did not improve latencies on 3-month HPT (no significant
difference in response latencies at 3 months for training group versus training + booster group).
Study Strengths and Weaknesses
Weaknesses: • Booster training may not have been effective, because there was no significant training decay at the
time it was administered. • No evaluation of whether training transferred to real-world driving situations • 3 participants dropped out due to simulator sickness (training in a simulator may not work for
everyone). • Small sample (and 11 of the initial 75 had missing data for one or more post-training sessions).
Report does not indicate counts of participants lost by group (not even the supplemental appendices). • Pre-intervention effects between Control and training groups had to be removed statistically (at
baseline, Control group responded significantly faster than training groups at baseline, even though group assignment was randomized)
• Participants may be more highly motivated to engage in training; study authors recommend more exercises in any real-world implementation of intervention.
Strength • Showed the hazard perception training effects could be sustained for up to 3 months post training

A-21
Literature Review Topic: Training to Improve Older Drivers’ Visual Scanning Ability
Reference Lavalliѐre, M., Simoneau, M., Tremblay, M., Laurendeau, D., and Teasdale, N. (2012). Active training and driving-specific feedback improve older drivers; visual search prior to lane changes. BMC Geriatrics, 12(5).
Training Type Driving Simulator Training
Study Objective To evaluate if simulator training sessions with video-based feedback can modify visual search behaviors of older drivers while changing lanes in urban driving
Independent Measures
Training Type: • Training with active practice and feedback (Feedback Group) • Training with active practice but no feedback (Control Group)
Dependent Measures • Frequency of mirror and blind spot checks prior to changing lanes • Temporal inspection of blind spot checks (with respect to initiation of maneuver)
Sample Characteristics
22 older drivers ages 65 to 85: • Feedback group: 6 males and 4 females, mean age 72.1 years) • Control group: 9 males and 3 females, mean age 69.3
No significant difference between groups for years of driving experience, km driven per week, or on visual, cognitive, and physical screening measures.
Methods/Procedures
Driving Simulator: A fixed-based open-cab simulator powered by STISIM Drive 2.0 (System Technology Inc.) was used for training, with images projected on a flat wall (1.45 m high × 2.0 m wide) located 2.2 m from the steering wheel. Projector displayed a 40° horizontal by 30° vertical field of view with the center of the screen located at eye-level through the midline of the subject. Three video cameras were mounted on the cab facing the subject and zoomed to fully capture head and eye movements. A fourth camera captured the scenario displayed on the screen. A magnetic tracker secured on driver’s head recorded head movements when driving. To simulate real driving conditions, the left-side mirror and a panel positioned in the left blind spot were instrumented with two white light emitting diodes (LED). The LEDs informed the driver about the traffic condition and the possibility of changing lanes (LEDs on represented traffic in target lane so no lane change should be attempted). The information displayed by the LEDs corresponded with the info displayed in the rear view mirror embedded into the simulator’s scenario. This info was provided for training participants to gaze at these regions and to process the information before changing lanes. If a driver changed lanes while the LEDs were on, a crash would occur and be recorded in the simulator file.
All subjects completed 5 study sessions as follows: Pre- and post-training on-road evaluation (Sessions 1 and 5). 7.5 mile (30 minute) on-road circuit in an urban area, with pre-determined directions during non-rush hour traffic, with a complete range of driving maneuvers. Each on-road evaluation included ten lane changes (8 towards the right and 2 towards the left). A qualified driving instructor sat in the passenger seat to provide instructions about upcoming maneuvers. No feedback was provided. The vehicle was instrumented with a GPS, 4 digital cameras (1 for driver’s head and 3 for the driving environment: forward view and right and left blind spots). Synchronized videos were recorded at 25 hz on a pc with an external battery. The recording from the first drive was used in Session 2 feedback training; recordings from both drives were used for analyses of pre- and post-test training on blind spot and mirror checks prior to lane changing.
Simulator Evaluation and Training: All subjects completed a 25-minute simulator evaluation on the same day they completed the on-road pre- and post-training evaluations. Recorded instructions informed participants about specific maneuvers (e.g., lane changes to pass a slower-moving vehicle). No feedback was given following the evaluations. The simulator drive was used to expose participants to the simulator, and to provide material for feedback for the first training session for the feedback group (Session 2). The simulator was used for all subjects in Sessions 2, 3, and 4, but only the feedback group received information about their performance on the road test (simulator training session 2) and on the prior simulator drives (for simulator training sessions 2, 3, and 4). Simulator drives were performed following individual driver refresher training courses in Sessions 2, 3, and 4 (given to all participants), based on AARP’s 55-Alive program, lasting 40 minutes. The training focused on traffic regulations, and blind spot checks when changing lanes, and vehicle control. Driving-specific feedback was given to the feedback group, based on their prior simulator drives, by showing them video re-plays of their drives, including

A-22
Literature Review Topic: Training to Improve Older Drivers’ Visual Scanning Ability
Reference Lavalliѐre, M., Simoneau, M., Tremblay, M., Laurendeau, D., and Teasdale, N. (2012). Active training and driving-specific feedback improve older drivers; visual search prior to lane changes. BMC Geriatrics, 12(5). simultaneous views of the roadway environment and their head and eye position at the time, and a plan view of the roadway. Feedback emphasized the role of preventive rather than reactive driving to increase mirror and blind spot inspections prior to lane changing. Their errors were pointed out, discussed, and proper reactions demonstrated. The feedback training was based on Risk Awareness and Perception Training Program (RAPT) described in Fisher, Pollatsek, and Pradhan (2006). Feedback participants then drove the scenario sections in the simulator where their errors occurred.
Video data from the pre-and post-training on-road drive were used to compare frequency of visual inspections to the rearview mirror, side mirrors, and to the blind spot (head/shoulder checks) for each lane change. This was done for 15 seconds prior to the lane change and 5 seconds post lane change, to determine temporal inspection of blind spot areas. If a visual inspection was made to any of the three areas of interest a 1 was assigned; otherwise a 0, Mean frequency for each driver was calculated based on sum for each area, divided by the number of lane changes.
Results
• On the pre-test drive, both groups inspected their mirrors more frequently than making direct looks to the blind spot, prior to lane changing. On average, pre-training looks to the rearview mirror occurred for 91% of all lane changes and to the sideview mirrors on 85% (with no significant difference between groups). However, blind spot inspections made by direct looks were less frequent in both groups, with the feedback group making significantly more that the control group), even before training (32.3% of lane changes versus 12.5%).
• There was no significant effect of training on looks to the rear-view and sideview mirrors (possibly due to a ceiling effect); however, the feedback group significantly increased their direct looks to the blind spot from pre- to post-road test (from 32.3% to 64.9%), whereas the control group did not (12.5% to 13.8%).
• Feedback drivers increased the percent of their visual inspections toward the blind spot that occurred prior to the maneuver initiation, from pre- to post-training road test. The control group did not change the frequency or the timing of their looks toward the blind spot, from the first to the second on-road drive.
• 2 of the 22 drivers (both controls) experienced simulator sickness (ratings of mild nausea), and therefore did not participate in the simulator training sessions (9% of the study sample)
Study Strengths and Weaknesses
Strengths: • Confirms that refresher training courses consisting of classroom training only do not transfer to
improvements in safe driving habits behind the wheel • Simulator training combined with driving-specific feedback improved on-road driving skills, and
could be an effective substitute for more costly on-road training. • Since both groups received the refresher training focusing on blind spot checks and active practice,
and only the feedback group improved blind spot behavior, suggests that driving specific feedback is a necessary component for older driver training.
Weakness: • Small sample size • Potential for simulator sickness may preclude the simulation training component for those prone to
simulator sickness (2 of the 12 older control subjects reported feelings of mild nausea during practice and were excluded from further simulator training, although they attended the refresher course).

A-23
Literature Review Topic: Training to Improve Older Drivers’ Visual Scanning Ability
Reference Roenker, D., Cissell, G., Ball, K., Wadley, V., and Edwards, J. (2003). Speed-of-processing and driver simulator training result in improved driving performance. Human Factors, 45(2), 218-233.
Training Type Computer-Based Speed of Processing Training
Study Objective To determine whether speed of processing training (SOPT) for older drivers with deficits in UFOV can improve UFOV as well as driving performance immediately post-training and at 18-months post training
Independent Measures
Study Group: • Speed of Processing Training (SOPT) • Non-interactive simulator and classroom training (traditional driver training program) • Control group (no training)
Dependent Measures
• On-road test performance • Global driving score • Scores on 8 composite measures
• UFOV Score
Sample Characteristics
• SOPT group: 48 drivers 59 to 86 (mean age = 72.1 years); UFOV reduction 30% or greater. • Non-interactive simulator training group: 22 drivers 63 to 81 (mean age = 72.4 years); UFOV
reduction 30% or greater. • Reference control group: 25 drivers 55 to 80 (mean age = 69 years); intact UFOV (reduction < 30%).
Methods/Procedures
• UFOV and driving performance were assessed pre-training, immediately post-training, and 18 months post-training.
SOPT: 4.5 hours and 1,040 training trials using UFOV-based protocol, but individually tailored. Training proceeded at individualized levels of complexity until the trainee could identify a single visual target at a display speed of 17 ms, could identify a visual target and simultaneously localize a peripheral target at a display speed of 40 ms with a peripheral target at 30°, and could perform this task when the peripheral target was embedded in distractors at a display speed of 120 ms and peripheral targets at 30°. Repeated practice of tasks of incrementally increasing complexity and decreasing display speed helped trainees to reach these goals. The overall goal of the training technique was to enhance cognitive processing speed by gradually increasing task difficulty while decreasing display speed until trainees achieved mastery through practice. Non-interactive simulator training: Two, 2-hour educational sessions conducted by CDRS in groups of 3-4 participants. Classroom style education consisting of an overview of rules of the road and safe driving practices, and practice with Doron simulator films demonstrating crash avoidance techniques, managing intersections, and scanning. Final hour consisted of in-vehicle demonstration by the driving instructor of safe driving skills. Driving evaluation: two loops of a 7-mile urban/suburban route with maneuvers deemed especially difficult for older drivers (e.g., left turns across traffic). At each potentially dangerous location, evaluators coded the extent the driver’s maneuver was “dangerous” (either the driving instructor had to take control of the vehicle, or other traffic had to alter their course to avoid a collision). Two evaluators seated in the back seat rated 455 items, while a driving instructor sat in the passenger seat to provide instructions to the study participant. Raters provided a global rating after each drive ranging from 1 (drive aborted/very unsafe) to 6 (very competent driver). The 455 items were combined into 8 composites: (1) dangerous maneuvers; (2) proper and timely use of turn signals; (3) position in traffic relative to surrounding traffic while moving; (4) vehicle speed control relative to posted speed limits; (5) vehicle position when required to stop at a traffic control device; (6) tracking, or position of vehicle in proper lane; (7) changing lanes on multi-lane roads; and (8) position of vehicle when turning.
Results
• SOPT significantly reduced UFOV reduction, and training effect persisted at 18 month follow-up • At baseline, UFOV performance of controls (23.4) was significantly better than SOPT group (41.4)
and simulator groups (37.95). • At immediate post-test, SOPT group’s UFOV performance (16.93) equaled control group (22.88),
while simulator trained group remained unchanged (33.41).

A-24
Literature Review Topic: Training to Improve Older Drivers’ Visual Scanning Ability
Reference Roenker, D., Cissell, G., Ball, K., Wadley, V., and Edwards, J. (2003). Speed-of-processing and driver simulator training result in improved driving performance. Human Factors, 45(2), 218-233.
• At 18 months post-training, pattern at immediate post-training persisted: control = 25.10, SOPT = 27.11, similar = 34.23.
• Both SOPT and simulator training improved global driving scores at immediate post-training assessment, but the effects were not sustained at 18 months.
• SOPT significantly decreased the number of dangerous maneuvers, and this effect persisted at 18 months post training; Simulator training did not reduce number of dangerous maneuvers.
• Simulator training improved use of turn signals and turning into the proper lane at immediate post-training assessment, but effects did not persist at 18 months. SOPT did not improve any other composite driving areas other than reduction of dangerous maneuvers.
Study Strengths and Weaknesses
Weaknesses: • 5 composite driving performance measures had to be dropped because of ceiling effects on the road
test: smoothness in use of accelerator pedal, gap selection, smoothness in vehicle deceleration, and yielding right of way to traffic at 4-way stops. A fifth composite, search at intersections (head and eye movements) had to be eliminated due to difficulty making these assessments (e.g., drivers wore sun glasses). This may have minimized the ability to show treatment effects.
• The reduction in dangerous maneuvers, although statistically significant, may not have much operational significance: the average number of dangerous maneuvers pre-training was 1.01 versus 0.65 at 18 months post-training.
Strengths: • Study links speed of processing defects of poorer on-road driving performance, and shows that speed
of processing training can improve UFOV as well as improve driving performance (i.e., reduce dangerous driving maneuvers that can lead to crash involvement), and that training effects persist at 18 months post-training.
• Study contained control groups, and measured on-road performance.

A-25
Literature Review Topic: Training to Improve Older Drivers’ Visual Scanning Ability
Reference
Romoser, M., Fisher, D. L., Mourant, T., Wachtel, J., and Sizov, K. (2005). The use of a driving simulator to assess senior driver performance: increasing situational awareness through post-drive one-on-one advisement. Proceedings of the Third International Driving Symposium on Human Factors in Driver Assessment, Training, and Vehicle Design. Pp. 456-463.
Training Type Driving Simulator Training
Study Objective To investigate whether post-drive feedback following a simulated drive was effective in changing older drivers’ attitudes about their own driving ability and could influence them to incorporate additional compensatory behaviors into their day-to-day driving.
Independent Measures Driver age: older versus younger
Dependent Measures
• Pre- and Post-Feedback driving habits questionnaire assessing: • Frequency of looking left and right at intersections (often, occasionally, rarely/never) • Frequency of secondary looks toward oncoming traffic when initiating a turn • Frequency with which they increased speed if they determined there was little time available to
make a turn • Frequency of looking left and right when approaching a crosswalk • Frequency of glancing into target lane when changing lanes on an interstate
• Number of “red flags” (errors) made during the simulator drive, consisting of: • Failed to execute a primary look to the right or left to assess traffic in the intersection, • Failed to execute a secondary look when proceeding into the intersection to assess oncoming
traffic in areas where traffic may emerge while in the intersection, • Took too long to turn given the time available, • Failed to fixate and / or react to a critical target moving in the periphery, • Merged an unsafe distance in front of another vehicle or, • Had a collision of any kind or other unanticipated reckless action taken by the participant.
Sample Characteristics
Students, faculty, and staff recruited from the University of Massachusetts, Amherst, MA, all with at least 10 years of driving experience:
• 18 older drivers (age 70+) • 18 younger drivers (25 to 55)
Methods/Procedures
• Driving simulator consisted of a full-body sedan surrounded by three projection screens subtending 135° of visual angle. A head-mounted eye tracker was used along with a magnetic head tracker. The information from both was used to determine the participant’s point of gaze, which was then overlaid on the video output of the simulator and recorded for later replay.
• Ten simulator scenarios represented situations where angle impact crashes were likely to occur if an error was made. Most of the scenarios involved turns at intersections. The scenarios could be grouped into (1) those that evaluated right turns, (2) those that evaluated left turns across traffic, (3) those that evaluated the driver’s ability to detect peripheral cues, and (4) lane-change scenarios.
• During the drive, the experiment administrator rated the driver’s handling as “acceptable” or “unacceptable” (coded as a “red flag”). After the experimental drive, the participants sat down with the experimenter to receive post-drive feedback. The participant’s drive was replayed on a large-screen television. All ten scenarios were replayed. After each scenario where a red flag was received, the video was paused and the administrator gave feedback regarding what the participant did wrong, why it could have led to a crash, and suggested compensatory strategies (such as taking secondary looks, or waiting for vehicles to move for a clear line of sight, etc.) to help avoid missing peripheral cues in similar situations to help avoid collisions.
• Six months after their session, ten drivers were invited back to the lab to drive again, to determine how well older drivers were able to incorporate the feedback they received into their actual driving strategy (5 drivers with fewest red flags (low RF) and 5 drivers with the most red flags (high RF). Participants drove 10 new scenarios with the eye tracker. Red flags were determined the same as the first session.

A-26
Literature Review Topic: Training to Improve Older Drivers’ Visual Scanning Ability
Reference
Romoser, M., Fisher, D. L., Mourant, T., Wachtel, J., and Sizov, K. (2005). The use of a driving simulator to assess senior driver performance: increasing situational awareness through post-drive one-on-one advisement. Proceedings of the Third International Driving Symposium on Human Factors in Driver Assessment, Training, and Vehicle Design. Pp. 456-463.
Results
• Older drivers were more than three times more likely to receive red flags as younger drivers (59 versus 18).
• Older drivers received the most red flags (10 total) in the Left Turn with a 3-Second Reveal scenario; Younger drivers received 5 for this scenario.
• The scenario with the second most red flags for older drivers was the Interstate Lane Change scenario (8 versus 2) followed by the Impatient Motorcyclist (7 versus 4) and Left Turn with Hidden Oncoming Traffic scenario (7 versus 5).
• Reasons older drivers received red flags were: failed to look before or during a turn (32 flags), turned too slowly (10 flags), merged too close to an adjacent vehicle (5 flags), failed to glance into adjacent lane before merging into it (3 flags), and failed to fixate on the risk in the peripheral field of vision (2 flags).
• Older adults who received red flags said they would be likely to very likely to change their driving behavior based upon the feedback they received. Both older and younger drivers who received feedback were generally receptive to the idea of incorporating the compensatory behaviors provided during the feedback sessions into their driving habits
• Both the low and high RF participants who completed a second driving session experienced a reduction in red flags. Low RF drivers: 12.5% average reduction; high RF drivers 20.8% average reduction.
Study Strengths and Weaknesses
Weaknesses: • Simulator study showed improved scanning; unknown if the training would transfer to actual driving • Small sample size Strengths: • Post-drive feedback in virtual traffic setting was effective in improving older driver’s scanning before
turning and changing, and in detecting potential hazards in the periphery.

A-27
Literature Review Topic: Training to Improve Older Drivers’ Visual Scanning Ability
Reference Romoser, M., and Fisher, D. L. (2009). The effect of active versus passive training strategies on improving older drivers’ scanning in intersections. Human Factors, 51(5), 652-668. STUDY 1:
Training Type Driving Simulator Training
Study Objective
• To determine whether older drivers looked less often for potential threats while turning than younger drivers (particularly secondary looks*).
• To determine whether older drivers would be accepting of feedback regarding their looking behavior and would consider implementing the recommendations based on a review of their performance.
*Secondary looks were defined as those that take place as or just after the driver begins a turn and are aimed in the direction from which other vehicles are most likely to come into conflict with the driver’s vehicle. Primary looks were defined as the act of glancing from side to side as drivers are stopped at an intersection and are waiting for a break in traffic to execute a turn.
Independent Measures Driver age group (older vs younger)
Dependent Measures
Vehicle handling and scanning errors: • failed to take a secondary look during a turn • took too long to complete the turn (3 s or longer) • merged too close to another vehicle (i.e., pulled out in front of a simulated vehicle, causing the
simulated vehicle to brake or crash into the driver), • failed to glance into the target lane while changing lanes (this criterion applied only to the highway
lane change scenario) • failed to fixate a peripheral risk (this criterion applied only to the bicycle-at-the-crosswalk scenario;
drivers were flagged if they did not scan to the left or right and fixate the bicyclist approaching the crosswalk), and/or
• other (risky maneuver, such as running a stop sign, leaving their lane or the road, or rear-ending the lead vehicle).
Likelihood of incorporating skills targeted in feedback (5-point scale, 1=much less often; 5=much more often): • When stopped, look both ways (primary look) • Take second look after starting turn (secondary look) • Increase speed if little time available to make turn • Scan to far left and right when approaching crosswalk • Turn head and glance into target lane before changing lanes
Sample Characteristics
• 18 older drivers 70 and older (range = 72 to 87; mean age = 77.7; SD = 4.62) • 18 younger drivers 25 to 55 (range = 25 to 55; mean age = 35.0; SD = 9.00), 10+ years of driving
experience.
Methods/Procedures
Driving simulator consisted of a full-body sedan surrounded by three projection screens subtending 135° of visual angle. An ASL 5000 head-mounted eye tracker was used along with a magnetic head tracker. The information from both was used to determine the participant’s point of gaze, which was then overlaid on the video output of the simulator and recorded for later replay. Participants encountered 10 scenarios representing a wide range of situations in which risky elements can appear from the side, outside of the driver’s field of view, and therefore require a head movement (8 of 10 at intersections, and required a secondary look). They followed a lead vehicle to facilitate scenario timing. Following the drive, the participant’s actual drive through each scenario was replayed during a review-and-feedback session. If the participant drove safely, this was pointed out at each instance to reinforce the behavior. If errors were recorded, three actions were taken: • Replay of the error portion of the drive, pausing to point out the driver’s error and potential
consequences (collision with oncoming car, hit bicyclist, near-collision, etc.). • Digital replay of an experimenter’s drive through the intersection, showing experimenter making
the same error, resulting in a crash.

A-28
Literature Review Topic: Training to Improve Older Drivers’ Visual Scanning Ability
Reference Romoser, M., and Fisher, D. L. (2009). The effect of active versus passive training strategies on improving older drivers’ scanning in intersections. Human Factors, 51(5), 652-668. STUDY 1: • Digital replay of a drive through the same intersection, demonstrating correct performance.
Results
• Older drivers were 3 times more likely than younger drivers to require review and feedback (59 scenarios versus 18 scenarios, respectively).
• Significant differences between older and younger drivers were found for failure to make secondary looks (32 failures versus 10 failures) and proportion of turns that were too slow (10 failures versus 1 failure).
• Older drivers indicated planning to scan significantly more often than younger drivers for all targeted situations with exception of scanning at a crosswalk.
• Authors examined differences in primary looks by age and found older drivers took approximately 2.6 primary looks vs younger drivers’ approximately 3.8 looks.
Study Strengths and Weaknesses
Weaknesses: • No visual, cognitive, or physical measures were taken to help determine whether failure to make
secondary glances was related to physical, visual, or cognitive factors • Not clear whether differences observed in simulator would occur in actual traffic. Strengths: • Showed that older drivers are receptive to feedback on driving performance and willing to implement
suggestions for improvement

A-29
Literature Review Topic: Training to Improve Older Drivers’ Visual Scanning Ability
Reference Romoser, M., and Fisher, D. L. (2009). The effect of active versus passive training strategies on improving older drivers’ scanning in intersections. Human Factors, 51(5), 652-668. STUDY 2
Training Type Driving Simulator Training
Study Objective
• To determine differences whether older drivers are as unlikely to take secondary looks in the field as they were in the simulator
• To compare the effectiveness of active and passive training on older drivers’ secondary look performance in the simulator and during actual on-road driving at intersections.
Independent Measures
Training Type (Note: content of training for both Active Learning and Passive Learning groups was the same: raising awareness of the crash statistics for older drivers, discussing how physical and cognitive declines can make negotiating intersections more dangerous, providing examples of intersections encountered during the pre-training simulator drive, and introducing and discussing the concept of a secondary look) • Active Learning: participants were guided through 10 intersections in the simulator containing
potential peripheral hazards. Before making the turn, they were instructed to first point out from where the hazards might develop and then, after they began the turn, to direct a secondary glance in that direction to check for newly arrived traffic.
• Passive Learning: traditional lecture-style training session consisting of PowerPoint slides, text, figures, and animations. Participants were also given a demonstration illustrating how a secondary look should be executed while turning
• Control Group – No Training
Physical and Cognitive Measures: Snellen Near and Far Visual Acuity tests, Grooved Pegboard Test, Trail Making Test Parts A and B, Rey Auditory Verbal Learning Test, Rey-Osterreith Complex Figure Test (ROCFT), Get Up and Go Test, Head/neck upper torso flexibility
Dependent Measures
• Percentage of secondary looks in simulator and field drives (number of intersections in which the driver took a proper secondary look divided by the total number of intersections, for each participant).
• Participants’ ratings on effectiveness of training (0= extremely ineffective to 10=extremely effective). • Effectiveness in raising awareness of how age-related decline in mental and physical functioning
can impact my driving • Effectiveness in teaching me how to better scan the road for hazards • Effectiveness in teaching me how to better incorporate head turning into my driving • Overall effectiveness
Sample Characteristics
54 older drivers ages 70 and 89 (range = 70 to 88; mean age = 77.54; SD = 4.55) divided into three age groups of 18 drivers each: 70 to 74, 75 to 79, and 80 to 89 years old. The 18 participants within each age group were assigned to one of three treatment groups (active learning, passive learning, and control), balanced for gender
Methods/Procedures
Same driving simulator used in Study 1, except all 10 scenarios were intersection negotiation. For both the simulator and field drives, a headband-mounted camera recorded head movements and the environment around the vehicle and three bullet cameras were placed on the roof of the participant’s vehicle to record the environment. The outputs of these four cameras were multiplexed into one four-quadrant split-screen view and were recorded on digital videotape.
Each subject completed 6 sessions (except for drivers 80 and older who did not participate in Session 3) • Session 1: vision, physical and cognitive tests and practice drive on the simulator. • Session 2: a simulator evaluation with 4-camera system recording the drive through 10 intersections
with peripheral hazards. • Session 3: field drive evaluation starting at the participant’s home, lasting 30 minutes and containing
several intersections. Participants drove their own vehicles and chose their own route. The four-camera mobile lab system recorded head movements and the environment around the vehicle. The experimenter did not accompany the participant during the drive.
• Session 4: driver training. (active and passive groups only)

A-30
Literature Review Topic: Training to Improve Older Drivers’ Visual Scanning Ability
Reference Romoser, M., and Fisher, D. L. (2009). The effect of active versus passive training strategies on improving older drivers’ scanning in intersections. Human Factors, 51(5), 652-668. STUDY 2
• Active learning group received customized feedback from a replay of the participants’ simulator (Session 2; all older adults) and field (Session 3; only 70- to 79-year-olds) drives. This feedback was similar to that received in Experiment 1 and including an assessment of head turns. Secondary look training on the simulator followed the feedback.
• The passive learning group received classroom training. • Session 5: post-training simulator drive, identical to Session 2. • Session 6: post-training field drive, identical to Session 3 (on the same route).
Results
• Prior to training, 34.4% of drivers took a secondary look before turning on the simulator, compared to 44.5% of drivers who took secondary looks before turning in the field.
• Positive and significant correlation in percentage of secondary looks in simulator and field, prior to training.
• Effect of training type on simulator performance (on pre- versus post-training simulator drives) was significant for percentage change in secondary glances for Active Training versus Passive Training groups and for Active Training versus Control groups (age and gender not significant):
• Active Training group: 35 percentage point increase across age groups (35 percentage points for ages 70 to 74, 21.6 percentage points for ages 75 to 79, 48.3 percentage points 80 to 89)
• Passive Training group: 14.4 percentage point increase across age groups • No significant difference between Passive Training Group and Control Group
• Effect of training type on field performance (on pre- versus post-training on-road drives) was significant for percentage change in secondary glances for Active Training versus Passive Training groups and for Active Training versus Control groups (age and gender not significant):
• Active Training group: 37.9 percentage point increase across age groups (45.1 percentage points for ages 70 to 74, 30.5 percentage points for ages 75 to 79)
• Passive Training group: almost no change • Control Group: almost no change
• Not all drivers benefited from training (1 driver in Active Training group and 5 Passive Trained Drivers showed a decrease in secondary looks in the field from pre- to post-test).
• For Passive Learning and Controls, no significant correlation between visual, cognitive, and physical measures on change in pre- to post-training secondary looks on simulator or field.
• For Active Training group, only ROCFT was significantly correlated with change in secondary looks in both simulator and field evaluations: those who scored high on ROCFT had a larger increase in secondary looks from pre- to post-training. (indicates physical and visual performance did not affect participants’ ability to change their scanning habits. The ROCFT is a test of visuospatial memory as well as memory, attention, planning and working memory (executive functioning), so a decline in any of these functions could affect learning of side-to-side glances (at-risk populations with cognitive decline may not benefit from training).
• Participants in Activing Learning group rated the training significantly more effective than the Passive Learning group.
• Study implications: Training programs made available for older drives should move beyond passive, classroom-style instruction techniques and provide drivers with more immersive, active practice of target skill sets.
Study Strengths and Weaknesses
Weakness: • Inability to determine whether it was the feedback or the active practice, or both that resulted in
increased secondary scanning. • High drop-out rate due to simulator sickness (34 of 88 older drivers recruited for Study 1 (38.6%);
future research might investigate field versions of active training to accommodate drivers prone to simulator sickness.

A-31
Literature Review Topic: Training to Improve Older Drivers’ Visual Scanning Ability
Reference Romoser, M., and Fisher, D. L. (2009). The effect of active versus passive training strategies on improving older drivers’ scanning in intersections. Human Factors, 51(5), 652-668. STUDY 2 Strengths: Shows that performance was similar in simulator and road environments (for head turning behavior)

A-32
Literature Review Topic: Training to Improve Older Drivers’ Visual Scanning Ability
Reference Romoser, M. (2013). The long-term effects of active training strategies on improving older drivers’ scanning at intersections: A two-year follow-up to Romoser and Fisher (2009). Human Factors, 55(2), pp. 278-284.
Training Type Driving Simulator Training
Study Objective To determine the long-term effects of active training on older drivers’ scanning at intersections, 2 years post-training
Independent Measures
Study group: • Active training • No training (Control)
Dependent Measures Number of secondary looks (glances aimed toward traffic in the periphery away from the path of the vehicle, after the driver has entered the intersection)
Sample Characteristics
• Active training group: 11 of the 12 participants who received active training in the Romoser and Fisher (2009) study who participated in the field drives. Age range 73 to 82, mean age = 77.4.
• Control group: 10 of the 12 participants who received no training in the Romoser and Fisher (2009) study who participated in the field drives. Age range 72 to 81, mean age = 76.5.
Methods/Procedures
Participants drove their own vehicles instrumented with the same apparatus as used in Romoser and Fisher, on the same 30-minute route they drove in 2009. No mention was made of the training received or the purpose of the field drive. The experimenter reviewed the route with participants until they could be recited with accuracy prior to the drive. The experimenter did not accompany the participants. The drives were videotaped with the head- and vehicle-mounted cameras used in the 2009 study. Scoring was completed by two experimenters blind to study group, who did not participate in the data collection. A secondary look was defined as a head turn made by the driver away from the path of the vehicle, towards areas from which other vehicles conflict with the participant’s vehicle from the side. At each intersection, a “yes” or “no” determination was made regarding whether a driver made a correct secondary look, and an overall percentage of secondary looks was calculated (number of intersections with a proper secondary look divided by total number of intersections traversed).
Results
• Active training group secondary looks: 2009 study pre-training = 46.3%, post-training 6-8 weeks = 79.6%, 2 years post training = 72.7%. 2-year post-training looks significantly higher than 2009 pre-training looks; 2-year post-training decrease from 2009 (6.9%) not significant.
• Control group secondary looks: 2009 study pre-training = 40.7%, post-training 6-8 weeks = 38.5%, 2 years post training = 42.9%. No significant difference in either interval.
• 6 of 11 active training group drivers remained within 10% of their post-training performance 2 years later. Only 3 drivers regressed by more than 10%, however, their 2-year post training performance was on average 24% higher than their 2009 pre-training performance.
• Neither cognitive nor physical functioning in 2009 was significantly correlated with likelihood of regression in secondary looking behavior.
Study Strengths and Weaknesses
Weakness: • having cameras installed on vehicle and wearing one on a headband may have prompted increased
looking behavior • Small sample size Strengths: • Large main effects of training were showed for active training group 2 years post-training, with no
significant increase by control group • Study demonstrates that customized feedback and active learning was effective in changing drivers’
scanning habits, and training effects were persistent even after 2 years.

A-33
Literature Review Topic: Training to Improve Older Drivers’ Visual Scanning Ability
Reference Staplin, L., Lococo, K., Brooks, J., and Srinivasan, R. (2013). Validation of Rehabilitation Programs for Older Drivers (Report No DOT HS 811 740). Washington, DC: National Highway Traffic Safety Administration.
Training Type Occupational Therapy Based Training
Study Objective To examine the effectiveness of an occupational- therapy-based visual training protocol (OT-VTP) to enhance the driving performance of normally aging adults, by comparing the on-road performance of treatment group drivers to a control group before and immediately after training, and 3 mo. post-training.
Independent Measures
Study group: • OT-VTP • Control
Dependent Measures
On-road performance evaluations on 3 unique routes, scored by a CDRS, who was blind to study group (3 routes were designed of equal driving difficulty to avoid repeated exposure by participants to the same conditions across successive assessments). The CDRS scored competence on 33 subscales comprising tactical (visual search & scanning tasks; vehicle positioning tasks; vehicle handling tasks) and strategic (cognitive & executive function tasks) domains of driving performance. The CDRS used a rating scale from 0 to 4, where ratings corresponded to approximately how often a driver demonstrated a particular skill or behavior, in relation to the number of opportunities to demonstrate it that were afforded.
Sample Characteristics
• OT-VTP Group: 16 older drivers (65 to 84, mean age = 72.1) • Control Group: 17 older drivers (66 to 81, mean age = 72.2)
Inclusion/exclusion criteria: held a current valid driver license, had a minimum of three years’ driving experience; currently drive a minimum of six trips per week; had not had a driving evaluation administered by a CDRS within the previous year; had not been advised by a physician that s/he should not drive, for any reason; and had a Mini-Mental State Examination (MMSE) score of 25 or higher
Methods/Procedures
Control Group: Participants completed 8 hours of activities involving direct contact with the research team, in activities unrelated to driving performance or driving safety (relaxation and meditation sessions, with an option to substitute a CPR certification class and/or nutrition counseling). Groups met 2 times per week for 4 weeks in a conference room; a health fitness specialist led the meditation classes. The CPR class was taught by a registered nurse and certified CPR trainer. The class met for one 4-hour session that included an informational lecture and hands-on training in CPR. The nutrition class was taught by a certified dietician. One, 2-hour class was comprised of an informational lecture plus slides.
OT-VTP Group: Study participants completed 8 hours of training using a protocol designed by Cyndee Crompton, OTR/L, CDRS, guided by the principles outlined in the text Disciplined Attention (Mills, 2005). The training protocol was organized according to 3 main content areas – visual field expansion, simultaneous processing of multiple visual stimuli, and ocular skill (visual search routine) exercises – that were carried out both in a clinical setting and in a training vehicle. An OT, not a CDRS, conducted the training activities. The sessions in this training program were designed sequentially to build upon skills from one session to the next. In alternate sessions, training participants were escorted to a vehicle in which training concepts introduced during exercises in the clinical setting were demonstrated under dynamic driving conditions. In these sessions, the OT either drove the car or sat in the back seat while a confederate drove the car. In the fifth (final) in-vehicle session, the trainee drove the vehicle, attempting a full integration of the practiced skills while executing the demands of driving in everyday traffic. For this session only, a licensed driving instructor and a dual-brake vehicle was employed. In this session, the OT rode in the back seat, delivered instructions, observed the trainee’s behavior, and provided feedback.
Results
• The OT-VTP group demonstrated a significant gain relative to the control group in the percentage of drivers without performance deficits at baseline who maintained their skills on subsequent evaluations (Drives 2 and 3). This effect was significant at p < .05 on the immediate post-treatment assessment and at p < .01 on the delayed assessment.
• For the few drivers who demonstrated some deficiency on the baseline assessment, the OT-VTP group achieved significant (p < .05) gains relative to the control group in the percentage of participants who improved their performance on the immediate post-treatment evaluation (Drive 2).
• OT-VTP training gains were not significantly sustained 3-ponths post-training (Drive 3), relative to the control group.
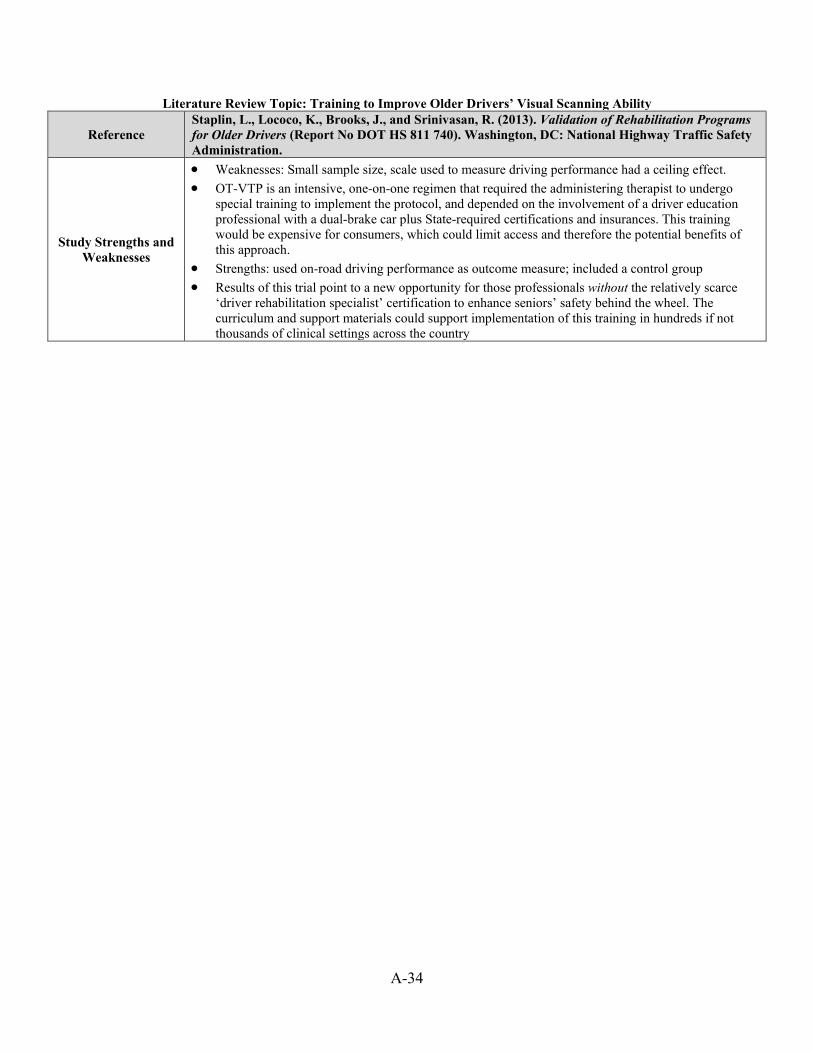
A-34
Literature Review Topic: Training to Improve Older Drivers’ Visual Scanning Ability
Reference Staplin, L., Lococo, K., Brooks, J., and Srinivasan, R. (2013). Validation of Rehabilitation Programs for Older Drivers (Report No DOT HS 811 740). Washington, DC: National Highway Traffic Safety Administration.
Study Strengths and Weaknesses
• Weaknesses: Small sample size, scale used to measure driving performance had a ceiling effect. • OT-VTP is an intensive, one-on-one regimen that required the administering therapist to undergo
special training to implement the protocol, and depended on the involvement of a driver education professional with a dual-brake car plus State-required certifications and insurances. This training would be expensive for consumers, which could limit access and therefore the potential benefits of this approach.
• Strengths: used on-road driving performance as outcome measure; included a control group • Results of this trial point to a new opportunity for those professionals without the relatively scarce
‘driver rehabilitation specialist’ certification to enhance seniors’ safety behind the wheel. The curriculum and support materials could support implementation of this training in hundreds if not thousands of clinical settings across the country

DOT HS 812 514 April 2018
13612-040418-v1a