visualisation - homework 1 - msc business analytics - imperial college london
TRANSCRIPT
Visualisation
Imperial College London, Msc Business Analytics
Homework 1
Jonathan Zimmermann
14-02-2016

Assignment 1a: Developing empathy and formingideas within different problem contexts
Introduction
Consider the curiosities, circumstances, purpose and ideas potentially involvedin the challenge of creating a visualisation/infographic in each of the followingmade-up scenarios.Compile a detailed briefing document outlining your assumptions, definitionsand ideas about the context and vision for each scenario.
0.1 Data source
Website of the department of criminal justice of the state of Texas:https://www.tdcj.state.tx.us/death row/dr executed offenders.html
Date of oldest execution of dataset: 12/07/1982
1

0.2 Data sample
2

3

1 Scenario 1
A pro-capital punishment US newspaper reporting on the milestone of the 500thexecution (pretend it is 2013).
Assumptions. We consider a medium-size daily newspaper in Texas. Quitepopular among the conservative/rural part of the population mostly through itsprint edition, it has managed over the recent years to attract a growing base ofyounger readers through its online edition thanks to a new policy of making afew selected article freely available on its website for the non-subscribers. Thisyounger readership, with less strongly defined political opinions, comes from amore mixed background but still represents only a small minority of the readers.
The newspaper is still majoritively owned and managed by a few members ofa conservative texan family. There has been a very old and strong tradition ofoperating the journal with profit only as a secondary objective, and the ownershave a strong influence on the content of the articles, generally shaped to matchthe (republican) political view of the family.
I am the youngest employee of a small team in charge of providing variousgraphics and illustrations for the articles. I have recently been hired as part ofan initiative to modernize the visual elements of the journal and make betteruse of data-backed visualisations. As the journal is still experimenting with suchmethods, I work alone but with the support of the rest of the team for adviceand to provide me with elements I might need, such as drawings.
1.1 Context: The reason
Outline what you think might be the essence of the curiosity: What question(s)do you think the potential audience might need answering/find interesting thatthe visualisation would ultimately present?
Stakeholders Intrigue. The family owning the journal has been personallyvery involved with the passing of a few pro-capital punishment bills in Texas.It wants to use the milestone of this 500th execution as an opportunity toreport on the status of death penalty in general. I am to create a double-pageinfographic, which the owners hope will illustrate with numbers the impact thatcapital punishments has had on the safety of texans and show the benefits ofsuch laws.
Audience Intrigue. Most of the audience is likely to hold a similar positionto the newspaper, i.e. be supportive of capital punishment, in which case thereaders will be particularly looking for information that confirms and supportstheir views.
4

The purpose of this newspaper is still to attract a quite large public rather thana highly specific political audience. Therefore, a fraction of the readers (notablythe younger readership of the online edition) might be relatively new to thequestion and looking for clues that will help them take a position in the capitalpunishment debate. Even though these readers might be looking for a moreneutral perspective, the newspaper will want to influence their position towardssupporting capital punishment. Therefore, for this audience, the visualisationalso needs to answer the question of why capital punishment is a good policy.The existence of this second type of audience, however, will force the newspaperand the visualisation to look a bit more objective.
As this is typically done when celebrating a milestone, the readers might ex-epect to find information ”aggregating/summarising” the situation since theintroduction of capital punishment rather than specifics regarding the story ofeach sentenced criminal. The kind of questions readers might have include:
• How many people were sentenced each year? Has this figure been changingover the years? Is it appropriate, should it be higher/lower?
• Where did these crimes happen? Is it next to where I live? Am I con-cerned?
• What is the typical profile (age, race, type of crime) of the sentencedcriminal? Has this profile been changing over the years?
• What are the main arguments, metrics and studies supporting my views?What numbers can I quote to make my opinion more credible when dis-cussing about the topic with others?
• Who are the important people (politicians, celebrities, . . . ) who have thesame opinion as me?
• How fundamentally bad are these people? What is the kind of atrocitiesthey have generally committed to (rightfully) deserve the capital punish-ment? What makes me fundamentally different from them?
1.2 Context: The circumstances
Work through the list (of 10 main headings) and describe your critical thinkingabout any assumptions, definitions or self-imposed factors you think might berelevant/existent. If any require no definition or are relevant to that scenario,explain why not?
1.2.1 People: Stakeholders
As explained earlier, the managers of the journal are very implicated in this ar-ticle. Even though I am supposed to submit all my work to my direct supervisorfor approval, it has been informally defined for this project that the owners of
5

the journal would be the ones taking the final decision of whether and how toinclude my infographic. Therefore, for the length of this project, I am de factoreporting directly to them without consulting my supervisor.
Their expectations have been clearly phrased. They hope that the visualisa-tion will help to convey their political message. They specifically asked for aninfographic that would be ”powerful” and make them and the readers ”proudto be American, proud to be texan, proud of the constitution”. They wantthe visualisation to be ”fact-based” and ”scientific looking”, but insisted that itdoesn’t include any ”metrics made-up by liberals to spread doubt in the mindsof true Americans”. By this last sentence, they were referring to recently pub-lished economic papers finding no causal relation between the crime rate andthe existence of a capital punishment.
1.2.2 People: Audience
As explained earlier, the typical audience is texan, conservative and rural. Asmall fraction of the readers live in other states, less than 1% of the readersare international. The median reader of the print edition is 54 years old andthe median reader of the online edition is 29 years old. The online edition onlyrepresents 4% of the total revenues, but is estimated to amount for about 20%of all the readers.
From a previous survey, we known that the typical reader has a high schooleducation and possible ”some university”, but most readers’ professional ac-tivity doesn’t include ”interacting with numbers on a regular basis”. Previousattempts to use data-based infographics have shown that the readers have astrong preference for intuitive visualisations that can be quickly grasped.
A small but significant fraction of the readers is strongly supportive capitalpunishment and already expects the journal to make a special article for thisoccasion. These readers would be very disappointed if the subject wasn’t cov-ered extensively or contained inaccuracies.
1.2.3 Constraints: Pressures
The 500th execution will normally happen in two days. I have been informedthis morning that I am assigned to this project and have to deliver the finalvisualisation in two days by 10 p.m. so that it allows for last minute changes.
It has been made clear to me that my performance on this work would be as-sessed and used as a reflection of my skills in general. As I am a new employee,the managers still haven’t received much feedback regarding my performances,and this will be an excellent opportunity to distinguish myself. The managersknow that and thus expect from me to put some extra hours on the project thenext two nights.
6

For a double-page visualisation, the policy of the journal is to allocate a 400$budget to purchase rights for any necessary illustration. As for every project, Iam also free to request any help I would deem necessary from the other membersof the design team who are not currently assigned to a particular project.
1.2.4 Constraints: Rules
The topic is expected to be the day after tomorrow’s headline. In addition tothe front page, the article will occupy a total of 5 pages. My infographic willoccupy a double-page (page 2 and 3 of the article), followed by two more pagesof text (page 4 and 5 of the article). The newspaper has a tabloid format, i.e.each page has dimension of 430 mm 280 mm. There is no limitation regard-ing colors, but it would be preferable that it respects the general set of colorsof the journal (mostly variations of red, similar to those of the republican party).
The policy of the newspaper is to design all visualisations with the print editionas the only edition in mind. The infographic might be adapted for the web lateronly if the format allows.
1.2.5 Consumption: Frequency
This is a one-off visualisation and will only be used for this one edition.
1.2.6 Consumption: Setting
The newspaper will be distributed through the regular channels. This will be aThursday edition and thus won’t be distributed over the week-end. It is very rarefor readers to read an old edition, so the infographic should only be ”consumed”on Thursday. If the web version gets popular, however, it is possible that a fewpeople keep visiting the article page for a few more days.
1.2.7 Deliverables: Size
I am to deliver a PDF version of a ready-to-print infographic by the deadline, andstore in the digital archive of the journal all the files and documents necessaryto reproduce or adapt my work. I can, if I wish, submit alternative version ofthe infographic for the editors to choose from, but all submitted work need tobe final and ready to print. I must be ready to accomodate any last minutechange.
1.2.8 Deliverables: Format
The standard format for the deliverables is PDF. I am not to worry about theweb adaptation, generally a simple cut from the raw PDF file.
7

1.2.9 Ressources: Creators
As explained earlier, I am to work alone, with the support of the rest of thedesign team if necessary.
1.2.10 Ressources: Technical
The newspaper has licenses for most popular design software, including thecomplete Adobe suite. I am free to use any software I want. If the purchase ofan additional software is required, I can either use the budget allocated to theproject (up to 100$ per software) or make a request to my supervisor.
I have been instructed to use as my main source of data the list of executedoffenders of the Texas Department of Justice for this infographic, but am free touse any other reliable source. The newspaper is subscribed to a few premium-access databases that I can use to obtain additional data if necessary.
1.3 Vision: The purpose map
Describe and reason what the possible aim of this work would be in terms of whatexperience (the Exs) it would facilitate and through what tone of voice (Read vs.Feel)
The infographic will consist of many numbers (since there are a lot of differ-ent and important statistics to display) but be mostly visual and intuitive, i.e.the meaning of these figures should be easily understandable by the context inwhich they are displayed. This would put this visualisation in the left end of”exhibitory” on the purpose map, since most of the conclusions from the dataare directly exposed to the reader. But the explanations should remain short,and the total amount of text at a minimum level, so the infographic couldn’t bequalified as ”explanatory”.
These numbers have a strong implication in human lives and security, so read-ers might feel very strongly after reading the infographic. The raw data haspotential for a lot of ”reading” and ”quantitative analysis”, but making too”scientific” a topic as sensitive as executions would likely offense many readers.On the other hand, totally excluding logic and making it a purely emotionaltopic wouldn’t be effective and against the policy of the journal. Thus, theinfographic should be classified at the top of the ”feeling” category, close to theline with ”reading”.
We would then have the following purpose map:
8

1.4 Vision: Your ideas
Sketch out roughly what you think this work could look like: what colours, whatkeywords, rough drawing, any other work out there that you can be inspired/in-fluenced by? (not a test of artistry, just map out ideas)
The two pages could be merged together to form only one visualisation. Forthe sake of readability, however, no word should be split across the two pages. Ifnecessary, a large graph can be split in the two pages, but this should be avoided.
The main kinds of elements that could be contained include:
• A bar chart showing the count of executions across time (either one yearperiods or five year periods).
• Other time series printed parallelly to the previous bar chart, to showpotential correlation between executions and another crime metric. Couldalso show impact of new bills on the number of executions per year.
• A timeline reminding of the key historical date (such as the introductionof new legislations).
• A map of Texas to show where most of the execution/crimes happen.Some points of the map can potentially be emphasized if they can helpexplaining the crime rate (e.g.: frontier with Mexico?).
9

• A vertical bar chart showing what is the most frequent content/wordsfrom the last words of the criminals (e.g.: god, pardon, love,...).
• Featured profiles of executed criminals (preferably authors of atrociouscrimes with little empathy for the victims).
• Small text boxes next to relevant charts to provide additional insights andanecdotes. E.g.: What to think of this map? What to remember fromthis graph?
As for the background, it could be made of something patriotic such as apartially transparent zoomed-in American/Texas flag or symbol.
Overall, the infographic would look like something similar to this:
2 Scenario 2
Analysts at the Texas Department of Criminal Justice staff reporting to seniormanagement at the Texas Department of Criminal Justice.
2.1 Context: The reason
Outline what you think might be the essence of the curiosity: What question(s)do you think the potential audience might need answering/find interesting thatthe visualisation would ultimately present?
We are a team of 4 Junior Analysts (including one summer intern) and wehave been assigned on a two days project to prepare all the visual elements of
10

the biennial public report on death penalty in Texas (part of a legal obligation oftransparency of the Texas Department of Criminal Justice). We are supervisedby two senior analysts who will be responsible to hand the final report to seniormanagement for final review and approval.
The senior analysts have provided us with a detailed list of all the main compo-nents of the report. Last year’s report was 83 pages long (including appendix),with a total of 34 tables and graphs. The responsibility of the graphs has beensplit across the team of junior analysts and I have been assigned to prepare 8of the 34 visuals.
Stakeholders Intrigue. We are to report directly to the senior analysts, whowill, in turn, report to the senior management. The senior analysts will be incharge of writing most of the core of the report. The content of the report willbe highly influenced by the data, which will be taken in part from the tables andgraphics we are to prepare. Thus, the senior analysts (our direct supervisors)hope that these graphical elements will be structured in a way that facilitatestheir redaction and inspires them for this year’s report. They will also wantto make sure that the graphs and tables are similar to those of previous year’sreports to avoid any trouble with the senior management.
The kind of questions they might have include:
• Can I find the figure I want easily?
• Can I compare it to last period’s figure easily?
• Is the format the same as what I am used to?
• Are there any mistakes?
• Do I need to ask for an additional graph?
The senior management will be the ones directly responsible for the publicationof the report, thus will be held accountable for any positive or negative conse-quence that might result from it. They will first have a global look at the reportto check for quality, then read it more attentively to verify that they agree withthe content and, hopefully, gain additional knowledge (or fill their knowledgegaps) on the topic. If the quality doesn’t meet the standards they will have tosend it back to the senior analysts or correct it themselves. They hope to avoidthis step to reduce their workload.
But fundamentally, the report is more a formality for the senior managementthan a real source of insights or potential for career progression, so their biggestintrigue really is ”Does this draft look satisfactory enough to allow me to moveon to more interesting projects?”. Internally, this report is really viewed aswaste of time and an increase of the costs of death penalty.
11

Audience Intrigue. As this report is part of a legal obligation of trans-parency of the Department of Criminal Justice, it doesn’t have a particulartarget audience, which will be by nature very diverse. It will include journal-ists, researchers, NGOs, writers, curious, etc. They might have any kind ofquestion and might want to find the answer in the report. They might evenhave found the report totally randomly through a search engine.
Most of this audience will not need to read the entire report but only to findthe data or piece of information they need. Sometimes, they won’t even needto find it, but just need to be sure the information is contained in the report inorder to use it as a reference in another (formal and lengthy) paper or report.Many of these readers will be used to the format of previous editions, and mightsee from a bad eye any significant change from the usual format.
The questions of the audience might include:
• What was the profile of the executed criminals the last two years?
• What is the opinion of the Department of Criminal Justice on the evolutionof the situation.
• Does this report speak about the overall cost of executions so that I canadd it to my ”references” slide at the end of my development of CriminalJustice in Early Communities” lecture in my ”SOC 101 - Introduction toSociology” class?
However, not all of the audience’s potential questions are relevant to thedesign of the visualisations (and of the report), since the main objective ofthat document is to meet the legal obligations of the department rather thanto satisfy ”customers”. For that reason, the most important question of theaudience that the Department of Criminal Justice will want to answer to is”Can this information be found somewhere in the report?”.
2.2 Context: The circumstances
Work through the list (of 10 main headings) and describe your critical thinkingabout any assumptions, definitions or self-imposed factors you think might berelevant/existent. If any require no definition or are relevant to that scenario,explain why not?
2.2.1 People: Stakeholders
As explained earlier, the main stakeholders for me are my two direct supervisors,the senior analysts. The production of these visualisations is a routine task foreverybody, me included, and it cannot lead to any promotion or bonus. Theend stakeholders are the senior management, but unless we (Junior Analysts)produce such a low quality work that the senior management needs to find aresponsible to fire, we will not have any interaction with them.
12

Fundamentally, the main stakeholder is the United States Constitution andthe rule of law: we need to produce graphs that meet the requirements of ourlegal obligation, not for us, but as part of our duty to serve the best interestsof the country.
2.2.2 People: Audience
As explained earlier, the audience is very diverse.
We estimate that the online version of the document (available on the De-partment of Criminal Justice’s website) represents the majority of the readers.From Google Analytics statistics, we know that 65% of the downloads of pre-vious reports have been made by people (or computers) located in Texas. 54%of the total ”pageviews” on the report come from organic search (mostly fromGoogle), 23% come from access from an internal link of the department’s web-site, 8% come from direct access (generally people who copy pasted the link ofthe report in their web browser) and 15% come from links from other websitespointing to the report. Less than 1% of the downloads comes from social net-works.
The print version of the report (around 400 copies) circulates mostly amonginstitutions and libraries, but can also be ordered by anyone through the de-partment’s website (15$ administrative fee). In most cases, these institutionsare interested to own a physical copy of the report mostly for archiving purposeor for the sake of completeness.
The direct audience is generally very sophisticated, hold a bachelor/master de-gree or PhD and are less sensitive to the form of the report than to its content.
The report also has an indirect audience, that is people who will read extractsof it or content inspired by the report but rephrased to be more accessible, forexample in newspapers, magazines or other medias. Generally, these people willnot even be aware that the content they are reading originally comes from thisreport. The profile of this indirect audience is very different from the profile ofthe direct audience, and will be less educated, less captivated by the topic.
2.2.3 Constraints: Pressures
The graphics must be handed tomorrow by 5 pm. No extension will be granted(or ”should be required”, according to the senior analysts). No budget is allo-cated to this project.
No particular pressure on the project. Everybody expects it to be a routinetask.
13

2.2.4 Constraints: Rules
Layout must be close or identical to that of the previous year. Allowed to makesome minor changes if necessary. The visual appearance can be changed com-pared to the first year, but only if time permits and if all the four junior analystsagree on the modifications (as all the visuals must obey the same design guide-lines).
The original report is in colour but it is not uncommon that people photo-copy parts of it in black and white. In particular, the charts are often used inacademic contexts as teaching material and handed out to students. Therefore,the black and white outcome must always be kept in mind when designing thedifferent parts of the report.
The font used in the appendix section of the report is Times New Roman 11pt.The report is printed on A4 pages with 1” margins. Each page contains adiscreet page number as well as the name of the department of justice at thebottom of the page. The top of the page also includes the name of the currentsection of the document. The formatting of the report will only take place onceall the elements have been completed.
All the tables and numeric values of the appendix have to be written in puretext (no images) when possible so as to make them searchable (by the user orthe search engine).
2.2.5 Consumption: Frequency
A new report is published every two year. Most of the visuals and tables canbe replicated from the previous report with only a limited amount of changesnecessary. Every time, however, the structure is slightly altered and some ta-bles/visuals are dropped or added.
2.2.6 Consumption: Setting
The report is most popular the weeks following its publication. However, it issupposed to remain ”valid” for two years, so figures and conclusions that onlyhave very short term importance should preferably be avoided.
As explained earlier, it is distributed through different channels. The main oneis the digital version freely available on the website of the department of justice(and indexable by search engines). The print edition has only been around 400copies the previous year, but this number is now quite flexible as the departmenthas decided to move to the Print-On-Demand (POD) technology for this yearto spare costs and gain in flexibility, through Amazon Createspace.
14
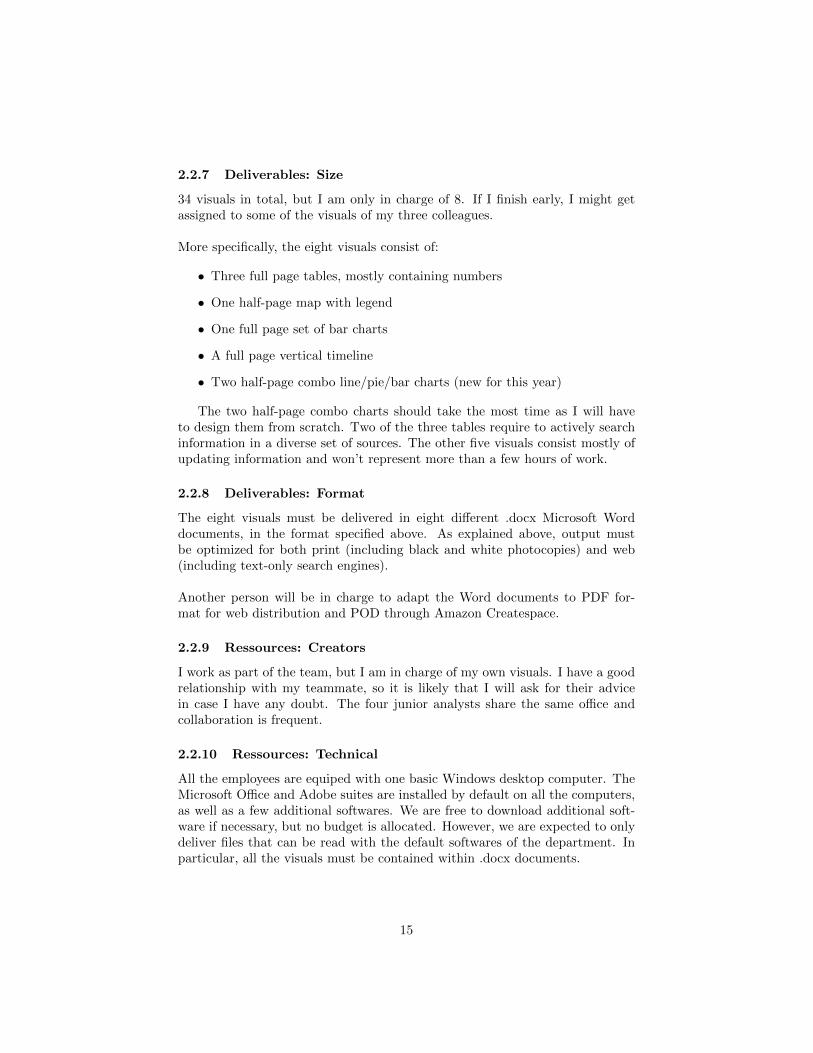
2.2.7 Deliverables: Size
34 visuals in total, but I am only in charge of 8. If I finish early, I might getassigned to some of the visuals of my three colleagues.
More specifically, the eight visuals consist of:
• Three full page tables, mostly containing numbers
• One half-page map with legend
• One full page set of bar charts
• A full page vertical timeline
• Two half-page combo line/pie/bar charts (new for this year)
The two half-page combo charts should take the most time as I will haveto design them from scratch. Two of the three tables require to actively searchinformation in a diverse set of sources. The other five visuals consist mostly ofupdating information and won’t represent more than a few hours of work.
2.2.8 Deliverables: Format
The eight visuals must be delivered in eight different .docx Microsoft Worddocuments, in the format specified above. As explained above, output mustbe optimized for both print (including black and white photocopies) and web(including text-only search engines).
Another person will be in charge to adapt the Word documents to PDF for-mat for web distribution and POD through Amazon Createspace.
2.2.9 Ressources: Creators
I work as part of the team, but I am in charge of my own visuals. I have a goodrelationship with my teammate, so it is likely that I will ask for their advicein case I have any doubt. The four junior analysts share the same office andcollaboration is frequent.
2.2.10 Ressources: Technical
All the employees are equiped with one basic Windows desktop computer. TheMicrosoft Office and Adobe suites are installed by default on all the computers,as well as a few additional softwares. We are free to download additional soft-ware if necessary, but no budget is allocated. However, we are expected to onlydeliver files that can be read with the default softwares of the department. Inparticular, all the visuals must be contained within .docx documents.
15

2.3 Vision: The purpose map
Describe and reason what the possible aim of this work would be in terms of whatexperience (the Exs) it would facilitate and through what tone of voice (Read vs.Feel)
The visuals and tables clearly aim to be as objective and informative as pos-sible. The focus is on the quantity and the accuracy rather than the ease ofunderstanding. Clearly, these visualisations should occupy the top left cornerof the purpose map:
2.4 Vision: Your ideas
Sketch out roughly what you think this work could look like: what colours, whatkeywords, rough drawing, any other work out there that you can be inspired/in-fluenced by? (not a test of artistry, just map out ideas)For most of the visuals, no creativity is required since it will only be aboutupdating the data with more recent information. Most of the data required forthe eight visuals can be found directly from the list of executed offenders on thedepartment’s website.
Roughly, the eight figures would look a bit like that:
16

17

The inspiration for the new combo charts comes directly from the otheralready existing similar combo slides in the rest of the appendix. Most of thetext boxes are simply explaining the content of the tables and graphs. Thevertical timeline will be identical to that of the last report, except that twonew points must be added with a small text paragraph (the margin has to bereduced to accommodate the new data points).
3 Scenario 3
A campaign group looking to help influence a debate about the ending of capitalpunishment.
3.1 Context: The reason
Outline what you think might be the essence of the curiosity: What question(s)do you think the potential audience might need answering/find interesting thatthe visualisation would ultimately present?
I am part of a small campus association fighting against death penalty, madeof a few friends with strong convictions. A major conference on the topic ofdeath penalty will be hosted at our university in a few weeks. The organisingcommittee is made of a few university officials with strong ties to the republicanparty and most of the speakers expected to be present in the conference are wellknown for their systematic conservative political bias.
18

Due to the importance of the debate, which is expected to attract up to afew thousand students and will be diffused on live television, we decided to takeaction and protest against the structure in place. The first step of our plan ofaction is to raise awareness through a strong campaign both in campus and onsocial networks.
We will start our online campaign by publishing a few viral infographics inthe university facebook pages.
Stakeholders Intrigue. The group is strongly committed to rely on facts forall its points. But we known that our ”opponents” will mostly rely on emotionsand ”shock” arguments, so we decided to adapt our approach to the field inwhich we fight.
The stakeholders are made of the 14 group members (including myself). Weare already extremely aware of all the facts, evidence and data surrounding thesubject so we don’t expect to learn anything new from this infographic. How-ever, we have always found that it was very difficult to convey all the points ofour position to an uninformed individual, so we hope that this visualisation willhelp us come with better ways to convince others of our points. So the kind ofquestions that we hope this visualisation would help us answer includes:
• In which order should we bring our arguments?
• What data do we need to show to effectively convince others?
• What is the most intuitive way to visualise our strong feelings?
• How does it look from outside?
• How many points do we actually have? How much space does it take onpaper?
• Are rationality and fact-based approaches compatible with ”coolness” forthis topic? Can we make it interesting while still being objective?
Audience Intrigue. The audience will be very diverse in nature and rela-tively uninformed about the topic. As the date of the conference will approach,the topic will become more ”trendy” and students will gain interest, possiblylooking to forge their own opinion before the debate. Thus, we expect the peo-ple to be more attentive to our claims than usual.
As our university tends to be more conservative in general, we tend to receiveless support and more aggressivity from our peers. But most of the studentsare not politically involved and remain quite open to ideas from any politicalorigin. They are looking for any information that could help them take a stancein the debate. Their questions might include:
19

• What are the arguments of both parties?
• What are the main ”things to know” about the topic?
• Are there any fun figures that I can quote in a discussion with my friends?What can make me sound more clever?
• Why should I care?
• What is the position of the rest of the student and of the country on thematter? Where do I stand compared to them?
For the students who already have a strong opinion on the matter, theirintrigue would probably be closer to:
• Is this infographic trying to speak about something I don’t want to hear?Does it come from people with a political opinion different from mine thatI should just ignore?
• What can I find that confirms that the other party has weaker claims thanmine? How strong is my position? What are the main arguments of theopposition / our best arguments?
But the targeted audience is mostly the first group, the relatively uninformedpeople, as our influence group largely considers the informed students as ”gainedcuases” or ”lost causes” with a too high cost of conversion.
3.2 Context: The circumstances
Work through the list (of 10 main headings) and describe your critical thinkingabout any assumptions, definitions or self-imposed factors you think might berelevant/existent. If any require no definition or are relevant to that scenario,explain why not?
3.2.1 People: Stakeholders
As explained earlier, the stakeholders are the 14 students who are part of thegroup. The group is mostly informal: it is officially registered as a campusorganisation, but most of the decisions are taken individually according to per-sonal variations of opinion and motivation. On some occasions, however, we tryto coordinate our efforts to reach an objective. This campaign is one of theseoccasions, so we decided to only publish things on social networks after havinginformed and received tacit approval from the other 13 members. There is noformal decision process: we have a WhatsApp group in which we send our sug-gestions. If after a few hours no one rejected our idea, it is generally assumedthat it is fine to proceed.
The 14 students are all undergraduate students in the university, coming fromdifferent majors, with a focus on social sciences.
20
3.2.2 People: Audience
The university counts 21 235 students, 81% of which are full-time undergradu-ate. As explained earlier, the main target consists of the non-politically affiliatedstudents, but we aim to maximize the total exposure of our campaign so we alsohope to reach a few individuals from other categories, including staff, lecturers,university officials and possibly the general population. At the same occasion,we hope to attract a few students to join our organisation.
3.2.3 Constraints: Pressures
Our funds are very limited so members mostly use their own resources. Thetime pressure is quite strong since the conference will take place in a few weeksonly and our classes keep us busy most of the time. However, no specific dead-line is set for my own work and it is quite flexible.
In the past months, a few students member of various campus groups havereceived administrative sanctions (going up to expulsion for the most extremecases) following a protest on diverse issues. The purpose of these sanctions wasto send a clear message to student organisations: disobedience to college ruleswill not be tolerated. This has created a lot of tensions and puts a lot of pressureon many associations, since most students want to stay out of trouble and preferremaining unnoticed from the administration. In particular, we could face legalaction for libel if the elements we publish directly incriminate university officials.
Another source of pressure is the ranking algorithm of social networks, Facebookin particular. Since the infographic must become viral on Facebook to reachthe diffusion objectives, certain rules must be observed, such as publishing theinfographic on the right time of the day, having the right keywords in the textdescription, having the right dimensions for the picture profile update, adoptingthe right tone generally expected by Facebook users, etc.
3.2.4 Constraints: Rules
Most of the rules are dictated by the practical necessities of publishing on Face-book. The infographic must be in a format that allows for comfortable readingon Facebook. The readers should not have to leave Facebook to see the vi-sualisation on an external website, so this has to be taken into account. Wemust also remember that Facebook highly compresses images, so no zoomingshould be required. Possibly, one Facebook post can contain multiple images:this can be used as a solution to the problem of low allowed resolution for indi-vidual images. Interactive images such as GIF are not allowed, as well as mostnon-standard image formats; the Facebook documentation should be consultedto check for technical feasibility before starting to develop any innovative non-standard visualisation.
The logo and the name of the campaign group must be clearly shown on all
21
the publications. It is important that the message be conveyed together withthe name.
3.2.5 Consumption: Frequency
This is a targeted one-off campaign, but the most popular infographics mightbe republished later or in other social networks, or re-used.
3.2.6 Consumption: Setting
Rapid (hopefully viral) consumption on social networks, mostly Facebook. Thetiming of the publication is very important and is thought in advance to corre-spond to the peaks of social activity of the students.
The infographics are generally published through the Facebook page of thecampaign group, shared by each of the group members and by a set of sup-porters and partner student associations. It is also published directly on allthe public and private Facebook groups of the university to which the studentmembers have access. The publication is often associated with a few prizes towin, attributed to people randomly drawn from the list of people who ”liked”the post, to incite students to like each of the publication and increase virality.
3.2.7 Deliverables: Size
I have to prepare one set of images that will be published together in a Facebookpost. These images are generally accompanied with a small text description tospark interest and with a link to the (newly created) website of the group.
The total number of images is entirely flexible but should remain reasonableto avoid the risk of boring the reader. The first few images should be verysimple, very visual and easy to understand to grab the attention of the read-ers. The following images will only be seen by users who have already startedreading the post and can, thus, be more sophisticated. Therefore, the first fewimages will require more ”artistic” and ”creative” work, whereas the last onesare likely to require more research and descriptive work.
3.2.8 Deliverables: Format
All the images should be designed with Facebook publication as the main ob-jective. In a second step, those images can be adapted for publishing in othersocial networks or contexts, such as the group website or print diffusion. Fromtime to time, the group is invited to take part in small talks and re-uses someof the infographics published on Facebook to illustrate some of their slides.
22

3.2.9 Ressources: Creators
The association is very collaborative and people are always glad to help eachother. Skills are very diverse so when I don’t know how to do something, Igenerally ask for help and receive some very fast.
I am used to work together with two very close friends of mine who are alsopart of the group and have complementary skills. They are less active than mein the association and are not currently working on any project, but I know Ican rely on them to help me with the technical part of the creation. The firstis an art student, very good at hand drawings of any sort, and the second is aCS major very agile with design softwares. I generally make a plan of all thedetails of and create myself the easiest elements, and I rely on them for all themore complex graphical components of the visualisation.
3.2.10 Ressources: Technical
As students, we have free access to most of the popular design or technical soft-wares. This includes the whole Microsoft Office and Adobe suites.
Each member of the group has its own habit for the design of these visuali-sations, so there is no standard among us.
3.3 Vision: The purpose map
Describe and reason what the possible aim of this work would be in terms of whatexperience (the Exs) it would facilitate and through what tone of voice (Read vs.Feel)The campaign’s tactic is made of three phases:
1. Spark the interest of the reader with shocking facts and numbers
2. Convince him that our side is the good one with objective facts and reliabledata
3. Make him emotionally involved so that he doesn’t immediately forgetsabout what he read after closing the computer and takes action to bringabout changes
So there is a mix of feeling and reading, with a slight tendency towards feeling.
No interaction with the graphs are possible, but it is required from the userto click on the ”Next” button to see the next image of the post, and social in-teraction is encouraged through the comments. Still, this is not enough for thevisualisation to qualify as ”exploratory”. It couldn’t be qualified as explanatoryeither as the amount of reading and detailed information is moderate. Overall,the visualisation tries to be ”exhibitory” and to simply ”show things as theyare”, by letting the reader draw the most obvious conclusions by himself.
23

Thus, on the purpose map, the visualisation would be around here:
3.4 Vision: Your ideas
Sketch out roughly what you think this work could look like: what colours, whatkeywords, rough drawing, any other work out there that you can be inspired/in-fluenced by? (not a test of artistry, just map out ideas)
My original idea was to make a ”Top 10”, which are generally known toattract a lot of ”views” on social medias. It could be called for example ”TOP10 reasons why Death Penalty is bad”. It would be made of 10 images, startingwith the tenth, going up to the first. Normally, the reader would expect thereasons to become increasingly important and this incites him to continue read-ing. Since the argument are quite subjective anyway, this doesn’t necessarilyhas to be true, but finishing with a memorable point is always a good thing.As explained earlier, the last points can be more developed than the first andcould potentially encourage the reader to learn more about the topic by readingother recommended sources.
The images and elements of the top 10 could look a bit like that on Facebook:
24

25

As shown above, the first image shown could use the picture and some per-sonal details about a specific criminal to make readers feel the scale of the costsand bring it back to an individual level. Making the criminal look more like aperson also increases the emotions, since people then no longer see ”criminal-ity” as a society-wide issue but ”criminals” as bad persons who don’t deserve somuch attention. Here, I think the main strength of this database of convictedoffenders is that it gives us a lot of very personal information we can use todisplay on selected felons (at the risk of appearing unethical by doing so).
The other seven images could make use of the other attributes of the database,most specifically the last statements. For example, a word cloud could probablyillustrate one of the images (depending on which words come as the most visi-ble). The frequency of a specific topic in the last statements can also be broughtas an argument and be shown visually as part of a bar chart. But overall, theexecuted offenders database would probably only represent a small part of allthe data used for the visualisation.
4 Scenario 4
What potentially intrigues you about this data? What might you undertake ifyou had the chance?
4.1 Context: The reason
Outline what you think might be the essence of the curiosity: What question(s)do you think the potential audience might need answering/find interesting thatthe visualisation would ultimately present?
Personal Intrigue. I am a student in Imperial College London, studying inthe new Msc in Business Analytics programme. During our Visualisation course,we explore some innovative ways to visually represent and understand data. Inone of the classes, we briefly look at the ”Executed offenders” list of the TexasDepartment of Justice’s website.
At home, after the class, curious, I go back on the website and realise that thedata has a lot of potential and decide to explore it a bit further. In particular,I am interested by the individuals’ last statement: What are the main topics/-subjects that an individual wants to speak about/mention when he knows heis about to die? Is it religion, love, family, friendship, politics, justice, regrets,justification, etc.? Have these topics changed over time? Do they differ basedon gender, based on age, based on the type of crime committed?
I think that the data would be easier to understand and fit well within a fully
26

interactive visualisation where parameters can be changed in one click. I re-alise this would be a good opportunity to brush up my JavaScript/JQuery skillsand potentially try a few visualisation js/html5 libraries, so I decide to make itweb-based.
Audience Intrigue. Of course, this is a personal project and the primaryquestions I try to answer are mine. But since I will do the work anyway, whynot share the results?
I decide to, in a first step, publish my work on an ad hoc page in my per-sonal website. Depending on my findings, I might dedicate a website to theproject.
The audience might have the same questions as me, and perhaps even havesome additional ideas. A comment section on the website could potentially leadto some very interesting suggestions of extensions to this project.
4.2 Context: The circumstances
Work through the list (of 10 main headings) and describe your critical thinkingabout any assumptions, definitions or self-imposed factors you think might berelevant/existent. If any require no definition or are relevant to that scenario,explain why not?
4.2.1 People: Stakeholders
Me, that’s all. I only do that as a side project, for my personal interest.
4.2.2 People: Audience
In the beginning, no one except me. Later, once published on my website, justthe people I give the link to or potentially a few visitors coming from searchengines. If I like my findings and dedicate an entire website to the project, thenpossibly the audience could become much larger. But that’s not the priorityright now.
4.2.3 Constraints: Pressures
I have a few weeks until the end of semester projects start. As this is still thebeginning of the semester, I have a lot more free time. Hopefully, I can finishedthe core of the project by the end of the semester and start thinking and work-ing on the ”publishing details” during the vacations.
I want to get inspiration from existing interactive visualisations. I need tocount a few days to explore the web and see what has been done in the past(not necessarily relating to death penalty). In particular, I want to know whatare the main visualisations libraries, what they can do and what they can’t.
27
4.2.4 Constraints: Rules
I want my visualisation to be compatible with the main web browsers (exceptprevious versions of Internet Explorer) and smartphones (Android and Iphone).It has to run on almost any screen size/resolution and shouldn’t require anyexternal plugin. Ideally, the loading time should be short (so not too many filesto download) to allow for low speed smartphones to access the page withoutwifi connection.
4.2.5 Consumption: Frequency
Normally a one-off project, but I could update the data as it becomes available(i.e. as more criminals receive capital punishment, or using data from otherstates) or improve it based on the feedback I receive. In any case, if I publishthe results, they should remain public on the website forever; I generally try tokeep all my websites and publications online, even when they become obsolete,for archive purposes.
4.2.6 Consumption: Setting
My own consumption: Live, as I work on the project.Consumption from the audience: If published, prolonged, with most likely apeak when I first release the results on social media. Potential peaks are alsopossible from search engines when a major capital-punishment-related eventhappens, if my project’s page has a good SEO (Search Engine Optimisation).In general, I don’t expect a very high level of traffic on the page.
4.2.7 Deliverables: Size
One static web-page only. However, I see two main sources of work:
• Working on the data. Categorising the different last statements ap-propriately. What should be the relevant ”categories” of last statements?What level of detail should we have (should we just look for ”religion” ingeneral, or distinguish between different types of religions?)? How to de-fine whether one last statement includes a link to ”religion” or not? Whatshould we consider as ”religion”? How to understand last statements thatare not clearly phrased?
• Working on the visualisation per say. How to communicate the datain an explicit way? How to visually express the strength of correlations?How to make it look like an objective approach? How to make it intuitive,how to invite the visitors to try changing the different parameters of theinteractive visualisation?
The first part of the work will be a bit more ”mechanic” but must be donecarefully or the study won’t be valid. Most likely, every of the hundreds ofstatements will have to be MANUALLY categorised. A clustering algorithm
28

would probably give poor results given the complexity of the data and rathersmall size of the population, and a bit overkilling.Hopefully, I could finish this first step by the end of the semester.
Once this first part is done, it will already be possible to computer a few statis-tics and see whether there are some interesting trends. If it shows that thereis value in the data and it is worth exploring more, then I could move to thesecond step. The time requirement for this second part are likely to be morevariable, less predictable, as it is the ”creative” part and could be polished formonth if wanted.
4.2.8 Deliverables: Format
One web page, made of multiple files (html, js, png, jpg, etc.). As explainedbefore, the output should be static and therefore not require any interactionwith the server once the page is loaded. This means that the user can explorethe whole dataset offline and look at the source code freely. The data won’t bestored in a database but directly within the page.
4.2.9 Ressources: Creators
Individual project. Some other contributors could join in later steps, but notexpected for now.
4.2.10 Ressources: Technical
I have access to most softwares and can generally easily download additionalsoftwares I could need. I have my own dedicated server to host the website andthe project, that I already use for my other websites. I am already familiar withJavascript and HTML web development, so I can use advanced features easilyif necessary.
The data classification will most likely be done in Excel to simplify things.
4.3 Vision: The purpose map
Describe and reason what the possible aim of this work would be in terms of whatexperience (the Exs) it would facilitate and through what tone of voice (Read vs.Feel)
This visualisation will clearly be exploratory, as the user can play with theparameters. However, I wouldn’t put it too far on the right in the purpose mapas it doesn’t have any complex interaction possibilities: you can only changethe values of a few field (and post a comment at the bottom of the page), youcan’t really contribute to the dataset itself or radically influence what you seeon the screen.
29

The visualisation is closer to ”feeling” than to ”reading”: even though thenumbers will be shown, the main purpose is to give an approximate idea of thedistributions rather than exact values. The last statements being classified onpartially subjective criteria anyway, trying to look too ”serious” and ”scientific”would reduce the credibility and interest of this visualisation.
The resulting purpose map looks like this:
4.4 Vision: Your ideas
Sketch out roughly what you think this work could look like: what colours, whatkeywords, rough drawing, any other work out there that you can be inspired/in-fluenced by? (not a test of artistry, just map out ideas)
The core idea behind this visualisation is two easy steps: 1) You pick a pro-file. 2) We show you what the last words of a criminal with this profile typicallyare about.
When I want to give a general idea of the skills/traits of an individual, I liketo use the radial ”star chart”:
30

I believe it would fit perfectly for our needs here too, since it gives more anidea regarding the last statements than a specific value.
I would also like to give the user the possibility to explore the data at theindividual level. So I would probably add a rectangle with all the pictures ofthe convicted offenders, and the user could pass the mouse over the pictures tosee the details about that individual, including how its last statement has beencategorised.
Possibly, we could add a word cloud at the bottom of the visualisation to givea broad overview of the words used in the statements.
Overall, our visualisation would look similar to this:
31

32

33

Assignment 1b: Developing intimacy with dataand establishing editorial perspectives
Introduction
You are working at a broadsheet newspaper as a graphics editor and preparingideas for your assignments editor about possible visual work you could undertakeahead of the Rio Olympics.
Compile a report that details your deep examination, proposed transformations,explorations and editorial ideas based on the data provided (and data you couldreasonably obtain).
You are provided with two contrasting worksheets (in Excel) showing medal-lists from the Summer Olympic Games
34

5 Examination
Articulate the meaning of the data (representativeness and phenomenon) andthoroughly assess and describe the physical properties (type, size, condition).Compare what the two dataset offer and contrast their differences.
5.1 Dataset 1
Number of observations (rows): 4093Each observation represents: a won olympic medal (can be won by multipleathletes together)Observations that aren’t included? Only rows for medals of 4 sports (Ath-letics, Canoeing, Rowing and Swimming). Only includes years 1896 to 2012.Columns per row: 10Columns details and structure:
• Games: Integer, contains the year (4 digits) of the games. Range: 1896-2012. Most frequent value: 2012, appears 267 times. Least frequent value:1896, appears 20 times.
• Sport: String, 4 unique values (Athletics, Canoeing, Rowing and Swim-ming). For each year (variable ”Games”), each of the sports should nor-mally appear, but in the older years (e.g. 1896), some of the sports weren’tintroduced yet. Most frequent value: Athletics, appears 1550 times. Leastfrequent value: Canoeing, appears 491 times.
• Event: String, 93 unique values, contains the ”discipline” as well as theparameters of the discipline (such as distance) and the information aboutthe ”gender” of the competition. For each year, each of the 93 eventsshould normally appear, but in the older years (e.g. 1896), some of theevents weren’t introduced yet. Each event is always grouped with thesame sport. Most frequent value: 100m Men, appears 85 times. Leastfrequent value: 3000m Steeplechase Women, appears 3 times.
• Athlete(s): String, 3211 unique values. Format: first name followed bylast name, with the last name written in upper case characters. Note thatnames with special characters are incorrectly stored (have question marksinstead of the true character). For competitions by teams, athletes areseparated by commas. Most frequent value: Michael PHELPS, appears13 times.
• CountryCode: String, 3 upper case characters, contains the countrycode of the country that the athlete represents. 102 unique values. Mostfrequent value: USA, appears 982 times. Note: Countries can appear/dis-appear/merge over time depending on political context; example: GDR(German Democratic Republic) and FRG (West Germany) became GER(Germany).
35

• CountryName: String, full country name. 96 unique values. Mostlyredundant with ”CountryCode” with a few exceptions; for example: Ger-many can have country code DEU or GER depending on the year.
• Medal: String, contains the type of medal won. 3 unique values (Gold,Silver, Bronze). Most frequent value: Gold, appears 1368 times. Leastfrequent value: Bronze, appears 1358 times.
• Result: String, contains the performance of the athlete/country. Theformatting is different for each displicine, as the result can be a distance,a time or another metric. This column has to be read together with thenext one (Unit). Note: a few rows have the value ”No result”.
• Unit: String, contains the key of how to interpret the ”Result” variable.4 unique values (M:S:DD, H:MM:SS, M:SS:DD, #:DD)
• ResultInSeconds: Integer, redundant with the column ”Result” buthere the information is stored in seconds.
Note: One row has incorrectly formatted values due to disqualification.
5.2 Dataset 2
Number of observations (rows): 26398Each observation represents: an athlete that won an olympic medal (if samemedal won my multiple persons, 1 row per person)Observations that aren’t included? Only includes years 1920 to 2008.Columns per row: 10Columns details and structure:
• City: String, contains the city where the olympic games of this year werehosted. 20 unique values. Most frequent value: Los Angeles, appears 2074times. Least frequent value: Amsterdam, appears 710 times.
• Edition: Integer, contains the year (4 digits) of the games. 21 uniquevalues. Range: 1920-2008. For each year, the city is always the same.Most frequent value: 2008, appears 2042 times. Least frequent value:1932, appears 615 times.
• Sport: String, 33 unique values. For each year (variable ”Edition”), eachof the sports should normally appear, but in the older years, some of thesports weren’t introduced yet.
• Discipline: String, 47 unique values. For each year (variable ”Edition”),each of the disciplines should normally appear, but in the older years,some of the disciplines weren’t introduced yet. For each discipline, thesport is always the same.
36

• Athlete(s): String, 19356 unique values. Format: last name in capitalcharacters, followed by a comma and by the first names of the athlete.
• NOC: 3 characters string, contains the country code of the country towhich belong the athlete. 134 unique values.
• Gender: String, 2 unique values (Men and Women), indicates whetherthe athlete is male or female. Number of rows with ”Men”: 18967. Num-ber of rows with ”Women”: 7427. Percentage of rows with women: 39.16%(note that this doesn’t indicate that 39.16% of the participants are women,but that 39.16% of the medal holders are women. Women participation isactually much lower).
• Event: String, 442 unique values, generally contains the ”discipline” aswell as the parameters of the discipline (such as distance) but doesn’tcontain the gender requirements of the event. Sometimes discipline isomitted and only parameters are shown.
• Event gender: 1 character string, 3 unique values (M, W and X), indi-cates whether the competition requires participants to be men, women, ormixed (X).
• Medal: String, contains the type of medal won. 3 unique values (Gold,Silver, Bronze).
5.3 Difference between the two datasets
The biggest differences are:
• Size: The second dataset contains much more rows because it covers muchmore categories of sports (33 instead of 4). However, the first datasetcovers more years since it goes up to 2012 (compared to 2008) and downto 1896 (compared to 1920).
• Meaning of a row: In the first dataset, one row is one medal, whereasin the second one row is one athlete. In most cases, this doesn’t make anydifferent, but it will create more rows for group sports such as relay.
• Columns: Both datasets have different columns. The first dataset hasinformation about the results (time), which the second doesn’t have. Thesecond has information about the city and the discipline, which the firstdoesn’t have. In addition, the second has the ”gender” information storedseparately from the event with a column for the gender of the athlete (notfound at all in dataset 1) and a column for the gender requirements of thecompetition (found in dataset under the column ”event”).
37

6 Transform the data
What could you do/would you need to do to clean or enhance the data? Whatother data could you reasonably source in order to consolidate the data? Youmay optionally do this but you are only expected to write about what you woulddo and why.
6.1 Dataset 1 cleaning
I recommend the following operations:
• Uniformise column ”CountryName” so that it is constant over time. Weare not trying to analyse political history but sport performance so it ispreferable to simplify the data and focus on the geographical aspects. Forexample, replace all the variations of Germany such as ”German Demo-cratic Republic” by ”Germany”.
• Drop column ”CountryCode”, which is now fully redundant with ”Coun-tryName” thanks to the uniformisation.
• Drop columns ”Result” and ”Unit” that are redundant with ”ResultsIn-Seconds”. The interpretation and calculations are made much easier ifeverything is already in numeric format.
• Drop the disqualified athlete row.
• Investigate the ”No result” rows, and possibly drop them as well.
• Manually repair the athlete names when they have question marks, usinginformation found on internet.
• Create a new category for whether an event is ”men” or ”women” only.Then update the ”event” column to remove all the ”Men” and ”Women”text since it is now stored in a different column.
• Create a column for ”group performance” that is worth either 0 or 1 de-pending on whether multiple athletes won the medal together (for examplewith relay disciplines). This can help to identify more easily the rows thatcontain multiple athletes.
6.2 Dataset 2
I recommend the following operations:
• Create two new columns: one for the first name of the athlete, one for thelast name, and then drop the old column.
• Uniformise column ”NOC” so that it is constant over time. We are nottrying to analyse political history but sport performance so it is preferableto simplify the data and focus on the geographical aspects. For example,replace all the variations of Germany such as ”GDR” by ”GER”.
38

• Create a new binary column to indicate that an athlete won as part of ateam.
• Create an integer column that contains the number of members in theteam of the athlete if the athlete was part of a team, and 1 otherwise.Necessary to avoid giving the impression that some countries have wonmore medals when they were just better at team sports.
Overall, the data is quite clean and much better structured than the firstdataset.
6.3 Data enhancement
The biggest enhancement that I recommend is to merge the two datasets to-gether to take only the advantages of each dataset.
Concretely, here is how I would proceed:
• Start from dataset 2
• Add a column ”ResultInSeconds”
• Add the values ”ResultsInSeconds” to each row of dataset 2 using thecorresponding element from dataset 1
• Add all the rows from dataset 1 for year 2012 and years 1896-1916 todataset 2, since dataset doesn’t have any information on these years
Our new dataset is now a perfect combination of the two datasets in terms ofinformation potential. However, this has also produced a lot of missing values,notably in the column ”ResultsInSeconds” and for all the rows that we addedfrom dataset 1 (as well as no information on many disciplines for the year 2012).These missing values might create some technical problems when generating thedifferent visualisations, and it might not be worth the effort. Depending on whatwe want to visualise, we might decide to either use this new merged dataset, oronly dataset 1, or only dataset 2.
Ideally, I would look for a dataset similar to dataset 2 but that also includesthe missing year and the result in seconds from internet. If we find some morecomplete datasets that also include personal information on the athletes (suchas weight, education, ethnicity, etc.) it could be very interesting for visualisa-tions. I would also look to complete this data with information related to thegames themselves, such as the costs, the number of visitors, etc.
7 Exploration
Use Excel/Tableau to visually explore the two datasets in order to deepen yourappreciation of their physical properties and to help you brainstorm potentiallyinteresting angles of analysis.
39

I tried to experiment different visual formats (histograms, bar charts, lines,pie charts, maps, etc.) and exploring how each value is better represented(color? Label? size?). I tried to identify which subgroups have the most dataand thus would be interesting to be the object of a visualisation (e.g. the USA,since it has won a lot of medals), which variables have the most variation or theleast (e.g. the proportion of gold medals overall is the same each year, but itvaries a lot if we only take the proportion of gold medals for a specific country)and which variables take too many possible values to be represented entirely(for example there are too many disciplines to represent them all in a single piechart).
A few of the graphs I have generated through my exploration are shown be-low.
7.1 Dataset 1
Top 25 countries with the most medals:
Bubble map by number of medals:
40

Map representation by number of medals:
41

Average length of a competition, in seconds, by sport:
42

Total number of medals over the years:
43

7.2 Dataset 2
Proportion of male/female medals:
Proportion of male/female medals over time:
44

USA medals by sport over time:
45

USA medals by type (bronze, silver, gold) over time:
46

Sports by number of disciplines and categories of events:
47

8 Editorial
Rationalise a list of at least 5 distinct, interesting editorial perspectives: artic-ulate the angle and the framing/focus applied.
Following the insights gained through the exploration of the data, I cameup with a few angles that I thought would be interesting to develop and wouldperfectly fit in a journal for example.
For the following perspectives, unless otherwise specified, I consider the mergeddataset (combination of dataset 1 and dataset 2) proposed above.
8.1 Perspective 1
Angle. What are the countries that have historically had the most importancein Olympic games?
48
Framing. Take all the years from 1896 to 2012, all the sports, all the disci-plines and all the events. Count teams once only, not once per individual.
Focus. Focus on the top 20 countries, and show the composition of the medals(i.e proportion of gold, silver, bronze) through a stacked bar chart.
8.2 Perspective 2
Angle. Has the required performance to obtain a medal in athletics changedover the years?
Framing. Use dataset 1, for years 1896 to 2012. Only consider rows that havea result in seconds stored. Exclude team competitions.
Focus. Group by categories (distance and gender) and show one time seriesline for each category. Years on the x axis and result on the y axis. Draw menand women lines in two different colors. Draw multiple graphs with different yscales or use an exponential y scale to avoid loosing accuracy on some categories(e.g. sprint vs marathon, where competition are sometimes a hundred timeslonger).
8.3 Perspective 3
Angle. How big the gap is between women’ scores and men’ scores in the100m? Has it decreased over the years?
Framing. Use dataset 1, for years 1928 (introduction of the women 100mevent) to 2012. Take only gold medals.
Focus. Focus on the difference in seconds and plot it as a bar chart (whichcould take negative values if a woman gets a better result on a year), with yearson the x axis and score difference on the y axis.
8.4 Perspective 4
Angle. Are new categories still regularly added to the games?
Framing. Use dataset 2, for years 1980 to 2008 (recent years only). Countevery new event as a new category, including the introduction of a new gender-specific category. If a category is dropped from the games, also reduce the countby 1.
49

Focus. Focus on the difference and plot it as a bar chart (which could takenegative values if a year has less categories than the previous one), with years onthe x axis and difference of categories on the y axis. Show the total number ofcategories on top of each bar, as well as the total number of sports in parentheses.If the new categories are part of a new sport, print this proportion of the bar ina different color (i.e. like a stacked bar chart).
8.5 Perspective 5
Angle. How difficult is it to obtain multiple medals for an individual?
Framing. Consider all individuals who won a medal, individually or by team,from 1896 to 2012, for any discipline in any category. Exclude individuals whoonly won one medal.
Focus. Only show the count for each number of medals. Use a bar chart withthe total number of medal won on the y axis (excluding 1) and the numberof athletes in that position (frequency) as the length of the bar on the x axis.Presumably, there are going to be very few people with multiple medals, andonly one or two at the top. Focus on the few outliers who have won more medalsthan any else in history and show a few personal details on these people in an”infobox” under the bar chart so that the readers can understand better how itis possible to have so many victories.
50