visualization basics cs5764: information visualization chris north
Post on 20-Dec-2015
227 views
TRANSCRIPT

Visualization Basics
cs5764: Information Visualization
Chris North

Review
• What is the purpose of visualization?
• How do we accomplish that?

Basic Visualization Model

Goal
Data
Data transfer
Insight(learning, knowledge extraction)

Method
Data
Visualization
Map: data → visual
~Map-1: visual → data insight
Data transfer
Insight
Visual transfer
(communication bandwidth)

Visual Mappings
Data
Visualization
Map: data → visual
Visual Mappings must be:• Computable (math)
visual = f(data)
• Comprehensible (invertible)data = f-1(visual)
• Creative!

PolarEyes

Visualization Pipeline
Raw data(information)
Visualization(views)
Data tables
Visualstructures
Datatransformations
Visualmappings
Viewtransformations
task
User interaction

Data Table: Canonical data model
• Visualization requires structure, data model
• (All?) information can be modeled as data tables

Data TableAttributes (aka: dimensions, variables, fields, columns, …)
Items
(aka: tuples, cases, records, data points, rows, …)
ValuesData Types:•Quantitative•Ordinal•Categorical•Nominal

Attributes
• Dependent variables (measured)
• Independent variables (controlled)
ID Year Length Title
0 1986 128 Terminator
1 1993 120 T2
2 2003 142 T3
… … … …

Data Transformations
• Data table operations:• Selection
• Projection
• Aggregation– r = f(rows)
– c = f(cols)
• Join
• Transpose
• Sort
• …

Visual Structure
• Spatial substrate
• Visual marks
• Visual properties

Visual Mapping: Step 1
1. Map: data items visual marks
Visual marks:• Points
• Lines
• Areas
• Volumes
• Glyphs

Visual Mapping: Step 2
1. Map: data items visual marks
2. Map: data attributes visual properties of marks
Visual properties of marks:• Position, x, y, z
• Size, length, area, volume
• Orientation, angle, slope
• Color, gray scale, texture
• Shape
• Animation, time, blink, motion

Example: Spotfire
• Film database
• Year x
• Length y
• Popularity size
• Subject color
• Award? shape

Visual Mapping Definition Language
• Films dots• Year x
• Length y
• Popularity size
• Subject color
• Award? shape

E.g. Linear Encoding
• year x
x – xmin year – yearmin
xmax – xmin yearmax – yearmin
yearmin
xmin
yearmax
xmax
yearx
=

The Simple Stuff
• Univariate
• Bivariate
• Trivariate

Univariate
• Dot plot
• Bar chart (item vs. attribute)
• Tukey box plot
• Histogram

Bivariate
• Scatterplot
•
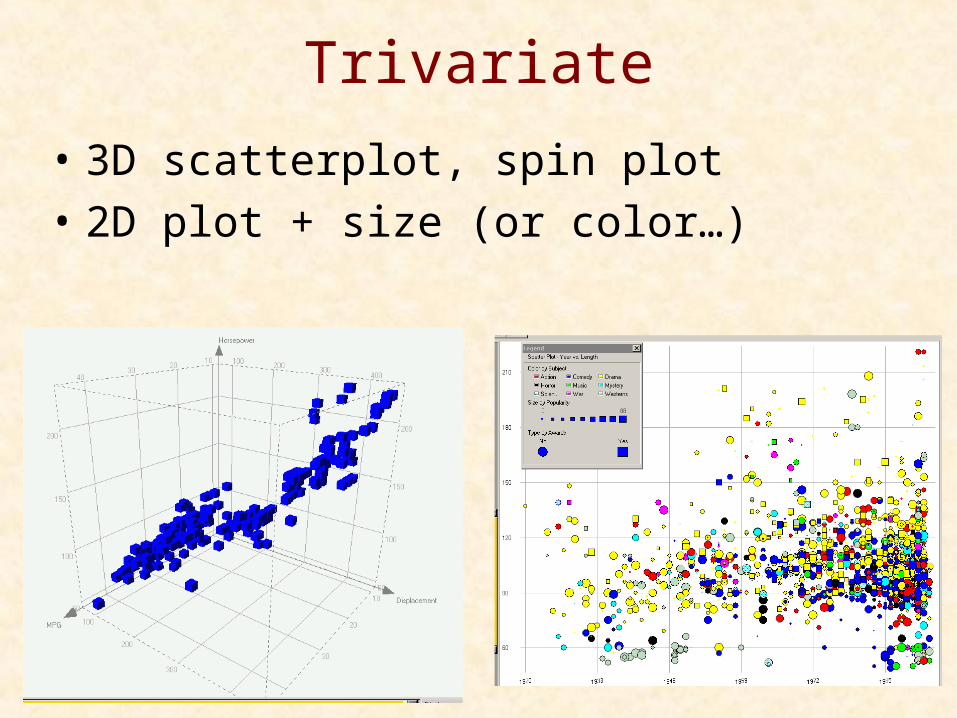
Trivariate
• 3D scatterplot, spin plot
• 2D plot + size (or color…)

Visualization Design

HCI Design Process
• Iterative, progressive refinement
Analyze EvaluateDesign

Analyze
• Data:• Information types (multiD, tree, …)
• Scalability****
• Semantics
• Users:• Tasks
• Expertise
• …
• Existing solutions (literature review)

Data Scalability
• # of attributes (dimensionality)
• # of items
• Value range(e.g. bits/value)

User Tasks• Easy stuff:
• Reduce to only 1 data item or value• Stats: Min, max, average, %• Search: known item
• Hard stuff:• Require seeing the whole• Patterns: distributions, trends, frequencies, structures• Outliers: exceptions• Relationships: correlations, multi-way interactions• Tradeoffs: combined min/max• Comparisons: choices (1:1), context (1:M), sets (M:M)• Clusters: groups, similarities• Anomalies: data errors• Paths: distances, ancestors, decompositions, …
Forms can do this
Visualization can do this!

Design the Visualization Pipeline
Raw data(information)
Visualization(views)
Data tables
Visualstructures
Datatransformations
Visualmappings
Viewtransformations
task
User interaction

Design
• Methods:• Optimize tasks on data, scenarios
• Apply principles
• Build on existing solutions
• Brainstorm
• Artifacts:• Paper sketches
• Mockups (powerpoint, macromedia,…)
• Prototypes (VB, …)
• Implementation

HCI UI Evaluation Metrics
• User learnability:• Learning time• Retention time
• User performance: ***• Performance time• Success rates• Error rates, recovery• Clicks, actions
• User satisfaction:• Surveys
Not “user friendly”
Measure while users perform benchmark tasks

Some Visualization Design
Principles

Effectiveness & Expressiveness
(Mackinlay)
• Effectiveness• Cleveland’s rules
• Expressiveness• Encodes all data
• Encodes only the data

Ranking Visual Properties
1. Position
2. Length
3. Angle, Slope
4. Area, Volume
5. Color
Design guideline:• Map more important data attributes
to more accurate visual attributes (based on user task)
Increased accuracy for quantitative data
(Cleveland and McGill)
Categorical data:1. Position2. Color, Shape3. Length4. Angle, slope5. Area, volume(Mackinlay hypoth.)

Example• Hard drives for sale: price ($), capacity (MB), quality rating (1-5)
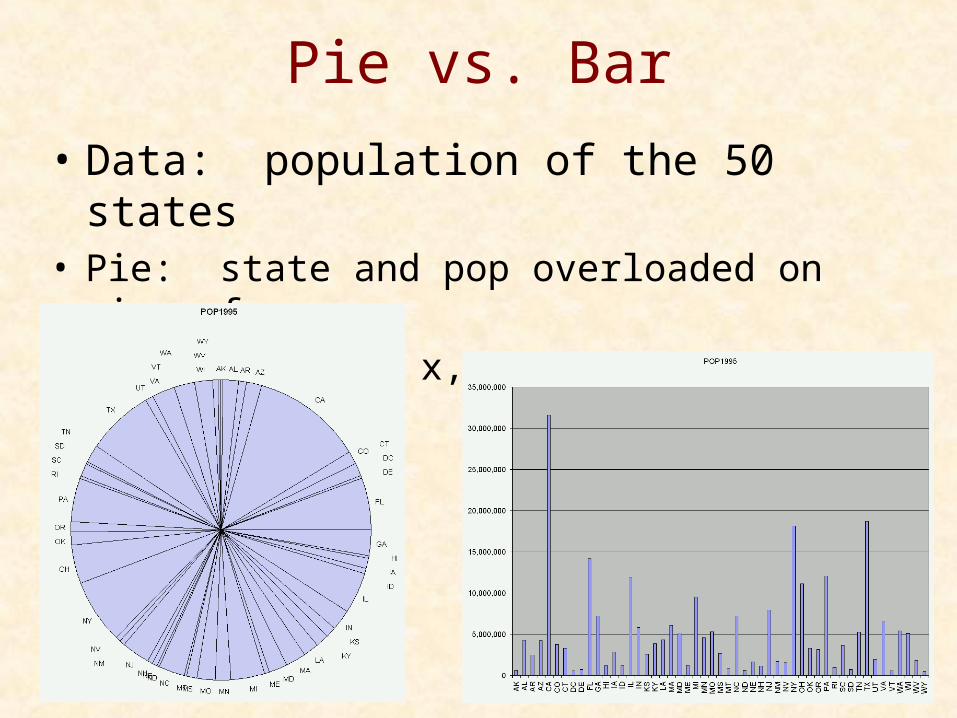
Pie vs. Bar
• Data: population of the 50 states• Pie: state and pop overloaded on circumf.• Bar: state on x, pop on y

Stacked BarAKALAR
CACO
…

Eliminate “Chart Junk”
• How much “ink” is used for non-data?
• Reclaim empty space (% screen empty)
• Attempt simplicity(e.g. am I using 3djust for coolness?)
(Tufte)

Increase Data Density
• Calculate data/pixel
“A pixel is a terrible thing to waste.”
(Tufte)
(Shneiderman)

Interaction Approach
• Direct Manipulation (Shneiderman)
• Visual representation
• Rapid, incremental, reversible actions
• Pointing instead of typing
• Immediate, continuous feedback

Information Visualization Mantra
(Shneiderman)
• Overview first, zoom and filter, then details on demand• Overview first, zoom and filter, then details on demand• Overview first, zoom and filter, then details on demand• Overview first, zoom and filter, then details on demand• Overview first, zoom and filter, then details on demand• Overview first, zoom and filter, then details on demand• Overview first, zoom and filter, then details on demand• Overview first, zoom and filter, then details on demand• Overview first, zoom and filter, then details on demand
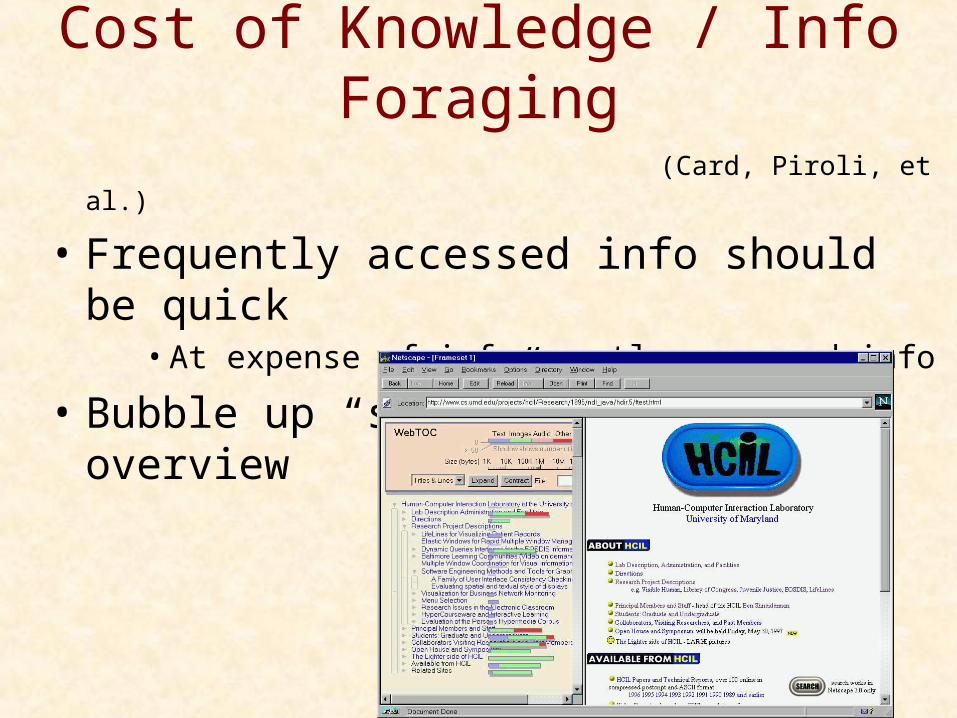
Cost of Knowledge / Info Foraging
(Card, Piroli, et al.)
• Frequently accessed info should be quick• At expense of infrequently accessed info
• Bubble up “scent” of details to overview

The “Insight” Factor
• Avoid the temptation to design a form-based search engine• More tasks than just “search”
• How do I know what to “search” for?
• What if there’s something better that I don’t know to search for?
• Hides the data

Break out of the Box
• Resistance is not futile!• Creativity; Think bigger, broader• Does the design help me explore, learn, understand?• Reveal the data

Class Motto
Show me the data!

How (not) to Lie with Visualization

Information Types
• Multi-dimensional: databases,…
• 1D: timelines,…
• 2D: maps,…
• 3D: volumes,…
• Hierarchies/Trees: directories,…
• Networks/Graphs: web, communications,…
• Document collections: digital libraries,…