visualization frameworks - brown university · visualization frameworks reduce the amount of work...
TRANSCRIPT

Visualization FrameworksHua Guo
Some slides borrowed from Heer and Munzner. References at back.
1

• What is a visualization framework? • Popular visualization frameworks
• Different approaches to creating visualizations
• Pros and cons
• A D3 primer • Data binding
• General update pattern
• Scales, animations, and interactions
• Additional libraries and Vega
Road Map
2

What is a visualization framework? (and why we need them)
3

Two visualizations of the Titanic
4

Titanic Dataset
5
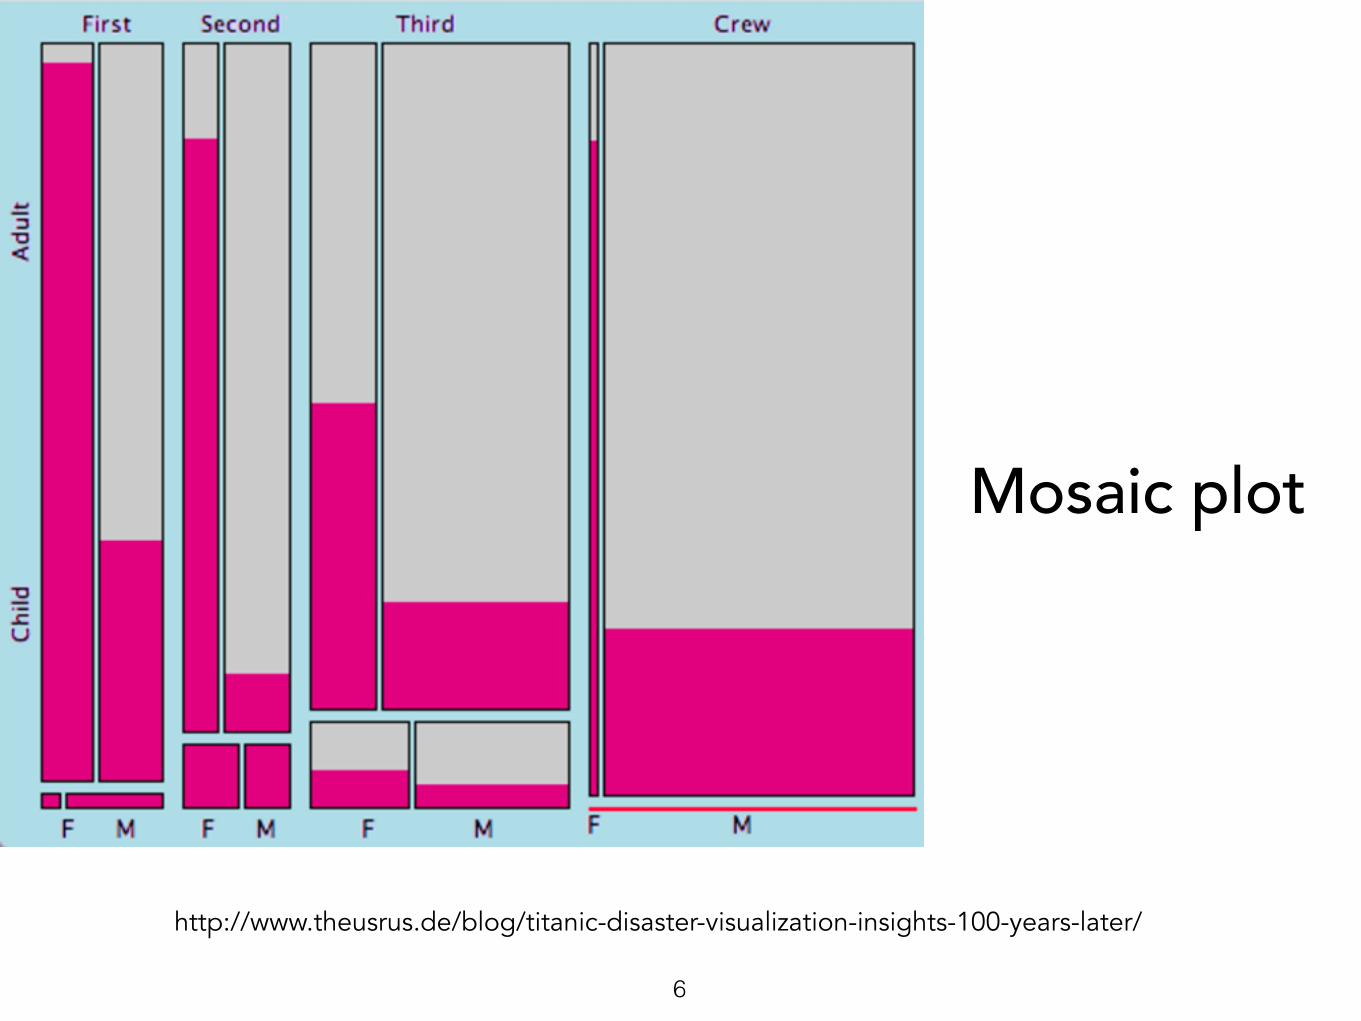
http://www.theusrus.de/blog/titanic-disaster-visualization-insights-100-years-later/
Mosaic plot
6

https://www.jasondavies.com/parallel-sets/
Parallel set
7

http://www.theusrus.de/blog/titanic-disaster-visualization-insights-100-years-later/
https://www.jasondavies.com/parallel-sets/
Parallel set
Mosaic plot
8

• Same data fields • Many possible visual specifications
• Color • Mark • Coordinate
• Lots of choices in data processing • Sum, avg • Merge dimensions
Visualizing the Titanic Dataset
9

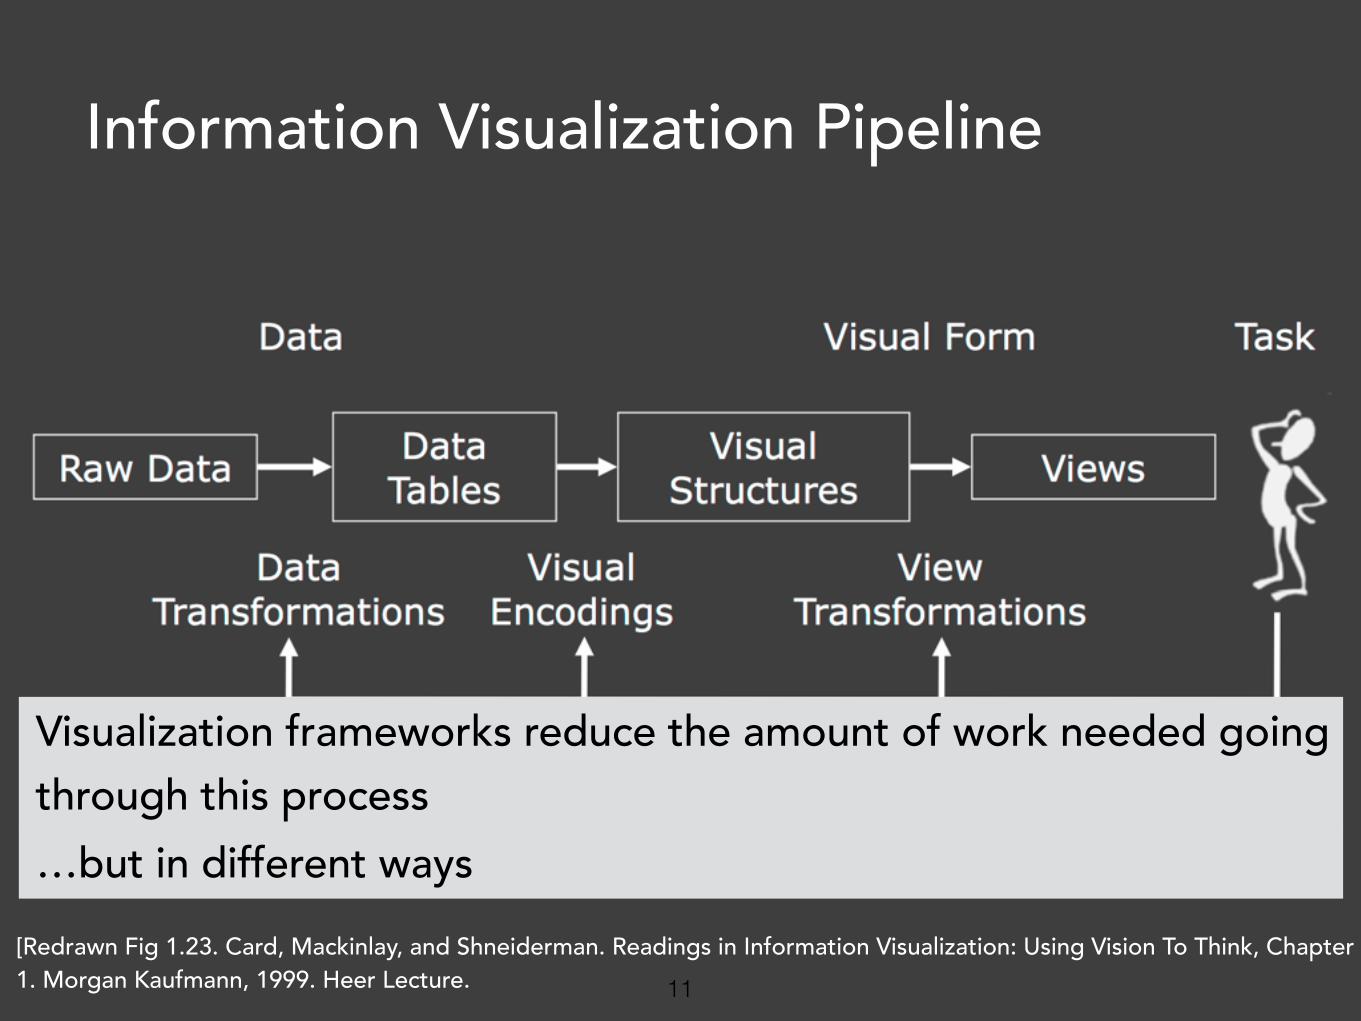
[Redrawn Fig 1.23. Card, Mackinlay, and Shneiderman. Readings in Information Visualization: Using Vision To Think, Chapter 1. Morgan Kaufmann, 1999. Heer Lecture.]
Information Visualization Pipeline
10
[Redrawn Fig 1.23. Card, Mackinlay, and Shneiderman. Readings in Information Visualization: Using Vision To Think, Chapter 1. Morgan Kaufmann, 1999. Heer Lecture.
Information Visualization Pipeline
Visualization frameworks reduce the amount of work needed going through this process …but in different ways
11

• Support for data transformation?
• How to specify visual encodings?
• How much flexibility in view transformations?
What Differentiates Visualization Frameworks?
12

Popular visualization framework
13

Processing
Tableau, ggplot2
d3.js
14

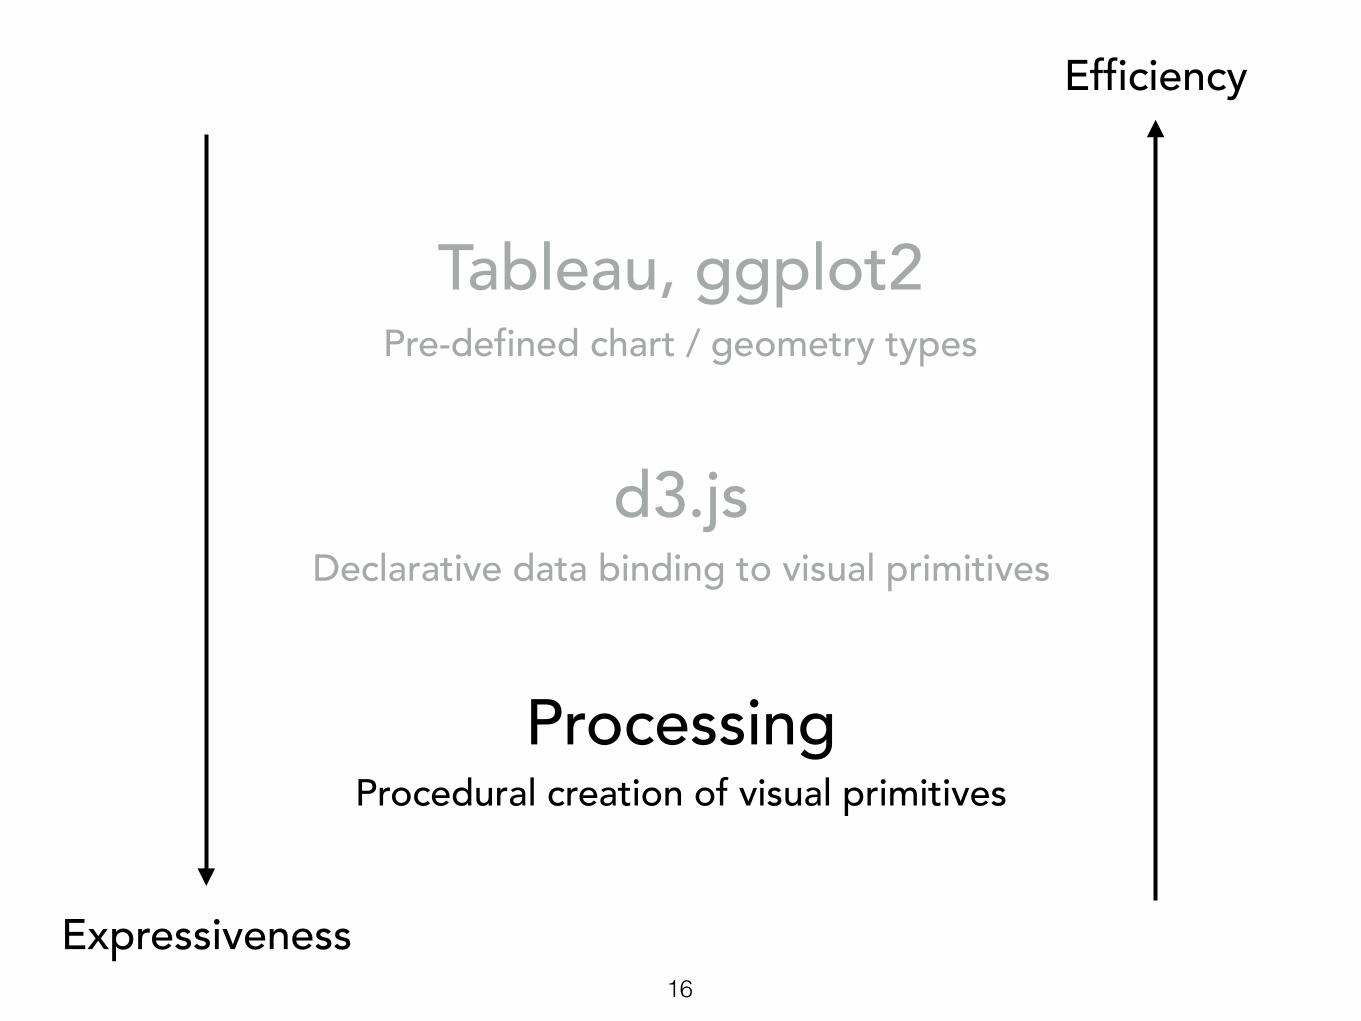
Processing
Tableau, ggplot2
d3.js
Expressiveness
Efficiency
Procedural creation of visual primitives
Pre-defined chart / geometry types
Declarative data binding to visual primitives
[Adapted from Heer Lecture.]15
Processing
Tableau, ggplot2
d3.js
Expressiveness
Efficiency
Procedural creation of visual primitives
Pre-defined chart / geometry types
Declarative data binding to visual primitives
16

Processing• Layer on top of Java / OpenGL
• Procedural creation of visual primitives
• Pros • Highly flexible
• Huge user community, many of which are artists /
designers
• Available in multiple languages (p5.js, Processing.py)
• Cons • No built-in visualization layouts, color palettes etc
17

Processing• Layer on top of Java / OpenGL
• Procedural creation of visual primitives • Pros
• Highly flexible
• Huge user community, many of which are artists /
designers
• Available in multiple languages (p5.js, Processing.py)
• Cons • No built-in visualization layouts, color palettes etc
18

http://learningprocessing.com/
Processing: Hello World
19

int[] angles = { 30, 10, 45, 35, 60, 38, 75, 67 };
void setup() { size(640, 360); noStroke(); noLoop(); // Run once and stop }
void draw() { background(100); pieChart(300, angles); }
void pieChart(float diameter, int[] data) { float lastAngle = 0; for (int i = 0; i < data.length; i++) { float gray = map(i, 0, data.length, 0, 255); fill(gray); arc(width/2, height/2, diameter, diameter, lastAngle, lastAngle+radians(angles[i])); lastAngle += radians(angles[i]); } }
Processing: a Pie Chart
https://processing.org/examples/piechart.html20

int[] angles = { 30, 10, 45, 35, 60, 38, 75, 67 };
void setup() { size(640, 360); noStroke(); noLoop(); // Run once and stop }
void draw() { background(100); pieChart(300, angles); }
void pieChart(float diameter, int[] data) { float lastAngle = 0; for (int i = 0; i < data.length; i++) { float gray = map(i, 0, data.length, 0, 255); fill(gray); arc(width/2, height/2, diameter, diameter, lastAngle, lastAngle+radians(angles[i])); lastAngle += radians(angles[i]); } }
Processing: a Pie Chart
Need to specify the position and color of each slice explicitly No built-in notion of “pie chart”
https://processing.org/examples/piechart.html21

US Flight Patterns. Aaron Koblin. http://www.aaronkoblin.com/work/flightpatterns/interactiveMap.html22

Advanced Processing
• interactivity
• 3D
• lights, camera
• textures
• shaders
• music and video
23

Global Flight Pattern. Ian Liu and Yun Teng. http://www.mat.ucsb.edu/qian/index.php/project/take-flight/24

Processing
• Pros • Highly flexible; good for storytelling
• Huge user community, many of which are artists /
designers
• Available in multiple languages (p5.js, Processing.py)
• Cons • No built-in visualization layouts, color palettes etc (but
external libraries are available, e.g. giCentre Utilities)
25

Processing
Tableau, ggplot2
d3.js
Expressiveness
Efficiency
Procedural creation of visual primitives
Pre-defined chart / geometry types
Declarative data binding to visual primitives
26
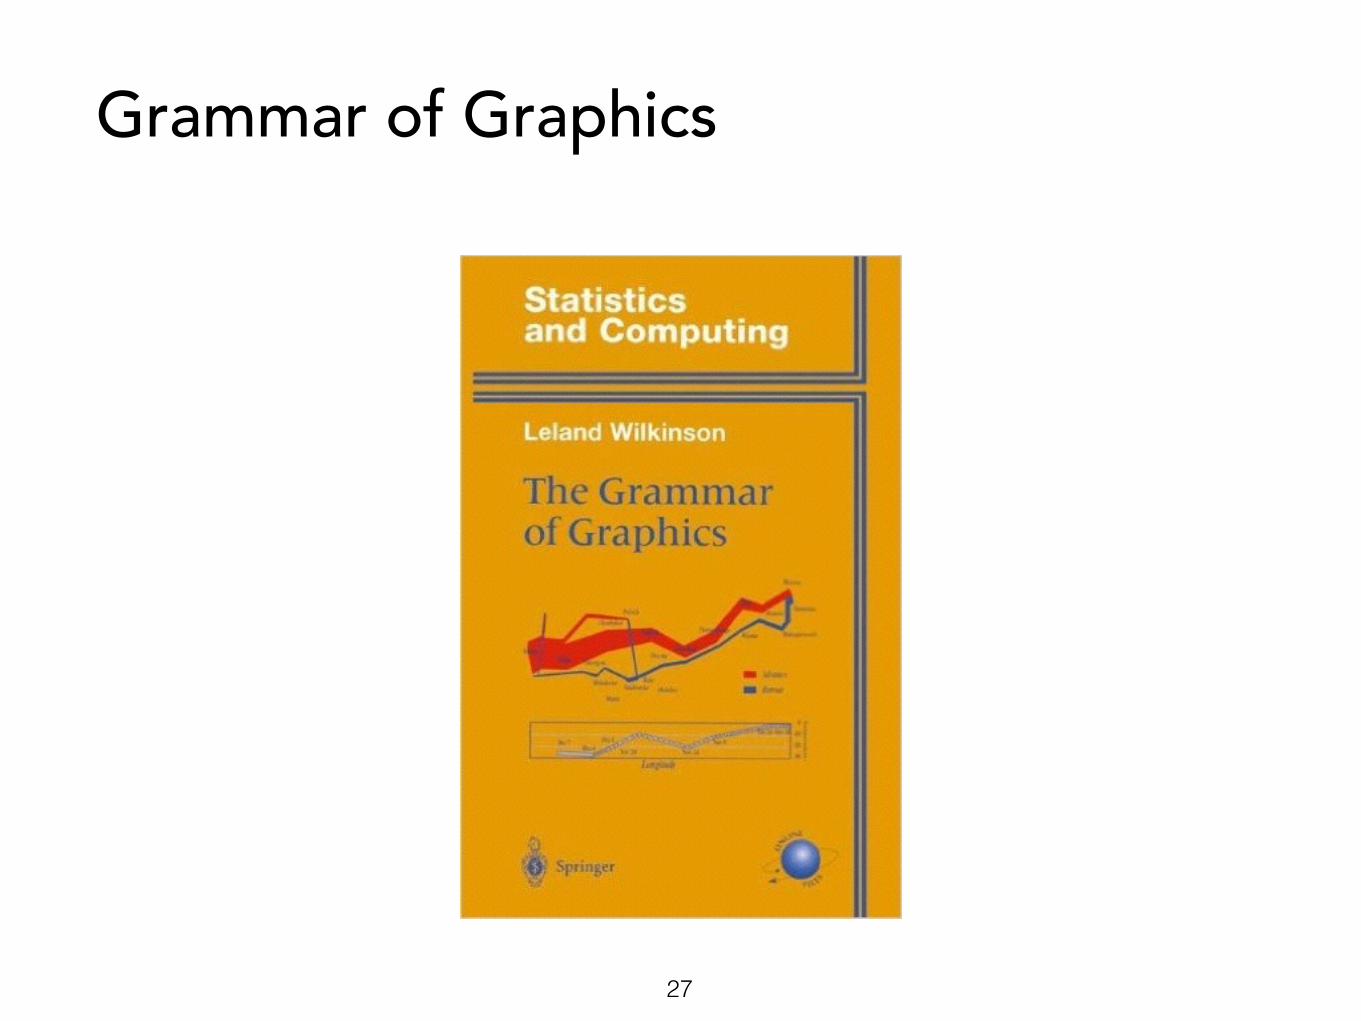
Grammar of Graphics
27

Grammar of Graphics
Visualization
Sentence Parts of speech
Layers
28

Grammar of Graphics: six layers
Data Input data to visualize
Operators Grouping, statistics, layout
Coordinates Cartesian & polar coordinates
Scales Map data values to visual values
Guides Axes & legends visualize scales
Marks Geometric primitives
29

ggplot2 (gg -> “Grammar of Graphics”)
http://chrisladroue.com/extra/ggplot2Intro/introductionGGplot2/ 30

ggplot2 (gg -> “Grammar of Graphics”)
data
31

ggplot2 (gg -> “Grammar of Graphics”)
datamark
32

ggplot2 (gg -> “Grammar of Graphics”)
data
scalemark
33

ggplot2 (gg -> “Grammar of Graphics”)
scale
data
operator (grouping)
mark
34
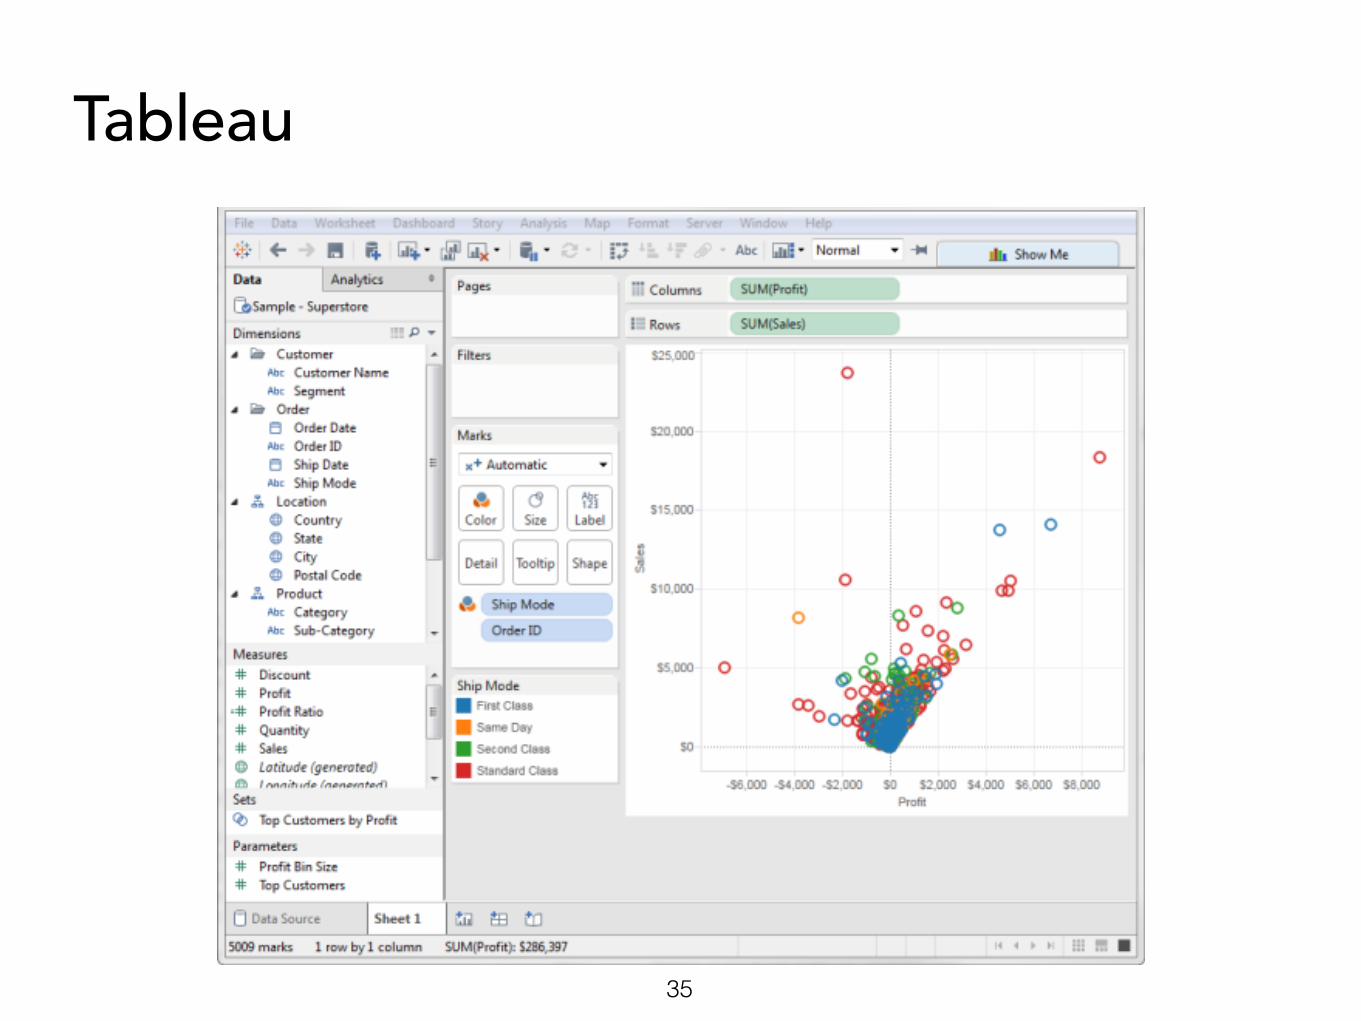
Tableau
35

Polaris / Tableau• Polaris: research at Stanford by Stolte, Tang, and
Hanrahan, and later evolved into Tableau
• Simultaneously specify both database queries
and visualization • Tailored for tabular data
• Data first, visualization follows • Drag & drop to specify data dimensions
• Smart defaults / recommendations for graph types
• Automate visualization design
36

Polaris: Visualization Described Using Visual Specifications
• Table configuration for visualization (algebra) • Operands: the database fields (ordinal and
quantitative fields are treated differently) • Operators: concatenation (+), cross product (x),
nest (/) • Use table configuration to infer appropriate
visual specification • Type of graphic in each pane • Encoding of data as visual properties (color, size,
shape, …) of marks • Data transformations and queries
[Adapted from Heer Lecture.]37

ordinal
quantitative
data transformation
mark properties
38

Table Algebra: Operands
• Ordinal fields: interpret domain as a set that partitions table into rows and columns: Quarter = {(Qtr1),(Qtr2),(Qtr3),(Qtr4)}
• Quantitative fields: treat domain as single element set and encode spatially as axes: Profit = {(Profit[-410,650])}
Stolte. Polaris: Query, Analysis, and Visualization of Large Hierarchical Relational Databases39

• Ordered union of two sets Quarter + ProductType = {(Qtr1),(Qtr2),(Qtr3),(Qtr4)}+{(Coffee),(Espresso)} = {(Qtr1),(Qtr2),(Qtr3),(Qtr4),(Coffee),(Espresso)}
Profit + Sales = {(Profit[-310,620]),(Sales[0,1000])}
Table Algebra: Concatenation Operator
Stolte. Polaris: Query, Analysis, and Visualization of Large Hierarchical Relational Databases40

• Direct-product of two sets Quarter x ProductType = {(Qtr1,Coffee), (Qtr1, Tea), (Qtr2, Coffee), (Qtr2, Tea), (Qtr3, Coffee), (Qtr3, Tea), (Qtr4, Coffee), (Qtr4,Tea)}
ProductType x Profit =
Table Algebra: Cross Operator
Stolte. Polaris: Query, Analysis, and Visualization of Large Hierarchical Relational Databases41

Rows: Ordinal
Rows: Ordinal x Ordinal
Columns: Quantitative
Columns: Quantitative
42

Recommendation of data fields to explore
[Fig 1. Wongsuphasawat et al. Voyager: Exploratory Analysis via Faceted Browsing of Visualization Recommendations. ]43

Automatic data partition
[Fig 1. Anand and Talbot. Automatic Selection of Partitioning Variables for Small Multiple Displays.]44

Automatic data partition
Partition by ACT scores
Algorithmically ranking partitioning variables (e.g. ACT score) based on quality measures for visual patterns
45

A D3 Primer
46

47

Overview of D3
• Research at Stanford by Jeff Heer and Mike Bostock • Declarative toolkit in Javascript • Visualization via binding data to DOM (usually SVG
elements) • DOM (Document Object Model): HTML nodes (div, h1,
button etc) organized in a tree structure
• SVG: XML-based vector image format (visual primitives
on the web)
48

• Research at Stanford by Jeff Heer and Mike Bostock • Declarative toolkit in Javascript • Visualization via binding data to DOM (usually SVG
elements) • DOM (Document Object Model): HTML nodes (div, h1,
button etc) organized in a tree structure
• SVG: XML-based vector image format (visual primitives
on the web)
Overview of D3
49

Data Binding: an Example
[1, 1.2, 1.7, 1.5, 0.7] bar chart
50

Data Binding: an Example
- bar height- bar position
Need to compute:
[1, 1.2, 1.7, 1.5, 0.7] bar chart
51

Data Binding: an Example
[1, 1.2, 1.7, 1.5, 0.7] bar chart
- element value- element index
- bar height- bar position
Given data, we have: Need to compute:λ1
λ2
Visualization as transformation of data properties!
52

[Adapted from Heer Lecture.]53

d3.selectAll('rect') .data([1,1.2,1.7,1.5,0.7]) .enter() .append('rect') .attr('fill','steelblue') .attr('transform',function(d,i) { var left = i*25; var top = 400-‐d*80; return 'translate(' + left + ',' + top +')';
}) .attr('width',20) .attr('height',function(d) {
return d * 80; }) ……
Specifying the visual transformations in code
See https://github.com/mbostock/d3/wiki/SVG-Shapes to learn more about SVG attributes54

d3.selectAll('rect') .data([1,1.2,1.7,1.5,0.7]) .enter() .append('rect') .attr('fill','steelblue') .attr('transform',function(d,i) { var left = i*25; var top = 400-‐d*80; return 'translate(' + left + ',' + top +')';
}) .attr('width',20) .attr('height',function(d) {
return d * 80; }) ……
Method chaining
55

var rects = d3.selectAll('rect') .data([1,1.2,1.7,1.5,0.7]) .enter() .append(‘rect’);
rects.attr(‘fill’,’steelblue');
rects.attr(‘transform',function(d,i) { var left = i*25; var top = 400-‐d*80; return 'translate(' + left + ',' + top +')';
}); ……
Same code w/o method chaining
56

Drawing Marks through Document Object Model (DOM)
d3.selectAll('rect') .data([1,1.2,1.7,1.5,0.7]) .enter() .append('rect') .attr('fill','steelblue') .attr('transform',function(d,i) { var left = i*25; var top = 400-‐d*80; return 'translate(' + left + ',' + top +')';
}) .attr('width',20) .attr('height',function(d) {
return d * 80; }) ……
57

Data Binding
d3.selectAll('rect') .data([1,1.2,1.7,1.5,0.7]) .enter() .append('rect') .attr('fill','steelblue') .attr('transform',function(d,i) { var left = i*25; var top = 400-‐d*80; return 'translate(' + left + ',' + top +')';
}) .attr('width',20) .attr('height',function(d) {
return d * 80; }) ……
58

Data Binding[1,1.2,1.7,1.5,0.7] rect x 5
59

General Update Pattern
Problem: How to deal with dynamic data?Example: Iris dataset, add one species at a time
Setosa Setosa & Versicolor All three species
Data fields: species, petal length, petal width
60

General Update Pattern - Iris Example
visibleData = updateData(userSelection); var circles = d3.select('#canvas').selectAll('circle') .data(visibleData); circles.enter().append('circle'); circles.exit().remove(); configCircle(circles, iris);
Plunker full code example and live preview
61

General Update Pattern - Iris Example
Add more data into the data array
visibleData = updateData(userSelection); var circles = d3.select('#canvas').selectAll('circle') .data(visibleData); circles.enter().append('circle'); circles.exit().remove(); configCircle(circles, iris);
62
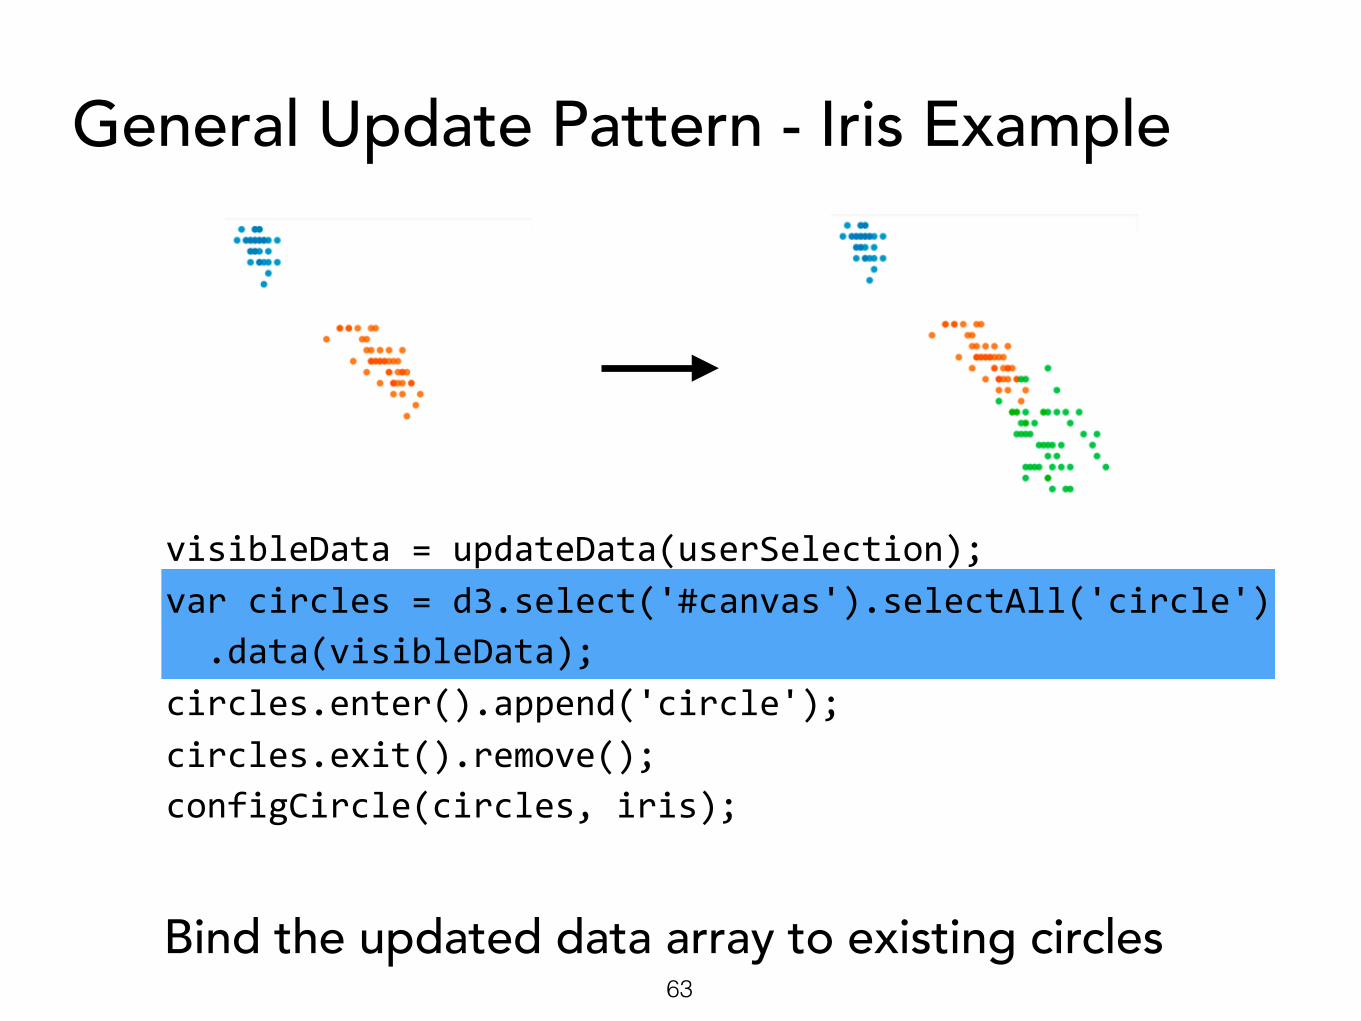
General Update Pattern - Iris Example
Bind the updated data array to existing circles
visibleData = updateData(userSelection); var circles = d3.select('#canvas').selectAll('circle') .data(visibleData); circles.enter().append('circle'); circles.exit().remove(); configCircle(circles, iris);
63

General Update Pattern - Iris Example
Specify actions for new data and removed data
green dots added
visibleData = updateData(userSelection); var circles = d3.select('#canvas').selectAll('circle') .data(visibleData); circles.enter().append('circle'); circles.exit().remove(); configCircle(circles, iris);
64

visibleData = updateData(userSelection); var circles = d3.select('#canvas').selectAll('circle') .data(visibleData); circles.enter().append('circle'); circles.exit().remove(); configCircle(circles, iris);
General Update Pattern - Iris Example
Specify actions for new data and removed data
now we have one-to-one mapping between the data array and the selected DOM elements
65

General Update Pattern - Iris Example
Specify visual transformations of data properties
visibleData = updateData(userSelection); var circles = d3.select('#canvas').selectAll('circle') .data(visibleData); circles.enter().append('circle'); circles.exit().remove(); configCircle(circles, iris);
66

Data Binding on Nested Arraysvar groups = d3.select('body') .append('svg') .selectAll('g') .data([['Alice','Bob','Chris'], [27,19,24], ['RI','MA','CT']]) .enter() .append('g') .attr('transform', function(d, i) { return 'translate(0,' + (i+1) * 20 + ')'; });
groups.selectAll('text') .data(function(group) { return group; }) .enter() .append('text') .text(function(d) { return d; }) .attr('transform', function(d, j) { return 'translate(' + j * 20 + ', 0)'; });
67

Data Binding on Nested Arraysvar groups = d3.select('body') .append('svg') .selectAll('g') .data([['Alice','Bob','Chris'], [27,19,24], ['RI','MA','CT']]) .enter() .append('g') .attr('transform', function(d, i) { return 'translate(0,' + (i+1) * 20 + ')'; });
groups.selectAll('text') .data(function(group) { return group; }) .enter() .append('text') .text(function(d) { return d; }) .attr('transform', function(d, j) { return 'translate(' + j * 20 + ', 0)'; });
['Alice','Bob','Chris']
[27,19,24]
['RI','MA','CT']
68
function configCircle(circles, data) { var positionScales = getScales(data); var colorScale = d3.scale.category10() .domain(['setosa', 'versicolor', 'virginica']);
circles .attr('cx', function(d) {
return positionScales.x(d.petal_length); }) .attr('cy', function(d) { return positionScales.y(d.petal_width); }) .attr('r', 5) .attr('fill', function(d) { return colorScale(d.species); }) .attr('opacity', 0.8); }
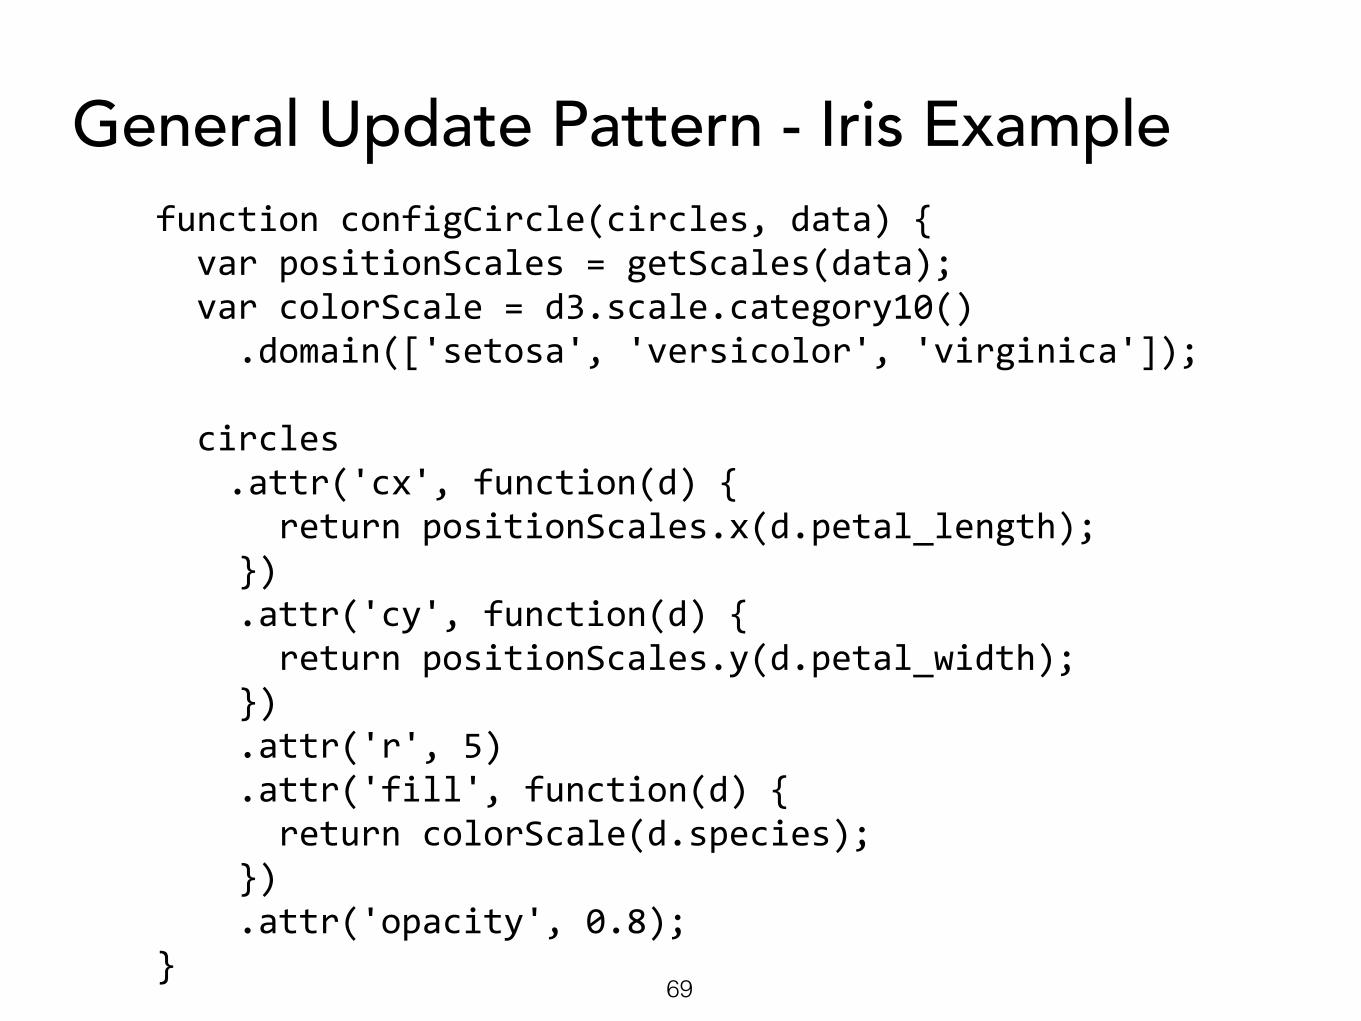
General Update Pattern - Iris Example
69

function configCircle(circles, data) { var positionScales = getScales(data); var colorScale = d3.scale.category10() .domain(['setosa', 'versicolor', 'virginica']);
circles .attr('cx', function(d) {
return positionScales.x(d.petal_length); }) .attr('cy', function(d) { return positionScales.y(d.petal_width); }) .attr('r', 5) .attr('fill', function(d) { return colorScale(d.species); }) .attr('opacity', 0.8); }
General Update Pattern - Iris Example
70

Scales: data value space pixel space function getScales(data) { var scales = {}; scales.x = d3.scale.linear() .domain([ d3.min(data, function(d) { return d.petal_length; }), d3.max(data, function(d) { return d.petal_length; }) ]) .range([10, 400]);
…… return scales; }
range for the x-axis in pixel space
71

Scales: continous domain• d3.scale.quantize()
• d3.scale.quantile()
var q=d3.scale.quantize().domain([0,10]).range([0,2,8]); q(0); // 0 q(3.33); // 0 q(3.34); // 2
var q=d3.scale.quantile() .domain([0,1,5,6,2,4,6,2,4,6,7,8]) .range([0,100]);
q.quantiles(); // [4.5], only one quantile -‐ the median q(4); // 0 q(4.499); // 0 q(4.5); // 100 -‐ over the median q(5); // 100
Examples from http://www.jeromecukier.net/blog/2011/08/11/d3-scales-and-color/. For more explanations and examples, see D3 documentation on scales. 72
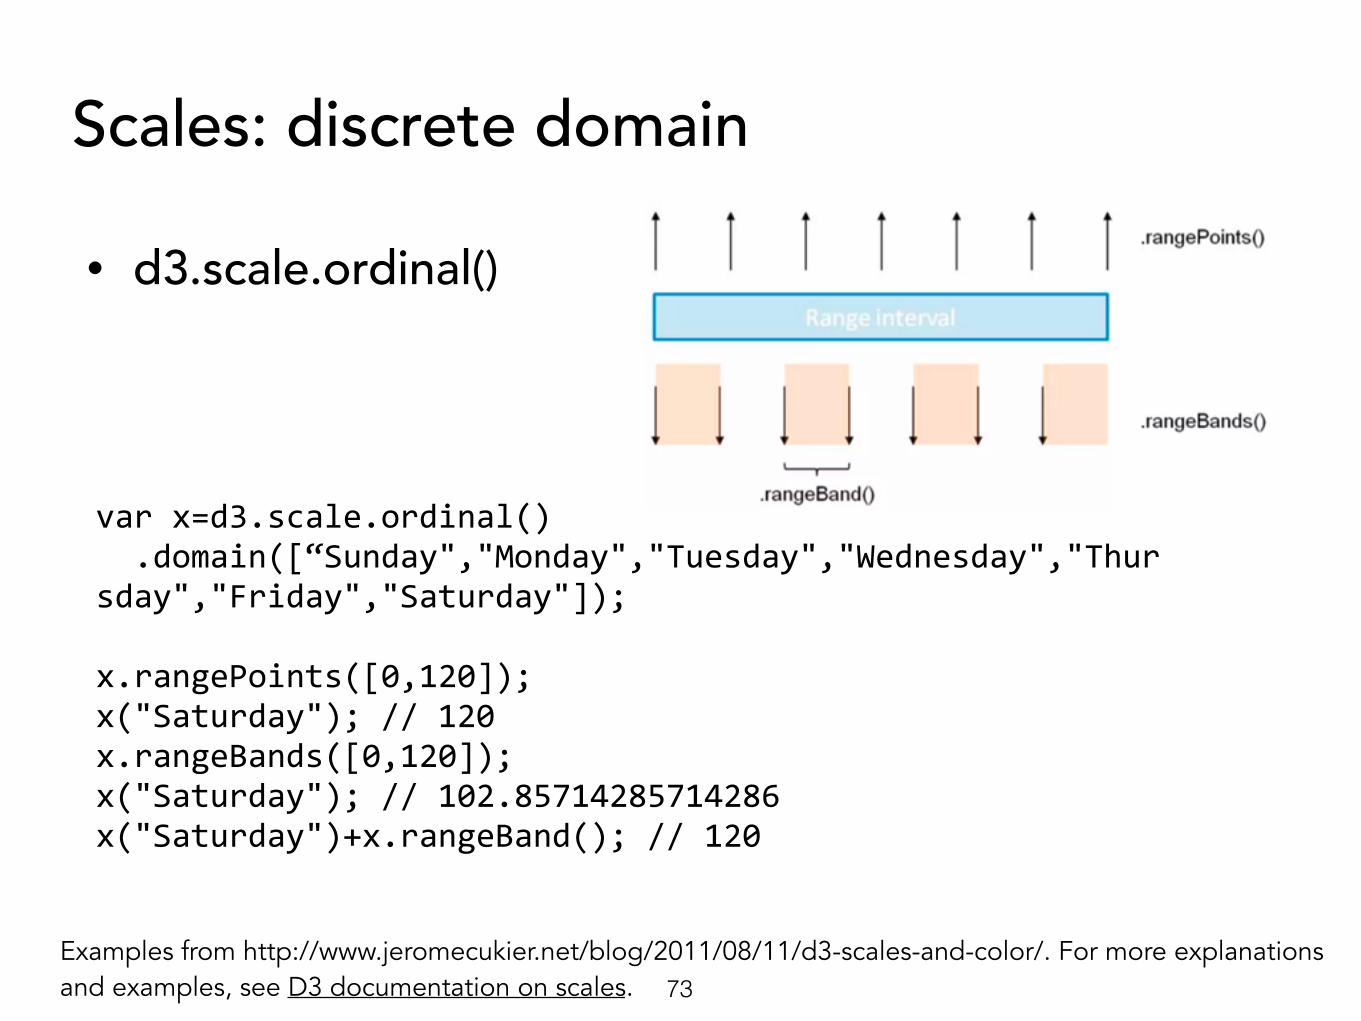
Scales: discrete domain
• d3.scale.ordinal()
var x=d3.scale.ordinal() .domain([“Sunday","Monday","Tuesday","Wednesday","Thursday","Friday","Saturday"]);
x.rangePoints([0,120]); x("Saturday"); // 120 x.rangeBands([0,120]); x("Saturday"); // 102.85714285714286 x("Saturday")+x.rangeBand(); // 120
Examples from http://www.jeromecukier.net/blog/2011/08/11/d3-scales-and-color/. For more explanations and examples, see D3 documentation on scales. 73

Animations
circles .attr('fill', 'steelblue') .attr('r', function(d) { return d * 2; }); .attr('cx', 200) .attr('cy', 200) circles .transition() .attr('cx', function(d) { return random(10, 300); }) .attr('cy', function(d) { return random(10, 300) })
Animating objects with one line
Declaration of the static properties
Initialization of the dynamic properties
Update of the dynamic properties
Plunker full code example and live preview
74

Interactions
circles .on(‘click', function(d) { highlightCircle();
}) .on('mouseover', function(d) { showTooltip();
});
Interaction via DOM event listeners
click, mouseover, mouseout, mouseenter, mouseleave,
mousedown, mouseup
Full list of DOM events: https://developer.mozilla.org/en-US/docs/Web/Events#Standard_events
For difference between mouseover/mouseout and mouseenter/mouseleave: https://bl.ocks.org/mbostock/5247027
Common mouse events
75

Common Pitfalls• Make sure that the parent container is initialized
before performing data binding • e.g. d3.select(‘#canvas’) might return empty selection if
called before DOM is fully loaded • Use $(document).ready(callback) as a safety net if not
loading data from file (requires jQuery) • d3.selectAll(‘…’).attr(…) v.s.
d3.selectAll(‘…’).style(…) • equivalent for SVG objects; specify styles via CSS is the
same as .style(); just don’t mix and match! • Javascript behaviors
• Arrays and objects are passed by reference by default • Asynchronous loading
76

Additional libraries
• D3-based chart libraries • NVD3 • C3.js • MetricsGraphics.js
• Data processing • Crossfilter - data grouping & filtering
• D3 development • D3Kit
77

D3 Pros and Cons
• Pros • seamless interoperability with Web • explicit transformation of scene • active user community with lots of examples
• Cons • limited scalability (dataset size and # of visual
marks) - but you can use Canvas instead of SVG in d3 v4!
78
79
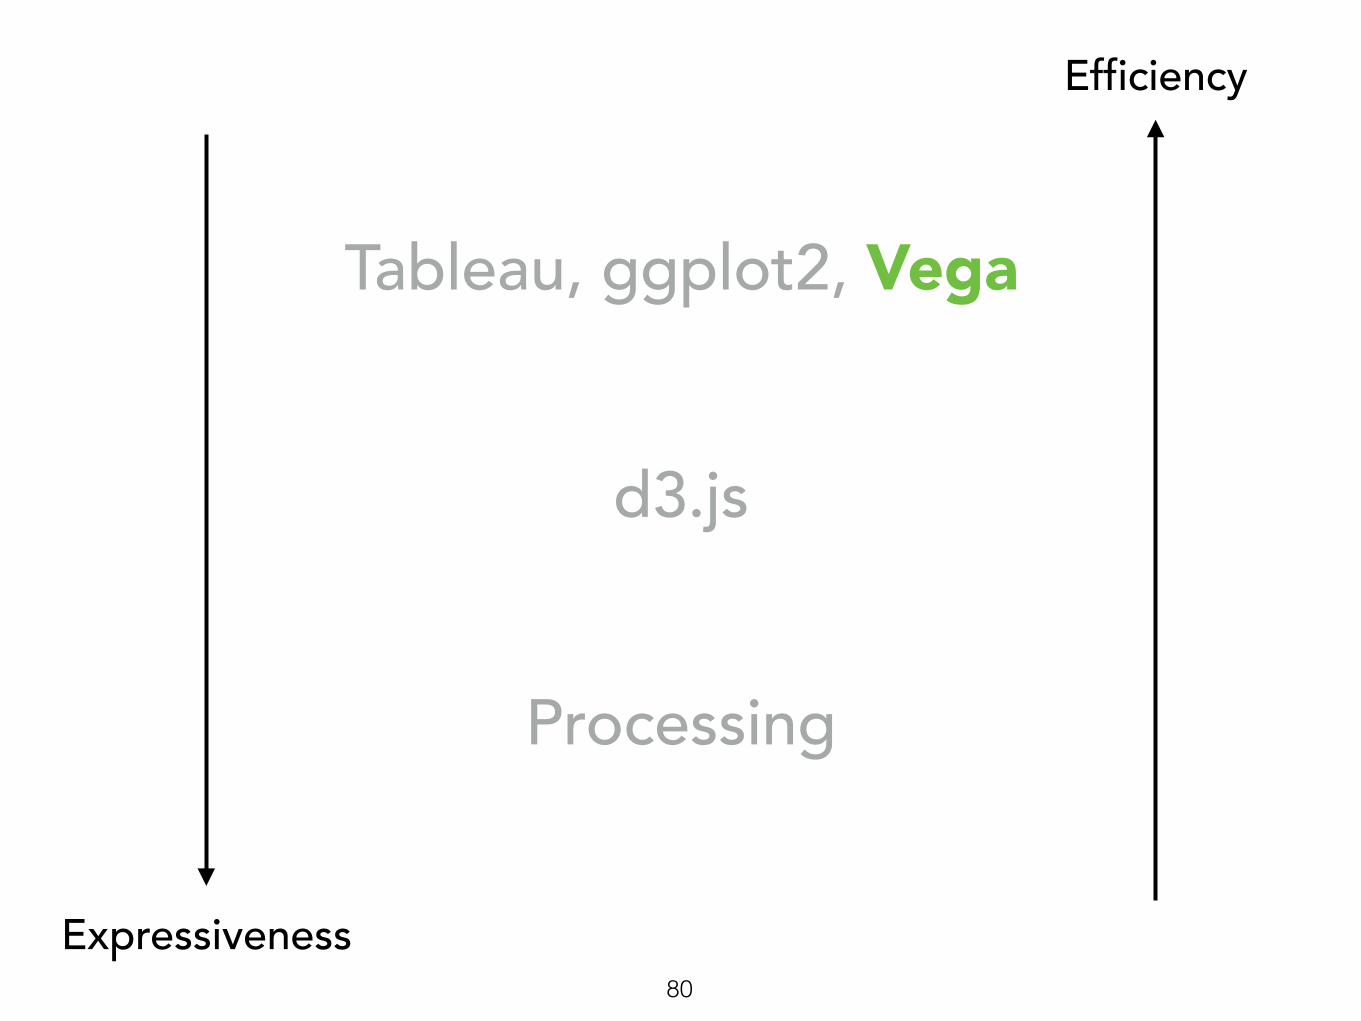
Processing
Tableau, ggplot2, Vega
d3.js
Expressiveness
Efficiency
80

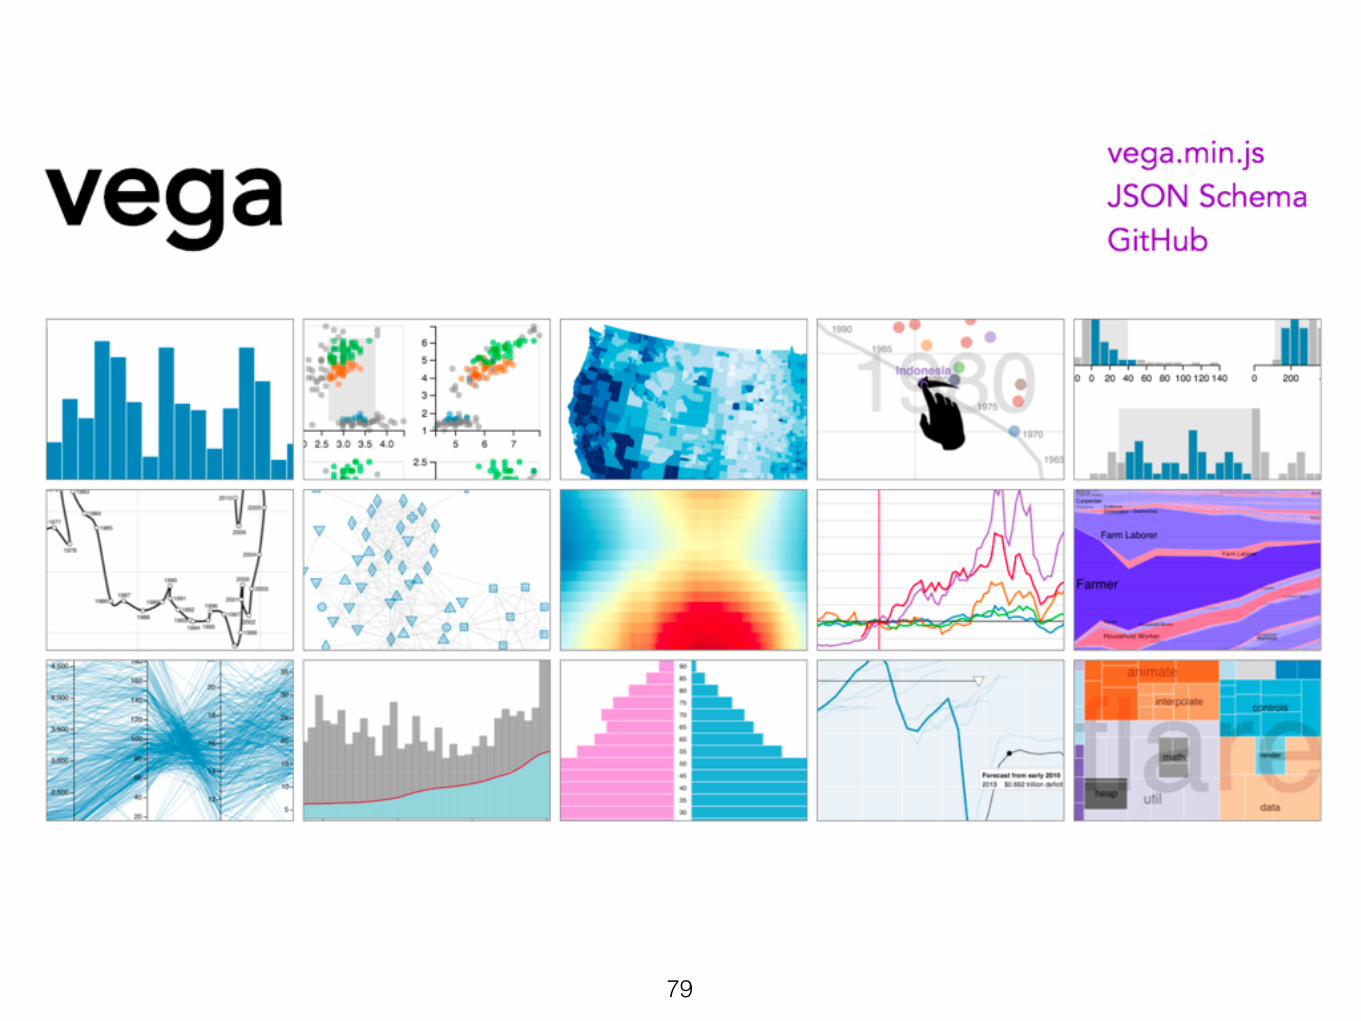
Vega
• Declarative grammar, great for quick prototyping
• Pros
• Web-based
• little coding needed
• Cons
• Limited expressiveness
81

82

Further Readings and References• Visualization frameworks
• Heer lecture: http://courses.cs.washington.edu/courses/
cse512/14wi/lectures/CSE512-Tools.pdf
• Munzner lecture: http://www.cs.ubc.ca/~tmm/courses/
533-11/slides/toolkits.pdf
• D3 • http://blockbuilder.org/ - fork and learn from D3.js examples
• https://bost.ocks.org/mike/circles/
• http://christopheviau.com/d3_tutorial/
• https://www.dashingd3js.com/table-of-contents
83