visualization of tree-structured data through a multi
TRANSCRIPT

San Jose State University San Jose State University
SJSU ScholarWorks SJSU ScholarWorks
Master's Projects Master's Theses and Graduate Research
2009
Visualization of Tree-Structured Data Through a Multi Touch User Visualization of Tree-Structured Data Through a Multi Touch User
Interface Interface
David Andrews San Jose State University
Follow this and additional works at: https://scholarworks.sjsu.edu/etd_projects
Part of the Computer Sciences Commons
Recommended Citation Recommended Citation Andrews, David, "Visualization of Tree-Structured Data Through a Multi Touch User Interface" (2009). Master's Projects. 136. DOI: https://doi.org/10.31979/etd.3y3e-fvnc https://scholarworks.sjsu.edu/etd_projects/136
This Master's Project is brought to you for free and open access by the Master's Theses and Graduate Research at SJSU ScholarWorks. It has been accepted for inclusion in Master's Projects by an authorized administrator of SJSU ScholarWorks. For more information, please contact [email protected].

Visualization of Tree-Structured Data Through a Multi Touch User Interface
A Writing Project
Presented to
The Faculty of the Department of Computer Science
San José State University
In Partial Fulfillment
of the Requirements for the Degree
Master of Science
by
David Andrews
May 2009

© 2009
David Andrews
ALL RIGHTS RESERVED

SAN JOSÉ STATE UNIVERSITY
The Undersigned Project Committee Approves the Project Titled
Visualization of Tree-Structured Data Through a Multi Touch User Interface
by
David Andrews
APPROVED FOR THE DEPARTMENT OF COMPUTER SCIENCE
_____________________________________________________
Dr. Soon Tee Teoh Department of Computer Science Date
_____________________________________________________
Dr. Agustin Araya Department of Computer Science Date
_____________________________________________________
Dr. Mark Stamp Department of Computer Science Date

ABSTRACT
VISUALIZATION OF TREE-STRUCTURED DATA THROUGH A MULTI-TOUCH USER INTERFACE
by David Andrews
This writing project examines different types of visualizations for tree-structured data sets. Visualizations discussed include link-node diagrams and treemap diagrams. Also discussed is recent innovations with regards to distinguishing multi touch from single touch technology. I explore the requirements needed to build a multi touch table top surface, and describe the process of building one. I then describe my proposed method of visualizing tree-structured data and how it can be implemented using Core Animation technology. I also propose a means of interacting with the data through a multi touch interface, and discuss which gestures can be used to navigate the visualization display.

Table of Contents
1 Introduction 11.1 Background Information 1
1.1.1 Information Visualization 1
1.2 Common Tree-Structure Visualization Methods 2
1.2.1 Indented Lists 2
1.2.2 Node-link Diagrams 2
1.2.3 Treemaps 3
1.3 Multi-Touch Interfaces 4
1.3.1 Traditional Input and Touch Input 5
1.3.2 Single Touch or Multi Touch 7
1.3.3 Combining Multi Touch with Cursor-based environments 9
2 Building the Multi Touch Display 102.1 Concepts 10
2.1.1 FTIR 10
2.1.2 DIS 11
2.1.3 LED-LP 12
2.1.4 Tracking Touch Occurrences 13
2.2 Hardware Implementation 13
2.2.1 FTIR Device Frame 13
2.2.2 LED-LP Device Frame 14
2.2.3 Display 14
3 MTVis 15

3.1 Concepts 15
3.1.1 Multi-Touch Frameworks 15
3.1.2 Visualization Method 16
3.2 Implementation 17
3.2.1 Chosen Framework 17
3.2.2 MTVis (Multi touch Tree Visualization) 18
3.2.3 Scaling of Sub-nodes to prevent overlap 19
3.2.4 Multi-Touch interactions 21
3.3 Implementation of MTVis 22
3.3.1 Interactive Control Menu 22
3.3.2 Interactive Link-node Display 24
3.3.3 Interactive Tree Display 25
3.4 Gestures used to interact with MTVis 27
3.4.1 Tap 27
3.4.2 Single Touch and Drag 27
3.4.3 Multi Touch and Drag 27
3.4.4 Double Tap 28
4 Conclusions 30
References 31
Appendix A: Additional Images from MTVis i

List of FiguresFigures
Figure 1. Traditional Node-link Diagrams 2Figure 2. A million node treemap of a file server 4Figure 3. Touch Interface Developed by [15] to operate a robot 7Figure 4: [4]ʼs Dual Finger Stretch guesture for precise control in traditional user interfaces 8Figure 5: Overview of FTIR 11Figure 6: Diffused Screen Illumination 12Figure 7: Circle Packing on Nested Tree Data 17Figure 8: Scaling of Sub-nodes in software 18Figure 9: Scaling of Sub-nodes in motion 20Figure 12: The Control Menu (Far Right) with the Names Display overlay enabled 22Figure 11: The visible display area, with the file permissions display enabled 23Figure 12: Movable Link-node Display 24Figure 13: Tree Display while zoomed in on a child node 26
Figures in Appendices
Figure A-1: Link-node display moved iFigure A-2: Names and Permissions Controls iiFigure A-3: A Larger Data Set iiiFigure A-4: Resizing Nodes on a Larger Data Set iv

1 Introduction
1.1 Background Information
1.1.1 Information Visualization
Information visualization is a method of presenting data that is used to gain a sense of relationship in vast amounts of information. Through visualization, varying aspects of that information can be exposed that is otherwise non-obvious. Most often, visualization is used to represent vast quantities of data through various common shapes. The most obvious of such would be charts and graphs. For example, a bar chart uses rectangles to show the relationship between various data sets along two axis. The effectiveness of the visualization is determined by what can be gained from representing the data in a specific manner. Impressively complex drawings might yield interesting ways of presenting the data, but if no further understanding about the data is revealed, then the visualization is not very useful. As [20] paraphrases, “the purpose of visualization is insight, not pictures.”
There have been many past projects to visualize large data sets. The operating systems we use every day in normal operation of our personal computers visualize data in a fashion. For example, both the Mac OS X FinderTM and Windows ExplorerTM display data primarily either in a grid-like view or in various types of lists. VENNFS [7] is a file manager that displays files using Venn-diagrams to display their relationship to other files. HVS [2] uses a MVC pattern to display hierarchical data in multiple display formats, such as trees, pyramids, dendrograms, treemaps, hyperbolic view, cone view, etc. Wang et. al. describes a method of Circle Packing [25] intended to waste the least amount of visual space on screen. As screen real-estate is limited, being able to visualize more at the same time can make visualizations more effective.
1

1.2 Common Tree-Structure Visualization Methods
1.2.1 Indented Lists
Indented lists are common methods of displaying tree-like data. Most modern computer operating systems provide file browsers with an indented list as a method of browsing the computerʼs file structure. The files in the current directory are listed vertically. Directories display their sub-files and folders by listing them directly underneath in a list that is indented one level further.
Indented lists are good at displaying information for small lists. A file can be accessed quickly if its location is known beforehand. Searching through an indented list, however, presents some problems. Indented lists can display only relatively few nodes at any point in time before the user has to manually scroll down the list to display information that was off-screen. Due to this space-limited restriction, indented lists provide little to no contextual information. Information such as the number of elements at the same level, or the number of levels at a certain height, become difficult or time consuming to understand [11].
1.2.2 Node-link Diagrams
Traditional node-link diagrams provide good intuitive representations of structured data. Data nodes are displayed as circles, and connected to their children via simple lines. Data on the same level of the hierarchy are displayed together, with each level tiled horizontally or vertically in a tiered structure. Two examples of node-link diagrams are
2
Figure 1: Traditional Node-link diagrams [11]

shown in Figure 1. This can provide good insight into the dataʼs direct local hierarchical relationship. Node-link diagrams, however, have scalability issues. As each level contains more and more nodes throughout the entire hierarchy, the required space to display the entire node-link diagram grows overwhelmingly. Display space can easily become a scarce resource and can hinder the intuitiveness if the diagram. A FlexTree diagram is a type of node-link diagram that attempts to reduce the amount of space needed at each level in the hierarchy, while also requiring parents to be drawn to the left of their children. This is done to more easily present additional data (such as node names) as text is traditionally written in English from left to right, horizontally. [11]. Other methods of modifications to node-link diagrams can further enhance their usefulness. For example, only drawing visible nodes to a certain depth, or allowing for zooming in and out of portions of the diagram can add significant value [11].
1.2.3 Treemaps
Treemap diagrams [13] display information in a series of rectangles. The root of the data is usually displayed as a large rectangle. Children nodes are displayed as a series of nested rectangles inside the root. Children of those data structures are further nested. The size of the nested child rectangles always total the sum of the parent rectangle. Typically the sizes are adjusted to be representative of an aspect of the data that can be compared directly to children nodes. E.g. a file systemʼs root directory size is dependent on the size of all of the sub- directories and files in the entire hierarchy. Unlike node-link diagrams, this allows the nodes to be related visually to each other not just in hierarchical location, but also by some other factor such as size, importance, visibility, etc, which would have otherwise been noted elsewhere outside of the diagram. In a treemap diagram, the immediate sub- directories and files would be arranged and scaled to form a perfect rectangle while maintaining their aspect ratios in relation to each other. The resulting rectangle becomes the shape of the root folder.Treemaps handle large data sets better than node-link diagrams. Treemaps forego the use of indicator lines to display parent-child relation in place of simply nesting the child nodes inside the parent node. As a result, parent nodes must be larger, but children nodes do not consume visible space outside of the parent node. Overall, less visible
3

space is used due to the lack of “empty” space required by the relationship lines. With megapixel display screens, treemaps are good at visualizing large data sets (up to an order of a million data points, at one point per pixel), as seen in Figure 2. Any more requires a larger display (e.g. a gigapixel display) or another method of visualizing larger data sets [20].
Treemaps are not restricted to 2 dimensional space, and the concept has been extended to three dimensions, dubbed a Treecube [21].
1.3 Multi-Touch Interfaces
Multi-touch interfaces are an increasingly popular method of accessing visual data. Recently, new hardware devices have been made [3], [16] to facilitate the introduction of using touches to indicate desired operations rather than buttons or clicks. Although the concept is not particularly new, there has been a resurgence in popularity now that the
4
Figure 2: A million node treemap of a file server [20]

technology has advanced far enough to become affordable for commonplace applications.
Touch interfaces provide an alternate input device to the traditional keyboard and mouse. Touch interfaces allow persons to interact directly with data, e.g. touching the screen to sort through pictures as if the pictures were actually laid out on top of the screen. Touches themselves can differ from each other as vastly as they do from the method of input using a keyboard. Hughes and Moscovich explore the the wide differences of manipulating objects with just one or two hands [17]. Their results show that when designing touch interfaces, it is important to consider the intended method of usage, as manipulation of objects intended for one finger from each hand is extremely awkward when using two fingers from one hand, such as two independent control points.
1.3.1 Traditional Input and Touch Input
The traditional input to a computer is that of a keyboard and mouse. The keyboard for text input and the mouse is typically used to navigate around the user interface, if applicable. These input devices are fairly intuitive. On the keyboard, if you push a button, that letter will appear on your screen. Pushing a button results in an action happening. Pushing a button with a modifier key results in a similar, but different result. E.g. holding shift produces capital letters. With a mouse, moving the mouse moves the cursor on the screen. Move the mouse to the left, and we expect the cursor to be moved to the left. To interact with the GUI, all one has to do is click on things with the mouse. After even a short amount of time using a keyboard and mouse, an expectation appears. When one pushes a key, there is an expectation of something happening. The expected and actual functionality of that key need to match, otherwise the user interface can become confusing.
The keyboard and mouse is a limited interface to a computer. Mice manufacturers can add as many physical buttons to the mouse as they want, but the input options are still
5

typically limited to pushing buttons on a keyboard or pressing a handful of buttons on a mouse, and moving it around. Computer interfaces are typically designed with these restrictions in mind. Not so for a touch screen interface, however. The touch screen can open up to the user interface designer a capability limited only by the imagination. Anything that can fit onto a 2d surface is able to be conjured up. This is not to say, however, that anything made on a touch screen is intuitive. With little to no force feedback from interacting with a keyboard and mouse, it is increasingly important that the actual and the expected functionality of the user interface coincide. While touch screen interfaces can provide much more flexibility in that hardware restrictions do not limit input, it also becomes easier to confuse a user if done incorrectly. What looks like a button may result in an action when pressed... or it might just be a random shape on the display.
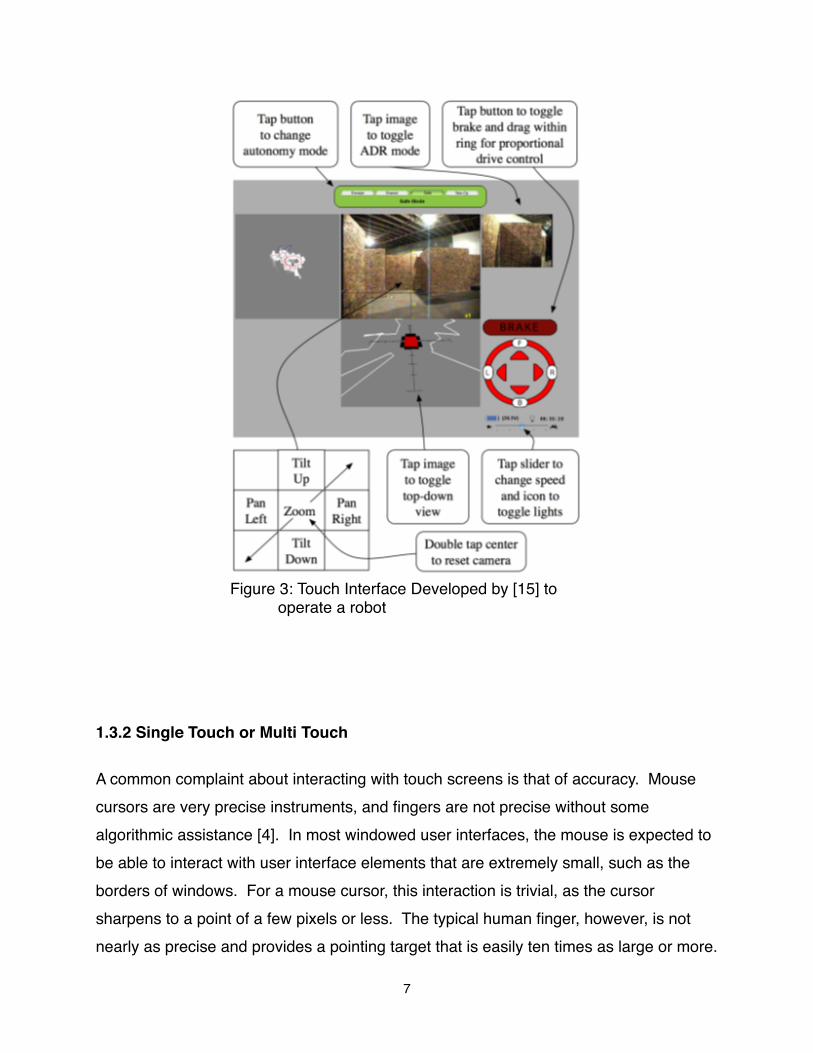
Touch screens provide an advantage for many applications. Without the limited restrictions that traditional input devices provide due to their hardware related inputs, user interfaces can now be designed to be tailored to the current application. For example, [15] discusses their results related to a touch screen interface specifically for interacting with and controlling robots. The interface developed is shown in Figure 3. While studying userʼs interactions and ability to control the robot through this unique user interface, they discovered three components to user interactions: gesture magnitude, gesture alignment, and gesture sequence. Gesture magnitude relates to how large or small the gestures performed are. Some users believed that in controlling direction and movement of the robot, that a single gesture would control both, with the location of the gesture controlling the direction of movement, and the magnitude of the gesture controlling speed. Other users saw differently, believing that direction and speed were controlled independently. Gesture alignment refers to a difference in what the users experienced depending on the location of the gesture relative to the intended location for the gesture. Gesture sequence refers to a sequence of gestures and what was expected, e.g. touch-drag-release, where the user would touch the screen, move a finger while maintaining contact, and lift their finger at a different point.
6
1.3.2 Single Touch or Multi Touch
A common complaint about interacting with touch screens is that of accuracy. Mouse cursors are very precise instruments, and fingers are not precise without some algorithmic assistance [4]. In most windowed user interfaces, the mouse is expected to be able to interact with user interface elements that are extremely small, such as the borders of windows. For a mouse cursor, this interaction is trivial, as the cursor sharpens to a point of a few pixels or less. The typical human finger, however, is not nearly as precise and provides a pointing target that is easily ten times as large or more.
7
Figure 3: Touch Interface Developed by [15] to operate a robot

Most commercially available touch screen devices only offer a single point of contact for touch screens. Many upcoming prototype devices, however, offer multiple contact points using different technologies. With multiple points of contact, many proposals have been made [1], [4], to provide assistance in precision and accuracy of using touch interfaces. Instead of a single point of contact being used to select an area, and using software to estimate the intended target, a second simultaneous point of contact can be made to enhance or clarify the intended target of the original point of contact. An example of this is the Dual Finger Stretch gesture pictured in Figure 4. In this fashion, multi touch surfaces can provide increased accuracy over single touch surfaces without having to rely on magnification or enlargement of the entire user interface. Such elements usually result in obstruction or occlusion of significant amounts of the user interface.
Unlike a single point of interaction with the screen, multi touch screens have multiple manners of touching multiple points. For example, one may interact with two points on the screen using one or two hands. [17] explores the distinction between the two, and finds that both have their advantages. One-handed manipulation of multiple points
8
Figure 4: [4]ʼs Dual Finger Stretch guesture for precise control in traditional user interfaces

offers advantages with control of position and orientation, while two hands is ideal for control of two separate control points.
1.3.3 Combining Multi Touch with Cursor-based environments
Multi touch interface research does not end with the ability of affording multiple touches, however. Although many multi touch prototype devices provide for the detection of touches on the surface, there is research into more advanced interaction detection. [8] discusses a method of not only detecting touch input, but also providing the equivalent of “hovering” a mouse over a user interface element. In [8], they are able to track a human finger before it touches the display, and move a cursor appropriately, mimicking a mouseʼs “click” when the user touches the screen. While applications developed from the ground up that are meant for multi touch interfaces not having the direct concept of a movable cursor, many applications will simply be ported over to a multi touch environment, e.g. a web browser. These applications were not designed with a multi touch environment in mind, and may find that not all of their functionality can be offered when a mouse is not present. While a web browser could be used in a multi touch environment, without the presence of a cursor it is not directly clear how simple javascript mouse rollover events should be handled. With no mouse cursor present, these events may simply never be triggered. This would render some web applications useless or provide extremely frustrating user experiences.
9

2 Building the Multi Touch Display
2.1 Concepts
There are many methods of constructing multi touch interfaces. Such an interface could be constructed by the combination of many discrete sensors with the activation of sensors determining the location of a touch. Another method would be gathering matrices of capacitive electrodes or force-sensitive-resistors [9], [10] although doing so is rather cost-prohibitive. Additionally, these mentioned methods often have an unwanted restriction: they create opaque surfaces that then require some kind of top-down projection. A top-down projection is not a clean solution to a touch interface. Inevitably, the projection will be projecting onto whatever is touching the interface, rather than the interface itself (e.g. a personʼs hand instead of the display canvas).
2.1.1 FTIR
One method of creating multi touch tables is the one pioneered by Jefferson Han [9]. Han describes a method of creating cheap, accurate multi touch interfaces through the use of rear-mounted projection and detection. A camera is mounted underneath the surface along side a projector. The projector projects an image onto the underside of the projection canvas made from a compliant surface overlay. A frame of infra red LEDs are then constructed around the edges of the acrylic. The LEDs are oriented to emit their light directly into the sides of the acrylic pane.
The fundamental technology behind this device is a concept known as Frustrated Total Internal Reflection (FTIR). When light passes through one medium into another with a lower index of refraction, the light becomes refracted. Depending on the angle of incidence, the light becomes refracted to a different angle. Past the critical point, the light instead becomes reflected, which is known as Total Internal Reflection. This phenomenon is easily observed in optical prisms, and is the basis of how technology such as optical fibers work. When a third medium is put in place within a few
10

wavelengths of the second medium, the light then becomes frustrated, and can escape the Total Internal Reflection and pass out of the medium without being reflected back inside as seen in Figure 5.
Although there has been some success without, often a compliant surface of some sort is needed to ease tracking of moving touches into smooth, trackable movements. Silicone solutions are popular methods of creating compliant surfaces.
2.1.2 DIS
The setup for a DIS (Diffuse Illuminated Surface) table is much the same as a FTIR setup. A piece of acrylic is surrounded by a frame of LEDs and a camera detects infra red light below the acrylic plane. By using a special type of acrylic, the light from the LEDs is then redirected evenly towards the surface of the acrylic pane. Any object on or near the surface will then become illuminated by the IR light and be visible to an
11
Figure 5: Overview of FTIR [9]

appropriately placed camera. Figure 6 shows a common setup for DSI and how the infrared light interacts with the plexiglass. Unlike FTIR setups, no compliant surface is needed. This makes DIS solutions ideal for setups that wish to use LCD panels instead of projectors, although currently the special acrylic needed can be cost-prohibitive.
2.1.3 LED-LP
LED-LP (LED-Light Plane) is another, similar type of multi touch table setup that is much like FTIR setups, but with the acrylic pane removed. Instead, the LEDs shine directly towards each other creating a plane of light that is broken when, for example, a finger passes through it to touch an LCD display. The light then reflects off the intruding object and is detected by a camera. LED-LP setups evolved from a different type of table, a LLP (Laser Light Plane) table, where lasers are used instead. Although less effective than lasers at creating thin planes of light, LEDs are safer to use.
12
Figure 6: Diffused Screen Illumination [18]

2.1.4 Tracking Touch Occurrences
In all three mentioned table types, touches on the table are tracked similarly. Infrared light is emitted by the LEDs and is reflected in some manner downwards towards an appropriately placed camera. The camera is equipped to only detect infrared light. The touches (or “blobs”) are detected by the camera and passed on to software frameworks for processing to be used in multi-touch applications. At no point are the touches ever restricted to a single touch at a time, a single touch from a single source, or anything else of the sort. The frameworks are designed to be able to track multiple blobs at a time. Hence the “multi”-touch aspect of the device.
2.2 Hardware Implementation
Two types of device frames were designed and tested briefly. In both cases, an LCD screen was used instead of a projector. A FTIR frame was constructed first. A compliant surface could not be used without obstructing the view of the LCD screen, and so while the device worked, it did not track moving touches very well. The device was then converted into a LED-LP setup.
2.2.1 FTIR Device Frame
Using FTIR, the interface is constructed from a sheet of acrylic 3/8” thick. The sides have been completely polished to remove any abrasions from the cutting of the acrylic. The sheet is mounted parallel to the ground atop a frame to act as the top of a table surface. At the bottom of the frame, near the ground, a camera is mounted to the frame facing upwards to look directly at the underside of the acrylic sheet. The camera is located far enough away that the entire piece of acrylic is within its view. The acrylic sheet is then surrounded entirely with an infrared (940nm) LED ribbon along the sides. The ribbon is encased with a short baffle zone and pressed flush up against the sides of the acrylic to maximize coupling into TIR. The light from the LEDs will end up being totally internally reflected between the top and bottom surfaces of the acrylic. The
13

camera mounted underneath the table has had itʼs infrared filter removed and replaced with multiple pieces of developed exposed photo-negatives [5]. This allows for a significant portion of visible light to be filtered out, while allowing infrared light to pass through, acting as a suitable, yet cheap, infrared band pass filter.
2.2.2 LED-LP Device Frame
To create the light plane, the acrylic was removed. The LED ribbon was detached and put inside a 3/8” aluminum channel. The aluminum channel was cut to fit around the sides of the LCD display to create the light plane.
2.2.3 Display
Instead of a rear mounted projection unit, I chose to turn to LCD technology. I dismantled a 17” LCD monitor and placed the LCD display and the backlight underneath the acrylic glass. The LCD itself does not interfere at all with the passing of infrared light, so it has no effect on the operation of the table. The fluorescent backlight to the LCD display emits no infrared light, so it can still provide adequate lighting for the LCD display. The circuitry for the LCD controller are hung mid-air perpendicular to the LCD display so that they do not interfere with the operation of the table by obstructing the cameras view of the underside of the acrylic display. A simple diffuser that came with the monitor was left in place, and all other parts were removed and discarded.
14

3 MTVis
3.1 Concepts
MTVis (Multi touch Tree Visualization) is the working name for the software used in this visualization project. Written specifically to visualize tree structured data through a multi touch interface, this software is written to interact with a multi touch framework that controls the detection of surface touches independently. MTVis processes the touches and gestures and changes the properties of the visualization accordingly.
3.1.1 Multi-Touch Frameworks
The software for a multi touch device is just as important as the hardware. Various frameworks have been developed for support of these devices, primarily in the academic and open source communities [19],[23],[24]. There is not yet a common standardized protocol for multi touch interactions, though at least one has been proposed [14]. Most of these frameworks act as independent applications that receive results from the camera, e.g. [19]. They process the view of the camera (of which only infrared light should be visible to) and handle the detection of blob movements, formation of new blobs, and disappearance of blobs (i.e. touch movements, new touches, and touch removals). User generated applications can then interact with the framework application via code libraries designed for use with the frameworks.
The application portion of the framework is usually customizable to fit the appropriate device. Common customization properties are the calibration of the camera in setting various aspects such as orientation, sensitivity, colorization, resolution and frames per second. Most frameworks have additional post-processing options. Example options would include the size of what the framework should consider a blob and what should be considered noise, grayscale conversion of the image, luminescence thresh-holds, number of frames a blob needs to be missing before considered removed, background subtraction, etc. Additionally, the frameworks are able to calibrate and interpolate
15

results from the camera, so that the camera can realistically be placed just about anywhere and can be used from almost any angle such that the screen is still visible.
One proposed protocol for framework-application interaction is the TUIO protocol [14]. TUIO is built upon the OSC (Open Sound Control) protocol. TUIO is quickly becoming a de-facto standard for communication between application and server frameworks. Through this protocol, applications can be written and used on any correctly configured multi touch device that is running a framework with TUIO support, regardless of the deviceʼs multi touch hardware implementation (FTIR, LED-LP, LLP, DIS, etc).
3.1.2 Visualization Method
The vast majority of information visualization has come with regard to creating diagrams and charts that visualize the data provided in order to reveal some otherwise non-obvious insight into the data. Specifically for treemaps, few studies have been done that go beyond the algorithm and its layout. Those that have [6], do not do much more than zoom in and out of the layout as a proposed form of interaction. While a treemap is an excellent way to display tree-structured data, it does not immediately allow for many forms of interaction, particularly with multi touch interfaces.
Circle Packing, presented by Wang et al. [25] provides a unique variation of treemaps. Instead of rectangular bounding boxes, circles are used. Wang et al. shows how using circles instead of rectangles adds additional information to the visualization method. Primarily, circle packing clearly identifies the hierarchical structure of the data. Hierarchical structure is easily lost in the mass of rectangles for treemaps, with the leaf nodes comprising most of the display area, and the hierarchy itself being implicitly identified [25]. Methods of interaction are described with circle packing [25], however they are limited to standard geometrical manipulations of the produced visualization via pan, zoom, or rotation. Figure 7 shows an example of Wangʼs nested circle packing, with columns representing directories and spheres on top, representing files.
16

The visualization method ultimately determined to be best for interacting with a multi touch user interface is somewhat of a combination. RINGS [22] shows a method of revealing hierarchical structure while still maintaining increased interactivity within the resulting visualization. The interactive methods for RINGS are expanded upon here and adapted for use in a multi touch environment. One method of manipulating the visualization is to be able to move nodes around to produce more custom views of the focus areas. Additionally, this visualization method will allow, through the use of multi touch user interfaces, an easy method of scaling nodes at the current level without removing from the visible area, any of the visualization of other nodes. This will allow scaling of focus areas, while maintaining the contextual information of the rest of the hierarchy without discarding it entirely.
3.2 Implementation
3.2.1 Chosen Framework
The framework used in this project is Touché [23]. Touché is an Open Source project licensed under the LGPLv3. This framework is written for Mac OS X using the
17
Figure 7: Circle Packing on Nested Tree Data [25]

Objective-C programming language. This framework was chosen because it leverages high quality open source frameworks, and uses many of the core technologies from Mac OS X, namely Core Animation. Core Animation was chosen for ease of manipulating 2d images in a 3-dimensional space quickly and efficiently.
3.2.2 MTVis (Multi touch Tree Visualization)
MTVis (Multi touch Tree Visualization) displays the contents of a file structure. A file system is visualized because it is a readily accessed and easily available set of structured data available through the Operating System. MTVis displays all directories in the file structure as nodes surrounding the center of the screen. All directories located at the root of the file structure are represented by circles along the circumference of a circle C (as seen in Figure 8) with its origin in the center of the multi touch viewing screen. The radius of the circle C is dependent on the user-defined value for the size of each node. The radius is defined as being half the distance between the edge of the root node and the top of the screen, added to the size of the radius of a root
18
Figure 8: Scaling of Sub-nodes in software

node. Lines are drawn connecting the root (the center of the screen) with each subdirectory to indicate parent-child relation within this graph. All of this is drawn within one of Core Animationʼs CALayer object (a lightweight container for drawing 2-dimensional images). Each subdirectory is then drawn with its own CALayer object.
3.2.3 Scaling of Sub-nodes to prevent overlap
Along the circumference of circle C is all of the directories contained within the root folder. Each of those directories must also be able to display their own subdirectories. They do so exactly the same way that the root node does. All of their subdirectories are spread evenly about another circle calculated exactly the same as directories for the root node. The CALayer representing this directory (and all of its subdirectories) is then scaled an appropriate amount to the smaller of two values. The first is such that 1/2 the total screen height used by the CALayer corresponds to half the distance between the edge of the root node and the edge of the screen on the top-most directory, centered along the circumference of circle C as shown in Figure 8. This first value will work for a small number of nodes, but becomes impractical with a greater number of directories in the same subdirectory. Figure 8 shows the relative location that each node is scaled according to. Beyond this amount however, the scaling is done proportional to half the distance between any two nodes. The CALayer will be scaled to the smaller of either of these two values.
This generation and scaling is done recursively, bottom-up. The effect is that no matter how many subdirectories are contained within the entire data structure, no two subdirectories will ever overlap with any of their subdirectories or any other nodes. Every node will be entirely distinct and there will be no confusion, as each node is completely visible and itʼs origins in the parent-child relationship are clear.
Figure 9 shows an example of how this scaling applies even when two nodes are moved via the application interface. Circles A through H represent the directories A through H and the display area allowed for all subdirectories and files. The two dark
19

circles in D and H represent two simultaneous touches on the touch surface. As the touches move to the left, they move along with them nodes D and H. As the space between, for nodes A, B, and C reduces in size, so to do the nodes scale themselves down. This reduction in scale ensures, for example, that node Bʼs children are still safe from being obstructed by node A or Cʼs children nodes. As a result, node E, F and Gʼs display area grows, allowing these nodes to expand their visible area and provide increased focus on their children and any information further down the hierarchy within those nodes.
20
Figure 9: As nodes D and H are moved to the left, nodes A, B, and C are scaled down to ensure their sub-structure is never covered by another node. Nodes E, F and G expand with their increased available area

3.2.4 Multi-Touch interactions
The multi-touch interactions are done via the Touché framework, using callback functions. These functions are registered upon application loading, and when actions such as new touches, removed touches, or moved touches are performed on the surface of the multi touch table, the appropriate function is called within the MTVis application. The framework provides for indication of these actions, but does not track specific touches. For example, the framework will indicate that a touch has been made, and a touch has been removed, but it will not keep track that a touch is still active.
For this, MTVis instead keeps track of which CALayers have been “touched” or are still “being touched” by the user. It also keeps track of the type of touch being performed, such as a rotate or a drag. These types of touches are important, because they indicate what actions to do when touches on the table are moved (i.e. a finger is dragged). A rotation touch could indicate that no CALayer was touched, but instead the background of the application was touched. The proper action here is then to rotate the entire program in a circular fashion. A drag touch would indicate that movement of a specific node was requested. Two drag touches at the same time would indicate that two nodes are being moved simultaneously.
When two nodes move at the same time, they can be considered to be either moving together or apart. I will consider them moving together when they are moving towards each other at an angle less than 180 degrees, and apart when moving away from each other at an angle less than 180 degrees. When moving apart, the CALayers that represent the nodes in between the two that are moving are scaled an appropriate amount such that the maximum screen space can be utilized. When two nodes move apart, the nodes between them grow larger to fill in the opened space, and the nodes outside are shrunk at an appropriate rate, such that the available space allocated to a node to draw its subdirectories will still never overwrite that of another node, as described in Figure 9.
21

3.3 Implementation of MTVis
3.3.1 Interactive Control Menu
The Control Configuration menu starts out as a single “button” on the far right of the display. When the user places a touch onto that button, the menu scrolls down to show multiple similar Configuration Buttons. Each of these buttons changes a property of the display on the Interactive Node Display. E.g. a button titled “Names” will toggle the display of names in the Node Display. Figure 10 shows an example of the Control Menu displayed with the Names overlay enabled. The important distinction between
22
Figure 10: The Control Menu (Far Right) with the Names Display overlay enabled

this and any normal button menu is the user interactivity. This is different from, for example, a typical menu bar-like interface in that once a configuration item is changed, the menu does not disappear, but rather stays as an interactive part of the display until it is closed. Additionally, the button themselves will change appearance to indicate whether or not they are enabled or disabled.
23
Figure 11: The visible display area, with the file permissions display enabled

Example control options include: displaying of names, colorization of nodes as a single static color, or variable dependent on size, permissions, or type. Figure 11 shows an example of the permissions display enabled, and nodes are colored by their respective fileʼs user permissions.
3.3.2 Interactive Link-node Display
This Link-node Display is a display in the form of a typical N-Tree, with each parent node having connections to each child node. The node currently on display in the Interactive Node Display is distinguished from the rest in order to give a sense of locality
24
Figure 12: Movable Link-node Display

(particularly locality with reference to the tree structure above the current location) in the tree structure data set.
This Tree Display is displayed on the left side of the screen. In certain circumstances, this can result in difficult to see trees (e.g. trees that are wide and shallow being displayed on an area of the screen that is thin and deep). However this should pose little problem to the user, as this display is completely interactive- it can be adjusted using simple gestures so that the contents can fit comfortably on the screen. While the tree itself is not manipulatable through this display (the Interactive Node Display comes into play here), it does reflect the status of the entire data hierarchy at the current point in time, and its display of that information is manipulatable instead, as shown in Figure 12.
To facilitate trees of all types and sizes, the tree will automatically orient itself either vertically or horizontally depending on the width of the tree. Wide trees will display horizontally, and deep trees will display vertically.
3.3.3 Interactive Tree Display
The Interactive Tree Display is the primary means of interaction and visualization. Nodes are displayed around a central point initially equidistant from each other. The node locations are manipulatable, and if two nodes are moved at the same time, nodes between them are adjusted in size. Nodes display an icon representing the nodes themselves, and recursively display every sub-node in the hierarchy similarly. Nodes primarily display themselves as a circle with various attributes. Depending on the settings in the control menu, the display of the node may be visualized differently depending on a number of factors. The node may either be a circle of various colors depending on file size or permissions, it may display the fileʼs name, or be visualized as a preview of the fileʼs contents.
25

Nodes identify direct connections to parent and children nodes via simple straight lines. The parent node of the current active directory in the Interactive Tree Display is not directly displayed, but instead must be inferred via the Link-node Display area, which will indicate where in the tree the current Interactive Tree Display area is viewing.
The location within the tree hierarchy can be navigated via taps on nodes to traverse down into that node, or taps on the center to traverse back up to display the parent node. Figure 13 displays a child of the root node that has been zoomed in on.
26
Figure 13: Tree Display while zoomed in on a child node

3.4 Gestures used to interact with MTVis
3.4.1 Tap
The Control Menu is the only area that directly responds to a single tap. A single tap is the most intuitive way to indicate a change in setting. Unlike other gestures, a single tap on a button-like object is fairly clearly projecting a desire for a toggle of some kind. This makes it the most intuitive gesture for the Control Menu.
3.4.2 Single Touch and Drag
Both the Link-node area and the and the Tree Display areas use the touch and drag gesture. This is a very intuitive gesture for directly moving an object around the user interface. The touch indicates a target or lock on the object being touched, and until the touch is removed (e.g. finger is lifted), the object shall be relocated to wherever the touched location is moved to.
For the Link-node display area, the result of this gesture is somewhat obvious. It will, while maintaining the displayʼs orientation, move the display around the screen.
The touch and drag gesture also has another use in the Tree Display. In the Tree Display, the touch and drag gesture allows for a node to be moved around. When a moved node passes another node, they swap positions in the display. Unlike the Link-node area, however, nodes in the Tree Display are not free to be moved wherever. While moving around, the nodes will maintain a constant distance from the center of the display, as it moving around a ring located in the center. This restriction allows for previously scaled nodes to maintain their scaled level and ensure that nodes maintain their own unique display area in relation to the entire displayed tree hierarchy.
3.4.3 Multi Touch and Drag
The actual gesture of multi touch and drag is almost exactly the same as the single touch and drag. The difference is that multiple instances are occurring at the same
27

time. This type of event is relatively new and not possible on most older touch displays such as pen tablets.
This gesture can be performed in multiple ways. The most expected method of operation is by using two fingers to touch and drag two points simultaneously. This again, can be performed using either two fingers from one hand, or one finger from each hand. Two fingers from a single hand can provide for greater control over rotation and movement, while one finger from each hand can provide for greater accuracy [17].
When this gesture is performed on the Node-link display area, two things can happen. If the touches are moved towards each other or away from each other, the Node-link display will be scaled larger or smaller. Effectively, this gesture acts as an unrestricted zoom in or out on the Node-link display. The other event that can occur is when one touch moves in a direction that is neither closer nor farther from the other. The touch moves in a rotational direction around the first touch. This causes the entire Node-link display area to be moved rotationally around the non-moving touch.
Two touches can also be made on separate child nodes within the Tree Display. Instead of rotating or scaling the entire display as is done with the Node-link display area, this gesture will cause the nodes on the inside of the drag to scale smaller, while nodes on the outside of the drag to scale larger, as described in section 3.2.
3.4.4 Double Tap
The Double Tap gesture is fairly straightforward. The standard Tap gesture is performed twice in sequence within approximately one second of each other, on the same object in the display area.
On the Link-node display, this gesture will result in the Link-node display automatically adjusting its size between one of two states. Either the Link-node display will be scaled to fit entirely within its original slim area alongside the left border of the touch screen display, or it will be positioned at its user defined state elsewhere in the screen.
28

When a Double Tap is performed on the Tree Display, it is an indication of desire for a change of focus. If the double tap occurs on a nodeʼs display area consisting of the node or any of its children in the hierarchy, then the double tap is treated as a request for increased focus on that node. As a result, the Tree Display is redrawn with the tapped node treated as the root of the hierarchy on display. This gesture can only be performed on child nodes that are not leaf nodes. This does not actually change the root of the hierarchy, only what is displayed in the Tree Display. If a double tap occurs in the center of the display, away from any specific child node, it is treated as a desire for the display return up one level in the hierarchy. The display will be redrawn, with the parent node of the currently displayed node being drawn. If the Tree Display is currently displaying the root node of the hierarchy, then this gesture results in no action taken when not performed on a non-leaf child node.
29

4 ConclusionsThis report has examined the effectiveness of multiple types of tree-structured information visualization. We looked at indented lists, node-link diagrams, and treemaps and how well they portray local context. We also examined upcoming multi touch technology that will soon make multi touch surfaces commonplace with their low cost of production.
This project presents a software application, MTVis, that visualizes tree-structured data in multiple ways such that it can be interacted with via a touch screen display. We describe the gestures used to interact with MTVis, and how these gestures can provide us with a unique twist on interaction with visualization software by providing a method of scaling portions of the tree data to increase their focus in the visualization. At the same time, unlike other visualization techniques, the data context is not lost or obstructed.
As multi touch surfaces increase in popularity, we will find ourselves with more ways to interact with data presented to us. With increased interaction, we will inevitably find better ways to give us insight about the data presented to us.
30

References
1. Albinsson, P. and Zhai, S. 2003. High precision touch screen interaction. In Proceedings of the SIGCHI Conference on Human Factors in Computing Systems (Ft. Lauderdale, Florida, USA, April 05 - 10, 2003). CHI '03. ACM, New York, NY, 105-112. DOI= http://doi.acm.org/10.1145/642611.642631
2. Andrews, K.; Putz, W.; Nussbaumer, A., "The Hierarchical Visualisation System (HVS)," Information Visualization, 2007. IV '07. 11th International Conference , vol., no., pp.257-262, 4-6 July 2007 URL: http://ieeexplore.ieee.org/stamp/stamp.jsp?arnumber=4271992&isnumber=4271944
3. Apple iPhone, http://www.apple.com/iphone/
4. Benko, H., Wilson, A. D., and Baudisch, P. 2006. Precise selection techniques for multi-touch screens. In Proceedings of the SIGCHI Conference on Human Factors in Computing Systems (Montréal, Québec, Canada, April 22 - 27, 2006). R. Grinter, T. Rodden, P. Aoki, E. Cutrell, R. Jeffries, and G. Olson, Eds. CHI '06. ACM, New York, NY, 1263-1272. DOI= http://doi.acm.org/10.1145/1124772.1124963
5. Bila, Vasco; Dinis, Jose Maria, “XBOX 360 Live Vision Infrared Conversion” retrieved from http://nuigroup.com/?ACT=28&fid=34&aid=996_w7JVDSgzU4YiM6B3TaSf on September, 2008
6. Blanch, R. and Lecolinet, E. 2007. Browsing Zoomable Treemaps: Structure-Aware Multi-Scale Navigation Techniques. IEEE Transactions on Visualization and Computer Graphics 13, 6 (Nov. 2007), 1248-1253. DOI= http://dx.doi.org/10.1109/TVCG.2007.70540
7. De Chiara, R.; Erra, U.; Scarano, V., "VENNFS: a Venn-diagram file manager," Information Visualization, 2003. IV 2003. Proceedings. Seventh International Conference on , vol., no., pp. 120-125, 16-18 July 2003 URL: http://ieeexplore.ieee.org/stamp/stamp.jsp?arnumber=1217967&isnumber=27378
8. Echtler, F., Huber, M., and Klinker, G. 2008. Shadow tracking on multi-touch tables. In Proceedings of the Working Conference on Advanced Visual interfaces (Napoli, Italy, May 28 - 30, 2008). AVI '08. ACM, New York, NY, 388-391. DOI= http://doi.acm.org/10.1145/1385569.1385640
9. Han, J. Y. 2005. Low-cost multi-touch sensing through frustrated total internal reflection. In Proceedings of the 18th Annual ACM Symposium on User interface Software and Technology (Seattle, WA, USA, October 23 - 26, 2005). UIST '05. ACM, New York, NY, 115-118. DOI= http://doi.acm.org/10.1145/1095034.1095054
31
10.Hillis, W. D. 1982. A High Resolution Imaging Touch Sensor. International Journal of Robotics Research, 1982, 1, 2, 33-44.
11.Hongzhi Song; Curran, E.P.; Sterritt, R., "FlexTree: visualising large quantities of hierarchical information," Systems, Man and Cybernetics, 2002 IEEE International Conference on , vol.7, no., pp. 6 pp. vol.7-, 6-9 Oct. 2002
12.Hsieh, H. and Shipman, F. M. 2002. Manipulating structured information in a visual workspace. In Proceedings of the 15th Annual ACM Symposium on User interface Software and Technology (Paris, France, October 27 - 30, 2002). UIST '02. ACM, New York, NY, 217-226. DOI= http://doi.acm.org/10.1145/571985.572018
13.Johnson, B. and Shneiderman, B. 1991. Tree-Maps: a space-filling approach to the visualization of hierarchical information structures. In Proceedings of the 2nd Conference on Visualization '91 (San Diego, California, October 22 - 25, 1991). G. M. Nielson and L. Rosenblum, Eds. IEEE Visualization. IEEE Computer Society Press, Los Alamitos, CA, 284-291.
14.Kaltenbrunner, M., Bovermann, T., Bencina, R., Costanza, E.: "TUIO - A Protocol for Table Based Tangible User Interfaces". Proceedings of the 6th International Workshop on Gesture in Human-Computer Interaction and Simulation (GW 2005), Vannes, France, 2005
15.Micire, M., Drury, J. L., Keyes, B., and Yanco, H. A. 2009. Multi-touch interaction for robot control. In Proceedings of the 13th international Conference on intelligent User interfaces (Sanibel Island, Florida, USA, February 08 - 11, 2009). IUI '09. ACM, New York, NY, 425-428. DOI= http://doi.acm.org/10.1145/1502650.1502712
16.Microsoft Surface, http://www.microsoft.com/surface/
17.Moscovich, T. and Hughes, J. F. 2008. Indirect mappings of multi-touch input using one and two hands. In Proceeding of the Twenty-Sixth Annual SIGCHI Conference on Human Factors in Computing Systems (Florence, Italy, April 05 - 10, 2008). CHI '08. ACM, New York, NY, 1275-1284. DOI= http://doi.acm.org/10.1145/1357054.1357254
18.NUI Group, http://www.nuigroup.com/
19.OpenCVLibrary, http://sourceforge.net/projects/opencvlibrary/
20.Shneiderman, B. 2008. Extreme visualization: squeezing a billion records into a million pixels. In Proceedings of the 2008 ACM SIGMOD international Conference on Management of Data (Vancouver, Canada, June 09 - 12, 2008). SIGMOD '08. ACM, New York, NY, 3-12. DOI= http://doi.acm.org/10.1145/1376616.1376618
32

21.Tanaka, Y., Okada, Y., and Niijima, K. 2003. Treecube: Visualization Tool for Browsing 3D Multimedia Data. In Proceedings of the Seventh international Conference on information Visualization (July 16 - 18, 2003). IV. IEEE Computer Society, Washington, DC, 427.
22.Teoh, S. T. and Ma, K. 2002. RINGS: A Technique for Visualizing Large Hierarchies. In Revised Papers From the 10th international Symposium on Graph Drawing (August 26 - 28, 2002). S. G. Kobourov and M. T. Goodrich, Eds. Lecture Notes In Computer Science, vol. 2528. Springer-Verlag, London, 268-275.
23.Touché, http://gkaindl.com/software/touche/
24.Touchlib, http://www.nuigroup.com/touchlib/
25.Wang, W., Wang, H., Dai, G., and Wang, H. 2006. Visualization of large hierarchical data by circle packing. In Proceedings of the SIGCHI Conference on Human Factors in Computing Systems (Montréal, Québec, Canada, April 22 - 27, 2006). R. Grinter, T. Rodden, P. Aoki, E. Cutrell, R. Jeffries, and G. Olson, Eds. CHI '06. ACM, New York, NY, 517-520. DOI= http://doi.acm.org/10.1145/1124772.1124851
33

Appendix A: Additional Images from MTVis
Figure A-1: Link-node display moved to the other side of the touch surface
i

Figure A-2: Both the Names overlay and the Permissions coloring enabled
ii

Figure A-3: A larger data set. The link-node view becomes difficult to digest entirely, a drawback of this type of visualization.
iii

Figure A-4: Resizing nodes on a larger data set.
iv