visualization tools for agent-based modeling in...
TRANSCRIPT

1
VISUALIZATION TOOLS FOR AGENT-BASED MODELING IN NETLOGO
D. KORNHAUSER,* Northwestern University, IL
W. RAND, Northwestern University, IL U. WILENSKY, Northwestern University, IL
ABSTRACT
In the field of agent-based modeling (ABM), visualizations play a key role in conveying, identifying and understanding the relevant behaviors of a model. However, few toolkits provide modelers graphic tools and visual cues for the design of efficient and communicative visualizations. In this paper, we review some technologies in the NetLogo ABM toolkit that improves its design of model visualizations. First, we present the rational for a change in its default colors space. Then, we describe an extension with new graphical primitives and dialogs to improve and expand color handling in NetLogo. After that, we show two feature prototypes, texture and transparency. Finally, we will discuss graphical cues to facilitate visualization tasks to perceive micro behaviors and macro behaviors. These new tools assist the user in the creation of more understandable and compelling visualizations.
Keywords: agent based modeling, visualization, color, visual cues
INTRODUCTION In this paper we describe some of the design choices and tools for the NetLogo Agent-
Based Modeling (ABM) environment (Wilensky 1999). This work contributes to an ongoing discussion on improving the visualization primitives and tools of ABM toolkits to satisfy the requirements of diverse audiences.
Agent Based Modeling toolkits exhibit a wide diversity of visualization styles (see table 1). These different graphical styles aim to fulfill the requirements of the toolkit's audience. When model developers use environments targeted toward the research community they tend to create visualizations with a basic unencumbered look (Repast, Swarm, Mason). On the contrary, toolkits geared toward the educational community display a more figurative engaging look (AgentSheets, StarLogo TNG), and environments created for business and professional organizations aim for a clean cut and impressive presentation (AnyLogic). Not all the modeling environments fill a single niche. For example, some aim to serve diverse groups like research and art audiences (Breve), while other environments try to balance the needs of research and education communities by providing visuals which are both simple and appealing (NetLogo and StarLogo).

2
TABLE 1 Some Agent Based Modeling Toolkits
AgentSheets Anylogic Breve
Mason NetLogo StarLogo
StarLogo TNG Swarm Repast
In addition, the technologies behind the visualization of ABM software are diverse. Some
use 2D graphics while others use 3D graphics. Several toolkits render the agents using vector-based graphics while others only use bitmap graphics and a few use both. Some toolkits provide high level graphics primitives such as AgentSheets, Anylogic, NetLogo, StarLogo, and StarLogo TNG. While others facilitate the access to low level graphical libraries such as Breve, Mason, Repast, Swarm.
Moreover, these different ABM toolkits each have their own "look and feel.". AgentSheets, contains mostly figurative graphics similar to classic 2D videogames. Anylogic, designs tend to have a polished business appearance. Mason, Repast and Swarm have a computationally efficient approach to graphics that results in a stark, clean design. StarLogo TNG, provides a 3D storytelling immersive simulation environment. StarLogo and NetLogo have an iconic style where agents are depicted by solid color icons.
In this paper we will describe some of the technologies supporting NetLogo's visualization style. NetLogo was originally intended for an educational audience, but it has steadily been adopted by the research community. This community demands a more versatile and
3
polished style. In response to this new demand, NetLogo has changed to accommodate both audiences. As a result of this, the technologies we will describe in this paper have adopted developments made in the cartographic and scientific visualization communities to improve the visuals of NetLogo. In this paper we describe several tools that have recently been included in NetLogo to this end.
We started by improving color since it is one of the most salient visual variables, and the old neon saturated colors of NetLogo made it difficult to observe the behavior of some models. Then, we added the multi-hue perceptually ordered color schemes of ColorBrewer in order to provide the user an effective and attractive value to color mapping mechanism. Then we developed several prototypes for using texture and transparency, which are promising in spite of their considerable CPU consumption. Finally, we have included some graphical cue methods such as halo and blurring to reduce the cognitive load of tasks such as target tracking and region tracking. In the rest of this paper, we will discuss each of these improvements in turn.
Creating graphical tools to facilitate the design of the visualization complements NetLogo's (Tisue, 2004) prototyping development cycle for building exploratory models. While these tools aim to satisfy the breath of the diversity of models created in NetLogo, they remain simple to use and address specific concerns in the perception and comprehension of ABM visualizations.
ENHANCEMENT
In this section we will present two main improvements to the handling of color in NetLogo. First, NetLogo base colors were substituted with perceptually tested ColorBrewer colors. Second, we provided an extension to map NetLogo variables to ColorBrewer color schemes. NetLogo color space
The selection of effective colors for ABM visualization can be unexpectedly challenging. It is not straightforward to choose an aesthetic color using a number or a standard color chooser dialog. Many examples of productivity software address this problem by suggesting an assortment of "standard" colors to the user. The adequate choice of a color set can also be assisted with the ColorBrewer schemes (Harrower 2003) (Brewer 2003). ColorBrewer schemes are perceptually tested colors schemes that are recommended for use depending on the nature of the data (sequential, divergent, and qualitative), the number of data classes (3 to 11) and the desired color (Reds, Blue-Green, Diverging, Pastel, etc.). These schemes are available online at http://www.colorbrewer.org and can be downloaded as Excel files.
A model can be easily improved by choosing its base colors from the sophisticated multihued colors of ColorBrewer. Choosing sets of colors directly, using rgb values, hsb values or a conventional color chooser dialog can easily lead to garish neon saturated colors, confusing schemes, and optical illusions. These issues are well known in the cartographic community, and they have taken steps to avoid them. For instance, GIS software has, for a long time, used perceptually tested color schemes. Perceptually tested color schemes are also gaining ground in other areas. They have been recently integrated in software such as Mathematica, MatLab, and the R project.
4
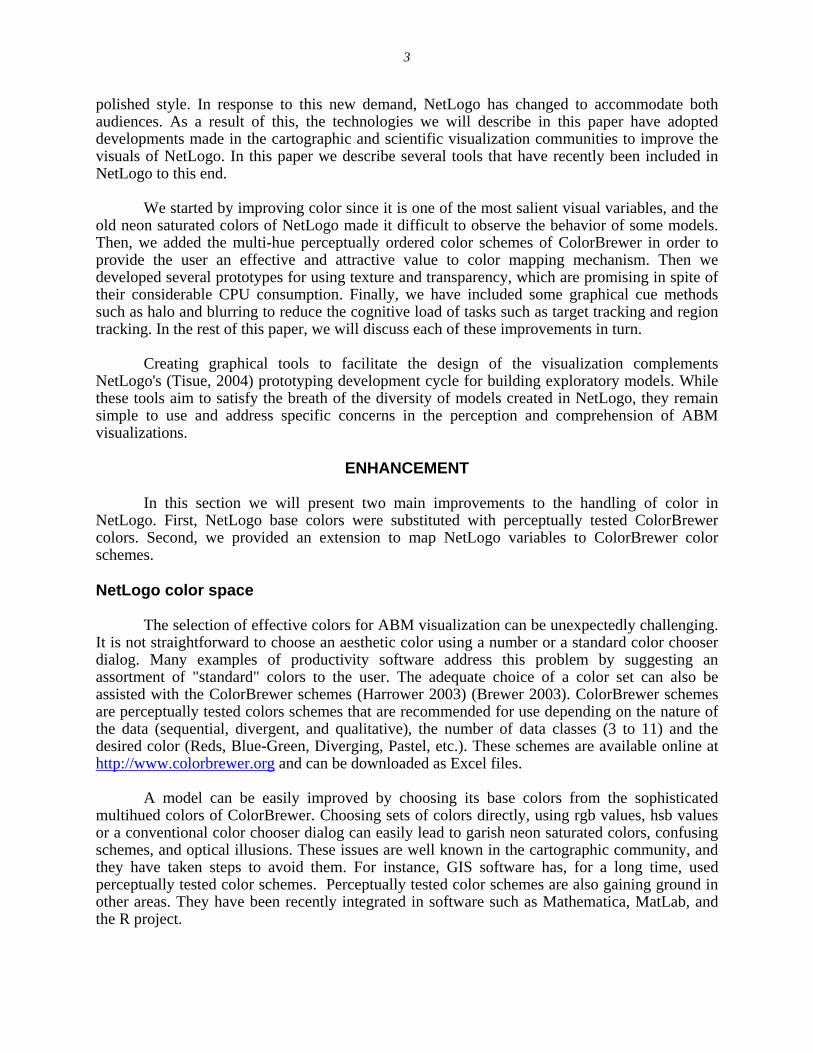
There are many historical and technological reasons why NetLogo initially represented colors with numbers ranging from 0 to 140. This original scheme can be seen in the color swatches dialog in Figure 1.
FIGURE 1 NetLogo color space swatches dialog.
NetLogo inherited the StarLogo color space conceived in the middle 1990's when the color handling in the average computer was still quite limited. Thus, the NetLogo color space has only 14 hues, and gradations can only be made within a single hue as illustrated in Figure 1.
However, the limited NetLogo color space remains practical due to its simplicity and gradual learning curve. It is addressable with a single number in the decimal system instead of the standard 3-valued rgb hexadecimal system. For example, you can set the color of a turtle with the statement:
ask turtle [set color 18]
Additionally, base colors can be called with named constants. For example:
ask turtle [set color blue] is equivalent to ask turtle [set color 105]
Base colors always end in 5 and are in the middle of the NetLogo Color Space as can be seen in Figure 2. Base colors are particularly important in NetLogo since they are used to derive the tints and shades illustrated in Figure 2. This is quite convenient to users since they can easily map a value to a color. The users can also change a color from a shade to a tint by simply increasing a decimal number. All of these qualities allow the user to designate colors and map them to values with basic arithmetic.

5
FIGURE 2 Generation of NetLogo color space However, the original NetLogo Colors had some issues, because of the programmatic
choice of base colors instead of a perceptual choice. By programmatic choice, we mean that the most of the base colors were chosen with fully saturated or desaturated component since these choices have simple representations in rgb space. For example the red base color had the following rgb values: r=255 g=0 b=0. You can observe in Figure 3 that many of the colors keep their component values either at 255 or 0.
Unfortunately, colors with fully saturated or desaturated components do not produce
"natural colors", they tend to generate neon-saturated garish colors. This in turn hinders the perception of the visualization creating several well know optical illusions (such as the Bezold Effect). In order to solve this issue we changed the NetLogo color space to use the perceptually tested multi-hued colors from ColorBrewer. Multi-hued colors are colors which contain every component: red, green, and blue. For example the new NetLogo red, derived from ColorBrewer, has the following rgb values: r=215 g=48 b=39.
FIGURE 3 Saturated Color Space. In this figure you can observe many shades and tints in the NetLogo Color space have saturated components such as r:255 or desaturated components such as g:0
Base Color Shades Tints
0 > Hue > 1
Saturation = 1 0 < Brightness < 1
Brightness = 1 0 < Saturation < 1

6
FIGURE 4 Construction of new NetLogo color space using ColorBrewer colors
It was a challenge to keep some compatibility with the old NetLogo colors while
changing to the ColorBrewer multihued colors. We did our best match the colors as closely as possible and to keep an increasing hue value from red to magenta. You can see below the ColorBrewer schemes we used as a basis for the new NetLogo Base Colors.
a b
FIGURE 5 The selection of new base colors was the first improvement achieved in NetLogo. The previous base colors (5a) were defined arbitrarily and programmatically. While the new base colors (5b) were derived from the perceptually tested ColorBrewer colors.

7
a b
c d
FIGURE 6 Examples of old color space (left) vs. new color space (right) PD Basic Evolutionary (6a 6b) Gas Chromatography Model (6c 6d )
Palette Extension
Despite the improvement of the NetLogo colors, the simplicity of the NetLogo color space can be limiting. The restricted number of hues (14) and the monochrome gradation does not fulfill every user's needs. Additionally, multi-color gradients, which are not easily created in the default color space, such as red-blue or rainbow can be useful to illustrate many standard scientific representations.
This is why we introduced the Palette extension which uses ColorBrewer color schemes and rgb colors. One of these features alone would not be enough. Generating gradations programmatically using rgb or hsb colors can lead to confusing color mappings. It is not straightforward to create a perceptually meaningful sequence of colors algorithmically. The Palette extension introduces primitives to generate color gradients, but more importantly it provides the functionality to map easily variables to ColorBrewer schemes. This functionality assists the model developer in creating meaningful color sequences.

8
scale-schemes primitive example
scale-gradient primitive example
scale-gradient
and scheme-colors example
FIGURE 7: Gradations and gradient generated with the palette extensions and a color scheme Dialogue
Moreover, ColorBrewer has clear and simple guidelines for choosing a meaningful
mapping between the values in the model and sequential, divergent and qualitative color schemes. In Figure 8, the ColorBrewer Spectral mapping and NetLogo color spaces are illustrated. The hot and cold temperatures are more easily distinguished in the center and right figures with ColorBrewer schemes than in the figure on the left with the traditional NetLogo color space. The new Palette extension makes the ColorBrewer schemes easily accessible within NetLogo.
a b c
FIGURE 8 Examples of Color mapping of the Heat Diffusion in a plate with a) NetLogo Colors b) ColorBrewer Color Schemes c) A gradient made with ColorBrewer Schemes.
ENHANCEMENTS IN PROGRESS Texture
Textons (Julez 1986) can be considered the graphical element primitives that synthesize a texture. Recently, we have been prototyping the use of textons images as agent shapes in NetLogo. We used this prototype to try to replicate Ware's (1995) magnetic forces visualizations where he uses visual texture for information display.
Figure 11 Texton from (Ware 1995)

9
In the image below the arrows on the left were replaced by textons on the right to examine if we could create meaningful ABM visualization with texture, which has proven valuable in the creation of cartographic maps (Bertin 1973)
a b
FIGURE 9 Example of Vector Field with arrows and with texture
Some of our results were satisfactory as can be seen in Figure 9. However, the replication of textures from (Ware 1995) requires much more sophisticated algorithms. For example, Ware's magnetic forces have variable texton density and color, instead of the constant density and hue portrayed above. This would require bitmap transformations that are currently too computationally expensive with the NetLogo platform and architecture. We will continue to investigate this in the future. Transparency
Transparency provides some straightforward functionality in complex visualizations (Colby 1991). One trivial use is to find agents overlapping. Additionally, transparent agents such as those in Figure 10 can highlight the concentration of agents in a given area by creating brighter clusters when they overlap. However, we found that luminous transparency was computationally too demanding in Java to satisfy NetLogo performance requirements.
FIGURE 10 Example of agents with transparency in the middle and right images.

10
Visual Cues
Agent based visualization can be inherently disorienting due to the number of agents in many models. It can be difficult for the user to keep track of a particular agent or group of agents' position, color, size, or shape. Several common visualization tasks have been discussed by Haley (1995, 1996, 2006) such as target and region tracking, boundary detection, and estimation and counting. Visual cues (Kosara 2001) can assist the viewer in focusing on a particular task so they can effortlessly perceive and swiftly evaluate relevant features of the visualization. In this section we will discuss several prototypes of visual cues that can facilitate some of these tasks. Target Tracking
One of the most challenging perceptual tasks in animated agent visualizations is to be able to follow a single agent. This can be difficult because it is easy to confuse any specific agent with other agents or the background. This can become even more difficult if the agents move large steps between each frame, which causes temporal aliasing.
The simplest way to enhance target tracking is to hide all the other agents, rendering the task cognitively trivial, but losing the surrounding context. There are many instances where it is desirable to focus on a single agent keeping its visual variables intact and at the same time perceiving the other agents. Another way to focus on a single agent amongst other agents is to change an agent’s visual variables, such as color, size, or shape to set it apart. However, this method can require the model developer to stop using a visual variable to render a value.. This is where visual cues are useful; they can focus the user on a task without directly changing any of the visual variables of the agent. Thus, we have been developing several tools to assist in target tracking and region detection with visual cues. For example, there is currently a halo available in NetLogo (using the 'watch' primitive) that highlights particular agents and we are testing a focusing / blurring tool as well.
FIGURE 11 Example of halo, blurring, and halo and blurring to illustrate micro behavior Region detection and tracking
Additionally we are experimenting with blurring and resizing multiple agents. Having a precise and crisp visualization is not always a top priority in NetLogo. Most models in NetLogo are exploratory and as a result are mainly driven by rules and not data. Thus in many cases, it can be more beneficial to generate cognitively manageable representations with a reduced amount of

11
graphical elements, than to create complex visualizations with a high information density. To this end, we have experimented in blurring the mobile graphical elements, namely the agents, to create a reasonable number of clusters. In addition, we have experimented with blurring the stationary elements, or patches, to deemphasize the square borders between the patches and emphasize the borders created by the emergent phenomena.
FIGURE 12 Flocking and Boiling Models. Examples of blurred agents to observe emergent macro behavior
CONCLUSION
In this paper we present graphical technologies that have proven useful for improving NetLogo's visualizations. First, we enhanced our visualizations by using the perceptually tested ColorBrewer colors as the basis for NetLogo's colors. Subsequently, we developed an extension to map variables to color schemes and generate gradients. Additionally, we have experimented with textures to broaden the representation of agents, such as the vector fields presented in this paper. Also, we have used transparency to selectively perceive overlapping agents. Finally, we used a few examples to illustrate how visual cues can focus the user on specific visualization tasks.
The visualization of ABMs poses many design challenges due to its open ended and complex nature. Thus, we are in the process of including in NetLogo some visualization tools to

12
facilitate the required tasks in ABM visualizations. These tools should aid the perception and comprehension of the complex behaviors displayed in dense ABM visualization. We hope that these tools and our discussion will aid other researchers and developers in the improvement of ABM toolkits. In turn, these improved toolkits should allow model builders to create communicative and memorable agent-based model visualizations. Acknowledgements: The NetLogo Development team including Seth Tissue, Esther Verreau, Craig Brozefsky, Andrei Scheinkman is responsible for development of many of the technologies treated in this paper including the Halo and the final version of the rgb colors.
REFERENCES Brewer, Cynthia A., Geoffrey W. Hatchard and Mark A. Harrower, 2003, "ColorBrewer in Print:
A Catalog of Color Schemes for Maps", Cartography and Geographic Information Science 30(1): 5-32.
Colby G., Scholl L., 1991, "Transparency and blur as selective cues for complex visual
information" In SPIE Vol. 1460, Image Handling and Reproduction Systems Integration, pages 114–125,
Harrower M A., Brewer C A., 2003, ColorBrewer.org: "An Online Tool for Selecting Color
Schemes for Maps", The Cartographic Journal 40(1): 27-37. Healey C. G., 2006, "Perception in Visualization"
http://www.csc.ncsu.edu/faculty/healey/PP/index.html (comprehensive review updated regularly).
Healey C. G., Booth K. S., and Enns, J T., 1995. "Visualizing Real-Time Multivariate Data
Using Preattentive Processing" ACM Transactions on Modeling and Computer Simulation 5, 3, 190-221.
Julesz, B., 1986. "Texton gradients: The texton theory revisited," Biological Cybernetics, vol. 54, pp. 245-251 Kosara R., Miksch S., Hauser and H., 2001. “Semantic Depth of Field,” Proc. IEEE Symp.
Information Visualization (InfoVis2001), IEEE CS Press, Los Alamitos, Calif., pp. 97- 104. Ware C, Knight W., 1995 "Using visual texture for information display" ACM Transactions on
Graphics (TOG), - portal.acm.org Tisue S., Wilensky U., 2004 NetLogo: "Design and implementation of a multi-agent modeling
environment" Proceedings of Agent 2004. Wilensky U., 1999. NetLogo. "Center for Connected Learning and Computer-Based Modeling"
http://ccl.northwestern.edu/netlogo. Northwestern University, Evanston, IL.