visualizing and quantifying evoked cortical activity ... · journal of neuroscience methods 97...
TRANSCRIPT

Journal of Neuroscience Methods 97 (2000) 157–173
Visualizing and quantifying evoked cortical activity assessed withintrinsic signal imaging
Cynthia H. Chen-Bee, Daniel B. Polley, Barbara Brett-Green, Neal Prakash,Michael C. Kwon, Ron D. Frostig *
Department of Neurobiology and Beha6ior and Center for the Neurobiology of Learning and Memory, Uni6ersity of California, Ir6ine,CA 92697-4550, USA
Received 8 October 1999; received in revised form 3 February 2000; accepted 3 February 2000
Abstract
Intrinsic signal imaging (ISI) measures changes in light reflectance from the illuminated cortex (intrinsic signals or IS) attributedto various vascular and metabolic sources that, when using illumination in the 600 nm range, appear to co-localize with neuronalactivity. Given the multiple sources contributing to the collected IS, the common practice of averaging across an extendedpost-stimulus time epoch before dividing by baseline data typically visualizes evoked IS overlying both the cortical tissue and thelarge surface blood vessels. In rat PMBSF, the contribution from these vessels are problematic as they do not co-localize withknown PMBSF function. Determining a means for quantifying the evoked IS area poses an additional challenge. Here, wedescribe how exploiting IS collected shortly after stimulus onset (within 1.5 s), which coincides with fast oxygen consumption ofactive neurons, visualizes evoked IS overlying the cortical tissue without the large surface vessels. We also describe how the useof absolute thresholds combined with a baseline determined from data collected immediately prior to stimulus onset (within 1 s)targets most precisely a specific evoked IS amplitude, a method that should be especially useful when evoked areas are expectedto occupy a substantial portion of the total imaged area and/or when peak activity is expected to differ between subjects. © 2000Elsevier Science B.V. All rights reserved.
Keywords: Optical imaging; Intrinsic signal; Rat somatosensory cortex; Barrel; Whisker; Vibrissa
www.elsevier.com/locate/jneumeth
1. Introduction
Intrinsic signal imaging (ISI) is one of several func-tional neuroimaging techniques currently available formapping neuronal activity. It measures changes in lightreflectance from the illuminated cortex attributed tochanges in blood volume, deoxyhemoglobin concentra-tion, and/or light scattering of tissue (referred to here-after as intrinsic signal or IS; see Fig. 1A–B; Grinvaldet al., 1986; Frostig et al., 1990; Narayan et al., 1994,1995). The relative contribution of the various vascular/metabolic sources to the collected IS appears dependenton the wavelength of light used to illuminate the cortex(Frostig et al., 1990; Malonek and Grinvald, 1996). Forexample, Toga and colleagues have employed ISI with
illumination in the 800 nm range to study cerebralblood volume in order to address perfusion-relatedissues (Narayan et al., 1994, 1995; Blood et al., 1995;Cannestra et al., 1996, 1998; Blood and Toga, 1998). Aswith other neuroimaging techniques, the successful ap-plication of ISI for the visualization of neuronal activ-ity is dependent on tight spatial coupling between themeasured vascular/metabolic activity and neuronal ac-tivity (for review see Villringer and Dirnagl, 1995).Some evidence support that IS presumed to be domi-nated by changes in deoxyhemoglobin concentration,via imaging illumination in the 600 nm range, co-local-izes with neuronal activity (Frostig et al., 1990; Masinoet al., 1993; Peterson and Goldreich, 1994; Das andGilbert, 1995; Malonek and Grinvald, 1996; Hodge etal., 1997; Malonek et al., 1997; Peterson et al., 1998;Sheth et al., 1998; Polley et al., 1999a; but see Narayanet al., 1994, 1995; Cannestra et al., 1998).
* Corresponding author. Tel.: +1-949-8242883; fax: +1-949-8242447.
E-mail address: [email protected] (R.D. Frostig)
0165-0270/00/$ - see front matter © 2000 Elsevier Science B.V. All rights reserved.PII: S 0 1 6 5 -0270 (00 )00180 -1

C.H. Chen-Bee et al. / Journal of Neuroscience Methods 97 (2000) 157–173158
A number of research laboratories have successfullyapplied ISI to the posterior medial barrel subfield(PMBSF) of the rat primary somatosensory cortex(Grinvald et al., 1986; Masino et al., 1993; Narayan etal., 1994; Peterson and Goldreich, 1994; Dowling et al.,1996; Hodge et al., 1997; Peterson et al., 1998; Sheth etal., 1998; Mayhew et al., 1998b; Ajima et al., 1999), a
popular animal model of cortical function (for reviewsee Kossut, 1992; Armstrong-James, 1995; Simons,1995) whose vascular anatomy provides the opportu-nity for a tight spatial coupling of vascular andmetabolic activity to neuronal activity (for review seeWoolsey et al., 1996). Evidence suggest that such acoupling exists in rat PMBSF when imaging illumina-
Fig. 1. Intrinsic signal imaging of the rat PMBSF. (A) Photograph of the total imaged area within the left PMBSF of an adult male rat as viewedthrough a thinned skull. Dark streaks correspond to large blood vessels found on the cortical surface or dura mater. Orientation and scale barapply to all panels. (B) Array of intrinsic signals (IS) evoked by stimulating whisker D1 for 1 s. Increasing IS (i.e. decreasing light reflectance)is plotted as upgoing (downward pointing scale bar=1×10⁻³), with each plot corresponding to the 4.5 s time course as averaged for theunderlying 0.46 mm×0.46 mm area. The region exhibiting an increase in IS overlying the cortical tissue is located in the lower center of the totalimaged area, with a concurrent but slower increase in IS overlying nearby large surface blood vessels (upper center). (C) Images of evoked IS in500 ms frames from same data presented in (B). Each image was generated after dividing a given post-stimulus frame (indicated at top left of eachimage; 0 s=stimulus onset) by a frame collected immediately prior to stimulus onset and applying an 8-bit, linear grayscale map to the processeddata so that increased IS greater than −1.5×10⁻⁴ is mapped to a grayscale value of black. Evoked IS overlying the cortical tissue (black patchin lower center) is present starting 0.5 s post-stimulus onset and remains elevated through 2.0 s post-stimulus onset before diminishing in strength.In contrast, evoked IS overlying large surface blood vessels (black streaks in upper center) follows a slower time course, with minimal activitypresent 1.0 s post-stimulus onset that increases and remains elevated past 2.5 s post-stimulus onset.

C.H. Chen-Bee et al. / Journal of Neuroscience Methods 97 (2000) 157–173 159
tion in the 600 nm range (Masino et al., 1993; Petersonand Goldreich, 1994; Hodge et al., 1997; Peterson et al.,1998; Sheth et al., 1998; Polley et al., 1999a; but seeNarayan et al., 1994, 1995; Cannestra et al., 1998).Unfortunately, when imaging 600 nm range illumina-tion in rat PMBSF (Fig. 1C), the time epoch containingevoked IS overlying brain parenchyma (or cortical tis-sue) typically contains evoked IS overlying large bloodvessels found on the surface of the cortex (Grinvald etal., 1986; Narayan et al., 1994, 1995; Peterson andGoldreich, 1994; Chen-Bee et al., 1996; Dowling et al.,1996; Hodge et al., 1997; Peterson et al., 1998). If theprincipal interest lies in using ISI for the visualizationof evoked neuronal activity, the separation of evokedIS overlying the cortical tissue from large surface bloodvessels is particularly relevant as capillary beds embed-ded within the cortical tissue coincide spatially withwell-known organizational features of rat PMBSF func-tion whereas the large surface blood vessels do not (forreview see Woolsey et al., 1996). Not surprisingly, giventhe multiple vascular/metabolic sources contributing tothe collected IS, the common practice of averagingacross an extended (\1 s) post-stimulus time epochbefore dividing by pre-stimulus data or control data(Peterson and Goldreich, 1994; Chen-Bee et al., 1996;Dowling et al., 1996; Hodge et al., 1997; Peterson et al.,1998) can lead to not only the desired visualization ofevoked IS overlying the cortical tissue but also theunwelcomed visualization of evoked IS overlying thelarge surface blood vessels (Fig. 2, left column). Asidefrom minimizing IS overlying these vessels, determiningthe means for quantifying the areal extent of the evokedIS overlying the cortical tissue poses an additionalchallenge.
To date, a few different approaches have been em-ployed for minimizing large surface blood vessel contri-bution and quantifying evoked IS overlying the corticaltissue. Peterson and colleagues have relied on either apost-hoc exclusion of evoked IS overlying surfacevenules located obviously in the return pathway of theevoked IS overlying the cortical tissue as evident onimages (Peterson and Goldreich, 1994) or a statisticalexclusion criterion of −1 and +2 SDs outside theaverage value of the entire imaged region (Peterson etal., 1998) while Hodge et al. (1997) have had somesuccess by increasing the degree of camera defocusingduring imaging up to 2 mm below the cortical surface(for another method in visual cortex see McLoughlinand Blasdel, 1998). Thus far, many imagers of ratPMBSF have not attempted to quantify the areal extentof evoked IS overlying the cortical tissue and haveinstead relied on either images of evoked IS (Masino etal., 1993; Narayan et al., 1994, 1995; Peterson andGoldreich, 1994; Dowling et al., 1996; Hodge et al.,1997; Mayhew et al., 1998b, 1999; Sheth et al., 1998;Ajima et al., 1999), or the sampling of evoked IS at
discrete distances from peak IS (Peterson et al., 1998;Sheth et al., 1998) to indicate the expansiveness of theevoked IS region. Although they do not use ISI for theexplicit targeting of only evoked neuronal activity,Toga and colleagues (Narayan et al., 1994, 1995; Bloodet al., 1995; Cannestra et al., 1996, 1998; Blood andToga, 1998) have employed two methods for quantify-ing the areal extent of the evoked IS region that inprinciple should be applicable to data collected by thosewho use ISI for studying neuronal activity, a thresholdexpressed as 1 SD above the average IS of the entireimaged region (Blood et al., 1995; Cannestra et al.,1996, 1998) or an absolute threshold of \1.0×10⁻³
decrease away from control trials (Blood and Toga,1998). Mayhew and colleagues (Mayhew et al., 1998b,1999) also do not use ISI for the explicit targeting ofonly evoked neuronal activity but their method ofvisualizing evoked IS with generalized linear modelsusing either a Gamma distribution or principal compo-nent analysis may also be applied to imaging datacollected for the intended purpose of targeting neuronalactivity. In our hands, we have found the need to firstapply the wavelet analysis to remove the contributionof IS overlying the large surface blood vessels, whichrequires time intensive off-line data processing andanalysis, before the application of the principal compo-nent analysis method can be successful in visualizingevoked IS overlying the cortical tissue in rat PMBSF(Carmona et al., 1995).
Previously, we have described an approach for spe-cifically targeting and quantifying evoked IS overlyingthe cortical tissue in rat PMBSF (Chen-Bee et al.,1996). As evoked IS overlying the large surface bloodvessels typically remains elevated longer than the corti-cal tissue (Fig. 1C; Grinvald et al., 1986; Narayan et al.,1994; Chen-Bee et al., 1996; Dowling et al., 1996;Mayhew et al., 1998b), we found that dividing post-stimulus data containing evoked IS overlying the corti-cal tissue (0.5 up to 2.5 s post-stimulus onset) by notonly pre-stimulus data but also by data collected \2.5s post-stimulus onset typically provides successful visu-alization of evoked IS overlying the cortical tissue withminimal contribution from large surface blood vessels(termed ‘alternative method’ of visualization; see Fig. 5in Chen-Bee et al., 1996). For areal extent quantifica-tion, we then employed a threshold level set at apercentage (e.g. 50%) of peak IS above the average ISof the entire imaged region (termed 50% peak thresholdhereafter, see Fig. 3; termed ‘normalized threshold anal-ysis’ in Chen-Bee et al., 1996). Because of prioranatomical (Killackey, 1973; Land and Simons, 1985;Riddle et al., 1992), electrophysiological (Welker, 1971;Simons, 1978), and 2-deoxyglucose (Kossut et al., 1988)studies of rat PMBSF, we assumed the area evoked bystimulation of a single whisker comprises a negligibleportion (B0.5 mm2) of our total imaged area (:35
C.H. Chen-Bee et al. / Journal of Neuroscience Methods 97 (2000) 157–173160
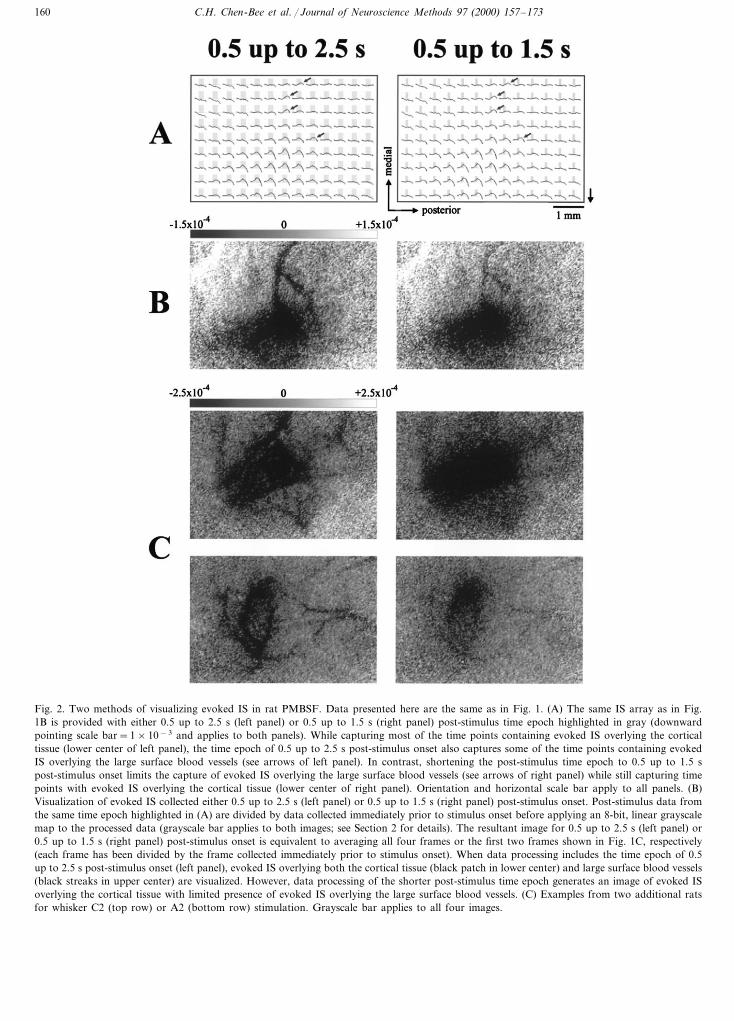
Fig. 2. Two methods of visualizing evoked IS in rat PMBSF. Data presented here are the same as in Fig. 1. (A) The same IS array as in Fig.1B is provided with either 0.5 up to 2.5 s (left panel) or 0.5 up to 1.5 s (right panel) post-stimulus time epoch highlighted in gray (downwardpointing scale bar=1×10⁻³ and applies to both panels). While capturing most of the time points containing evoked IS overlying the corticaltissue (lower center of left panel), the time epoch of 0.5 up to 2.5 s post-stimulus onset also captures some of the time points containing evokedIS overlying the large surface blood vessels (see arrows of left panel). In contrast, shortening the post-stimulus time epoch to 0.5 up to 1.5 spost-stimulus onset limits the capture of evoked IS overlying the large surface blood vessels (see arrows of right panel) while still capturing timepoints with evoked IS overlying the cortical tissue (lower center of right panel). Orientation and horizontal scale bar apply to all panels. (B)Visualization of evoked IS collected either 0.5 up to 2.5 s (left panel) or 0.5 up to 1.5 s (right panel) post-stimulus onset. Post-stimulus data fromthe same time epoch highlighted in (A) are divided by data collected immediately prior to stimulus onset before applying an 8-bit, linear grayscalemap to the processed data (grayscale bar applies to both images; see Section 2 for details). The resultant image for 0.5 up to 2.5 s (left panel) or0.5 up to 1.5 s (right panel) post-stimulus onset is equivalent to averaging all four frames or the first two frames shown in Fig. 1C, respectively(each frame has been divided by the frame collected immediately prior to stimulus onset). When data processing includes the time epoch of 0.5up to 2.5 s post-stimulus onset (left panel), evoked IS overlying both the cortical tissue (black patch in lower center) and large surface blood vessels(black streaks in upper center) are visualized. However, data processing of the shorter post-stimulus time epoch generates an image of evoked ISoverlying the cortical tissue with limited presence of evoked IS overlying the large surface blood vessels. (C) Examples from two additional ratsfor whisker C2 (top row) or A2 (bottom row) stimulation. Grayscale bar applies to all four images.

C.H. Chen-Bee et al. / Journal of Neuroscience Methods 97 (2000) 157–173 161
mm2) and thus felt justified in using the average IS overthe entire imaged area as a measure of baseline activityafter stimulus onset (post-stimulus baseline). We haveused the ‘alternative method’ of visualization combinedwith the 50% peak threshold to address various ques-tions related to the functional properties of the ratPMBSF, specifically focusing on the areal extent ofevoked IS overlying the cortical tissue that is responsiveto a single whisker (Chen and Frostig, 1996; Masinoand Frostig, 1996; Prakash et al., 1996; Polley et al.,
1999b).A common theme to emerge from our studies is the
rather large area evoked by stimulation of a singlewhisker in the normal rat in the order of severalsquared millimeters, a finding that led us to re-examinethe use of the post-stimulus baseline. As illustrated inthe top panel of Fig. 4, the post-stimulus baseline is notan appropriate measure of baseline activity when theevoked area occupies a substantial portion of the totalimaged area. Another potential concern is the depen-dence of the 50% peak threshold on peak activity(bottom panel of Fig. 4). Although there is no a priorireason to believe it can differ markedly between normalsubjects, peak activity has the potential to differ signifi-cantly between control subjects and subjects receiving atreatment that is expected to affect response magnitude(e.g. peripheral sensory deprivation), which in turn maychange the magnitude of IS activity targeted by the50% peak threshold.
In the present paper, we describe our investigationinto another approach for visualizing and quantifyingevoked IS overlying the cortical tissue in rat PMBSF.We return to the common practice of dividing by onlypre-stimulus data, and by exploiting the slower IS timecourse for the large surface blood vessels (Grinvald etal., 1986; Narayan et al., 1994; Chen-Bee et al., 1996;Mayhew et al., 1998b), we have found that limitingdata processing to a shorter post-stimulus time epochof collected data (0.5 up to 1.5 s after stimulus onset)
Fig. 3.
Fig. 3. Areal extent quantification with the use of the 50% peakthreshold combined with the post-stimulus baseline. Data presentedhere are the same as in Figs. 1 and 2A–B. (A) Processing of dataprior to areal extent quantification. Data collected 0.5 up to 1.5 spost-stimulus onset are converted to ratio values relative to pre-stim-ulus data such that the processed data may be thought of as a‘mountain of activity’, with the x- and y-axes indicating corticallocation and the z-axis indicating magnitude of evoked IS as ex-pressed in the magnitude of the ratio value. The median ratio value(−0.11×10⁻⁴ for the present case) is used as the measure ofaverage baseline activity after stimulus onset (post-stimulus baseline)over the entire imaged area. Prior to plotting (more negative valuesindicate greater IS increases and are thus plotted as upgoing), theratio values are processed with a Gaussian filter (half width 5) toremove high frequency noise. This filtering is also a necessary stepprior to the determination of peak activity (i.e. most negative ratiovalue; −3.33×10⁻⁴ for the present case) and areal extent quantifi-cation. (B) Setting the 50% peak threshold when used in combinationwith the post-stimulus baseline. The peak height (−3.22×10⁻⁴ forthe present case) is calculated as the difference between the post-stim-ulus baseline (indicated by z-axis minimum) and the peak ratio value.The 50% peak threshold is then set at one-half peak height away fromthe post-stimulus baseline. Thus, the quantified area using the 50%peak threshold (area at half-height) combined with the post-stimulusbaseline corresponds to the cortical region exhibiting ratio values ofat least 50% peak threshold. (C) Visualizing the quantified area ofactivity using the 50% peak threshold combined with the post-stimu-lus baseline. An 8-bit, linear grayscale mapping function is applied tononfiltered ratio values so that the quantified area (enclosed by whiteborder) is visualized as a black patch within the total imaged area.

C.H. Chen-Bee et al. / Journal of Neuroscience Methods 97 (2000) 157–173162
Fig. 4. Theoretical data are presented to illustrate two potential concerns regarding the use of the post-stimulus baseline combined with the 50%peak threshold. The appropriate use of the post-stimulus baseline is dependent on the assumption that the evoked area comprises a small portionof the total imaged area. As illustrated in the left graph of top panel, when this assumption is met the average activity for the entire imaged area(as measured by the median) estimates the baseline activity after stimulus onset (−1×10⁻⁴; arrow) in presumably non-evoked, neighboringregions. However, when the evoked area occupies a substantial portion of the total imaged area (right graph of top panel), the post-stimulusbaseline is elevated because the median now incorporates activity from the evoked area (−2×10⁻⁴; arrow). The higher baseline will thereforeinadvertently raise the threshold level, thus resulting in an underestimation of the evoked area. Another concern is the dependence of the 50% peakthreshold on peak activity (peak height). For example, in a project studying the effects of a manipulation which is expected to decrease peak ISamplitude, the smaller peak heights for the experimental subjects (right graph of bottom panel) can prompt the 50% peak threshold to target aweaker level of activity as compared to control subjects (left graph of bottom panel). Note that a reciprocal scenario can also occur where a largerpeak height can prompt the 50% peak threshold to target a stronger level of activity.
increases the success rate in minimizing the contribu-tion from large surface blood vessels without the needfor dividing by post-stimulus data. In addition, we haveinvestigated the use of baseline activity as calculatedfrom only pre-stimulus data (pre-stimulus baseline) andan areal extent quantification method that sets itsthreshold levels at absolute increments away from base-line activity, which is similar to the quantificationmethod employed by Blood and Toga (1998). However,we consider only data collected immediately prior (B1s) to stimulus onset for assessing baseline activity in-stead of data from control trials to avoid potentialcumulative but differing influence of spontaneous fluc-tuations on stimulation versus control trials (our inter-trial interval is 15 s) as we (Chen-Bee et al., 1996) and
others (Mayhew et al., 1999) have previously observedthat within a time epoch of :10–15 s these sponta-neous fluctuations occur in magnitude by as much as anorder of degree greater than that for evoked IS. Wefound the use of absolute thresholds combined with thepre-stimulus baseline is most precise in targeting aspecific magnitude of evoked IS as compared to the useof the 50% peak threshold with the post-stimulus base-line or other combinations (absolute thresholds with thepost-stimulus baseline; 50% peak threshold with pre-stimulus baseline). The ability to limit the contributionof evoked IS overlying large surface blood vessels with-out the need to divide by post-stimulus data shouldprove especially useful when manipulations are ex-pected to influence the later phases of evoked IS (\2.5

C.H. Chen-Bee et al. / Journal of Neuroscience Methods 97 (2000) 157–173 163
s post-stimulus onset). Also, the areal extent quantifica-tion that employs an absolute threshold combined withthe pre-stimulus baseline should prove useful whenpeak activity is expected to differ between data setsand/or the evoked IS area is expected to comprise asubstantial portion of the total imaged area.
2. Materials and general methods
2.1. Subjects, surgical preparation, whisker stimulationand data collection
Some of the details have been described elsewhere(Ts’o et al., 1990; Masino et al., 1993). A brief sum-mary as well as additional details are provided. Datawere pooled from previous and current studies (Chenand Frostig, 1996; Brett et al., 1997; Polley et al.,1999b) which investigated IS evoked by stimulation of asingle whisker in rat PMBSF. The data were specificallychosen to include a variety of whiskers so that thefindings of the present study may be generalized to theimaging of any whisker. Furthermore, they shared thefollowing technical features. Each subject was anes-thetized with an initial injection of sodium pentobarbi-tal (Nembutal; 50 mg/kg) followed by supplements tomaintain a constant level of anesthesia as assessed byrespiration rate, heart rate, body temperature, cornealreflex and color of the extremities. The skull overlyingthe left somatosensory cortex was thinned to permitimaging that is noninvasive to the cortical tissue. Aslow-scan CCD camera (Photometrics, Tucson, AZ),equipped with an inverted 50-mm AF Nikon lens(Nikon 1:1.8) combined with an extender (Nikon, PK-13), was positioned over the thinned skull area anddefocused 300–500 mm below the cortical surface. Theimaged area spanned a 6.8 mm×5.1 mm cortical re-gion and was represented in a 192×144 pixel array.While the cortex was illuminated with red light (630915 nm), the camera continuously collected IS in 0.5 sframes for a total of nine frames per each 4.5 s trial.During a trial, one contralateral whisker (n=4 ratseach for whisker D1, C2, A2, and E2) was deflected for1 s at 5 Hz in a rostral-caudal fashion (deflectionamplitude and duration of 1.9° and 100 ms, respec-tively). Each trial contained 1 s of pre-stimulus IS priorto stimulus onset. One complete data session was col-lected per subject and consisted of 128 trials, with anintertrial interval of 15 s.
2.2. Summary of data processing and analysis
The description of data processing and analysis issubdivided into several sections. Section 2.3 describesthe creation of an IS array for each subject, whichserved as a reference with which to compare how well
different methods were able to visualize the evoked ISoverlying the cortical tissue and how closely variousquantification methods were successful in capturing thisarea. To compare between two different methods ofvisualizing evoked IS overlying the cortical tissue, inSection 2.4 we describe how data from each subjectwere processed with two methods — dividing post-stimulus data collected 0.5 up to 2.5 s after stimulusonset by pre-stimulus data versus limiting the post-stimulus data to a shorter time epoch of 0.5 up to 1.5 safter stimulus onset. To compare between differentmeans of defining baseline activity, in Section 2.5 wedescribe how the post-stimulus and pre-stimulus baseli-nes were determined for each subject. Lastly, to com-pare between different methods of quantifying theevoked IS overlying the cortical tissue, in Section 2.6we describe how two different types of thresholds,combined with either the post-stimulus or pre-stimulusbaseline, were used for areal extent quantification.Thus, the same data from each subject was quantifiedmultiple times with all possible combinations of differ-ent thresholds with different baselines.
2.3. Displaying array of IS
In order to display an array of IS, data collectedfrom each pixel within the 6.8 mm×5.1 mm imagedarea of each rat were normalized relative to pre-stimu-lus data (0 s indicates start of stimulus onset) accordingto the formula DR/R−1.0 s, where DR=Rx−R−1.0 s,Rx=data collected during a given 0.5 s frame, andR−1.0 s= the first collected frame of pre-stimulus data.More negative values corresponded to greater IS ampli-tudes as increased IS results in decreased light reflec-tance. Then, an array of IS was created by spatiallyaveraging the signal within each 0.46 mm×0.46 mmarea (13×13 pixels) and superimposing the averagesignal over the appropriate cortical location (Fig. 1B).
2.4. Data processing: two methods for 6isualizinge6oked IS
Two visualizations of evoked IS were achieved foreach subject in the following manner (for additionaldetails see Chen-Bee et al., 1996). For the first visualiza-tion, the processing of IS data consisted of convertingpost-stimulus data collected from each pixel to a ratiovalue relative to pre-stimulus IS using the formula{[(R0.5 s+R1.0 sq+R1.5 s+R2.0 s)/4]/R−0.5 s}−1, whereR−0.5 s=pre-stimulus IS frame collected immediatelyprior to stimulus onset and [(R0.5 s+R1.0 s+R1.5 s+R2.0 s)/4]=the average IS collected during frames whichtypically contain evoked IS overlying the cortical tissueand corresponds to a time epoch of 0.5 s up to, but notincluding, 2.5 s post-stimulus onset (Fig. 2A, left panel).As changes in light reflectance were in the order of
C.H. Chen-Bee et al. / Journal of Neuroscience Methods 97 (2000) 157–173164
10−4, ratio values generated after performing only thedivision step centered around the value of 1 (e.g.0.999500, 1.000500) and thus the subtraction step in theabove formula was added to emphasize the small differ-ences between ratio values (Chen-Bee et al., 1996). Eachpixel therefore had an associated ratio value, with morenegative ratio values corresponding to larger IS col-lected during the 0.5 up to 2.5 s post-stimulus onsettime epoch. The processed data may be thought of as a‘mountain of activity’, with the x- and y-axes indicatingcortical location and the z-axis indicating magnitude ofevoked IS as expressed by the magnitude of the ratiovalue. Application of an 8-bit, linear grayscale map tothe ratio values allowed for high-spatial resolution,two-dimensional visualization of evoked IS (Fig. 2B,left panel). For the second visualization, the same datafrom each rat were processed in an identical mannerdescribed above except the post-stimulus time epochwas shortened to 0.5 up to, but not including, 1.5 safter stimulus onset (Fig. 2A–B, right panel). Determi-nation of post-stimulus baseline and quantification ofevoked activity area were performed on the processeddata used for the latter visualization method.
2.5. Determination of post-stimulus and pre-stimulusbaseline
For each rat, we obtained both its post-stimulus andpre-stimulus baselines. After processing data collected0.5 up to 1.5 s post-stimulus onset, the distribution ofratio values for all pixels was obtained for each subjectand the median ratio value was used to measure theaverage baseline activity after stimulus onset over theentire imaged area (post-stimulus baseline; Fig. 3A).The median was chosen instead of the mean to measureaverage activity as it is less sensitive to outlier valuesoriginating from random noise and/or artifacts. In or-der to determine the average level of activity prior tostimulus onset for the entire imaged area (pre-stimulusbaseline), the same data from each subject was pro-cessed by converting pre-stimulus IS of each pixel to aratio value according to the formula (R−0.5 s/R−1.0 s)−1so that the distribution of these ratio values may beobtained and its median ratio value determined (Fig.5B).
2.6. Areal extent quantification of e6oked IS
Prior to areal extent quantification, the ratio valuesgenerated from the shortened time epoch of post-stimu-lus data were processed with a Gaussian filter (halfwidth 5) to remove high frequency noise. For arealextent quantification using the 50% peak threshold, thepeak height was determined as the difference betweenthe peak ratio value and baseline, and the 50% peakthreshold was set at one-half peak height away from
baseline. For example, as illustrated in Fig. 3B, asubject with a peak ratio value of −3.33×10⁻⁴ and apost-stimulus baseline of −0.11×10⁻⁴ had a calcu-lated peak height of −3.22×10⁻⁴ and a 50% peakthreshold of −1.72×10⁻⁴ (i.e. 1.61×10⁻⁴ awayfrom −0.11×10⁻⁴). The area quantified when usingthe 50% peak threshold (area at half-height) combinedwith the post-stimulus baseline for the above example isshown in Fig. 3C as the area enclosed by a whiteborder, which corresponds to the cortical region withratio values of at least 50% peak threshold abovepost-stimulus baseline. For areal extent quantificationwith absolute thresholds, a threshold level was set at anabsolute increment away from baseline. Due to a lackof a universal (i.e. applicable across all subjects) abso-lute threshold equivalent to the 50% peak threshold, weinvestigated the following three arbitrary thresholds:1.5, 2.5, and 3.5×10⁻⁴. As illustrated in Fig. 5C, whencombined with the pre-stimulus baseline, the three ab-solute threshold levels used for areal extent quantifica-tion were set at −1.29, −2.29, and −3.39×10⁻⁴,respectively, for a subject with a pre-stimulus baselineactivity of 0.21×10⁻⁴. The areas quantified with thesethree thresholds are illustrated in Fig. 5D–F.
3. Results
Data from all 16 rats were processed for visualizationof evoked IS by either including data collected over 0.5up to 2.5 s post-stimulus onset or limiting the data to ashorter time epoch of 0.5 up to 1.5 s post-stimulusonset. A comparison of both visualization methods isprovided in Fig. 2. In all cases, evoked IS overlying thelarge surface blood vessels of varying strengths wassimultaneously present with evoked IS overlying thecortical tissue (Fig. 2, left column) when the visualiza-tion method included the longer post-stimulus timeepoch. In contrast, all were found to exhibit minimizedcontribution of evoked IS overlying the large surfaceblood vessels when using the shorter post-stimulus timeepoch, with complete or almost complete minimizationobserved in 8 cases. Furthermore, the use of the shorterpost-stimulus time epoch was sufficient to visualize thearea of evoked IS overlying the cortical tissue (Figs. 2,5 and 6). Thus, the comparison of different quantifica-tion methods described below were conducted on dataprocessed with the shorter post-stimulus time epoch.
Arrays of IS from two rats are provided in Fig. 6(middle row) to highlight a scenario where the quantifi-cation results are dependent on the type of method usedfor quantification, with Rat A exhibiting a smaller areaof evoked IS and a weaker strength of peak IS ampli-tude as compared to Rat B. When using the 50% peakthreshold combined with the post-stimulus baseline (toprow of Fig. 6), the area of evoked IS quantified for Rat

C.H. Chen-Bee et al. / Journal of Neuroscience Methods 97 (2000) 157–173 165
Fig. 5. Areal extent quantification with the use of absolute thresholds combined with the pre-stimulus baseline. (A) Array of IS evoked bystimulation of a single whisker E2 (downward pointing scale bar=1×10⁻³). Each plot corresponds to the 4.5 s time course as averaged for theunderlying 0.46 mm×0.46 mm area, with the time epoch of 0.5 up to 1.5 s post-stimulus onset highlighted in gray. Note the region of evokedIS is located in the left center of the total imaged area. (B) Determination of pre-stimulus baseline. Data collected 0.5 up to 0 s prior to stimulusonset are converted to ratio values relative to data collected 1.0 up to 0.5 s prior to stimulus onset such that the processed data may be thoughtof as a ‘mountain of activity’, with the x- and y-axes indicating cortical location and the z-axis indicating strength of pre-stimulus IS. The medianratio value (0.21×10⁻⁴ for this example) is used as a measure of the average pre-stimulus activity over the entire imaged area. Ratio values arefiltered (Gaussian half width 5) prior to plotting. (C) Setting absolute thresholds when used in combination with the pre-stimulus baseline. Datacollected 0.5 up to 1.5 s post-stimulus onset are converted to ratio values relative to pre-stimulus data such that the processed data may be thoughtof as a ‘mountain of activity’, with the x- and y-axes indicating cortical location and the z-axis indicating strength of post-stimulus IS. Ratiovalues are filtered (Gaussian half-width 5) prior to plotting. Thresholds are set at absolute increments away from the pre-stimulus baseline(0.21×10⁻⁴ as indicated by z-axis minimum). The three increments investigated in the present study are illustrated here: 1.5, 2.5, and 3.5×10⁻⁴
away from pre-stimulus baseline. (D–F) Visualizing the quantified area of evoked IS using absolute thresholds combined with the pre-stimulusbaseline. An 8-bit, linear grayscale mapping function is applied to the non-filtered ratio values so that the quantified area (enclosed by whiteborder) is visualized as a black patch within the total imaged area for each of the three absolute thresholds. Note that an area was not quantifiedwith the highest (3.5×10⁻⁴) threshold (D) as the peak ratio value for this example is −3×10⁻⁴. Orientation and horizontal scale bar in (A)also apply to (D), (E) and (F).

C.H. Chen-Bee et al. / Journal of Neuroscience Methods 97 (2000) 157–173166
A was markedly overestimated when compared to itsunderlying array of IS while the area quantified for RatB was markedly underestimated. Hence, the quantifiedareas were similar between the two rats (top row of Fig.6), which was in contradiction to the apparent differ-ence between their underlying IS arrays (middle row ofFig. 6). Presumably, the overestimation observed for
Rat A is due to its weaker strength of peak IS ampli-tude, which would prompt the 50% peak threshold totarget a weaker IS amplitude. Reciprocally, the under-estimation observed for Rat B is a result of its largerevoked IS area, which would elevate the level of post-stimulus baseline and in turn elevate the threshold level,compounded with its greater strength of peak IS ampli-
Fig. 6. The 50% peak threshold combined with the post-stimulus baseline versus absolute thresholds combined with the pre-stimulus baseline.Arrays of IS (middle row) evoked by stimulation of either whisker D1 (Rat A) or A2 (Rat B) are provided, with Rat B having a larger area ofevoked IS and a greater peak IS amplitude (indicated with an arrow) as compared to Rat A (downward pointing scale bar=1×10⁻³ and appliesto both arrays; each plot corresponds to the 4.5 s time course as averaged for the underlying 0.46 mm×0.46 mm area). When quantified withthe 50% peak threshold (top row) combined with the post-stimulus baseline, the area of evoked IS (enclosed by a white border) is markedlyoverestimated for Rat A and markedly underestimated for Rat B as compared to their corresponding IS arrays so that it would appear as thoughsimilarly sized IS areas are evoked in both rats. In contrast, when quantified with a threshold set at absolute increments away from pre-stimulusbaseline (1.5×10⁻⁴ threshold is illustrated here), the area of evoked IS quantified for both rats are more representative of their correspondingIS arrays; i.e. a smaller area is quantified for Rat A and a larger area is quantified for Rat B. The overestimation of Rat A’s evoked IS area isdue to a targeting of a low IS amplitude as a result of Rat A’s weaker peak IS amplitude while the underestimation of Rat B’s evoked activityarea is due to a targeting of a strong IS amplitude as a result of Rat B’s large activity area compounded with its stronger peak IS amplitude.Orientation and horizontal scale bar apply to all panels.
C.H. Chen-Bee et al. / Journal of Neuroscience Methods 97 (2000) 157–173 167
tude, which would prompt the 50% peak threshold totarget a stronger IS amplitude.
In contrast, the areas of evoked IS quantified whenusing the absolute thresholds combined with the pre-stimulus baseline were more representative of the un-derlying IS arrays; i.e. the evoked IS area quantified forRat A was smaller than that for Rat B (for example ofthe 1.5×10⁻⁴ threshold see bottom row of Fig. 6).Additionally, we found the use of absolute thresholdscombined with the pre-stimulus baseline best targeted aspecific strength of IS amplitude (e.g. 2.5×10⁻⁴; see
Fig. 7 for description of methodology). While on theaverage the 50% peak threshold combined with thepost-stimulus baseline targeted an IS amplitude of2.1090.24×10−4 (n=16; mean9SE), this combina-tion was inconsistent in targeting a specific IS ampli-tude (Fig. 8, Table 1) as evidenced by its large range oftargeted IS amplitudes (3.53×10⁻⁴) and large coeffi-cient of variation (0.46). We observed a modest im-provement in targeting a specific IS amplitude when the50% peak threshold was combined with the pre-stimu-lus baseline (range=2.19×10⁻⁴; n=16). A modestimprovement was also observed when the post-stimulusbaseline was combined with either the 1.5 (range=2.11×10⁻⁴; n=16) or 2.5 (range=2.21×10⁻⁴; n=9)×10−4 absolute thresholds (data for 3.5×10⁻⁴
threshold were based on n=3 and were therefore in-conclusive). In contrast, we found the 1.5, 2.5, and
Fig. 7.
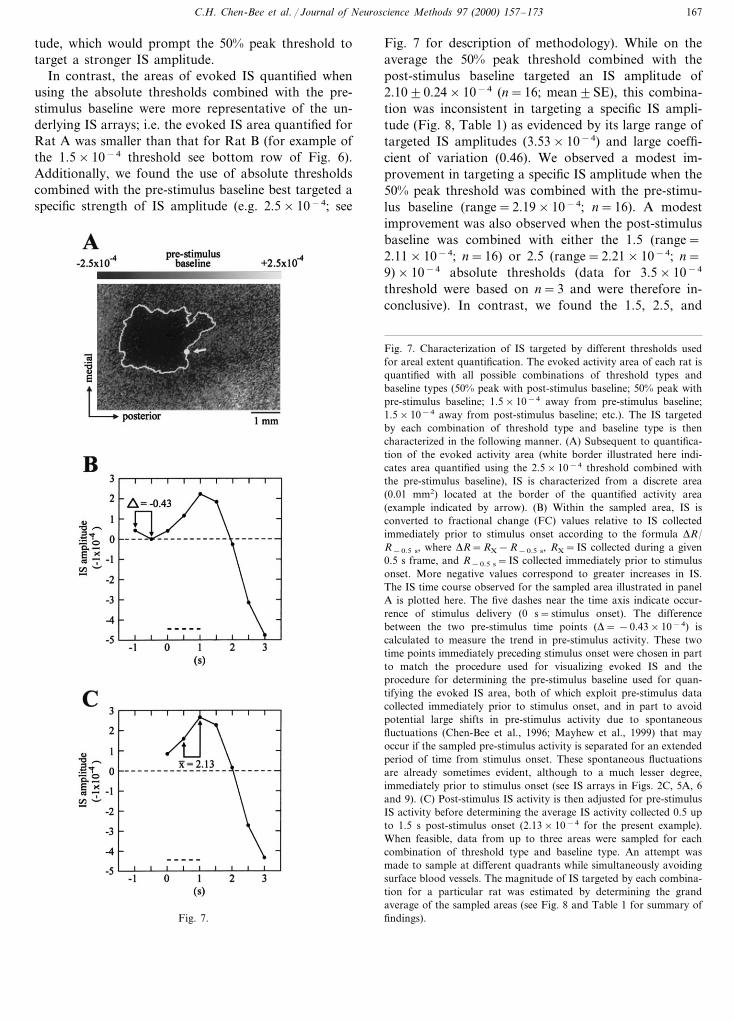
Fig. 7. Characterization of IS targeted by different thresholds usedfor areal extent quantification. The evoked activity area of each rat isquantified with all possible combinations of threshold types andbaseline types (50% peak with post-stimulus baseline; 50% peak withpre-stimulus baseline; 1.5×10⁻⁴ away from pre-stimulus baseline;1.5×10⁻⁴ away from post-stimulus baseline; etc.). The IS targetedby each combination of threshold type and baseline type is thencharacterized in the following manner. (A) Subsequent to quantifica-tion of the evoked activity area (white border illustrated here indi-cates area quantified using the 2.5×10⁻⁴ threshold combined withthe pre-stimulus baseline), IS is characterized from a discrete area(0.01 mm2) located at the border of the quantified activity area(example indicated by arrow). (B) Within the sampled area, IS isconverted to fractional change (FC) values relative to IS collectedimmediately prior to stimulus onset according to the formula DR/R−0.5 s, where DR=RX−R−0.5 s, RX=IS collected during a given0.5 s frame, and R−0.5 s=IS collected immediately prior to stimulusonset. More negative values correspond to greater increases in IS.The IS time course observed for the sampled area illustrated in panelA is plotted here. The five dashes near the time axis indicate occur-rence of stimulus delivery (0 s=stimulus onset). The differencebetween the two pre-stimulus time points (D= −0.43×10⁻⁴) iscalculated to measure the trend in pre-stimulus activity. These twotime points immediately preceding stimulus onset were chosen in partto match the procedure used for visualizing evoked IS and theprocedure for determining the pre-stimulus baseline used for quan-tifying the evoked IS area, both of which exploit pre-stimulus datacollected immediately prior to stimulus onset, and in part to avoidpotential large shifts in pre-stimulus activity due to spontaneousfluctuations (Chen-Bee et al., 1996; Mayhew et al., 1999) that mayoccur if the sampled pre-stimulus activity is separated for an extendedperiod of time from stimulus onset. These spontaneous fluctuationsare already sometimes evident, although to a much lesser degree,immediately prior to stimulus onset (see IS arrays in Figs. 2C, 5A, 6and 9). (C) Post-stimulus IS activity is then adjusted for pre-stimulusIS activity before determining the average IS activity collected 0.5 upto 1.5 s post-stimulus onset (2.13×10⁻⁴ for the present example).When feasible, data from up to three areas were sampled for eachcombination of threshold type and baseline type. An attempt wasmade to sample at different quadrants while simultaneously avoidingsurface blood vessels. The magnitude of IS targeted by each combina-tion for a particular rat was estimated by determining the grandaverage of the sampled areas (see Fig. 8 and Table 1 for summary offindings).

C.H. Chen-Bee et al. / Journal of Neuroscience Methods 97 (2000) 157–173168
Fig. 8. The use of absolute thresholds combined with the pre-stimulusbaseline is more consistent in targeting a specific IS amplitude. Theevoked IS area from each of 16 rats is quantified with all combina-tions of threshold type and baseline type; four combinations areillustrated here: 50% peak threshold combined with the post-stimulusbaseline and the three absolute thresholds (1.5, 2.5, and 3.5×10⁻⁴)combined with the pre-stimulus baseline. The IS targeted by eachcombination is characterized as described in Fig. 7. Note the largedegree of variability in the amplitude of IS targeted by the 50% peakthreshold combined with the post-stimulus baseline. In contrast, eachof the three absolute thresholds combined with the pre-stimulusbaseline targeted more consistently a specific magnitude of IS ampli-tude. See Table 1 for a more detailed summary of descriptive statis-tics.
baseline or when the post-stimulus baseline is combinedwith the absolute thresholds.
The above comparison of the different quantificationmethods was conducted on a data set pooled fromunmanipulated rats. Because there is no a priori reasonto believe that such a large degree of difference existsbetween normal subjects, it can be argued that the 50%peak threshold combined with the post-stimulus baselineis better able to capture the evoked IS area overlyingactual neuronal activation as this method yields moreconsistent evoked IS areas between subjects. However,large functional differences between the primary so-matosensory cortex of normal rats have been found(Xerri et al., 1994) and large anatomical and functionaldifferences exist specifically for rat PMBSF (Riddle andPurves, 1995; Chen and Frostig, 1996). Nevertheless, wecompared these methods using data pooled from manip-ulated rats, data expected to exhibit systematic changesin area of evoked IS and/or peak IS amplitude, and thusanalyzed a subset of data collected from a plasticityproject recently completed in our laboratory (see Polleyet al., 1999a for details). Rats from the experimentalgroup that were imaged before and after receiving 28days of unilateral plucking of all whiskers except whiskerC2 were considered. A comparison of IS arrays (Fig. 9,middle row) obtained from the same rat before and afterwhisker plucking revealed a large increase in the area ofevoked IS and peak IS amplitude in response to stimu-lation of the spared whisker C2. With the use of the 50%peak threshold combined with the post-stimulus baselinefor the areal extent quantification of evoked IS, plasticityin the IS area evoked by the spared whisker C2 wouldhave appeared minimal (Fig. 9, top row), while the useof an absolute threshold combined with the pre-stimulusbaseline (quantification method employed by Polley etal., 1999a) captured more faithfully the plasticity (Fig. 9,bottom row) as evident for the underlying IS arrays. Itappears that at least for this data set, the use of theabsolute threshold combined with a pre-stimulus baselinewas better able to quantify a biological phenomenon suchas plasticity induced by a form of sensory deprivation.
3.5×10⁻⁴ absolute thresholds combined with the pre-stimulus baseline were the most consistent in targeting aspecific strength of IS amplitude. The ranges of theirtargeted IS amplitudes (0.97, 1.01, and 0.24×10⁻⁴,respectively) were at most only a third of the rangeobserved for the 50% peak threshold combined with thepost-stimulus baseline (Fig. 8; Table 1). On average(means9SEs), these three thresholds targeted IS ampli-tudes of 1.4290.05 (n=16), 2.4490.09 (n=13), and3.4690.03 (n=7)×10−4, respectively. This improve-ment was specifically attributable to the use of absolutethresholds combined with the pre-stimulus baseline as weobserved only modest improvement in precision when the50% peak threshold is combined with the pre-stimulus
Table 1Descriptive statistics of IS amplitudes (−1×10⁻⁴) targeted by different areal extent quantification thresholds
Threshold
(Pre-stimulus baseline)(Post-stimulus baseline)
1.5×10−450% peak 2.5×10⁻⁴ 3.5×10⁻⁴
1316 716n3.32Minimum 0.77 1.02 2.013.56Maximum 4.30 1.99 3.020.241.010.97Range 3.53
Mean 3.462.10 1.42 2.440.24 0.03Standard error 0.090.05
0.020.140.150.46Coefficient of variation

C.H. Chen-Bee et al. / Journal of Neuroscience Methods 97 (2000) 157–173 169
Fig. 9. The 50% peak threshold combined with the post-stimulus baseline vs. absolute thresholds combined with the pre-stimulus baseline. Arraysof IS (middle row) evoked by stimulation of the spared whisker C2 from the same rat before and after 28 days of unilateral plucking of allwhiskers except C2 are provided. A comparison of the two arrays reveals that a large increase in area of evoked IS and peak IS amplitude inresponse to stimulation of the spared whisker C2 (indicated with an arrow) is observed after whisker plucking (downward pointing scalebar=1×10⁻³ and applies to both arrays; each plot corresponds to the 4.5 s time course as averaged for the underlying 0.46 mm×0.46 mmarea). When using the 50% peak threshold (top row) combined with the post-stimulus baseline, the quantified IS area evoked by the sparedwhisker C2 (enclosed by a white border) appears to undergo minimal changes after whisker plucking. In contrast, when using a threshold set atabsolute increments away from pre-stimulus baseline (1.5×10⁻⁴ threshold is illustrated here), the quantified IS area evoked by the spared whiskerC2 is observed to increase after whisker plucking. Orientation and horizontal scale bar apply to all panels.
4. Discussion
4.1. Visualizing e6oked IS o6erlying the cortical tissue
Given the complex set of vascular, metabolic, andneuronal events that are initiated in the cortex uponarrival of afferent input, some of which can contributeto changes in light reflectance collected from the illumi-
nated cortex, it should not be surprising that ISI usingillumination in the 600 nm range can visualize evokedIS in rat PMBSF overlying both the cortical tissue andthe large surface blood vessels (Fig. 2, left column).Thus, the use of ISI for mapping the area of evokedneuronal activity in rat PMBSF can benefit from identi-fying means by which to minimize the contribution ofevoked IS overlying the large surface blood vessels as

C.H. Chen-Bee et al. / Journal of Neuroscience Methods 97 (2000) 157–173170
only capillary beds embedded in the cortical tissue, andnot these vessels, coincide spatially with known ratPMBSF function. The findings of the present paperindicate that this minimization can be achieved byshortening the post-stimulus time epoch without theneed for dividing by post-stimulus data (Fig. 2, rightcolumn).
There is a biological basis to support an interest inexploiting IS collected only shortly after stimulus onset(i.e. the shortened time epoch of 0.5 up to 1.5 spost-stimulus onset). Previous ISI studies have arguedthat cortical activation first initiates a fast, highly local-ized increase in deoxyhemoglobin concentration, due tooxygen consumption by active neurons, followed by adecrease in deoxyhemoglobin as a result of a delayedincrease in blood flow, which appears not to localizewell with neuronal activity (Grinvald et al., 1986;Frostig et al., 1990; Malonek and Grinvald, 1996;Malonek et al., 1997). While there has been somecontroversy regarding the existence of a fast oxygenconsumption by activated neurons (Grinvald et al.,1986; Frostig et al., 1990; Malonek and Grinvald, 1996;Malonek et al., 1997; Nemoto et al., 1997; Mayhew etal., 1998a,b), recent evidence from opposing campsappear to have reached some form of agreement thatthis fast decrease in deoxyhemoglobin following sensorystimulation indeed exists (Mayhew et al., 1999; Nemotoet al., 1999; Vanzetta and Grinvald, 1999). Presumably,the evoked IS overlying the cortical tissue describedhere for rat PMBSF corresponds to this fast oxygenconsumption while the evoked IS overlying the largesurface blood vessels correspond to the slower increasein blood flow through these vessels.
While we found that shortening the time epoch to 0.5up to 1.5 s post-stimulus onset increased the successrate in minimizing the contribution from large surfaceblood vessels in rat PMBSF, this exact post-stimulustime epoch may not be ideal for all ISI studies. Forexample, evoked IS overlying the cortical tissue in ratprimary auditory cortex follows a slower time course ascompared to that of the rat PMBSF (Bakin et al., 1996;Brett-Green et al., 1998) and preliminary data suggestthat 1.0 up to 2.5 s post-stimulus time epoch may bemore appropriate for visualizing evoked IS overlyingthe cortical tissue (Brett-Green et al., 1998). The idealpost-stimulus time epoch may also be species depen-dent. Note that the elucidation of the appropriate post-stimulus time epoch depends on previous time coursecharacterization of evoked IS overlying the corticaltissue versus the large surface blood vessels. In cases inwhich it is not feasible to identify a post-stimulus timeepoch that contains evoked IS overlying the corticaltissue without evoked IS overlying the large surfaceblood vessels, the alternative method as described inChen-Bee et al. (1996) can be used, a method whichrequires the division by post-stimulus data and whose
success is dependent on the evoked IS overlying thesevessels to remain elevated longer as compared to thecortical tissue.
4.2. Quantifying e6oked IS o6erlying the cortical tissue
Previously, we have described a means of quantifyingevoked IS overlying the cortical tissue in rat PMBSFusing a combination of a post-stimulus baseline and the50% peak threshold. Since its introduction, we havecollected substantial data from a wide variety ofprojects (Chen and Frostig, 1996; Masino and Frostig,1996; Prakash et al., 1996; Polley et al., 1999b) suggest-ing that the use of a post-stimulus baseline may not beoptimal if the evoked IS area spans a substantial por-tion of the total imaged area (top panel of Fig. 4), as istypically the case for the normal rat PMBSF (see Rat Bin Fig. 6) and for the manipulated rat PMBSF aftersensory deprivation (Fig. 9; for details see Polley et al.,1999a). Another potential concern is the use of the 50%peak threshold when the strength of peak activity isexpected to differ between treatments (bottom panel ofFig. 4), as can result from a treatment such as sensorydeprivation (Fig. 9).
Thus, the use of the 50% peak threshold combinedwith the post-stimulus baseline is most appropriate insituations where evoked IS areas are relatively small(spans a negligible portion of the total imaged area)and peak IS amplitudes are similar between subjects.However, we feel confident that differences in evokedIS areas detected with this combination when used inless than ideal conditions (e.g. large evoked IS areasand/or significant differences in peak IS amplitudesbetween subjects) are still worthy of attention. The neteffect of using the 50% peak threshold combined withthe post-stimulus baseline is to decrease differencesbetween data sets by underestimating large and strongevoked IS areas while overestimating small and weakevoked IS areas (Figs. 6 and 9). Hence, differences inevoked IS areas reported with the use of this combina-tion are most likely conservative estimates (Chen andFrostig, 1996; Masino and Frostig, 1996; Prakash et al.,1996; Polley et al., 1999b). For example, an increase inevoked IS area when quantified with the 50% peakthreshold combined with the post-stimulus baselinewould exhibit an even greater increase when quantifiedwith a method that is insensitive to the size of theevoked IS area and/or differences in peak IS amplitudesbetween data sets.
The use of absolute thresholds combined with thepre-stimulus baseline may be more appealing whenthere is a strong interest in targeting a specific strengthof evoked IS amplitude. It appears that the inherentvariability in peak IS amplitudes between normal sub-jects alone is sufficient to prompt the 50% peakthreshold to be less precise in targeting a specific

C.H. Chen-Bee et al. / Journal of Neuroscience Methods 97 (2000) 157–173 171
strength of evoked IS amplitude (Figs. 6 and 8; Table1). Thus, the use of absolute thresholds can eliminatepotential problems arising from differences in peak ISamplitudes between subjects, especially when combinedwith the pre-stimulus baseline as this combinationtargets most precisely a specific strength of evoked ISamplitude (Figs. 6 and 8; Table 1) and has the addi-tional advantage of being insensitive to the portion ofthe total imaged area occupied by the evoked IS area.For example, if a large evoked IS area is expected, as inthe case for simultaneous presentation of multiple stim-uli (e.g. simultaneous stimulation of multiple whiskers)or plasticity due to sensory deprivation (Fig. 9), thenthe post-stimulus baseline would be inadvertently ele-vated (top panel of Fig. 4).
In our hands, we found that a limited range ofabsolute thresholds can be applied successfully acrossall subjects, presumably as a result of the high variabil-ity in peak IS amplitudes between animals. As illus-trated in Fig. 8, all 16 rats met the 1.5×10⁻⁴ thresholdwhile 13 and 7 rats met the 2.5 and 3.5×10⁻⁴
thresholds, respectively. One source of variability (po-tentially unavoidable because of its biological nature) isthe inherent differences between animals (Fig. 6). Ide-ally, the level of an absolute threshold could be setsufficiently above baseline to avoid noise without ex-cluding relevant evoked IS. However, a problem canarise in applying the same absolute threshold across allanimals when a high degree of variability in evoked ISamplitudes exists between animals. One can imagine asituation where an absolute threshold that is sufficientlyhigh to avoid noise in an animal with weak IS ampli-tudes is not high enough to avoid noise in an animalwith strong IS amplitudes. Conversely, a sufficientlyhigh threshold in an animal with strong IS amplitudesis too high to include any IS in an animal with weak ISamplitudes. In such a situation, we suggest a compro-mise where different absolute thresholds can be appliedbetween animals as long as the same threshold is ap-plied to the same animal. Then, percent change can becalculated for each animal, a value which can then becompared between animals. However, this compromiserequires more than one sampling from each animal,such as imaging before and after a manipulation withinthe same animal.
We would like to stress that the present study is notsuggesting the application of universal absolutethresholds (e.g. 1.5, 2.5, and 3.5×10⁻⁴) given thevaried methodologies between projects but rather thegeneral principle of applying absolute thresholds. Forexample, it appears that evoked IS in the mousePMBSF is typically :50% weaker than in the rat(Prakash and Frostig, 1997) and thus the lowestthreshold investigated here may be too high to beapplicable in mouse imaging studies. Furthermore, fu-ture research is necessary to determine not only the
success rate for applying the same absolute threshold(s)across many subjects from the same species, but alsoacross all subjects in a project that investigate multiplespecies, cortical areas, stimulus parameters, wave-lengths of light, etc. In our hands, this method has beenused successfully in the rat PMBSF to elucidate adultcortical plasticity in response to sensory deprivation(Polley et al., 1999a) and characterize the correspon-dence between anatomical and functional boundaries(Brett et al., 1997). In addition, absolute thresholdshave also been used successfully in the rat primaryauditory cortex for the study of intensity coding (un-published data).
The present study also acknowledges that furtherresearch is needed to determine whether a particularabsolute threshold has a specific biological significance.In rat PMBSF, the anatomical organization consists of‘barrels’ (Woolsey and Van der Loos, 1970) arrangedtopographically to mirror the organization of theirperipheral counterparts, with each barrel receiving tha-lamocortical afferents from a specific whisker found onthe contralateral snout (Killackey, 1973). Cells within abarrel respond stronger and more rapidly to the samewhisker (Welker, 1971, 1976; Simons, 1978; Armstrong-James and Fox, 1987), however a whisker can exciteneurons outside its associated barrel (Chapin, 1986;Armstrong-James and Fox, 1987; Carvell and Simons,1988; Armstrong-James et al., 1991, 1992; Simons et al.,1992) through intracortical connections (Armstrong-James et al., 1991; Fox, 1994; Hoeflinger et al., 1995;Kim and Ebner, 1999; but see Goldreich et al., 1999).Furthermore, an increase in 2-deoxyglucose uptake hasbeen observed outside the appropriate barrel of thestimulated whisker (Kossut et al. 1988). It would be ofinterest to see whether a specific low threshold level,which captures a larger portion of the IS area evokedby a single whisker, can correlate with the more expan-sive intracortical projections associated with the appro-priate barrel. Conversely, a specific high threshold level,which captures a smaller portion of the evoked IS areacentered around the peak IS, may correlate with thesize of the barrel appropriate to the stimulated whisker.Results from such an elucidation can help determinewhich absolute threshold may best meet the particularneeds of a given investigation.
Acknowledgements
This work was supported by National Institutes ofMental Health National Research Service AwardMH014599-23 to D.B.P., University of CaliforniaIrvine Medical Scientist Training Program to N.P. andM.C.K., National Institute of Neurological Disorderand Stroke Grant NS-34519 and NS-39760 to R.D.F.,and National Science Foundation Grant IBN 9507936to R.D.F.

C.H. Chen-Bee et al. / Journal of Neuroscience Methods 97 (2000) 157–173172
References
Ajima A, Matsuda Y, Ohki K, Kim D, Tanaka S. GABA-mediatedrepresentation of temporal information in rat barrel cortex. Neu-roreport 1999;10:1973–9.
Armstrong-James M. The nature and plasticity of sensory processingwithin adult rat barrel cortex. In: Jones E, Diamond I, editors.Cerebral Cortex, vol. 11. New York: Plenum Press, 1995:333–74.
Armstrong-James M, Callahan CA, Friedman MA. Thalamo-corticalprocessing of vibrissal information in the rat. I. Intracorticalorigins of surround but not centre-receptive fields of layer IVneurones in the rat S1 barrel field cortex. J Comp Neurol1991;303:193–210.
Armstrong-James M, Fox K. Spatiotemporal convergence and diver-gence in the rat S1 ‘barrel’ cortex. J Comp Neurol 1987;263:265–81.
Armstrong-James M, Fox K, Das-Gupta A. Flow of excitationwithin rat barrel cortex on striking a single vibrissa. J Neurophys-iol 1992;68:1345–58.
Bakin JS, Kwon MC, Masino SA, Weinberger NM, Frostig RD.Suprathreshold auditory cortex activation visualized by intrinsicsignal optical imaging. Cereb Cortex 1996;6:120–30.
Blood AJ, Narayan SM, Toga AW. Stimulus parameters influencecharacteristics of optical intrinsic signal responses in somatosen-sory cortex. J Cereb Blood Flow Metab 1995;15:1109–21.
Blood AJ, Toga AW. Optical intrinsic signal imaging responses aremodulated in rodent somatosensory cortex during simultaneouswhisker and forelimb stimulation. J Cereb Blood Flow Metab1998;18:968–77.
Brett B, Chen-Bee C, Prakash N, Frostig RD. Intrinsic signal opticalimaging of sensory evoked activity in rat parietal-temporal cortex.Soc Neurosci Abstr 1997;23:2343.
Brett-Green B, Curley J, Chen-Bee C, Frostig RD. Pure tone andsingle whisker stimulation evokes similar point-spreads of intrinsicsignals in rat parietal-temporal cortex. Soc Neurosci Abstr1998;24:1878.
Cannestra AF, Blood AJ, Black KL, Toga AW. The evolution ofoptical signals in human and rodent cortex. Neuroimage1996;3:202–8.
Cannestra AF, Pouratian N, Shomer MH, Toga AW. Refractoryperiods observed by intrinsic signal and fluorescence dye imaging.J Neurophysiol 1998;40:1522–32.
Carmona RA, Hwang WL, Frostig RD. Wavelet analysis for brain-imaging function. IEEE Trans Med Imaging 1995;14:556–64.
Carvell GE, Simons DJ. Membrane potential changes in rat Sm1cortical neurons evoked by controlled stimulation of mystacialvibrissae. Brain Res 1988;448:186–91.
Chapin JK. Laminar differences in sizes, shapes, and response profilesof cutaneous receptive fields in the rat S1 cortex. Exp Brain Res1986;62:549–59.
Chen CH, Frostig RD. Variability and interhemispheric asymmetryof single-whisker functional representations in rat barrel cortex. JNeurophysiol 1996;76:884–94.
Chen-Bee CH, Kwon MC, Masino SA, Frostig RD. Areal extentquantification of functional representations using intrinsic signaloptical imaging. J Neurosci Methods 1996;68:27–37.
Das A, Gilbert CD. Long-range horizontal connections and their rolein cortical reorganization revealed by optical recordings of catprimary visual cortex. Nature 1995;375:780–4.
Dowling JL, Henegar MM, Liu D, Rovainen CM, Woolsey TA.Rapid optical imaging of whisker response in the rat barrelcortex. J Neurosci Methods 1996;66:113–22.
Fox K. The cortical component of experience-dependent synapticplasticity in the rat barrel cortex. J Neurosci 1994;14:7665–79.
Frostig RD, Lieke EE, Ts’o DY, Grinvald A. Cortical functionalarchitecture and local coupling between neuronal activity and the
microcirculation revealed by in vivo high-resolution optical imag-ing of intrinsic signals. Proc Natl Acad Sci USA, 1990;87:6082–6.
Goldreich D, Kyriazi HT, Simons DJ. Functional independence oflayer IV barrels in rodent somatosensory cortex. J Neurophysiol1999;82:1311–6.
Grinvald A, Lieke E, Frostig RD, Gilbert CD, Wiesel TN. Func-tional architecture of cortex revealed by optical imaging of intrin-sic signals. Nature 1986;324:361–4.
Hodge CJ, Stevens RT, Newman H, Merola J, Chu C. Identificationof functioning cortex using cortical optical imaging. Neurosurgery1997;41:1137–45.
Hoeflinger BF, Bennett-Clarke CA, Chiaia NL, Killackey HP,Rhoades RW. Patterning of local intracortical projections withinthe vibrissae representation of rat primary somatosensory cortex.J Comp Neurol 1995;354:551–63.
Killackey HP. Anatomical evidence for cortical subdivisions based onvertically discrete thalamic projections from the ventral posteriornucleus to cortical barrels in the rat. Brain Res 1973;51:326–31.
Kim U, Ebner FF. Barrels and septa: separate circuits in rat barrelfield cortex. J Comp Neurol 1999;408:489–505.
Kossut M. Plasticity of the barrel cortex neurons. Prog Neurobiol1992;39:389–422.
Kossut M, Hand PJ, Greenberg J, Hand CL. Single vibrissal corticalcolumn in SI cortex of rat and its alterations in neonatal andadult vibrissa-deafferented animals: a quantitative 2DG study. JNeurophysiol 1988;60:829–52.
Land PW, Simons DJ. Cytochrome oxidase staining in the rat SmIbarrel cortex. J Comp Neurol 1985;238:225–35.
Malonek D, Dirnagl U, Lindauer U, Yamada K, Kanno I, GrinvaldA. Vascular imprints of neuronal activity: relationships betweenthe dynamics of cortical blood flow, oxygenation, and volumechanges following sensory stimulation. Proc Natl Acad Sci USA1997;94:14826–31.
Malonek D, Grinvald A. Interactions between electrical activity andcortical microcirculation revealed by imaging spectroscopy: impli-cations for functional brain mapping. Science 1996;272:551–4.
Masino SA, Kwon MC, Dory Y, Frostig RD. Characterization offunctional organization within barrel cortex using intrinsic signaloptical imaging through a thinned skull. Proc Natl Acad Sci USA1993;90:9998–10002.
Masino SA, Frostig RD. Quantitative long-term imaging of thefunctional representation of a whisker in rat barrel cortex. ProcNatl Acad Sci USA 1996;93:4942–7.
Mayhew J, Hu D, Zheng Y, et al. An evaluation of linear modelanalysis techniques for processing images of microcirculationactivity. Neuroimage 1998a;7:49–71.
Mayhew J, Zhao L, Hou Y, et al. Spectroscopic investigation ofreflectance changes in the barrel cortex following whisker stimula-tion. Adv Exp Med Biol 1998b;454:139–48.
Mayhew J, Zheng Y, Hou Y, et al. Spectroscopic analysis of changesin remitted illumination: the response to increased neural activityin brain. Neuroimage 1999;10:304–26.
McLoughlin NP, Blasdel GG. Wavelength-dependent differences be-tween optically determined functional maps from macaque striatecortex. Neuroimage 1998;7:326–36.
Narayan SM, Esfahani P, Blood AJ, Sikkens L, Toga AW. Func-tional increases in cerebral blood volume over somatosensorycortex. J Cereb Blood Flow Metab 1995;15:754–65.
Narayan SM, Santori EM, Toga AW. Mapping functional activity inrodent cortex using optical intrinsic signals. Cereb Cortex1994;4:195–204.
Nemoto M, Nomura Y, Tamura M, Sato C, Houkin K, Abe H.Optical imaging and measuring of local hemoglobin concentrationand oxygenation changes during somatosensory stimulation in ratcerebral cortex. Adv Exp Med Biol 1997;428:521–31.
Nemoto M, Nomura Y, Sato C, et al. Analysis of optical signalsevoked by peripheral nerve stimulation in rat somatosensory

C.H. Chen-Bee et al. / Journal of Neuroscience Methods 97 (2000) 157–173 173
cortex: dynamic changes in hemoglobin concentration and oxy-genation. J Cereb Blood Flow Metab 1999;19:246–59.
Peterson BE, Goldreich D. A new approach to optical imagingapplied to rat barrel cortex. J Neurosci Methods 1994;54:39–47.
Peterson BE, Goldreich D, Merzenich MM. Optical imaging andelectrophysiology of rat barrel cortex. I. Responses to smallsingle-vibrissa deflections. Cereb Cortex 1998;8:173–83.
Polley DB, Chen-Bee CH, Frostig RD. Two directions of plasticity inthe sensory-deprived adult cortex. Neuron 1999a;24:623–37.
Polley DB, Chen-Bee CH, Frostig RD. Varying the degree of single-whisker stimulation differentially affects phases of intrinsic signalsin rat barrel cortex. J Neurophysiol 1999b;81:692–701.
Prakash N, Frostig RD. Characterization of the functional organiza-tion in mouse barrel cortex using intrinsic signal optical imagingthrough intact skull. Soc Neurosci Abstr 1997;23:2343.
Prakash N, Cohen-Cory S, Frostig RD. Rapid and opposite effects ofBDNF and NGF on the functional organization of the adultcortex in vivo. Nature 1996;381:702–6.
Riddle D, Richards A, Zsuppan F, Purves D. Growth of the ratsomatic sensory cortex and its constituent parts during postnataldevelopment. J Neurosci 1992;12:3509–24.
Riddle DR, Purves D. Individual variation and lateral asymmetry ofthe rat primary somatosensory cortex. J Neurosci 1995;15:4184–95.
Sheth BR, Moore CI, Sur M. Temporal modulation of spatialborders in rat barrel cortex. J Neurophysiol 1998;79:464–70.
Simons DJ. Neuronal integration in the somatosensory whisker/bar-rel cortex. In: Jones E, Diamond I, editors. Cerebral Cortex, vol.11. New York: Plenum Press, 1995:263–98.
Simons DJ. Response properties of vibrissa units in rat SI somatosen-sory neocortex. J Neurophysiol 1978;41:798–820.
Simons DJ, Carvell GE, Hershey AE, Bryant DP. Responses ofbarrel cortex neurons in awake rats and effects of urethaneanesthesia. Exp Brain Res 1992;91:259–72.
Ts’o DY, Frostig RD, Lieke EE, Grinvald A. Functional organiza-tion of primate visual cortex revealed by high resolution opticalimaging. Science 1990;249:417–20.
Vanzetta I, Grinvald A. Increased cortical oxidative metabolism dueto sensory stimulation: Implications for functional brain imaging.Science 1999;286:1555–8.
Villringer A, Dirnagl U. Coupling of brain activity and cerebralblood flow: basis of functional neuroimaging. Cerebrovasc BrainMetab Rev 1995;7:240–76.
Welker C. Microelectrode delineation of fine grain somatotopic orga-nization of SmI cerebral neocortex in albino rat. Brain Res1971;26:259–75.
Welker C. Receptive fields of barrels in the somatosensory neocortexof the rat. J Comp Neurol 1976;166:173–90.
Woolsey TA, Rovainen CM, Cox SB, et al. Neuronal units linked tomicrovascular modules in cerebral cortex: Response elements forimaging the brain. Cereb Cortex 1996;6:647–60.
Woolsey TA, Van der Loos H. The structural organization of layerIV in the somatosensory region (SI) of mouse cerebral cortex: thedescription of a cortical field composed of discrete cytoarchitec-tonic units. Brain Res 1970;17:205–42.
Xerri C, Stern JM, Merzenich MM. Alterations of the corticalrepresentation of the rat ventrum induced by nursing behavior. JNeurosci 1994;14:1710–21.
.