visualizing blood flow through the heart
TRANSCRIPT

Scott KulpRutgers UniversityCenter for Biomedical Imaging and Modeling (CBIM)April 8, 2011

Many cardiovascular conditions, such as a heart attack or arrhythmia, will cause abnormal motion of the heart walls.
This change of heart wall movement would affect the blood flow pattern within the heart, potentially increasing the risk of blood clot and stroke.
Current imaging techniques (MRI, ultrasound) can be used to retrieve flow information, but the spatial resolution is low.
Our goal is to simulate the blood flow through a patient’s heart using models that have been retrieved through high‐resolution imaging.
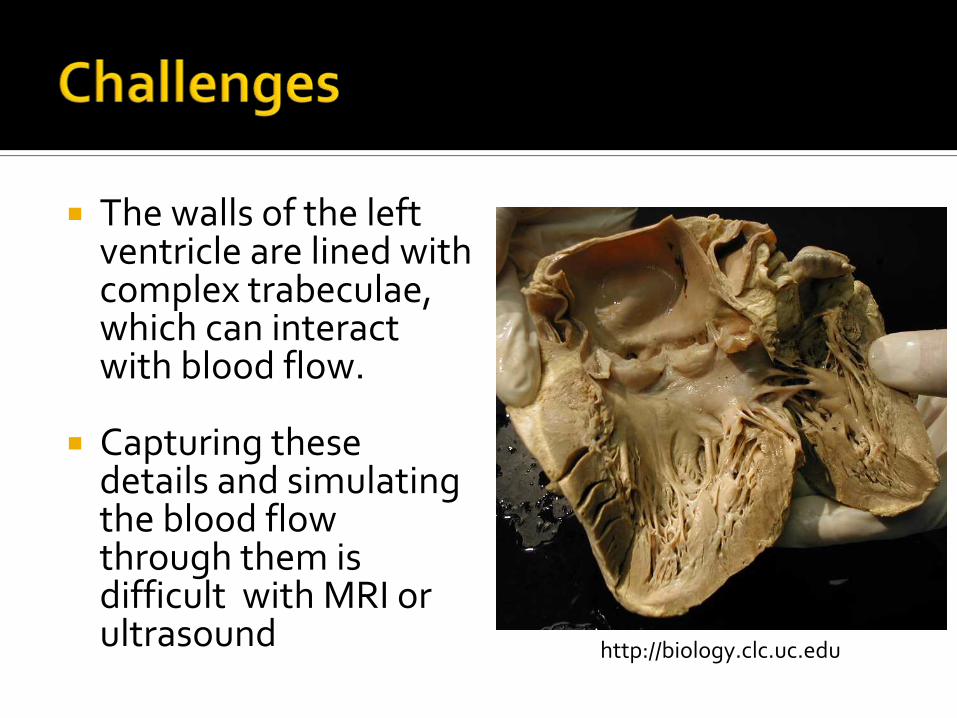
The walls of the left ventricle are lined with complex trabeculae, which can interact with blood flow.
Capturing these details and simulating the blood flow through them is difficult with MRI or ultrasound http://biology.clc.uc.edu
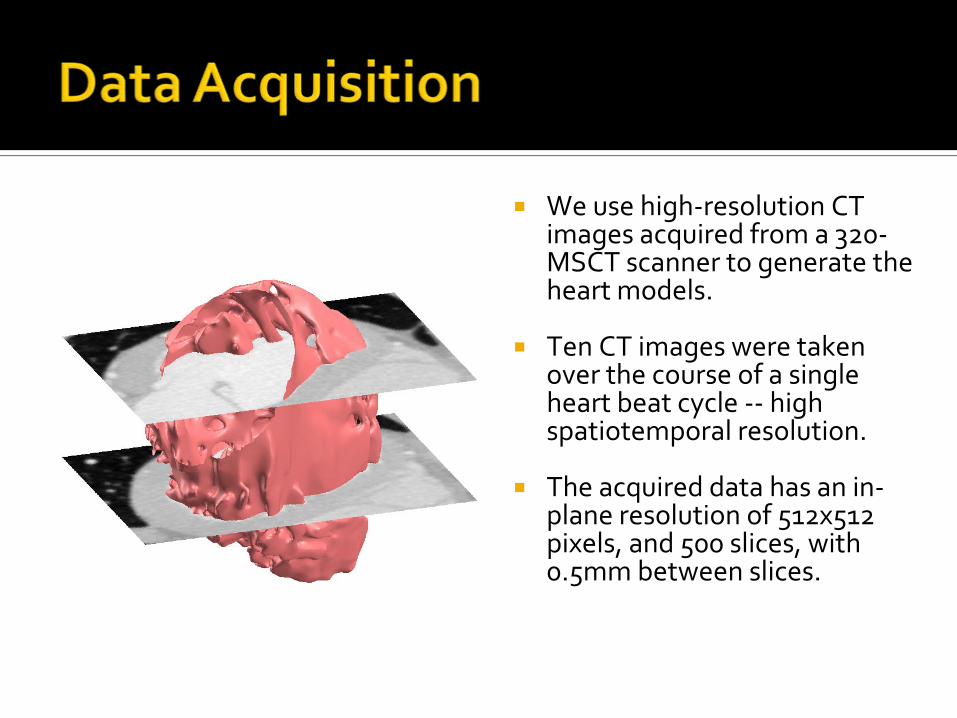
We use high‐resolution CT images acquired from a 320‐MSCT scanner to generate the heart models.
Ten CT images were taken over the course of a single heart beat cycle ‐‐ high spatiotemporal resolution.
The acquired data has an in‐plane resolution of 512x512 pixels, and 500 slices, with 0.5mm between slices.

To generate a 3D mesh sequence, the CT data is segmented, and a detailed mesh is created from an isosurface of the segmentation.
Then, the high resolution mesh to deformed to match the shape of the heart in each consecutive frame.
Since valves are thin and move fast, the CT data is not able to capture them, and so we add them manually.

The motion of an incompressible fluid is governed by the laws of conservation of momentum and mass, modeled by the Navier‐Stokes equations:
We solve these equations for the three components of velocity and the pressure everywhere at each time step.

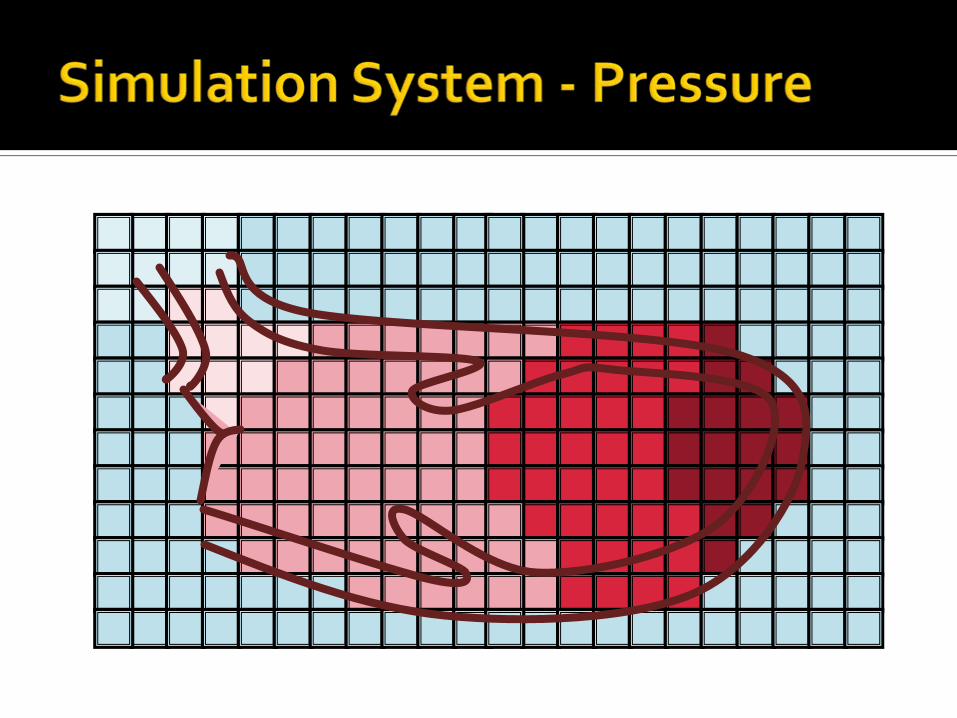

Used framework from [1] to run a fluid simulation on the mesh sequence on a 96x96x96 grid to simulate blood flow.
The blood is modeled as a Newtonian fluid, with viscosity set at 4mPa*s and density set at 1060kg/m3.
Each two‐cycle simulation took between 4‐6 days to complete.
[1] Mihalef et al, “Atrioventricular blood flow simulation based on patient‐specific data,” in Proceedings of FIMH 2009, 2009.


Stagnant blood within the heart has high risk of clotting. We therefore seek a method to determine the average residence time of blood.
Randomly generate particles within the heart at the initial timestep. Each consecutive time step, use velocity field to move existing particles, and generate new particles near the valves.


We can compare the visualizations of velocity and average residency time between normal and diseased hearts.
We ran a simulation with one healthy heart, one heart with simulated hypokinesis, and one with significant dissynchronization of the heart walls.


Normal Hypokinesis
Dyssynchronized


For the first time, we are able to capture some of the complex details of the trabeculae at theheart’s walls and simulate the blood flow around them.
Next stepsFaster, fully‐automated mesh generation
Development of faster numerical technique for solving fluid flow
More streamlined, unified software for use by doctors

This material is based upon work supported by the U.S. Department of Homeland Security under Grant Award Number 2007‐ST‐104‐000006. The views and conclusions contained in this document are those of the authors and should not be interpreted as necessarily representing the official policies, either expressed or implied, of the U.S. Department of Homeland Security.