visualizing the flavor of data - mat uc santa barbarag.legrady/academic/courses/06w259/projs/... ·...
TRANSCRIPT

Schweller page �
Visualizing the Flavor of DataCorina Schweller
MAT 259W06
INTRODUCTION: There are numerous flavors found in wine that I will visually map in order to find similarities and differences between them. I have chosen 85 flavors from seven wines in order to explore the relationships between the flavors and wines. The wines selected are commonly found varietals, present in America and particularly in the California region. [�] The flavors refer to tastes and smells that stem from the grapes and are a result of the climate, soil, winemaking techniques and the aging process. The data will be presented in the form of the Kohonen Self-Organizing Mapping Algorithm (SOMs).
DATA COLLECTION: The project will commence with a search for the main varieties of wine and the key flavors. The initial wine varieties and flavors will be chosen from winery tasting notes available on location in the wineries or on the Internet, notable books such as “The Wine Encyclopedia,” and numerous web sites including winespectator.com. The flavors of the wines will be selected on the basis of applicability to the wine and flavors that are not associated with the specific wine will be recorded with a zero value. After discovering what prevalent varieties of wine are, I will implement the Internet search engine google.com and type in the wine name and flavor to see how many instances that the key flavor is associated with a certain type of wine. The search words will remain consistent in format in order to attempt to eliminate certain margins of error. Searching for these key words will result in numeric whole numbers that range from a few hundred to four million. The key words will be sorted alphabeti-cally and the corresponding amounts listed in a database.
UNITS OF ORGANIZATION: The wine varieties will be categorized into seven main groups labeled Cabernet Sauvignon, Chardonnay, Merlot, Pinot Noir, Riesling, Sauvignon Blanc, and Syrah. The 85 prominent flavors, such as honey, apple, cedar, cherry, melon, tar, and pepper will comprise the key words. [2,3] Once the database has been built, I will implement the Kohonen Self-Organizing Mapping Algorithm (SOMs). The Kohonen Mapping system (Figure �) was invented by Professor Tuevo Kohonen and utilizes self-organizing neural networks in order to reduce the data dimensions. [4,5] Kohonen maps can be defined as a structure of connected units that have data and natural location as the parts of a weight vector. The maps compress data while maintaining the relationships and actually become trained by the data in the process.
Figure 1 - Simple Kohonen Network [6]

Schweller page 2
Figure 3 - Kohonen Map of Wine VarietiesFigure 2 - Database of Wine Flavors and Varieties
KOHONEN VISUALIZATION: Figure 2 is a segment of the Wine Flavors and Varieties database. The numeric values are from the google.com searches. Flavors that are not part of the tasting experience for a particular wine are recorded with a value of zero. The values obtained in the database will be transferred into the Kohonen Self-Organizing Mapping Algorithm in order to clearly visualize the relationships of the wines to each other. [7] Mapping this data can provide information for exploring the repre-sentation of the wine flavor database with other software. Applying the database information to the Kohonen Self-Organizing Map algorithm has garnered the result shown in Figure 3.
READING THE MAP: The regions denoted in white are ‘valleys’ and signify similarities between items. The darker regions are referred to as ‘hills’ and show differences between those items listed within and the rest of the items on the map. Figure 3 shows that Chardonnay is quite different in flavor properties from the other wines. The dark line separating Chardonnay from the rest of the wines indicates that its flavor properties vary from the rest of the wines. There is also a boundary between Pinot Noir and Merlot. Riesling, Sauvignon Blanc, Syrah and Cabernet Sauvignon seem to have the most similar qualities.

Schweller page 3
Figure 4 - Database of Wine Flavors and Varieties

Schweller page 4
Figure 5 - Graph of Wine Flavors and Varieties
Wine Flavor Graph
0%
10%
20%
30%
40%
50%
60%
70%
80%
90%
100%
CABERNET
SAUVIGNON
CHARDONNAY MERLOT PINOT NOIR RIESLING SAUVIGNON
BLANC
SYRAH
Wine Varieties
% o
f To
tal F
ou
nd
Anis Apple Apricot Asparagus Basil
Bay Leaf Bell Pepper Berry Black Cherry Black Currant
Blackberry Butter Butterscotch Buttery Caramel
Caraway Cedar Cherry Cigar Cigar Box
Cinnamon Citrus Clove Cocoa Coconut
Coffee Crisp Currant Diesel Dust
Earth Fig Flint Floral Fruit
Ginger Gooseberry Grape Grapefruit Grassy
Green Olive Green Peppercorn Gunmetal Honey Honeysuckle
Kerosene Leather Lemon Licorice Maple
Melon Mineral Mint Mushroom Musk
Nutmeg Oak Oakey Orange Papaya
Peach Pear Pepper Pimento Pineapple
Plum Raspberry Rose Petal Smoke Smokey
Spice Steel Strawberry Sweet Wood Tar
Tart Terpentine Toast Tobacco Tomato
Tropical Fruit Truffle Vanilla Violet Woodruff
Schweller page 5
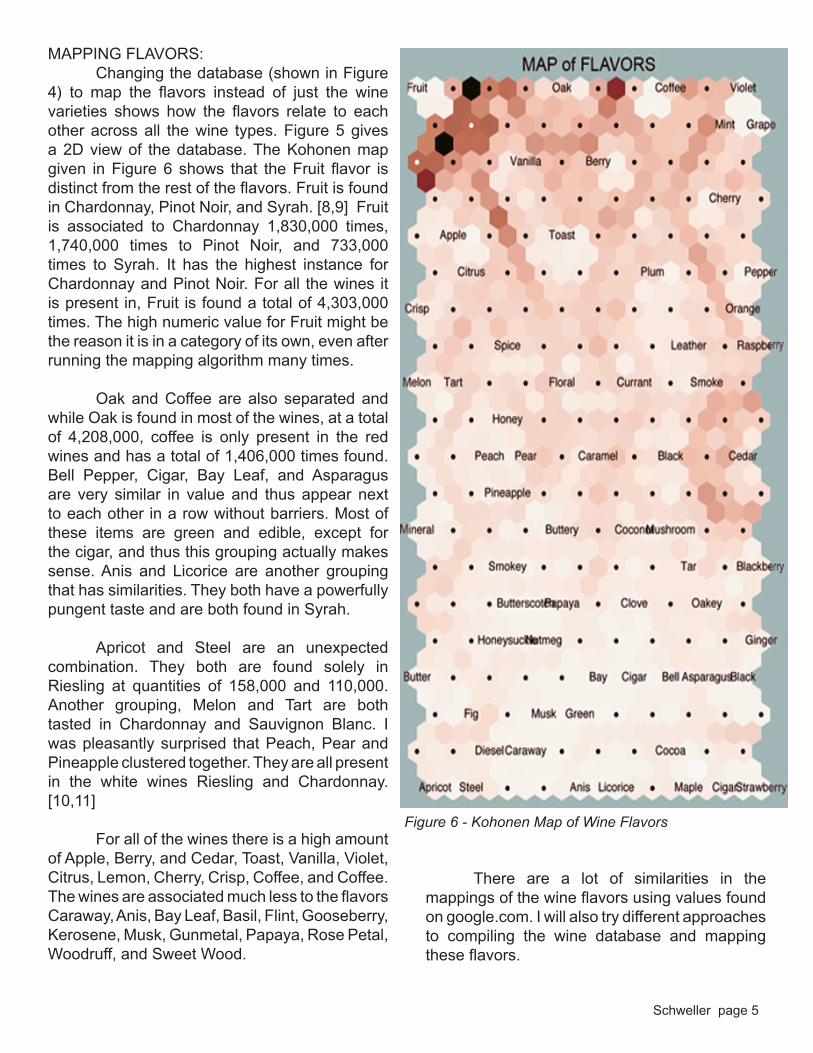
MAPPING FLAVORS: Changing the database (shown in Figure 4) to map the flavors instead of just the wine varieties shows how the flavors relate to each other across all the wine types. Figure 5 gives a 2D view of the database. The Kohonen map given in Figure 6 shows that the Fruit flavor is distinct from the rest of the flavors. Fruit is found in Chardonnay, Pinot Noir, and Syrah. [8,9] Fruit is associated to Chardonnay �,830,000 times, �,740,000 times to Pinot Noir, and 733,000 times to Syrah. It has the highest instance for Chardonnay and Pinot Noir. For all the wines it is present in, Fruit is found a total of 4,303,000 times. The high numeric value for Fruit might be the reason it is in a category of its own, even after running the mapping algorithm many times.
Oak and Coffee are also separated and while Oak is found in most of the wines, at a total of 4,208,000, coffee is only present in the red wines and has a total of �,406,000 times found. Bell Pepper, Cigar, Bay Leaf, and Asparagus are very similar in value and thus appear next to each other in a row without barriers. Most of these items are green and edible, except for the cigar, and thus this grouping actually makes sense. Anis and Licorice are another grouping that has similarities. They both have a powerfully pungent taste and are both found in Syrah.
Apricot and Steel are an unexpected combination. They both are found solely in Riesling at quantities of �58,000 and ��0,000. Another grouping, Melon and Tart are both tasted in Chardonnay and Sauvignon Blanc. I was pleasantly surprised that Peach, Pear and Pineapple clustered together. They are all present in the white wines Riesling and Chardonnay. [�0,��]
For all of the wines there is a high amount of Apple, Berry, and Cedar, Toast, Vanilla, Violet, Citrus, Lemon, Cherry, Crisp, Coffee, and Coffee. The wines are associated much less to the flavors Caraway, Anis, Bay Leaf, Basil, Flint, Gooseberry, Kerosene, Musk, Gunmetal, Papaya, Rose Petal, Woodruff, and Sweet Wood.
Figure 6 - Kohonen Map of Wine Flavors
There are a lot of similarities in the mappings of the wine flavors using values found on google.com. I will also try different approaches to compiling the wine database and mapping these flavors.

Schweller page 6
Figure 7 - Database of Wine Flavors and Varieties Figure 8 - Kohonen Map of Wine Flavors
0 and � MAPS: The database in Figure 7 reduces the information to simply indicate that a flavor is found in a wine. The “�” indicates that the flavor is actually part of the tasting experience for that specific wine. The “0” signifies that a certain flavor is not part of the wine profile for that particular wine. On the Kohonen maps, lighter colors demonstrate the similarities and darker areas are differences. The maps of the 0 and � database (Figure 8 and 9) exhibit an ample amount of differences in the flavors of the wines. This system seems to give a more comprehensive representation of the flavors present in the wines and conveys obvious divisions of the flavors. The problem with this mapping system is that there are too many separations and the connections between flavors are completely lost.
Figure 9 - Kohonen Map of Wine Flavors

Schweller page 7
Figure 10 - Kohonen Maps of Individual Red Wine Flavors

Schweller page 8
Figure 11 - Kohonen Maps of Individual White Wine Flavors
INDIVIDUAL WINES: To further explore the relationship of flavors, each wine was mapped individually. Instead of entering all of the flavor data into the Kohonen Mapping Algorithm, as done in the earlier maps, I put the wines separately into the algorithm and ran the algorithm �000 times with a second cycle of �0000 times. The map size is a consistent �0 by �5 array of nodes with a radius of 7.5 and a minimum of 30 maps were generated for each wine to check for consistency. The Kohonen maps of the red wines (Figure �0) show that there are many similar structures in the groupings of flavors and almost the same amount of similarities and differences among the wines. Each wine has its own set of flavors as well as shared flavors. Oak is associated with five of the seven wines and appears confined to the corners of the Cabernet Sauvignon, Sauvignon Blanc, and Merlot. Black Cherry tends to gravitate towards the edges of the maps. Black Cherry is present in Cabernet Sauvignon and Merlot, but often appears in the maps for other wines for which it is listed as a zero.

Schweller page 9
FLAVORS OF INDIVIDUAL WINES: The white wines (Figure ��) are much more varied in flavors and groupings. Two of the white wines, Riesling and Sauvignon Blanc, have a lot of differences between the flavors while Chardonnay has many similarities among its flavors. When tasting the wines, you will notice that Chardonnay tends to be smoother in taste and more buttery than Riesling or Sauvignon Blanc. [�2] The graph in Figure �2 gives a 2D look at the flavors and supports the groupings created by the Kohonen maps.
SOURCES: A multitude of sources have provided the research parameters. Tasting Notes from actual wineries were studied along with books such as “Wine Essentials” and “Wine for Dummies.” The Internet was a major source in this project, both in defining the Kohonen Self-Organizing Mapping Algorithm and searching for the wine flavors. Well reputed sites, including winespectator.com and winepros.org were perused for building the database key words. CONCLUSION: Kohonen Mapping has proven to be an ideal way to visualize the relationships between flavors in wines. Mapping all of the wines and flavors gives an overview of the groupings of flavors. Fruit and Oak are separated from the rest of the flavors and both are present in large quantities in several of the wines. The most insightful maps were those of the individual flavors since they allowed for comparisons between each of the wines. These maps have revealed that the red wines have more in common than the white wines and more importantly, the taste of a wine can be derived from a Kohonen map.
OTHER VISUALIZATION: Using the information generated with the Kohonen Mapping system, I will create other visu-alizations of the data by inserting the coordinates from the mapping files into animation software. The flavor data will be displayed in an organic shape that will be placed on a surface based on its relationship to the other flavors. Just like Kohonen Mapping, the distances between shapes will be based upon similarities and differences.
0 500000 1000000 1500000 2000000
AnisApple
ApricotAsparagus
BasilBay Leaf
Bell PepperBerry
Black CherryBlack
BlackberryButter
ButterscotchButtery
CaramelCaraway
CedarCherry
CigarCigar BoxCinnamon
CitrusClove
CocoaCoconut
CoffeeCrisp
CurrantDiesel
DustEarth
FigFlint
FloralFruit
GingerGooseberry
GrapeGrapefruit
GrassyGreen Olive
GreenGunmetal
HoneyHoneysuckle
KeroseneLeatherLemon
LicoriceMapleMelon
MineralMint
MushroomMusk
NutmegOak
OakeyOrangePapayaPeach
PearPepper
PimentoPineapple
PlumRaspberry
Rose PetalSmoke
SmokeySpiceSteel
StrawberrySweet Wood
TarTart
TerpentineToast
TobaccoTomato
Tropical FruitTruffleVanillaViolet
Woodruff
Wine Flavor Graph
SYRAH
SAUVIGNON BLANC
RIESLING
PINOT NOIR
MERLOT
CHARDONNAY
CABERNET SAUVIGNON
Figure 12 - Bar Graph of Wine Flavors

Schweller page �0
REFERENCES:
[�] Nation Master Encyclopedia. Cabernet Sauvignon. http://www.nationmaster.com/encyclopedia/Cabernet-sauvignon Chardonnay. http://www.nationmaster.com/encyclopedia/Chardonnay Merlot. http://www.nationmaster.com/encyclopedia/Merlot Pinot Noir. http://www.nationmaster.com/encyclopedia/Pinot-noir Riesling. http://www.nationmaster.com/encyclopedia/Riesling Sauvignon Blanc. http://www.nationmaster.com/encyclopedia/Sauvignon-Blanc Syrah. http://www.nationmaster.com/encyclopedia/Syrah [2] Professional Friends of Wine. Tasting Notes. http://www.winepros.org/tasting-notes/tastings_list.htm
[3] Wine Spectator Online. Today’s Picks. http://www.winespectator.com/Wine/Daily_Wine_Picks?lid=DWP&lpos=TopNav
[4] Tom Germano. Self Organizing Maps. http://davis.wpi.edu/~matt/courses/soms/#Introduction [5] Tuevo Kohonen. The Self-Organizing Map (SOM). http://www.cis.hut.fi/projects/somtoolbox/theory/somalgorithm.shtml
[6] Kohonen Networks http://www.vias.org/tmdatanaleng/cc_ann_kohonen.html
[7] Kohonen’s Self-Organizing Map (SOM). http://www.willamette.edu/~gorr/classes/cs449/Unsupervised/SOM.html
[8] E. McCarthy and M. Ewing-Mulligan. Wine for Dummies. Indiana: Wiley Publishing, 2003. pg 28-30.
[9] S. Brook and et al. Le Cordon Bleu Wine Essentials. New York: John Wiley & Sons, Inc., 200�. page 70-76, �84.
[�0] San Francisco Chronicle. THE CHRONICLE’S WINE SELECTIONS Monterey County Chardonnay. http://sfgate.com/cgi-bin/article.cgi?f=/c/a/2006/0�/05/WIGOHGGEE��.DTL
[��] Lynda Abbott. Chardonnay. http://student.santarosa.edu/~labbott/chardonnay.html
[�2] Food & Wine. http://www.foodandwine.com/search/wine.cfm?order=&kw=syrah®ions= 9999_9999&p=9999&q=9999&t=9999&v=9999
Visualizing the Flavors of Data