visualizing trends in student performance across computer
TRANSCRIPT
Visualizing Trends in Student Performance AcrossComputer Science Courses
Dana WortmanUniversity of Maryland, Baltimore County
1000 Hilltop CircleBaltimore, MD 21250
Penny RheingansUniversity of Maryland, Baltimore County
1000 Hilltop CircleBaltimore, MD 21250
ABSTRACTStudent retention is an important topic in Computer Sciencedepartments across the country. Keeping strong studentsand helping struggling students perform better are two fun-damental components of improving retention. Isolating thecause(s) of students leaving the major is an important areaof research. We endeavor to explore this problem using a vi-sualization tool to probe student data within the beginningcourse sequence in Computer Science. We would like to seewhat patterns exist amongst students, focusing on success,failure, and repetition patterns throughout the first threecourses. Identifying these patterns can help isolate some ofthe causes of decreased retention within the department, al-lowing us to address individual projects, courses, or examsthat may be causing students exceptional difficulty or loss ofinterest. Due to the large amount of data and the variety ofstudents’ paths through their courses, it is essential that a vi-sualization be developed to represent the data. Using graphlayouts, parallel coordinates, color-mapping, and interactiveselection, users can explore and query the data. Users candiscover patterns within the data by selecting subgroups ofstudents and examining the event sequences to find patternsof success, failure, and repetition amongst those students.Departments can use this information to isolate profiles ofstudents for retention, remediation, and recruitment effortsas well as identify areas of the curriculum or instruction thatcan be improved.
Categories and Subject DescriptorsK.3.2 [Computers and Education]: Computer and In-formation Science Education; I.3.8 [Computer Graphics]:Applications
General TermsHuman Factors
Permission to make digital or hard copies of all or part of this work forpersonal or classroom use is granted without fee provided that copies arenot made or distributed for profit or commercial advantage and that copiesbear this notice and the full citation on the first page. To copy otherwise, torepublish, to post on servers or to redistribute to lists, requires prior specificpermission and/or a fee.SIGCSE’07,March 7–10, 2007, Covington, Kentucky, USA.Copyright 2007 ACM 1-59593-361-1/07/0003 ...$5.00.
KeywordsCS1, CS2, Visualization, Student Performance, Retention
1. INTRODUCTIONWith enrollment numbers dropping and jobs increasing,
educators are seeing a growing divide between the numberof students beginning Computer Science programs and thosecompleting them. The Computing Research Association col-lects enrollment data from Computer Science departmentsaround the country. The 2004 survey noted that there wasalmost a 70% decrease in enrollment over the past two years[1]. The fundamental question is: “why are we drivingstudents away?” Beaubouef and Mason identify several ofthe reasons why students leave Computer Science. Theypoint out that students possess insufficient skills to suc-ceed and that faculty use inappropriate instructional tech-niques[2]. Seymour and Hewitt cite a lack or loss of interestand poor teaching as two of the major contributing factorsto students’ decisions to leave[12]. Seidman found that earlyidentification and intensive intervention for students likelyto leave college has the greatest effect at improving reten-tion[11]. In order to realize this improvement, we must in-troduce students to the discipline early in the curriculum,demonstrate enthusiasm for the subject [12], develop relatedskills early so that they can succeed [11], and use techniquesin the classroom and beyond that will encourage learningand refine skills.
In order to improve retention, we are interested in uncov-ering patterns of success, failure, and repetition of studentsenrolled in our Computer Science department. Of particularinterest is understanding what happens with the large num-ber of students who repeat early courses in the major, if theycontinue to struggle or are more successful later. Due to thelarge number of students and the diversity of their progressthrough their courses, it is difficult to identify larger patternswithout using visualization techniques to represent the data.Visualization allows us to see the entire dataset, use visualcues to identify important events, and summarize the datawithout looking at individual numbers or generated statis-tics. We use a basic structure borrowed from graph theory ofnodes and edges, then build on that foundation by mappingperformance to color and then provide a utility that allowsthe user to selectively filter groups of students to identifycommonalities amongst students.
2. RELATED WORKUsing visualization to explore data is quickly becoming
430
a well-known technique for identifying patterns, especiallyin large datasets. Ware emphasizes that visualization pro-vides the ability to comprehend massive datasets, perceiveemergent properties, and understand large- and small-scalefeatures[13]. Marcus et al. use a collection of 3-dimensionalglyphs, color, and height to map a large dataset, enablingusers to see patterns within the data based on several at-tributes[7]. Havre et al. developed a novel idea of using ariver metaphor for visualizing topical patterns within newsstories - incorporating color to represent similar topics andheight to represent the frequency of a topic[4]. We mapdata to glyphs, color, and component widths to help theuser identify interesting features within the dataset.
Interactivity has also played a role in allowing users todetect patterns within data. Bederson and Shneidermanidentify dynamic queries as useful tool for exploring largedatabases[3]. Timeboxes were introduced by Hochheiser andSchneiderman, enabling users to graphically map queriesinto the dataset via regular boxes[5]. De Pauw et al. [9] andPlaisant et al. [10] use a “details-on-demand” approach byproviding user-interaction and querying at several hierarchi-cal levels. Munzner et al. introduced the idea of “guaranteedvisibility” within large datasets by providing a mechanismto ensure that the entire dataset is visible[8]. We exploitinteractive querying and guaranteed visibility to allow usersto visualize selected groups of students within the scope ofthe entire dataset.
3. APPLICATIONOur primary goal in developing this application was to
explore the collection of grades from Computer Science I(CS1), Computer Science II (CS2), and Data Structures(CS3), identifying similarities and differences amongst suc-cessful and unsuccessful students. Most of the studentstaking these three courses are Computer Science or Com-puter Engineering majors. Our department has instituteda “Gateway” requiring students to earn a B or better inCS1 and CS2 to continue in the program. Before embark-ing on this project, we had a vague notion that there werea significant number of repeated attempts at these courses.However, we had no idea what patterns exist amongst thesestudents as they retook these courses, such as whether theywere more or less successful on subsequent attempts or evenwhich topics in these courses prove problematic for them.
3.1 DataProject grades, examination grades, and the final course
grades were collected from instructors for each of these coursesover four semesters. Each record in the dataset includes aunique identifier, grade in each of the course projects and ex-ams, and a final grade for the course which included any lab-oratory assignments, quizzes, or curves applied to the class.In total, there are approximately 1700 individual studentsinvolved in the four semesters with over 20,000 individualgrades. In visualizing these data, we hope to identify someof the problem areas for repeating students as well as someof the differences between successful and unsuccessful stu-dents. Ideally, we would like to see patterns that will helpus improve the initial course sequence, helping students bemore successful through a higher level of understanding.
3.2 RequirementsSince we are interested in eliciting patterns from the data
using visualization, we must satisfy the following require-ments. The visualization must allow the user to:
• Discover performance patterns amongst successful, strug-gling, and repeating students.
• Select groups of students based on performance crite-ria.
• Quickly and easily refine/expand a selection.
Supporting these three criteria is paramount to demonstrat-ing the usefulness of the tool.
4. APPROACHOur primary inspiration was a basic graph layout with
nodes representing specific events, edges between those nodesrepresenting students moving from one event to the next,and grades earned are mapped to color. We use line widthto represent the number of students currently selected mov-ing between two events and the width of a node representsthe total number of students passing through that event.
4.1 Node LayoutWe start with a temporal layout with some modifications
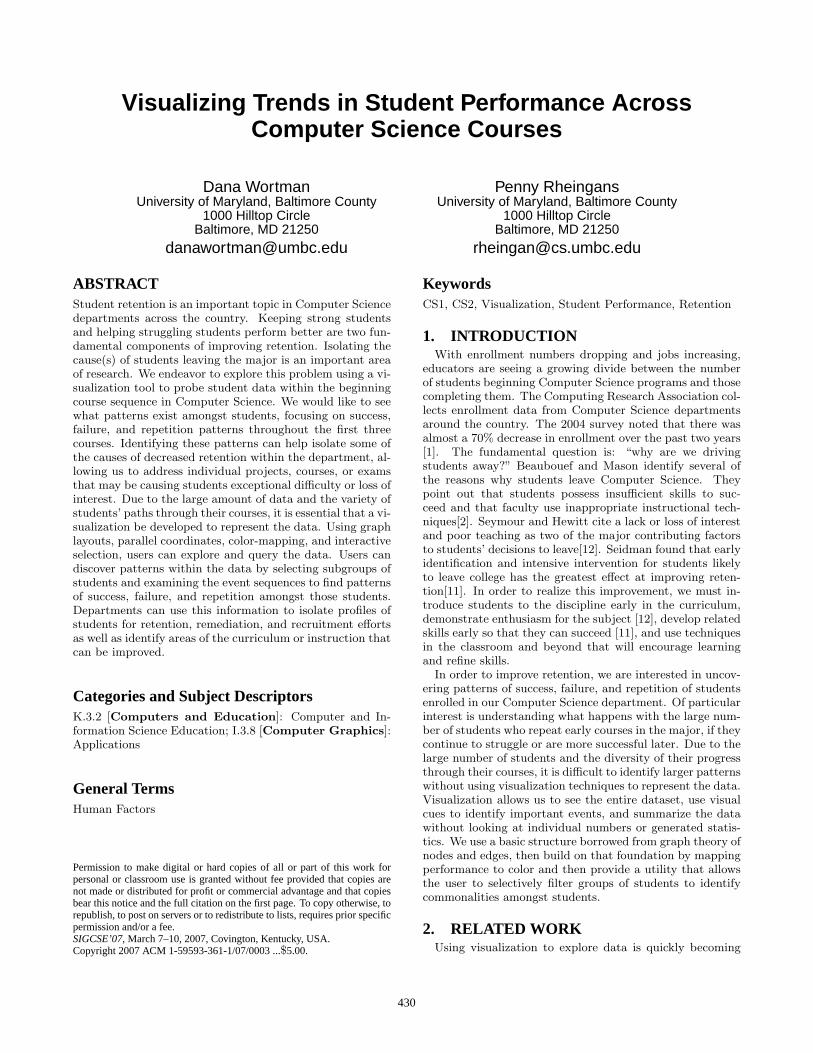
inspired by parallel coordinates[6]. Starting with the basicidea of a temporal sequence of events from left to right, wethen depict grades for each event from top to bottom (A toF). Figure 1 labels each of the components. Project, examor course grades represent events. Each event is depicted bya single node. Related nodes are vertically aligned. Sincethe temporal relationship between exams and projects is un-known and differs between courses and semesters, we usetwo different event sequences to depict them. Each coursehas a “dummy” node that represents the beginning of thecourse. Previous course data link to the dummy node forthe following course. Projects are horizontally arranged inan arc connecting the dummy node from the current courseto the dummy node for the subsequent course. Projects arepositioned vertically above the course grades and dummynodes, exams are below. The grade each node representsis mapped to the color of that node. Users can specify thecolor for grades A and F and a linear interpolation gener-ates the mapping in between. All figures in this paper mapwhite to A and dark-blue to F, preserving the mappings inblack and white images. The width of these nodes is linearlycorrelated to the number of students passing through thatnode:
NumberOfStudentsInNode×MaxLineWidth
TotalNumberOfStudents(1)
We incorporate guaranteed visibility of the nodes by ensur-ing that the width of a node does not decrease beyond aminimum threshold.
4.2 Event MappingRepresenting a single student’s progress through the three
course sequence begins with generating two paths, one throughthe projects, course grades, and dummy nodes and the otherthrough the exams, course grades, and dummy nodes. Eachedge along the path represents the transition of that stu-dent from one event to the next. The user may choose tomap the grade from the starting or ending node to the colorof the edge, emphasizing the transition into or out of the
431
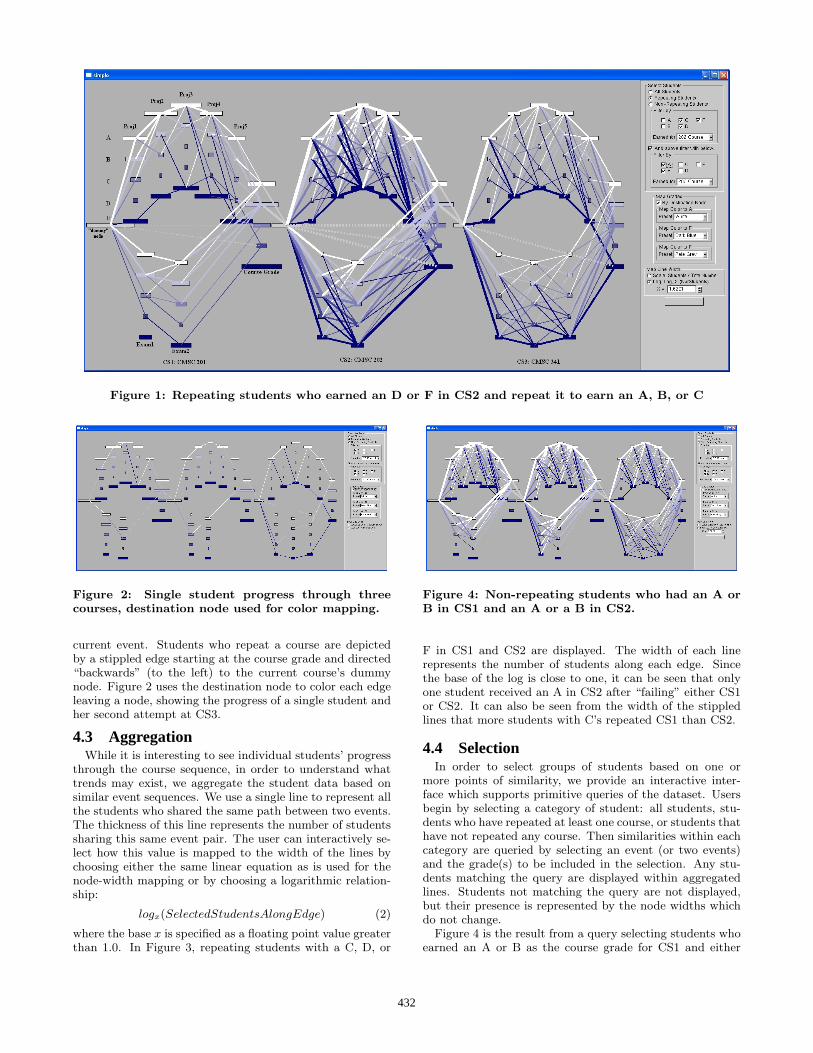
Figure 1: Repeating students who earned an D or F in CS2 and repeat it to earn an A, B, or C
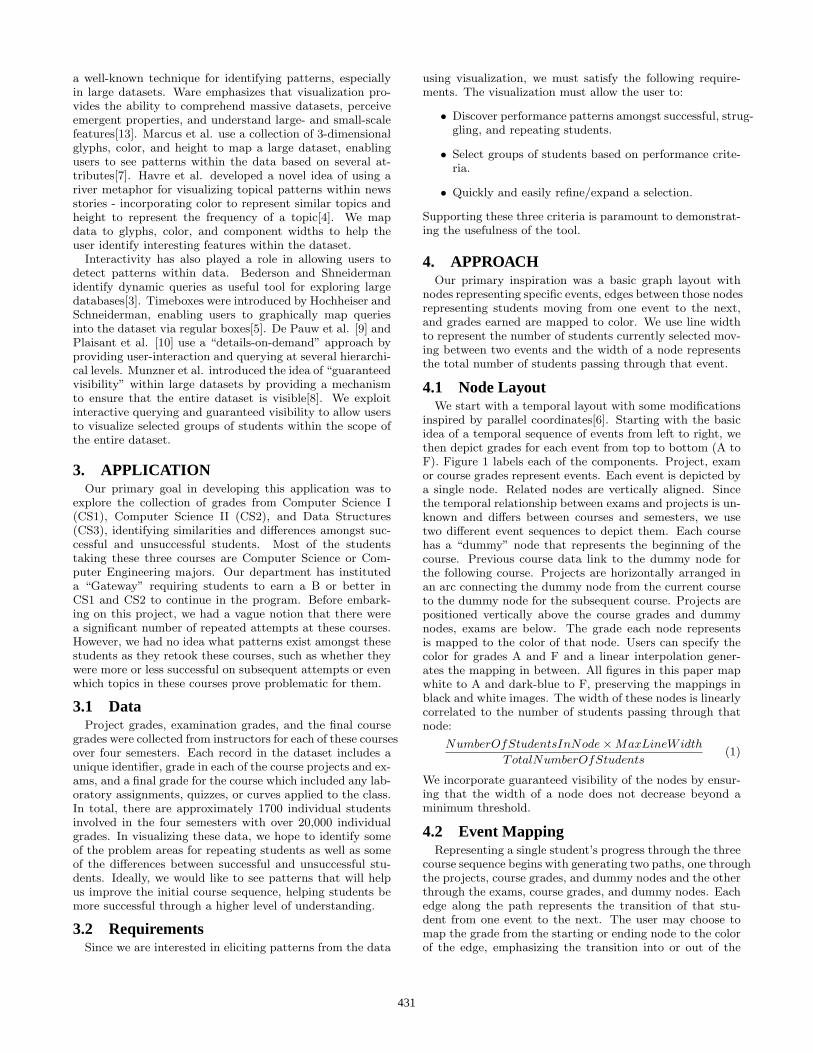
Figure 2: Single student progress through threecourses, destination node used for color mapping.
current event. Students who repeat a course are depictedby a stippled edge starting at the course grade and directed“backwards” (to the left) to the current course’s dummynode. Figure 2 uses the destination node to color each edgeleaving a node, showing the progress of a single student andher second attempt at CS3.
4.3 AggregationWhile it is interesting to see individual students’ progress
through the course sequence, in order to understand whattrends may exist, we aggregate the student data based onsimilar event sequences. We use a single line to represent allthe students who shared the same path between two events.The thickness of this line represents the number of studentssharing this same event pair. The user can interactively se-lect how this value is mapped to the width of the lines bychoosing either the same linear equation as is used for thenode-width mapping or by choosing a logarithmic relation-ship:
logx(SelectedStudentsAlongEdge) (2)
where the base x is specified as a floating point value greaterthan 1.0. In Figure 3, repeating students with a C, D, or
Figure 4: Non-repeating students who had an A orB in CS1 and an A or a B in CS2.
F in CS1 and CS2 are displayed. The width of each linerepresents the number of students along each edge. Sincethe base of the log is close to one, it can be seen that onlyone student received an A in CS2 after “failing” either CS1or CS2. It can also be seen from the width of the stippledlines that more students with C’s repeated CS1 than CS2.
4.4 SelectionIn order to select groups of students based on one or
more points of similarity, we provide an interactive inter-face which supports primitive queries of the dataset. Usersbegin by selecting a category of student: all students, stu-dents who have repeated at least one course, or students thathave not repeated any course. Then similarities within eachcategory are queried by selecting an event (or two events)and the grade(s) to be included in the selection. Any stu-dents matching the query are displayed within aggregatedlines. Students not matching the query are not displayed,but their presence is represented by the node widths whichdo not change.
Figure 4 is the result from a query selecting students whoearned an A or B as the course grade for CS1 and either
432
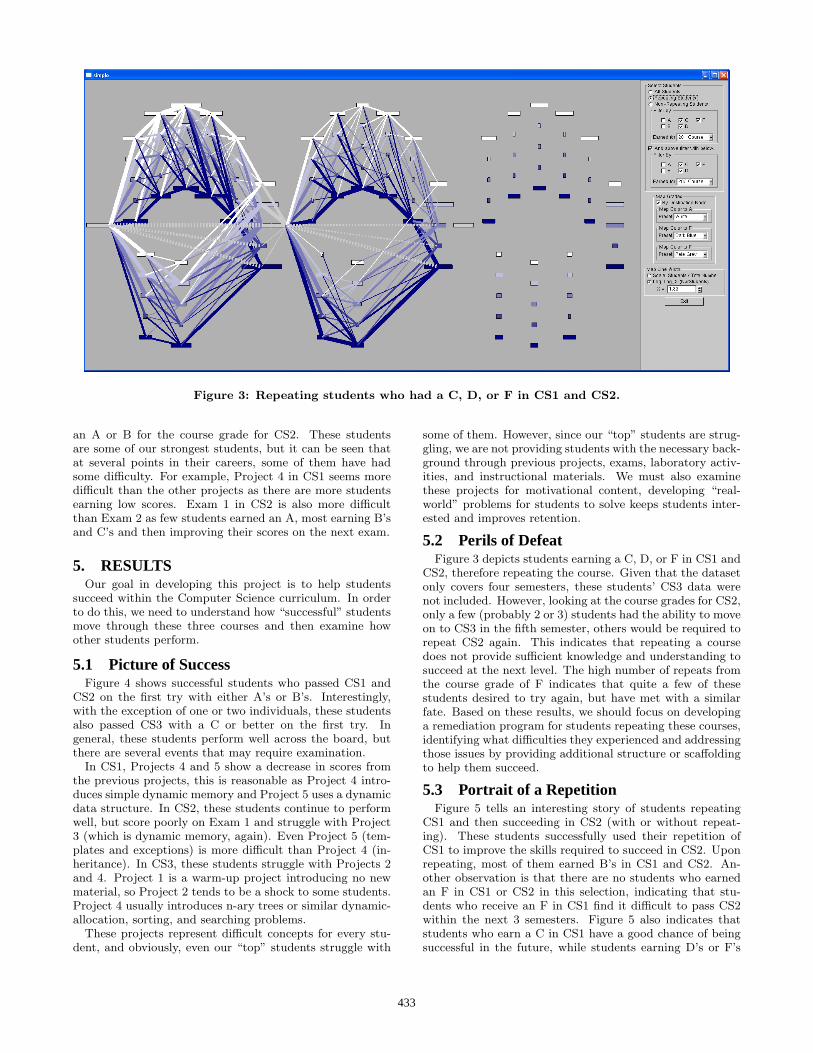
Figure 3: Repeating students who had a C, D, or F in CS1 and CS2.
an A or B for the course grade for CS2. These studentsare some of our strongest students, but it can be seen thatat several points in their careers, some of them have hadsome difficulty. For example, Project 4 in CS1 seems moredifficult than the other projects as there are more studentsearning low scores. Exam 1 in CS2 is also more difficultthan Exam 2 as few students earned an A, most earning B’sand C’s and then improving their scores on the next exam.
5. RESULTSOur goal in developing this project is to help students
succeed within the Computer Science curriculum. In orderto do this, we need to understand how “successful” studentsmove through these three courses and then examine howother students perform.
5.1 Picture of SuccessFigure 4 shows successful students who passed CS1 and
CS2 on the first try with either A’s or B’s. Interestingly,with the exception of one or two individuals, these studentsalso passed CS3 with a C or better on the first try. Ingeneral, these students perform well across the board, butthere are several events that may require examination.
In CS1, Projects 4 and 5 show a decrease in scores fromthe previous projects, this is reasonable as Project 4 intro-duces simple dynamic memory and Project 5 uses a dynamicdata structure. In CS2, these students continue to performwell, but score poorly on Exam 1 and struggle with Project3 (which is dynamic memory, again). Even Project 5 (tem-plates and exceptions) is more difficult than Project 4 (in-heritance). In CS3, these students struggle with Projects 2and 4. Project 1 is a warm-up project introducing no newmaterial, so Project 2 tends to be a shock to some students.Project 4 usually introduces n-ary trees or similar dynamic-allocation, sorting, and searching problems.
These projects represent difficult concepts for every stu-dent, and obviously, even our “top” students struggle with
some of them. However, since our “top” students are strug-gling, we are not providing students with the necessary back-ground through previous projects, exams, laboratory activ-ities, and instructional materials. We must also examinethese projects for motivational content, developing “real-world” problems for students to solve keeps students inter-ested and improves retention.
5.2 Perils of DefeatFigure 3 depicts students earning a C, D, or F in CS1 and
CS2, therefore repeating the course. Given that the datasetonly covers four semesters, these students’ CS3 data werenot included. However, looking at the course grades for CS2,only a few (probably 2 or 3) students had the ability to moveon to CS3 in the fifth semester, others would be required torepeat CS2 again. This indicates that repeating a coursedoes not provide sufficient knowledge and understanding tosucceed at the next level. The high number of repeats fromthe course grade of F indicates that quite a few of thesestudents desired to try again, but have met with a similarfate. Based on these results, we should focus on developinga remediation program for students repeating these courses,identifying what difficulties they experienced and addressingthose issues by providing additional structure or scaffoldingto help them succeed.
5.3 Portrait of a RepetitionFigure 5 tells an interesting story of students repeating
CS1 and then succeeding in CS2 (with or without repeat-ing). These students successfully used their repetition ofCS1 to improve the skills required to succeed in CS2. Uponrepeating, most of them earned B’s in CS1 and CS2. An-other observation is that there are no students who earnedan F in CS1 or CS2 in this selection, indicating that stu-dents who receive an F in CS1 find it difficult to pass CS2within the next 3 semesters. Figure 5 also indicates thatstudents who earn a C in CS1 have a good chance of beingsuccessful in the future, while students earning D’s or F’s
433

Figure 5: Repeating students who earned a C, D,or F in CS1 and then went on to earn an A or B inCS2
do not. This may also imply that the Gateway policy (of Bor better) is not really necessary as students who earn a Cmove through the following courses successfully. Similarlyto successful students, Projects 4 and 5 from CS1 and Exam1 from CS2 seem to be significantly more difficult than thesurrounding events, indicating that additional materials andpreparation are necessary.
Figure 1 shows a selection of students who have repeatedCS2, these students earned C’s, D’s or F’s the first timearound and have repeated it to earn an A or B. Most ofthese students did well in the previous courses, but fewerearned A’s in CS1 than B’s. Few of these students ended upwith an A in CS2, either, the majority of them earning B’s.Also, almost all of these students earned a C in CS3 (withand without repetition). Together with Figure 1, Figure3 indicates that most students who repeat a course are ei-ther unsuccessful or are barely successful in the next course.This brings to light the necessity for a remedial program forrepeating students.
6. FUTURE DIRECTIONSThis visualization technique only begins to address the
“big” question of retention and how to improve it, but it doestake a step forward. In the future, we plan to add techniquesto provide automated pattern recognition, advanced queries,and increased dataset information including race, gender,and a more complete listing of educational events (like ma-jor histories and complete curriculum progress). With thesecomponents, we plan to examine when and how studentsenter the program, whether transfer students are at a dis-advantage or advantage when transferring credit, whethergender or race play a role in course selection or success, andhow course progress affects changing majors or leaving theschool entirely. We also specifically ignored differences inteaching styles, testing techniques and instructor identity,but these are all areas where future work could identify ad-ditional patterns.
7. CONCLUSIONSWe developed a visualization technique to examine the in-
troductory three-course sequence within our Computer Sci-ence department: CS1, CS2, and CS3. Our primary goalwas to attempt to discover patterns within the successes,failures, and repetitions of students within these courses.By using a basic graph-structure enhanced by aggregation ofdata, color-mapping, interactive selection and data-mapped
glyphs, we have identified some interesting patterns withinthe courses, indicating several problem areas to address.With this information, we can explore alternative strategiesfor improved educational practices, hopefully leading to anincrease in retention and success of our individual students.
8. ACKNOWLEDGMENTSThe authors would like to thank Dr. Tim Oates, Dr. Yun
Peng, Ms. Dawn Block, Mr. Mitch Edelman, Ms. SusanEvans, Mr. Dennis Frey, Mr. Daniel Hood, and Mr. Sa’adRaouf for supplying the student grade data.
9. REFERENCES[1] Computing Research Association. CRA taulbee
survey. web, May 2004.
[2] T. Beaubouef and J. Mason. Why the high attritionrate for computer science students: some thoughts andobservations. SIGCSE Bull., 37(2):103–106, 2005.
[3] B. Bederson and B. Shneiderman. The Craft ofInformation Visualization: Readings and Reflections.Morgan Kaufmann, 2003.
[4] S. Havre, E. Hetzler, P. Whitney, and L. Nowell.Themeriver: Visualizing thematic changes in largedocument collections. In IEEE Transactions ofVisualization and Computer Graphics, Jan- Mar 2002.
[5] H. Hochheiser and B. Schneiderman. Visual queriesfor finding patterns in time series data. In Universityof Maryland, Computer Science Dept. Tech Report,CS-TR-4365, 2002.
[6] A. Inselberg and B. Dimsdale. Parallel coordinates: atool for visualizing multi-dimensional geometry. InVIS ’90: Proceedings of the 1st conference onVisualization ’90, pages 361–378, Los Alamitos, CA,USA, 1990. IEEE Computer Society Press.
[7] A. Marcus, L. Feng, and J. I. Maletic. 3drepresentations for software visualization. In SoftVis’03: Proceedings of the 2003 ACM symposium onSoftware visualization, pages 27–ff, New York, NY,USA, 2003. ACM Press.
[8] T. Munzner, F. Guimbretiere, S. Tasiran, L. Zhang,and Y. Zhou. Treejuxtaposer: scalable treecomparison using focus+context with guaranteedvisibility. ACM Trans. Graph., 22(3):453–462, 2003.
[9] W. D. Pauw, D. Lorenz, J. Vlissides, and M. Wegman.Execution patterns in object-oriented visualization. InProc. Conference on Object-Oriented Technologies andSystems, 1998.
[10] C. Plaisant, R. Mushlin, A. Snyder, J. Li, D. Heller,and B. Shneiderman. Lifelines: Using visualization toenhance navigation and analysis of patient records.Technical Report CS-TR-3943, 1998.
[11] A. Seidman, editor. College Student Retention:Formul for Student Success. American Council onEducation and Praeger Publishers, 2005.
[12] E. Seymour and N. M. Hewitt. Talking About Leaving:Why Undergraduates Leave the Sciences. WestviewPress, 1997.
[13] C. Ware. Information Visualization: Perception forDesign. Morgan Kaufmann, 2004.
434