visuomotor adaptation in anisometropic amblyopia: a prism ... · visuomotor adaptation in...
TRANSCRIPT

Visuomotor Adaptation in Anisometropic Amblyopia: A Prism Adaptation Study
by
Jaime Cayla Sklar
A thesis submitted in conformity with the requirements for the degree of Masters of Science
Institute of Medical Science University of Toronto
© Copyright by Jaime Cayla Sklar 2015

ii
Visuomotor Adaptation in Anisometropic Amblyopia: A prism Adaptation Study
Jaime Cayla Sklar
Masters of Science
Institute of Medical Science
University of Toronto
2015
Abstract
The purpose of this investigation was to assess the impact of anisometropic amblyopia, a
neurodevelopmental disorder of vision, on sensorimotor control. This was accomplished by
adapting the manual motor system to a change in the spatial environment resulting from the
placement of bilateral 20 D left-shifting wedge prisms in front of the eyes. During prism
adaptation, participants initially missed the target in the direction of optical displacement but in
the presence of visual feedback and with repeated pointing, they were able to adapt to this
perturbation. Eleven visually-normal control participants and seven people with anisometropic
amblyopia were tested binocularly on this task. People with anisometropic amblyopia displayed
a significantly longer time course of adaptation than visually-normal controls, with higher
variability during the strategic recalibration phase of adaptation. It is suggested that increased
visual variability, temporal synchrony deficits and deficits in extra-striate visual processing in
amblyopia contribute to the above findings.

iii
Acknowledgments
I would like to take this opportunity to thank a number of people who helped see this study
through from beginning to end. If it was not for their contributions, support and kind words this
thesis would not be what it is today.
To my supervisor, Dr. Agnes Wong, I would like to extend a tremendous thank you for your
support over the last two years. Being given the opportunity to work in your Eye Movement and
Vision Neuroscience Laboratory has been a true blessing; I have learned and grown a lot, not
only about the field of vision neuroscience, but also about life in general. For this you have my
sincerest gratitude. Your support, intelligence and work ethic towards the timely completion of
my degree (and in general) has been outstanding, and I could not have asked for a better
supervisor to help me throughout the last two years. You have truly inspired me by showing me
that hard work really does pay off and if you put your best foot forward, anything can be
accomplished.
The next person I have to say a large thank you to is Dr. Herbert Goltz, my co-supervisor on this
project. Without your extensive knowledge, support and help throughout this entire process, this
thesis would not have been possible. Each time the project hit some sort of speed bump, it was
your innovative ideas that helped get the ball rolling again. Thank you so much for all of your
help and support.
Next, I would like to thank my program advisory committee, Dr. Susanne Ferber and Dr. Luc
Tremblay for their contribution into this thesis and making it what it is. If it were not for your
input on every section of this project, it would not have gone as smoothly as it did. You both
helped me to think more like a scientist, and thus helped me to begin to tap into my true research
potential. For that I am extremely grateful.
The technical side of this project was a daunting and extremely involved task. It would not have
been possible to run this project without the help of Luke Gane. Thank you so much for
everything you have done. It really would have been impossible without you. Additionally, I
have to extend a large thank you to Mano Chandrakumar. When I started in the lab, you took me
under your wing and helped pick this project off the ground. Thank you for always being there.

iv
To the other members of the Eye Movement and Vision Neuroscience Laboratory, thank you so
much! It has honestly been the most memorable two years of my life. Working as a team to
create and produce sound science has taught me so much. Each one of you have changed me in
some way for the better and I am forever grateful.
I would specifically like to thank our orthoptist, Linda Colpa who recruited and screened each
participant involved in this study. Without your dedication this project would have literally been
impossible to run. I am forever indebted to you for helping me throughout this entire process. It
has been an honor working with such an amazing person.
Additionally, this project would have been impossible to pursue without the generous funding of
the Vision Science Research Program scholarship (VSRP), a joint University Health Network,
University of Toronto venture.
Last, but certainly not least, I would like to thank all of my family and friends for supporting me
over the last two years. You have kept me grounded and encouraged me to chase after my
dreams and I am extremely grateful for that. Of course, a special mention has to go to my
parents, Lisa and Lawrence and my brother Michael for their unconditional support.
This is for all of you who have made this thesis a reality. Thank you again.

v
Table of Contents
ACKNOWLEDGMENTS .......................................................................................................................... III
TABLE OF CONTENTS ............................................................................................................................ V
LIST OF TABLES ................................................................................................................................. VIII
LIST OF FIGURES .................................................................................................................................. IX
LIST OF ABBREVIATIONS ...................................................................................................................... XI
CHAPTER 1 INTRODUCTION .................................................................................................................. 1
1.1 GENERAL INTRODUCTION......................................................................................................... 1
1.2 TRANSDUCTION OF VISUAL INFORMATION AND VISUAL DEVELOPMENT .................................. 3
1.2.1 Visual transduction ............................................................................................................ 3
1.2.2 Visual development ............................................................................................................ 6
1.3 AMBLYOPIA ........................................................................................................................... 8
1.3.1 Neural correlates of the amblyopic deficits...................................................................... 8
1.3.2 Classifications ................................................................................................................. 10
1.3.3 Deficits............................................................................................................................. 11
1.3.5 Differences among the amblyopic subtypes .................................................................... 16
1.3.5 Treatment......................................................................................................................... 17
1.3.6 Summary .......................................................................................................................... 18
1.4 VISUALLY-GUIDED REACHING .............................................................................................. 19
1.5 PRISM ADAPTATION ............................................................................................................. 21
1.5.1 Observations during prism adaptation ............................................................................ 21
1.5.2 The prism adaptation paradigm ...................................................................................... 22
1.5.3 What drives sensorimotor adaptation ............................................................................. 23
1.5.4 Adaptive processes during prism adaptation ................................................................. 26
1.5.5 Neural correlates of prism adaptation ............................................................................ 33
1.5.6 Prism adaptation in [other] pathological conditions ..................................................... 36
1.5.7 Summary .......................................................................................................................... 40
CHAPTER 2 HYPOTHESES AND OBJECTIVES ....................................................................................... 41
2.1 HYPOTHESES ........................................................................................................................ 41

vi
CHAPTER 3 MATERIALS AND METHODS ............................................................................................. 43
3.1 MATERIALS AND METHODS................................................................................................... 43
3.1.2 Apparatus ........................................................................................................................ 44
3.2 PROCEDURE.......................................................................................................................... 47
3.2.1 Pointing with feedback (prism adaptation baseline) ...................................................... 47
3.2.2 Open-loop pointing (total shift task) .............................................................................. 48
3.2.3 Visual straight ahead (visual shift task) ......................................................................... 49
3.2.4 Blind straight ahead pointing (proprioceptive shift task) .............................................. 51
3.2.5 Prism adaptation ............................................................................................................ 52
3.2.6 Prism de-adaptation ....................................................................................................... 53
3.3 DATA ANALYSIS ................................................................................................................... 54
3.3.1 Primary outcome measures ............................................................................................. 55
CHAPTER 4 RESULTS ........................................................................................................................... 60
4.1 POINTING WITH FEEDBACK (PRISM ADAPTATION BASELINE).................................................. 60
4.2 PRISM ADAPTATION TASK ..................................................................................................... 61
4.2.1 Spatial properties ............................................................................................................ 61
4.2.2 Temporal properties ........................................................................................................ 65
4.3 PRISM DE-ADAPTATION TASK ............................................................................................... 75
4.3.1 Spatial properties ............................................................................................................ 75
4.3.2 Temporal properties ........................................................................................................ 76
4.4 COMPARISON OF BASELINE, PRISM ADAPTATION AND DE-ADAPTATION ................................. 83
4.4.1 Comparison of movement duration across the three blocks ........................................... 83
4.4.2 Comparison of the magnitude of adaptation and de-adaptation ..................................... 84
4.5 REALIGNMENT TASKS ........................................................................................................... 85
4.5.1 Wilkinson's additivity model ............................................................................................ 88
CHAPTER 5 DISCUSSION AND FUTURE DIRECTIONS ........................................................................... 90
5.1 JUSTIFICATION OF THE EXPERIMENTAL PARADIGM ................................................................ 90
5.2 THE PRISM ADAPTATION TASK .............................................................................................. 92
5.2.1 Spatial properties ............................................................................................................ 92
5.2.2 Temporal properties ........................................................................................................ 94
5.3 COMPARISON OF PRISM ADAPTATION AND DE-ADAPTATION .................................................. 99
5.4 SPATIAL REALIGNMENT AND WILKINSON'S ADDIVITY MODEL ........................................... 100

vii
5.4.1 Considerations for Additivity in visually-normal controls ............................................ 100
5.4.2 Considerations for Addivity in anisometropic amblyopia ............................................. 101
5.5 ARE THE FINDINGS DUE TO MORE THAN JUST VISUAL ACUITY? ............................................ 103
5.6 INSIGHT INTO THE PRISM ADAPTATION PARADIGM .............................................................. 104
5.7 IMPORTANCE OF THIS STUDY .............................................................................................. 105
5.8 CONCLUSION ...................................................................................................................... 106
5.9 FUTURE DIRECTIONS ........................................................................................................... 106
5.9.1 Pointing kinematics during baseline, adaptation & de-adaptation .............................. 106
5.9.2 Visual-haptic integration in amblyopia ......................................................................... 109
5.10 LIMITATIONS ...................................................................................................................... 110
REFERENCES ...................................................................................................................................... 111

viii
List of Tables
TABLE 3-1: CLINICAL DATA FOR ALL PARTICIPANTS.............................................................................. 44
TABLE 4-1: TIME CONSTANT AND R2 VALUES DURING PRISM ADAPTATION. ........................................... 70
TABLE 4-2: TIME CONSTANT AND R2 VALUES DURING PRISM DE-ADAPTATION. ..................................... 80
TABLE 4-3: "SHIFTS" FOR ALL OF THE PARTICIPANTS INCLUDED IN THIS STUDY. .................................... 87

ix
List of Figures
FIGURE 1-1: EXAMPLE OF THE PRISM ADAPTATION PARADIGM ................................................................ 2
FIGURE 1-2: TRANSMISSION OF INFORMATION TO THE VISUAL CORTEX FROM THE EXTERNAL WORLD ..... 4
FIGURE 1-3: RAY DIAGRAM THROUGH A WEDGE PRISM. ........................................................................ 22
FIGURE 1-4: EXPECTED SHIFT IN THE EYE-HEAD REFERENCE FRAME...................................................... 28
FIGURE 1-5: EXPECTED SHIFT IN THE HAND-HEAD REFERENCE .............................................................. 29
FIGURE 1-6: EXPECTED SHIFT IN THE HAND-EYE REFERENCE ................................................................. 30
FIGURE 3-1: EXPERIMENTAL SETUP ON THE VIRTUAL SURFACE APPARATUS (VSA). .............................. 46
FIGURE 3-2: FLOW CHART OF THE PROCEDURE FOR ALL PARTICIPANTS. ................................................ 47
FIGURE 3-3: POINTING WITH FEEDBACK (PRISM ADAPTATION BASELINE) TASK...................................... 48
FIGURE 3-4: OPEN LOOP POINTING (TOTAL SHIFT TASK) ........................................................................ 49
FIGURE 3-5: VISUAL STRAIGHT AHEAD (VISUAL SHIFT TASK) ................................................................ 50
FIGURE 3-6: STRAIGHT AHEAD BLIND POINTING (PROPRIOCEPTIVE SHIFT TASK) .................................... 51
FIGURE 3-7: PRISM ADAPTATION TASK DURING EARLY (A) AND LATE (B) TRIALS ................................. 52
FIGURE 3-8: PRISM DE-ADAPTATION TASK DURING EARLY (A) AND LATE (B) TRIALS. ........................... 53
FIGURE 3-9: SAMPLE CALCULATION FOR NORMALIZED MAGNITUDE OF ADAPTATION ............................ 56
FIGURE 3-10: REPRESENTATIVE DATA FOR ONE VISUALLY-NORMAL CONTROL DEPICTING THE
EXPONENTIAL FIT ANALYSIS (A) AND BINNING ANALYSIS (B) ....................................................... 57
FIGURE 3-11: SAMPLE CALCULATION FOR THE "SHIFTS" IN REFERENCE FRAMES ................................... 58
FIGURE 4-1: GROUP MEAN ACCURACY (A) AND PRECISION (B) FOR THE BASELINE BLOCK. ................... 60
FIGURE 4-2: COMPARISON OF POINTING ACCURACY (A) AND POINTING PRECISION (B) TO DIFFERENT
TARGET POSITIONS ........................................................................................................................ 61
FIGURE 4-3: MEAN NORMALIZED MAGNITUDE OF ADAPTATION ............................................................. 62
FIGURE 4-4: COMPARISON OF THE INITIAL POINTING ERROR .................................................................. 63
FIGURE 4-5: RESULTS OF THE ANALYSIS PERFORMED ON POINTING ACCURACY TO DIFFERENT TARGET
POSITIONS. .................................................................................................................................... 64

x
FIGURE 4-6: PRECISION OF MOVEMENTS TO THE VARIOUS TARGET POSITIONS. ...................................... 65
FIGURE 4-7: EXPONENTIAL FITS FOR 11 VISUALLY-NORMAL CONTROLS (BLUE) AND SEVEN PEOPLE WITH
ANISOMETROPIC AMBLYOPIA (RED). .............................................................................................. 68
FIGURE 4-8: COMPARISON OF MEAN TIME CONSTANT VALUES. .............................................................. 69
FIGURE 4-9: AVERAGED BINNED DATA FOR ADAPTATION FOR ALL PARTICIPANTS ACROSS THE TWO
EXPERIMENTAL GROUPS. ............................................................................................................... 71
FIGURE 4-10: SAMPLE CALCULATION OF MEAN RESIDUAL DISTANCE FROM LINEAR FUNCTION .............. 72
FIGURE 4-11: COMPARISON OF THE MEAN OF RESIDUALS AT THE BEGINNING (TIME CONSTANT + 2) AND
END OF ADAPTATION (LAST 10 TRIALS OF THE ADAPTATION BLOCK). ............................................ 73
FIGURE 4-12: RELATION BETWEEN TIME CONSTANT AND MEAN OF RESIDUALS. .................................... 74
FIGURE 4-13: COMPARISON OF NORMALIZED MAGNITUDE OF DE-ADAPTATION BETWEEN THE TWO
GROUPS. ........................................................................................................................................ 75
FIGURE 4-14: POINTING ACCURACY (A) AND PRECISION (B) TO EACH TARGET POSITION DURING THE
PRISM ADAPTATION TASK .............................................................................................................. 76
FIGURE 4-15: EXPONENTIAL DECAY FUNCTIONS FOR THE DE-ADAPTATION BLOCK FOR VISUALLY-
NORMAL CONTROLS (BLUE) AND PEOPLE WITH ANISOMETROPIC AMBLYOPIA (RED). ...................... 79
FIGURE 4-16: TIME CONSTANT COMPARISON FOR THE DE-ADAPTATION BLOCK. .................................... 81
FIGURE 4-17: GLOBAL EXPONENTIAL DECAY FITS FOR THE CONTROL (BLUE) AND AMBLYOPIA (RED)
GROUPS DURING PRISM DE-ADAPTATION. ...................................................................................... 81
FIGURE 4-18: AVERAGED BINNED DATA FOR DE-ADAPTATION FOR ALL PARTICIPANTS ACROSS THE TWO
EXPERIMENTAL GROUPS. ............................................................................................................... 82
FIGURE 4-19: COMPARISON OF THE NORMALIZED MAGNITUDE OF ADAPTATION AND DE-ADAPTATION
POOLED ACROSS GROUPS. .............................................................................................................. 84
FIGURE 4-20: RELATION BETWEEN NORMALIZED MAGNITUDE OF ADAPTATION AND DE-ADAPTATION ... 85
FIGURE 4-21: TOTAL, VISUAL AND PROPRIOCEPTIVE SHIFT POOLED ACROSS THE TWO GROUPS. ............. 86
FIGURE 4-22: COMPARISON OF REALIGNMENT AFTEREFFECTS BETWEEN LITERATURE, CONTROL AND
ANISOMETROPIC AMBLYOPIA VALUES. .......................................................................................... 88
FIGURE 4-23: COMPARISON OF THE |TOTAL| SHIFT WITH THE |SUMMED| SHIFTS. ..................................... 89

xi
List of Abbreviations
3D Three-dimensional
AD Alzheimer's Disease
aIPS Anterior Intraparietal Sulcus
CNS Central Nervous System
CRT Cathode Ray Tube
D Diopter
FSR Force Sensitive Resistor
HD Huntington's Disease
IPS Intraparietal Sulcus
LGN Lateral Geniculate Nucleus of the Thalamus
MD Monocular Deprivation
mIPS Medial Intraparietal Sulcus
MLE Maximum Likelihood Estimation
mOPJ Medial Occipital-Parietal Junction
MRI Magnetic Resonance Imaging
ND Neutral Density
OC Optotrak Certus
OD Ocular Dominance
xii
PD Parkinson's Disease
PET Positron Emission Tomography
POS Parietal Occipital Sulcus
PPC Posterior Parietal Cortex
PRR Parietal Reach Region
SPL Superior Parietal Lobule
STG Superior Temporal Gyrus
STS Superior Temporal Sulci
V1 Primary Visual Cortex
VA Visual Acuity
VSA Virtual Surface Apparatus

1
Chapter 1 Introduction
1.1 General Introduction
Amblyopia, or "lazy-eye", is a neurodevelopmental disorder of vision that is characterized by a
unilateral (albeit sometimes bilateral) reduction in best-corrected visual acuity (Holmes &
Clarke, 2006). The deficits associated with amblyopia are not the result of a structural pathology
of the eye itself (von Noorden, 1977), rather the locus of amblyopia is the primary visual cortex
(V1; Algaze, Roberts, Leguire, Schalbrock, & Rogers, 2002) and may extend to the extra-striate
visual pathways (Barnes, Hess, Dumoulin, Achtman, & Pike, 2001).
The extensive range deficits within the visual system have been and continue to be an area of
interest for researchers studying amblyopia. However, there has been recent evidence to suggest
that visuomotor function may also be impaired. For example, it has been demonstrated that
people with amblyopia display deficits in movement initiation and execution during prehension
(Grant, Melmoth, Morgan, & Finlay, 2007; Suttle, Melmoth, Finlay, Sloper, & Grant, 2011), and
have adopted alternate kinematic strategies, namely an increased acceleration phase and
decreased peak velocity/acceleration during a single motor action, to attain a similar precision
and accuracy to visually-normal controls on a simple pointing task during binocular viewing
(Niechwiej-Szwedo, Goltz, Chandrakumar, Hirji, Crawford, et al., 2011).
All actions, whether in the oculomotor or manual motor domain, are under adaptive control
where behaviour of the muscles are modified in response to small perturbations in the external
sensory environment. In this way, accurate motor actions to intended visual targets are
accomplished (Crawford, Medendorp, & Marotta, 2004). The visual system is often the most
reliable (least variable) sense and is therefore often used to coordinate and initiate these adaptive
changes in motor output (Ernst & Bülthoff, 2004; Goodale, 2011). Interestingly, Raashid, Wong,
Chandrakumar, Blakeman, and Goltz (2013) have demonstrated that visuomotor adaptation is
impaired in the oculomotor system in amblyopia as evidence by a decreased ability to adapt
saccadic eye movements to an external perturbation in the visual environment.

2
The purpose of this thesis was to examine adaptation of the manual motor system in amblyopia
to a change in the external visual environment. This way a conclusion can be made about
visuomotor adaptation in amblyopia in general - is saccadic adaptation a special case or do these
deficits extend to the manual motor system as well? The experimental manipulation used to
assess the adaptive ability of the manual motor system in amblyopia to a change in the external
visual environment was prism adaptation.
Modification of limb trajectory in response to optically displacing wedge prisms is a well-
established method of sensorimotor adaptation. Prism adaptation involves adapting the motor
system to a novel spatial environment via a shift of the visual world (Fernandez-Ruiz & Diaz,
1999). For instance, when a subject points to a visual target while wearing wedge prisms that
displace the optical world to the left, an initial pointing error to the left of the target occurs. In
the presence of visual feedback and with repeated target pointing, this error decreases rapidly,
eventually reaching a plateau phase with a similar precision and accuracy to baseline pointing
(Figure 1-1). If the same task is repeated after the prisms are removed, a pointing error in the
opposite direction occurs, in this case to the right, before the error decreases again (Fernandez-
Ruiz & Diaz, 1999; Figure 1-1).
Figure 1-1: Example of the prism adaptation paradigm showing the baseline, adaptation and de-adaptation blocks in response to left-shifting prisms.

3
1.2 Transduction of visual information and visual development
1.2.1 Visual transduction
Transduction and processing of visual stimuli from the external world begins when light strikes
the retina located at the back of the eye. Depending on the type of visual information used to
initiate signal transduction, the retina relays information to the retinal ganglion cells which
project to four distinct structures: 1) the suprachiasmatic nucleus which controls diurnal rhythms
(Sollars et al., 2003); 2) the pretectum which modulates pupillary response (Purves, 2012a); 3)
the superior colliculus for the control of eye movements (Daw, 2006); and 4) the lateral
geniculate nucleus of the thalamus (LGN) which projects to the striate cortex and is involved in
mediating vision and visual perception (Fujita et al., 2001). The pathway involved in relaying
information to the LGN is referred to as the retinogeniculostriate, or more simply, primary visual
pathway (Daw, 2006; Purves, 2012a).
1.2.1.1 The retinogeniculostriate visual pathway
The information from retinal ganglion cells is first past to the lateral geniculate nucleus of the
thalamus (LGN) during transduction through the primary visual pathway. The LGN is commonly
referred to as a "relay" component of the primary visual pathway, however it has been shown
that the LGN is actually involved in processing of the visual signal (Derrington, 2001; Piscopo,
El-Danaf, Huberman, & Niell, 2013; Seim, Valberg, & Lee, 2012). The LGN then transmits the
processed visual signal to V1, or striate, cortex (Daw, 2006).
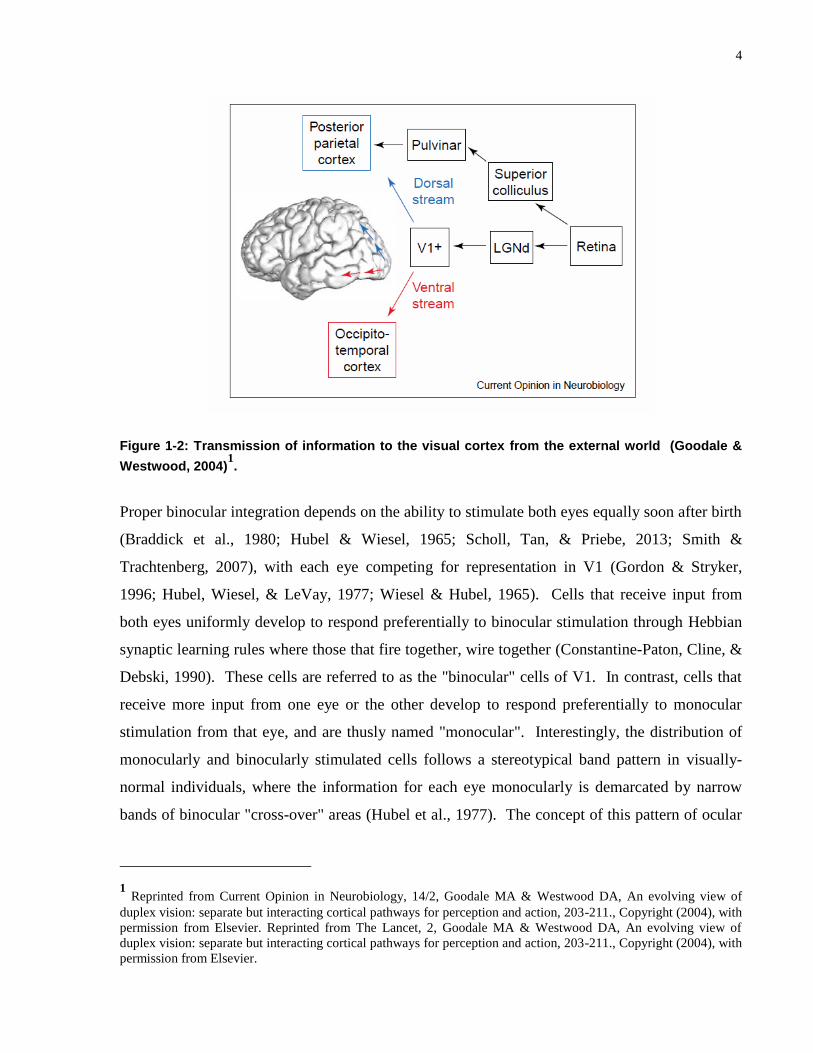
Information entering V1 from the LGN enters at layer 4c. This is the thickest layer of the six
comprising the primary visual cortex. At layer 4c, the information is still separate coming from
the left and right eye so that the input is monocular to this layer. As the input from the two eyes
is relayed to layers above and below 4c, these signals integrate and require binocular input, or
information from the two eyes together, to function and develop properly (Purves, 2012a).
4
Figure 1-2: Transmission of information to the visual cortex from the external world (Goodale &
Westwood, 2004)1.
Proper binocular integration depends on the ability to stimulate both eyes equally soon after birth
(Braddick et al., 1980; Hubel & Wiesel, 1965; Scholl, Tan, & Priebe, 2013; Smith &
Trachtenberg, 2007), with each eye competing for representation in V1 (Gordon & Stryker,
1996; Hubel, Wiesel, & LeVay, 1977; Wiesel & Hubel, 1965). Cells that receive input from
both eyes uniformly develop to respond preferentially to binocular stimulation through Hebbian
synaptic learning rules where those that fire together, wire together (Constantine-Paton, Cline, &
Debski, 1990). These cells are referred to as the "binocular" cells of V1. In contrast, cells that
receive more input from one eye or the other develop to respond preferentially to monocular
stimulation from that eye, and are thusly named "monocular". Interestingly, the distribution of
monocularly and binocularly stimulated cells follows a stereotypical band pattern in visually-
normal individuals, where the information for each eye monocularly is demarcated by narrow
bands of binocular "cross-over" areas (Hubel et al., 1977). The concept of this pattern of ocular
1 Reprinted from Current Opinion in Neurobiology, 14/2, Goodale MA & Westwood DA, An evolving view of
duplex vision: separate but interacting cortical pathways for perception and action, 203-211., Copyright (2004), with
permission from Elsevier. Reprinted from The Lancet, 2, Goodale MA & Westwood DA, An evolving view of
duplex vision: separate but interacting cortical pathways for perception and action, 203-211., Copyright (2004), with
permission from Elsevier.

5
dominance (OD) in the primary visually cortex was initially coined by Hubel and Wiesel in their
Nobel prize winning work beginning in the early 1960's.
Approximately 70% of the neurons projecting to the striate cortex will innervate binocularly
driven cells (Wright, 2006). When binocularity is affected by some pathology (see section 1.3
Amblyopia: the result of abnormal visual input in early life), the cross-over areas within the OD
columns of V1 essentially disappear (Horton & Hocking, 1996; Horton, Hocking, & Kiorpes,
1997). This leads to a loss of stereopsis and optimal binocular vision (Hubel et al., 1977).
Therefore, proper binocular stimulation soon after birth is required for typical visual
development (Wright, 2006). The period of time in which the development of the visual system
occurs is termed the visual critical period (Hubel & Wiesel, 1962; see section 1.2.2.2 The visual
critical period).
Once information leaves the visual cortex, additional processing of the signal occurs along the
extra-striate visual association areas at the temporal (ventral stream) and parietal (dorsal stream)
lobes (Hebart & Hesselmann, 2012). The ventral visual stream, or "vision-for-perception"
pathway, extends from the occipital to the temporal lobe. It is thought to be mainly involved in
the recognition and discrimination of object shape and form in space (Hebart & Hesselmann,
2012). The dorsal visual stream, or "vision-for-action" pathway, extends from the occipital to the
parietal lobe. This processing area is primarily involved in both the perceptual detection of
motion (Atkinson et al., 2006) and visually-guided movements including grasping (Culham et
al., 2003; Hebart & Hesselmann, 2012) and prehension (Goodale, 2011) through recognition of
object position in space (Goodale & Milner, 1992).

6
1.2.2 Visual development
1.2.2.1 Critical periods of development
A critical period is generally defined as an period of increased neuronal plasticity where
exposure to different stimuli can result in major and often permanent rewiring of the brains
neural connections (Katz, 1999). Critical periods have now been identified for several sensory
systems including audition (Niparko et al., 2010), vision (Blakemore & Cooper, 1970; Hubel &
Wiesel, 1965; Hubel et al., 1977; LeVay, Wiesel, & Hubel, 1980; Sengpiel, Stawinski, &
Bonhoeffer, 1999; Wiesel & Hubel, 1963b), olfaction (Tsai & Barnea, 2014) the vestibular
system (Eugene, Deforges, Vibert, & Vidal, 2009) and somatosensation (see review by O'Leary,
Ruff and Dyke, 1994). Critical periods have also been identified for the motor system (Friel,
Chakrabarty, Kuo, & Martin, 2012; Soiza-Reilly, Fossati, Ibarra, & Azcurra, 2004; Walton,
Lieberman, Llinas, Begin, & Llinas, 1992) and other cognitive functions such as memory (Deng,
Saxe, Gallina, & Gage, 2009; Shors et al., 2001; Snyder, Hong, McDonald, & Wojtowicz, 2005),
and language acquisition (Hakuta, Bialystok, & Wiley, 2003; Johnson & Newport, 1989; Snow
& Hoefnagel-Hohle, 1978).
1.2.2.2 The visual critical period
During the critical period, the visual cortex is highly modifiable and depends on the influence of
normal visual stimuli in order to develop properly (Katz, 1999; Wright, 2006). Wiesel and
Hubel (1963a) showed that when kittens are reared with one eye sutured shut, or in a
monocularly deprived (MD) state, there is a dramatic modification of the function and
histological morphology of OD columns in the primary visual cortex. The sutured eye is not
privy to external visual stimuli, thus decreasing its representation in the "binocular" and
"monocular" columns of V1. MD ultimately results in an over representation of the non-sutured,
or fellow eye in the striate cortex (Hubel et al., 1977).
Some of the noted deficits associated with abnormal visual stimulation during early post-natal
life, for example by MD, include decreased contrast sensitivity, loss of stereopsis or three-
dimensional (3D) vision and decreased visual acuity in the deprived eye (McKee, Levi, &

7
Movshon, 2003). Each one has a slightly different, yet overlapping critical period of
development.
Visual acuity (VA) improves rapidly after birth and continues to develop throughout adolescence
to about age 15 (Leat, Yadav, & Irving, 2009); however, it is comparable to adults by age three
when single letters are used to assess thresholds (Heron, Dholakia, Collins, & McLaughlan,
1985). Similarly, stereopsis improves over time, beginning at about 3-4 months of age and
develops rapidly to about age 15 (Heron et al., 1985).
Although controversial, it is generally agreed that the visual critical period occurs between 1
week and 3 months of age (Wright, 2006). This said, it has been demonstrated that children are
susceptible to abnormal visual development up through the age of seven or older, an epoch
termed the sensitive period of visual development (Keech & Kutschke, 1995; Lewis & Maurer,
2005). It is therefore imperative that there is normal visual stimulation during the critical and
sensitive periods of development to ensure proper formation of the visual transduction pathways.

8
1.3 Amblyopia
Amblyopia is a disorder of vision that results as a consequence of decreased afferent input to the
visual cortex during the critical/sensitive period of visual development. Amblyopia refers to
anomalous maturation of the visual system that occurs secondary to atypical visual stimulation
during early childhood (Wright, 2006). The development of amblyopia is most often associated
with the presence of anisometropia, defined as an interocular difference in refractive error, or
more simply a difference in the ability of the two eyes to focus light on the retina (Gupta, 2008),
strabismus (eye-misalignment), or a mixed mechanism of the two (Wright, 2006). On rare
occasion, amblyopia can also result as a consequence of deprivation due to significant opacity of
the cornea which prevents light from stimulating the retina in early life (e.g. congenital cataract)
or due to physical occlusion of the eye by way of a congenital ptosis (drooping eyelid; Wong,
2014).
Amblyopia is a neurodevelopmental disorder that has no causal pathology associated with the
eye itself (von Noorden, 1977) as such, optical correction cannot alleviate its associated
symptoms. This means that prescription glasses alone cannot result in the recovery of normal
vision in people with amblyopia. Rather, the spatial and temporal visual deficits associated with
amblyopia result as a consequence of dysfunction in visual processing as early as V1 (Barnes et
al., 2001) extending up through the extra-striate visual areas, located along the parietal and
temporal lobes (Simmers, Ledgeway, Mansouri, Hutchinson, & Hess, 2006).
1.3.1 Neural correlates of the amblyopic deficits
The first indication that the locus of the amblyopic deficit begins at the level of V1 was
established by obtaining single cells recordings of the cat striate cortex after early childhood
MD. Using electrophysiological analysis, Wiesel and Hubel (1963b) found that the majority of
cells in the primary visual cortex in kittens reared in a MD state were driven by the fellow eye, or
non-monocularly deprived eye, whereas ~1% of cells recorded were stimulated in response to
amblyopic eye viewing of their patterned visual stimulus.
Additionally, Wiesel and Hubel (1963a) discovered that LGN appeared deprived upon
histological examination of the kitten reared in a MD state. It was hypothesized that this was due

9
to retrograde atrophy resulting from decreased input to the LGN from the primary visual cortex
(Wiesel & Hubel, 1963a). Cells within the LGN compete for synaptic connections in V1 during
development, and the strength of these connections depends on normal visual stimulation during
early childhood. When MD is present soon after birth, the binocular competition for regular
geniculate growth is disrupted, resulting in an atrophied appearance of the LGN in the layers
supplied by the deprived eye (Guillery, 1972). This same result of abnormal histological
morphology of the LGN in amblyopia has been demonstrated in both the monkey (von Noorden,
1973; von Noorden & Middleditch, 1975) and human (von Noorden & Crawford, 1992) model
of the disease, where cell shrinkage is observable in the layers of the LGN supplied by the
amblyopic eye.
In addition to the single cell recordings, additional evidence for a cortical locus involved in
amblyopia has been demonstrated via high resolution imaging studies.
Functional magnetic resonance imaging systems allow for high-resolution images of both
shallow and deep brain structures to be obtained with relative ease, and therefore have been used
extensively to study amblyopia in living human beings. One of the main findings of these
studies demonstrates that cortical cells of V1 are preferentially affected by abnormal visual
stimulation in early life, and this deficit is most prominent during amblyopic eye viewing
(Algaze et al., 2002; Barnes et al., 2001; Choi et al., 2001). Additionally, fMRI has provided the
first evidence of a shift in OD towards the fellow eye during normal visual stimulation the
human model of amblyopia (Goodyear, Nicolle, & Menon, 2002).
Based on psychophysical data such as the contrast sensitivity deficit (Nordmann, Freeman, &
Casanova, 1992), spatial and temporal crowding (Bonneh, Sagi, & Polat, 2007), and abnormal
detection of motion defined form (Giaschi, Regan, Kraft, & Hong, 1992), it was hypothesized
that the extra striate visual processing areas are also affected in amblyopia (Kiorpes, Kiper,
O'Keefe, Cavanaugh, & Movshon, 1998). Functional imaging has been able substantiate this
idea by demonstrating that there is generalized decreased activation of areas V1-V5 as well as at
the ventral and dorsal visual streams (Barnes et al., 2001; Li, Dumoulin, Mansouri, & Hess,
2007). More specifically, decreased glucose metabolism at the inferior temporal (ventral
stream) and superior parietal (dorsal stream) lobules has been demonstrated by positron emission
tomography (PET) in amblyopia (Choi et al., 2002).
10
1.3.2 Classifications
Amblyopia is typically segregated into four main classifications based on its associated etiology:
deprivation, anisometropia, strabismus, and a mix of both strabismus and anisometropia (McKee
et al., 2003). These etiologies have been demonstrated to cause amblyopia, but have also been
shown to come about as a consequence of amblyopia (Birch & Swanson, 2000; Kiorpes &
Wallman, 1995; Lepard, 1975). This indicates that there a complex relationship between
amblyopia and strabismus/anisometropia/deprivation in early childhood (McKee et al., 2003).
1.3.2.1 Anisometropic amblyopia
Anisometropia is defined as a difference in refractive power between the two eyes (The Pediatric
Eye Disease Investigator Group, 2006). If anisometropia is present during the sensitive period of
visual development, it is possible that it may be associated with amblyopia. If amblyopia does
occur, it will do so as a result of monocular suppression of one eye, typically the more hyperopic
eye (Wright, 2006) to prevent conflicting binocular information from reaching the visual cortex
(Wensveen, Harwerth, & Smith, 2001). Anisometropic amblyopia is harder to diagnose as there
is generally no observable oculomotor deficit such as an eye-misalignment associated with it
(Wright, 2006).
1.3.2.2 Strabismic amblyopia
Strabismus refers to misalignment of the two eyes. One eye can be turned nasally (esotropia),
temporally (exotropia), upwards (hypertropia) or downwards (hypotropia) while the other fixates
centrally (Granet & Khayali, 2011). The chance of developing amblyopia as a result of early
childhood strabismus increases if one eye is preferentially affected, rather than alternating
fixation between the two eyes (Sireteanu, 1982). Clinical suppression of one eye is involved in
the development of amblyopia as a result of early childhood strabismus. In this case, cortical
suppression is useful to prevent diplopia, or double vision, that would result in confusion if the
two images reached and were processed by the primary visual cortex concurrently (Wong, 2011).

11
1.3.2.3 Deprivational amblyopia
Deprivational amblyopia occurs as a result of partial or complete occlusion of one eye during
early childhood (Mansouri, Stacy, Kruger, & Cestari, 2013). The most common causes of
deprivational amblyopia are congenital cataract (Mansouri et al., 2013), resulting in increased
opacity of the cornea and thus decreased interaction with the visual environment (Wong, 2014)
and congenital ptosis (drooping eye lid; Griepentrog, Diehl, & Mohney, 2013; Wong, 2014). It
is the least common form of the disease, especially in the Western world as the occlusion is
typically addressed early in life; however, it results in the deepest form of amblyopia when
present (Simon & Kaw, 2001).
1.3.3 Deficits
There is a vast range of deficits associated with amblyopia, in both perceptual and motor
responses to visual stimuli. These will be discussed in detail below.
1.3.3.1 Deficits in spatial vision
Spatial vision refers the ability of the visual system to integrate and assess visual stimuli in
spatially distinct locations. In other words it refers to the ability of the visual system to locate and
detect an object's position in space (De Valois & De Valois, 2002).
Decreased visual acuity in amblyopia has been well documented throughout the literature for a
number of decades. Decreased optotype acuity, or the ability to discern optotypes (commonly
letters) of different sizes in the amblyopic, but not fellow eye is generally the first indicator that
amblyopia may be present (Bonneh, Sagi, & Polat, 2004; McKee et al., 2003; The Pediatric Eye
Disease Investigator Group, 2002). Additionally, deficits in Vernier/hyperacuity, as measured
by the threshold required to detect a horizontal offset between two vertical lines placed above
one another, have been identified in amblyopia. (Bradley & Freeman, 1985; Kiorpes, Kiper, &
Movshon, 1993; Levi & Klein, 1982a, 1985). Lastly, grating acuity, or the ability to discern the
direction of alternating black and white stripes of varying spatial frequencies has been
demonstrated to be affected by amblyopia (Kiorpes et al., 1993; Levi & Klein, 1985; McKee et
al., 2003).

12
People with amblyopia exhibit decreased contrast sensitivity in the affected eye, most often for
high spatial frequency stimuli (Abrahamsson & Sjostrand, 1988; Levi & Harwerth, 1977), but
this deficit has also been shown in strabismic amblyopia for low spatial frequency gratings (Hess
& Howell, 1977). More subtle contrast sensitivity deficits have also been established for the
fellow eye, indicating that the eye with normal visual acuity displays amblyopic deficits that
differ significantly from visually-normal controls (Leguire, Rogers, & Bremer, 1990).
Amblyopia has long been associated with a loss of stereopsis, or 3D vision, due to a lack of
response from improperly stimulated binocular cells during the critical period of development
(Hubel & Wiesel, 1962). It has been shown that people with amblyopia have decreased (Wallace
et al., 2011) or absent (Birch, 2013) stereo-vision. This said, there is a definite spectrum of
binocular visual loss with its presentation strongly related to the etiology of the deficit (Wright,
2006; see section 1.3.5 Differences among the amblyopic subtypes).
With respect ventral visual stream processing, people with amblyopia exhibit impaired global
processing of orientation (Husk & Hess, 2013), global shape detection (Dallala, Wang, & Hess,
2010; Hess, Wang, Demanins, Wilkinson, & Wilson, 1999), global shape discrimination (Jeffrey,
Wang, & Birch, 2004), spatial localization in both the affected (Fronius, Sireteanu, & Zubcov,
2004; Hess & Holliday, 1992) and fellow eye (Levi & Klein, 1985), global contour processing
(Levi, Yu, Kuai, & Rislove, 2007) and spatial crowding (Bonneh et al., 2004, 2007; Levi &
Klein, 1985). Additionally, along the dorsal stream, people with amblyopia display perceptual
deficits in the detection of global motion (Ho et al., 2005; Simmers, Ledgeway, Hess, &
McGraw, 2003; Simmers et al., 2006). It is unclear whether these deficits result as a
consequence of amplification of the decreased signal from V1 or if there is actual dysfunction at
these cortical loci (Kiorpes, 2006; Levi, 2006).
1.3.3.2 Deficits in temporal vision
In addition to the issues in spatial vision outlined above, deficits in temporal vision have also
been identified for people with amblyopia. Temporal vision refers to the ability of the visual
system to process and integrate visual stimuli over time (Bonneh et al., 2007).
It has been shown previously that people with amblyopia exhibit dysfunction on temporal
integration tasks (Altmann & Singer, 1986; Huang, Li, Deng, Yu, & Hess, 2012). For example,

13
Huang et al. (2012) demonstrated that people with amblyopia display temporal synchrony
deficits. This was observed via decreased sensitivity of both the amblyopic and fellow eyes to
discrimination of visual stimuli presented 180° out of phase compared to three other synchronous
flashing dots.
Temporal crowding has also been identified as a perceptual deficit in people with amblyopia.
Bonneh et al. (2007) showed that rapidly presented simple visual stimuli (large black digits on a
grey background) affected visual acuity in strabismic amblyopia significantly more than in
anisometropic amblyopia or visually-normal controls.
Other temporal visual deficits in amblyopia have been identified for temporal contrast sensitivity
tasks in both strabismic and anisometropic amblyopia (Ellemberg, Lewis, Maurer, & Brent,
2000; Wesson & Loop, 1982), an inability to detect motion-defined form in both the affected
(Hayward, Truong, Partanen, & Giaschi, 2010) and fellow eyes (Giaschi et al., 1992; Hayward
et al., 2010), as well as increased latency in response to visual stimuli. This has been
demonstrated by increased reaction time when completing a perceptual task, especially during
amblyopic eye viewing (Hamasaki & Flynn, 1981; Loshin & Levi, 1983), increased saccadic
latencies (Niechwiej-Szwedo, Goltz, Chandrakumar, Hirji, & Wong, 2010; Raashid et al., 2013)
and increased neuronal latencies of visual evoked potentials (Davis et al., 2003).
1.3.3.3 Motor deficits
Although a wide range of perceptual deficits are still being investigated, recently there has been
some interest in elucidating the effect of abnormal vision in amblyopia on motor control.
Generally, vision is used to calibrate the motor system to allow for accurate movements to an
intended target. Vision is required to encode the position and location of the object via the
ventral visual stream. Vision is then responsible for online correction of the movement by way
of the dorsal visual stream (Goodale, 2011). If this visual sensory signal is abnormal, presumably
the motor output and the online correction of the movement would be affected. Grant et al.
(2007) found this by showing that adult participants with amblyopia exhibit subtle deficits in
movement planning and more pronounced issues with movement execution. More specifically,
they showed that people with amblyopia display significantly longer movement execution times
as well as more errors upon reaching the target. Subsequently, Suttle et al. (2011) found that

14
independent of the etiology of amblyopia, children who suffer from this disorder required much
more time to execute the intended movement, made many more errors upon reaching the target
and did not show a binocular advantage, where viewing binocularly improves precision and
accuracy of motor action than viewing monocularly, as was seen in age-matched visually-
normal controls. These studies provided evidence that there is visuomotor dysfunction in
amblyopia; however the extent to which it affects these participants in the real world has yet to
be determined.
Niechwiej-Szwedo et al. (2010) found that people with anisometropic amblyopia exhibited
longer latency and less precise saccades when asked to point to a visual target as compared to
visually-normal controls. However, these participants were able attain a similar accuracy and
precision on a simple pointing task during binocular and fellow eye viewing by altering the
kinematics of their pointing movements. Specifically, people with amblyopia prolonged the
acceleration phase and decreased the peak acceleration and velocity during pointing movements
to a visual target under conditions of continuous feedback of limb position in space (Niechwiej-
Szwedo, Goltz, Chandrakumar, Hirji, & Wong, 2011). It was also found that people with
amblyopia displayed reduced precision during the motor planning stage of limb movements, as
evidenced by increased variability of reach during the first 50-100 ms of movement, or in other
words during the early phase of reach trajectory. Additionally, deficits in online correction of
movements were found in patients with severe amblyopia by demonstrating that they displayed
significantly higher end point variability at the terminus of movement, as well as a higher co-
efficient of determination (R2) for the relationship of spatial position of the arm at different
intervals (every 10%) with its final position (Niechwiej-Szwedo, Goltz, Chandrakumar, &
Wong, 2012). Taking these two lines of evidence together, it was surmised that people with
severe amblyopia are relying more on pre-programmed responses during visually-guided
reaching, as opposed to using online visual feedback information to alter and correct the motor
command within the trajectory (Heath, 2005; Niechwiej-Szwedo, Goltz, et al., 2012).
Raashid et al. (2013) found that people with anisometropic amblyopia had a decreased ability to
adapt to an intrasaccadic target step when viewing both binocularly and with the amblyopic eye.
More simply, the authors found that people with amblyopia could not compensate as well as
visually-normal controls for a target that changed positions (jumped ~4˚ backward) after the
initiation of the primary saccade. This was the first indication that the adaptive ability of the

15
amblyopic motor system to a discordant visual signal may be dysfunctional. More specifically,
this study demonstrated that people with amblyopia display decreased saccadic gain, or reduced
ability to change the spatial properties of their saccades during adaptation when the amblyopic
eye is involved (i.e. during binocular and monocular amblyopic eye stimulation). However, a
similar time course of adaptation was observed across viewing conditions as compared to
visually-normal controls, indicating only spatial properties of vision are affected by this
experimental manipulation in amblyopia.
1.3.4 Deficits may be explained by increased internal visual "noise" and spatial undersampling of visual neurons at the striate cortex
Normally, there is a certain amount endogenous noise introduced into all sensory systems that is
compensated for when interacting with the real world (Kelly & O'Connell, 2013). In the case of
vision, normal perception depends on proper noise relations between visual neurons, the amount
of noise present during processing of the sensory stimuli, as well as the number of neurons
recruited for the perception of visual stimuli (Cohen & Newsome, 2009; Shadlen, Britten,
Newsome, & Movshon, 1996). If there abnormal noise correlation between neurons in the visual
system, increased endogenous variability at the processing stages of the visual signal, and/or
spatial undersampling, i.e. a decreased number of recruited neurons after a visual stimulus is
presented, normal visual perception could not occur. Interestingly, it is possible that many of
the deficits observed in amblyopia can be explained by these factors.
Behavioural evidence has demonstrated that introducing dynamic, exogenous noise to the grating
stimuli of visually-normal participants produced elevated contrast thresholds similar to
amblyopic observers (Loshin & Levi, 1983). Additionally, it has been shown that people with
amblyopia display significantly greater fraction of stimulus dependent internal noise as
compared to visually-normal controls (Levi & Klein, 2003). This was demonstrated by a double-
pass experiment where participants performed an identical task two times, and the difference
between the performance on these two trials was taken as a measure of the relative amount of
internal noise. People with amblyopia demonstrated a fraction of internal visual noise of 75%,
where as visually-normal observers displayed one of only ~30%. In the motor domain, longer
latency and less precise saccades in amblyopia have been demonstrated due to slower visual

16
processing visual information from the environment (Niechwiej-Szwedo et al., 2010; Raashid et
al., 2013). Moreover, impaired saccadic adaptation presumably due to decreased precision of the
visual error signal driving adaptation (Raashid et al., 2013), and fixation instability (Gonzalez,
Wong, Niechwiej-Szwedo, Tarita-Nistor, & Steinbach, 2012) have been demonstrated in
amblyopia.
Spatial undersampling has also been proposed as a possible mechanism underlying the deficits
associated with amblyopia. Based on early work demonstrating the shift of OD in artificially
induced amblyopia away from binocularity and the affected eye (Hubel & Wiesel, 1965; Hubel
et al., 1977), it has been suggested that there may be reduced neural representation of responsive
neurons in the striate cortex, or spatial undersampling at V1, of animals reared with the various
amblyogenic factors (Levi, 2013; see section 1.3.2 Classification).
1.3.5 Differences among the amblyopic subtypes
Although all people with amblyopia are subjected to the described deficits (see section 1.3.3
Deficits), the degree to which they are affected and the way in which the decrements manifest
themselves differs across the various subtypes.
People with strabismic and anisometropic amblyopia show differences in the area of the affected
visual field. Strabismic amblyopia displays visual field dependencies with the deficits most
strongly associated with central or foveal vision. In contrast, anisometropic amblyopia is
associated with deficits that are dispersed uniformly across the entire visual field (Hess &
Pointer, 1985; Ikeda & Wright, 1976).
Additionally, people with anisometropic amblyopia display co-varying losses in spatial
resolution whereas strabismic amblyopia does not. For example, when the visual stimulus is
normalized for the amblyopic eye by its grating acuity in anisometropic amblyopia, similar
Vernier acuities in both the amblyopic and fellow eyes are recorded. In contrast, people with
strabismic amblyopia display lower Vernier acuity measurements in the amblyopic eye, even
when normalized for grating acuity. This indicates that there is a scaling affect present in
anisometropic, but not strabismic amblyopia (Levi & Klein, 1982a; McKee et al., 2003).

17
Another discrepancy between the two major types of amblyopia is the spatial localization deficit.
It can be seen that people who suffer from the strabismic subtype display greater difficulty in
spatial localization as measured by the Vernier acuity task. Although people with anisometropic
amblyopia display this deficit as well, it is much more subtle (Levi & Klein, 1982a).
Furthermore, the spatial localization deficit in strabismic amblyopia can be seen in the fellow eye
but this is not the case in the anisometropic subtype (Levi & Klein, 1985).
Finally, many people with the strabismic form of the disease have no stereopsis, whereas people
with anisometropic amblyopia can have some residual binocularity due to peripheral fusion of
the two eyes (Wright, 2006).
1.3.5 Treatment
The gold standard treatment for amblyopia for a number of decades has been patching. Patching
involves occluding the fellow or dominant eye, leaving patients to view the world monocularly
with their amblyopic eye. If successful, patching treatment results in visual acuity improvement
in the affected eye. This has been shown to be most effective in younger children, ages 0-12
years (The Pediatric Eye Disease Investigator Group, 2002), as the visual cortex is still within
the critical and sensitive periods of visual development and is therefore more modifiable (Daw,
1998). In contrast, children aged 13-17 respond to patching treatment to a lesser degree, as
evidenced by a success rate that drops from ~54% to ~25% in the teenage years (The Pediatric
Eye Disease Investigator Group, 2005). Interestingly, there has been increasing evidence that the
brain of people with amblyopia may be plastic well into adult-hood, creating opportunity to treat
people with amblyopia after the critical (and sensitive) period of development has ended (for
comprehensive reviews, see Levi and Li, 2009; Hess and Thompson, 2013). The most
compelling evidence for the ability to improve upon amblyopic deficits in adulthood stems from
dichoptic training with various perceptual learning tasks and video games (Li et al., 2013; Li &
Levi, 2004; Li, Ngo, Nguyen, & Levi, 2011). The perceptual learning and video game tasks
require that both eyes work together to complete the task at hand by modulating the signal to the
fellow eye to make it less or equally reliable to that from the amblyopic eye. If binocularity is
achieved then participants will be successful at completion of the game or task. One noted
example is that of Tetris©
, where participants played the game while wearing anaglyph glasses
and/or used lenticular display. As such, some of the blocks were only presented to the fellow eye

18
and others only to the amblyopic eye. Initially, the contrast of the blocks given to the fellow eye
is low, to allow the amblyopic eye to become equally as reliable as the fellow eye in completion
of the game. Improvements in binocularity were measured by increasing the contrast of the
blocks presented to the fellow eye, i.e. making this signal stronger, and observing that
participants with amblyopia were still able to play the game successfully. Clinical measures of
amblyopia improvement were observed by an overall modest increase in visual acuity of the
amblyopic eye as well as increased stereopsis in amblyopic participants (Li et al., 2013; Li et al.,
2011). This said, there is yet to be a clinical trial to assess the efficacy of the perceptual learning
tasks and/or video games in comparison to patching.
1.3.6 Summary
Amblyopia is a complex disorder resulting in many spatiotemporal deficits along the central
visual pathway, extending from V1 (or even LGN) through the extrastriate visual processing
streams. It is important to characterize all deficits associated with this disorder in order to
understand the true consequences of atypical visual stimulation during early childhood, including
how the amblyopic visual system integrates and adapts to discordance between visual,
proprioceptive and motor information to complete everyday tasks.

19
1.4 Visually-guided reaching
The capacity to complete normal visually guided actions depends upon the ability to process
sensory information about the environment and target of interest and the ability to transform
these data into coherent motor commands (Crawford et al., 2004).
Visually-guided reaching requires the cooperation of many different brain structures that control
both sensory and motor signals. Because visually-guided reaching requires the acquisition of an
intended target, a normally functioning visual cortex is required (Karnath & Perenin, 2005). As
visual information is processed at the striate cortex, it is divided along two separate extrastriate
visual streams. Goodale and Milner (1992) asserted that the ventral stream extending from the
primary visual cortex to the temporal lobe is primarily responsible for object recognition,
whereas the dorsal stream ranging from the visual cortex to the parietal lobe is chiefly involved
in the control of visually-guided actions.
Many structures within the parietal lobe, specifically in the region of the posterior parietal cortex,
are involved in the transformation of sensory information in motor action. Broadmann's area 5,
located posterior to the primary somatosensory cortex, is involved in the conversion of the
external visual information obtained by the primary visual cortex about an intended target into
egocentric reference frames to be used by the motor system (Lacquaniti, Guigon, Bianchi,
Ferraina, & Caminiti, 1995). An analogous structure to the parietal reach region (PRR) initially
identified in the monkey brain (for a review see Andersen and Buneo, 2002), is thought to be
involved in the planning of goal-directed limb movements, but is not activated in response to
oculomotor commands such as saccades (Connolly, Andersen, & Goodale, 2003). Other areas
that have been implicated in visually-guided reaching in the region of the parietal cortex include
the medial occipital-parietal junction (mOPJ; Astafiev et al., 2003; Connolly et al., 2003;
Karnath & Perenin, 2005; Prado et al., 2005), the medial intraparietal sulcus (mIPS; Karnath &
Perenin, 2005; Prado et al., 2005) and the dorsal pre-motor cortex (Prado et al., 2005).
The information is then relayed to the frontal cortex which includes the premotor and primary
motor cortices as well as areas involved in motor planning (Barone & Joseph, 1989;
Constantinidis, Franowicz, & Goldman-Rakic, 2001; Tanji & Hoshi, 2001) and to the cerebellum
to coordinate the intended movement signal (Luaute et al., 2009).

20
As can be seen by the information presented above, a normal visual signal being relayed to the
dorsal stream would be necessary to facilitate proper visually-guided action. In the case of
amblyopia, there is abnormal sensory information being relayed to the parietal lobe in addition to
known deficits in processing of information along the dorsal visual stream (Simmers et al., 2003;
Simmers et al., 2006). As such, it is expected that visually-guided reaching should be affected in
this visual disorder (see section 1.3.3.3 Motor deficits). What has not yet been explored is the
effect of abnormal visual-guided actions on the ability to adapt to the manual motor system to a
perturbation in the visual environment in amblyopia. The next section will introduce this idea of
'sensorimotor adaptation', and describe the well-established experimental paradigm of prism
adaptation that was used to induce sensorimotor adaptation in this population in the current
investigation.

21
1.5 Prism Adaptation
The ability to "adapt", or modify our behaviour to an external perturbation is central to
completing everyday activities in the human world (Crawford et al., 2004). Usually, the visual
system is most reliable in detecting subtle differences in the external environment and is
therefore used to direct and calibrate motor movements (Ernst & Bülthoff, 2004).
Based on observations made by lesion studies, any disease which causes abnormal visually
guided reaching, such as cerebellar ataxia, may result in major decrements in quality of life
(Auerbach & Alexander, 1981; Karnath & Perenin, 2005; Lamotte & Acuna, 1978; Perenin &
Vighetto, 1988). As such, many investigators have experimentally manipulated the visual
environment in visually-normal control participants to better understand the adaptive ability in
the fully functional brain. One of the methods often used for this purpose is prism adaptation.
Compensation for a shift of the visual world induced by wedge prisms is a well-established
method of sensorimotor adaptation. It involves modulating the motor system in response to a
shift of the visual world (Fernandez-Ruiz & Diaz, 1999).
1.5.1 Observations during prism adaptation
Wedge prisms induce a shift in the visual field by refracting light at their surface and displacing
it by a fixed value (Figure 1-3). If wedge prisms are placed over the eyes of a participant during a
condition of minimal information, that is there is no information about the prism experimental
manipulation and no visual feedback of limb position, participants will most likely not perceive
any change in the external sensory world (Redding, Rossetti, & Wallace, 2005). Once active
movements towards a target are made and visual feedback of limb position in space becomes
available, participants will notice that they will miss the target in the direction of optical shift. In
the presence of this visual feedback of limb position and after repeated trials, participant will
eventually be able to move accurately towards the target of interest. This adaptation follows an
exponential time course where there is a rapid error correction phase (strategic recalibration),
gradual error correction, and a plateau phase (spatial realignment). The magnitude of prism
adaptation is dependent not on the amount of time exposed to prisms, as evidence by a lack of
adaptation during passive movements (Held, 1965), but rather on the number of interactions

22
between the visual, proprioceptive and motor system in the presence of visual feedback that
occur while prisms are worn (Fernandez-Ruiz & Diaz, 1999). Once the prisms are removed, and
a similar task is repeated, the participant will miss the target in the direction opposite to the
displacement and this error decays exponentially over subsequent pointing trials similar to
adaptation (Field, Shipley, & Cunningham, 1999). This is commonly referred to as the negative
aftereffect.
Figure 1-3: Ray diagram through a wedge prism. θ' indicate angles of refraction.
If a person places a pair of base-right wedge prisms over their eyes a (i.e. shifts the optical world
leftward) and attempts to point to a visual target in the presence of visual feedback of limb
position, they will initially miss the target to the left. After repeated trials, they will eventually
reach an accuracy equivalent to their baseline pointing accuracy prior to adaptation. Once the
prisms are removed, the person will miss the target to the right, the direction opposite to the
prism displacement.
1.5.2 The prism adaptation paradigm
In the classic prism adaptation paradigm, generally there are three measurements that take place:
1) baseline block to assess general motor performance and to use as a comparator to the prism
adaptation and de-adaptation blocks, 2) prism adaptation, where pointing occurs in the presence
of optical displacement and 3) prism de-adaptation. Sometimes a measurement of open-loop
pointing, or pointing in the absence of visual feedback of limb position in space is assessed as a

23
measure of the change in sensorimotor coordination from before to after prism adaptation. Both
de-adaptation and open-loop pointing present information regarding the "negative aftereffect".
1.5.2.1 The negative aftereffect
The negative aftereffect was first described by the groundbreaking work of von Helmholtz in the
late 1800's on the physiological perception of optics (von Helmholtz, 1867). The negative
aftereffect, or more simply “aftereffect”, is directly observable on tasks performed after the
completion of adaptation and the removal of prisms. It describes a condition where a motor error
results in the direction opposite to that induced optical displacement (i.e. to the right after
adapting to left-shifting prisms). It is generally thought of as the most direct way to observe that
prism adaptation has occurred (Weiner, Hallett, & Funkenstein, 1983).
One way to measure the negative aftereffect is to examine the initial pointing errors during the
de-adaptation block. It has been shown previously that the initial pointing error induced by
adaptation is directly correlated to the pointing error during the de-adaptation block, however,
the de-adaptation error is always smaller, indicating it elicits a somewhat different mechanism of
action than adaptation itself (Fernandez-Ruiz & Diaz, 1999).
Another common measure of the negative aftereffect is the difference in accuracy of open-loop
pointing between before and after adaptation (Efstathiou, 1969; Harris, 1963; Hatada, Rossetti, &
Miall, 2006; Hay, Pick, & Ikeda, 1965; Sarri et al., 2008). In this context, the term open loop
refers to a condition where a task is accomplished in the absence of visual feedback of hand
position (Sarri et al., 2008). The difference from before to after adaptation is a direct measure of
the effect of prism adaptation on the total motor-sensory coordination loop (Redding & Wallace,
2006).
1.5.3 What drives sensorimotor adaptation
To ensure accurate movements to an intended target, the central nervous system (CNS) has to be
capable of making online corrections of motor actions as the external sensory environment is
always changing, both within a single action, and across multiple motor movements. One
influential theory describes an internal forward model of sensorimotor integration to allow for
adaptation of the motor system to small perturbations in the outside visual world (Hinder, Riek,

24
Tresilian, de Rugy, & Carson, 2010; Tseng, Diedrichsen, Krakauer, Shadmehr, & Bastian, 2007;
Wolpert, Ghahramani, & Jordan, 1995b). The forward model of sensorimotor integration theory
postulates that the CNS acts as a comparator between a predictive sensory signal and an actual
sensory outcome for a particular motor action (Hinder et al., 2010; Tseng et al., 2007). This
way, the CNS is able to make online corrections, eliminate unwanted sensory perception during
movement and allow for motor learning (Wolpert et al., 1995b).
A well-documented example forward model sensorimotor modulation based on sensory
predictive errors is in the oculomotor system during a saccadic eye movement. An efference
copy (predictive estimate) of the position of the eye in space is generated prior to the initiation of
the saccade. This efference copy is sent to the cerebellum just prior to the actual saccade taking
place. If there is a discrepancy between the actual and predicted outcomes of the eye position,
the forward model is then updated with this information to ensure accurate foveation of an
intended target on subsequent eye movements (Bridgeman, 1995).
In addition to ensuring motor movements remain accurate in everyday life, this model has also
been applied to experimental manipulations during visuomotor adaptation. It can be seen that
any type of adaptation that requires the cerebellum utilizes sensory prediction errors to
compensate for the inharmonious sensory and motor signals sent to the brain (Tseng et al., 2007).
This has been described in saccadic adaptation and prism adaptation.
1.5.3.1 Prism adaptation and sensory prediction errors
Older behavioural studies provide anecdotal evidence that support the hypothesis that sensory
prediction error is crucial in driving prism adaptation. For example, Welch (1969) described an
experiment where the greatest measureable aftereffect was observed during prism adaptation
when participants were asked to point to a visual target, in contrast to pointing to a random
position in space or deliberately to the side of a target. He concluded that a vital factor in the
ability to adapt is the availability of error information between the predicted and actual position
of visual feedback of limb position in space.
When wedge prisms are placed over the eyes, the optical world shifts in the direction opposite to
the base of the prism. Prior to the initiation of the first pointing movement a feedforward
predictive sensory command is sent to the CNS. This predictive estimate approximates where

25
the feedback of limb position is expected to appear once movement is initiated. This estimate
will be close to the position of the perceived (shifted) target. However, once the participant
points to the target, they will miss the veridical position of the target by a similar magnitude to
the optical shift induced by the prisms (Cohen, 1967). When this occurs, a visual error signal is
generated quantifying the difference between the previous forward predictive estimate (estimated
location of visual feedback of limb position) and the actual sensory outcome (actual feedback
position of the hand) for the pointing motion (Tseng et al., 2007). It is this visual error signal
that updates the forward model of the CNS to allow for more accurate pointing movements on
each subsequent trial. When adaptation is complete, the model has been updated to allow the
predicted and actual position of the feedback of limb position to coincide, and appear at a similar
spatial location as the veridical position of the target. Therefore, the normal acquisition and
generation of this visual error signal is absolutely required for visuomotor adaptation to occur in
response to optically displacing wedge prisms. This means that normal predictive estimates must
be generated and interpretation of visual feedback outcomes must be relatively normal to result
in prism adaptation (Harris, 1963; Hinder et al., 2010).
Additionally, it can be seen that the motor system participation is also required to ensure proper
adaptation to a displaced optical environment. Many studies have examined this by observing
the ability of participants to adapt in the presence of active versus passive motor movement. For
example, Held (1965) was the first to show that participants only adapted to wedge prisms if they
were moving their hand under their own will, rather than an experimenter moving it for them.
He argued that input from the sensory system strives to be directly correlated with output from
the motor system by a defined value created during sensorimotor development. Any perturbation
that results in a discordance of these two systems will cause this constant to be modified to adapt
to the new sensorimotor coordinates. However, active movement is required to detect a
discrepancy in the normal constant (Held & Freedman, 1963).
To sum up, it appears as though normally functioning sensory and motor systems are required to
adapt to optical displacement of images induced by wedge prisms. Furthermore, a sensory
prediction estimate, is required to drive the adaptive behaviour in response to optically displacing
wedge prisms.

26
1.5.4 Adaptive processes during prism adaptation
Prism adaptation elicits at least three different adaptive processes: strategic recalibration for
rapid error correction, spatial realignment to deal with discordant sensory signals and postural
adjustment to maintain stability in the presence of an altered visual world (Redding et al., 2005;
Redding & Wallace, 1993, 1996, 2003a, 2006).
1.5.4.1 Strategic recalibration
Strategic recalibration or "conscious correction" results in the rapid error reduction observed
during the early phase of prism adaptation (Redding & Wallace, 2006; Welch, 1978). It
constitutes a period of cognitive learning, as it uses error information from previous trials to
allow for a quick improvement in pointing accuracy early in the adaptation process (O'Shea et
al., 2014; Redding & Wallace, 2001, 2003a). It is thought to represent high level spatial
remapping by way of online, feedforward use of visual feedback to update motor commands and
is task-work space specific (O'Shea et al., 2014; Redding & Wallace, 1993; Rossetti, Koga, &
Mano, 1993). This is the strategy used in everyday life that allows for calibrated and accurate
motor movements to an intended target, and is extremely useful in altering motor output to
transient changes in the visuo-haptic environment (Redding & Wallace, 2006). Based on
previous findings in amblyopia literature (Niechwiej-Szwedo, Goltz, et al., 2012), and due to the
fact that this process is reliant on the ability to use visual feedback efficiently to update the next
motor action (O'Shea et al., 2014), it is possible that people with amblyopia will use this
feedback less efficiently than visually-normal controls and require more trials to adapt to
optically displacing wedge prisms (see section 1.3.3.3 Motor deficits).
1.5.4.2 Spatial realignment
Unlike strategic recalibration, spatial realignment is not a conscious process. Generally,
coordinate frames of different modalities (such as vision, proprioceptive, auditory, etc...) work
together such that accurate commands are transformed and integrated across them all. The
creation of these "aligned" reference frames occurs during normal development. Only in
extenuating circumstances, such as disease, development, and experimental intervention (such as
prism adaptation) does realignment become noticeable (Redding & Wallace, 2006).

27
Spatial realignment differs from strategic calibration as it reduces error indirectly by bringing
discordant references frames back into agreement to allow for proper acquisition of sensory
signals across different modalities, and to convert this synergistic signal into coherent motor
commands (Redding & Wallace, 1993, 1996, 2003a).
Prism adaptation results in a discordance of the eye-in-head and hand-in-head reference frames
that are generated during early development (Held & Freedman, 1963). Prism adaptation,
therefore, is an experimental manipulation to test if realignment developed normally during early
childhood. Spatial realignment, also known as "true adaptation" (Welch, 1978), is the process
that brings these visual and proprioceptive spatial maps back onto one coordinate system and
allows them to work together to complete a non task-space specific goal (Redding & Wallace,
2006).
There are three different reference frames that must be realigned in order to accomplish a task
after prism adaptation occurs. These are the eye-head, hand-head and hand-eye coordinate maps
(Redding et al., 2005; Redding & Wallace, 1993, 1996, 2003a, 2003b, 2006). It is possible that
because amblyopia is a disorder of vision, that eye-head and hand-eye coordinate frames should
be most affected during spatial realignment.

28
1.5.4.2.1 Eye-head reference frame
The change in the eye-head reference frame after prism adaptation is captured by a measurement
of visual straight ahead. Generally, a small target is moved across the screen and participants
indicate when they believe the target is perceived to be lined up with the center of the body
(Hatada, Rossetti, et al., 2006; Redding & Wallace, 1993, 2006). The difference in this
measurement from before to after adaptation is commonly referred to as "visual shift". It is
believed to be a measure of a change registered eye position from before to after adaptation
(Crawshaw & Craske, 1974). The realignment of this reference frame results in a unique
consequences on visual perception, where participants now assume their visual straight ahead is
shifted in the same direction as optical displacement induced by the prisms, for example to the
left if adaptation was in response to left-shifting prisms (Redding & Wallace, 2006).
Figure 1-4: Expected shift in the eye-head reference frame from before (A) to after (B) prism adaptation in response to left shifting prisms. Dotted lines represent the veridical midline of the participant. Blue targets represent start position. Dotted arrows represent the trajectory of the target. Grey squares represent target end position.

29
1.5.4.2.2 Hand-head reference frame
The change in the hand-head reference frame after prism adaptation is commonly quantified by a
measurement of straight ahead blind pointing. The difference in this reference from before to
after prism adaptation is generally referred to as the "proprioceptive shift". It is believed to be a
measure of a perceptual change in position sense of the joints. The consequence of this change
results in a shift in straight ahead blind pointing in the direction opposite to the optical
displacement imposed by the wedge prisms, for example to the right in response to adaptation
from left shifting prisms (Hatada, Rossetti, et al., 2006; Redding & Wallace, 1993, 1996, 2006).
Figure 1-5: Expected shift in the hand-head reference from before (A) to after (B) prism adaptation in response to left shifting prisms. Dotted arrows represent expected trajectory of the hand. Dotted lines represent the midline of the participant.

30
1.5.4.2.3 Hand-eye reference frame
The total sensorimotor coordination loop is generally measured by pointing to a visual target in
the absence of visual feedback of hand position, or in an open-loop condition (Hatada, Rossetti,
et al., 2006). It is generally of lesser magnitude than the amount of optical displacement, and the
difference in this measurement from before to after adaptation is often referred to as "total shift"
(Redding, 1981; Redding & Wallace, 1990). The change in this reference frame results in a
shift in sensorimotor control in the direction opposite to the optical displacement of the prisms,
for example to the right in response to left-shifting prisms (Harris, 1963; Hatada, Rossetti, et al.,
2006; Held & Hein, 1958; Redding & Wallace, 1993, 1996, 2006).
Figure 1-6: Expected shift in the hand-eye reference frame from before (A) to after (B) prism adaptation in response to left-shifting prisms. Dotted lines represent trajectory of the hand. Grey squares represent the veridical target position.

31
1.5.4.2.3 Wilkinson's additivity model
The realignment of the proprioceptive and visual systems during prism adaptation is described
by a linear mathematical system. Wilkinson (1971) formalized this model by demonstrating that
the absolute value of the shift in eye-in-head reference (visual shift; quantified by a measurement
of visual straight ahead) added to the absolute value of the shift in the hand-in-head reference
(proprioceptive shift; measured by straight ahead blind pointing) equals the absolute value of a
measure of the total sensory-motor coordination loop (total shift; determined by open loop
pointing to a visual target) after prism adaptation (equation 1.1).
|Proprioceptive Shift| + |Visual Shift| = |Total Shift| (1.1)
This is an important concept in the context of this thesis, as amblyopia is understood to be
associated with increased visual variability (Levi & Klein, 2003; Raashid et al., 2013).
Integration of sensory modalities is known to occur in a statistically optimal fashion (Ernst &
Banks, 2002). One model for describing such a situation is called the maximum likelihood
estimation (MLE) model. Briefly, the MLE is a weighted average of all sensory modalities
involved in the completion of a specific task, where the most reliable (least variable) modality is
most heavily depended upon. If one modality is degraded and becomes more variable, its
relative weighting within the MLE decreases and becomes less relied upon to complete the task
at hand (Ernst & Banks, 2002). Generally, on spatial tasks such as prism adaptation, vision is
most reliable in detecting differences in the environment and as such is most heavily weighted
within the MLE (Ernst & Banks, 2002). In contrast, vision is degraded in amblyopia making it
less reliable than would be expected in a visually-normal control. As such, it is possible that
there will be a re-weighting of proprioception and vision in amblyopic realignment such that
vision is less heavily depended upon to adapt to optically displacing wedge prisms.
The relative proportions of the visual and proprioceptive shift within Wilkinson's additivity
model are dependent on the type of visual feedback used during adaptation. For example, if
continuous feedback is presented, the subject is able to see their hand throughout the entire
movement path. As such, the position of the hand in space will be modified to realign with the

32
visual input (feedback), resulting in large shift in the proprioceptive reference. In contrast, if the
feedback is provided terminally, i.e. at the end of movement, the eyes will be guided by the felt
hand position in space resulting in a greater shift of the visual coordinate system to realign with
this perceived proprioceptive input (Redding & Wallace, 2006). More simply put, the modality
that appears to be less beneficial in completing the task adapts to align with the more useful
sense (Kornheiser, 1976).
1.5.4.3 Postural adjustment
Postural adjustment refers to the actual/perceived change in body position during adaptation to
displacing wedge prisms (Redding & Wallace, 2006). Postural adjustment generally occurs as a
result of inter-sensory bias effects where the influence of one sense results in a perceived/actual
change in body posture to maintain stability in an altered environment (Welch & Warren, 1986).
For example, visual capture is a phenomenon that results in postural adjustment. When the
visual location of a limb is altered in some way, for example by a lateral shift while wearing
prisms, the position of the body is perceived to be where it is visually located, even if this is not
the limbs veridical position in space (Hay et al., 1965).

33
1.5.5 Neural correlates of prism adaptation
Several brain structures have been conclusively demonstrated to take part in the prism adaptation
process (Chapman et al., 2010; Danckert, Ferber, & Goodale, 2008; Luaute et al., 2009).
Additionally, the activation of these regions follows a time course similar to that of adaptation,
with different structures activating to different strengths during the different adaptation
processes, namely strategic recalibration and spatial realignment (Chapman et al., 2010; Luaute
et al., 2009).
1.5.5.1 Cerebellum
The cerebellum is a structure located at the posterior of the human brain, just under the occipital
lobe. It plays a major role in coordination of the motor system in both the oculomotor and
manual motor domains during visually-guided reaching (Stein & Glickstein, 1992). The
cerebellum requires normal visual input to allow for calibrated movements to a visual target
(Stein & Glickstein, 1992). If the cerebellum becomes damaged due to an acquired, congenital
or induced lesion, then inaccurate and uncoordinated movements result (for a review see Diener
and Dichgans, 1992).
Due to its importance in regular visually-guided movements, the cerebellum has been of interest
for scientists studying visuomotor adaptation. By creating selective lesions within this structure
in non-human primates (Baizer, Kralj-Hans, & Glickstein, 1999) and observing behaviour in the
acquired/congenital human condition (Fernandez-Ruiz et al., 2007; Martin, Keating, Goodkin,
Bastian, & Thach, 1996) investigators were able to determine that this structure is absolutely
essential for prism adaptation to occur. Participants with any type of cerebellar dysfunction show
reduced or absent compensation in response to wedge prism placement in front of the eyes after
repeated trials with visual feedback of limb position. In other words, these participants display
pointing errors in the direction of optical displacement, for example to the left of the veridical
position of the target in response to left-shifting prisms, even after repeated pointing trials in the
presence of visual feedback of limb position in space.
More recently, using fMRI, Luaute et al. (2009) has demonstrated that the activation of the
cerebellum during prism adaptation outlasts the initial error correction phase of adaptation,
indicating it may play a role both strategic recalibration and spatial realignment. Chapman et al.

34
(2010) substantiated this claim, again through functional imaging, by demonstrating that the
posterior left cerebellum and anterior right cerebellum were preferentially activated during the
first few trials of adaptation, and this activation outlasted the rapid correction of prism induced
errors. Additionally, both Luaute et al. (2009) and Chapman et al. (2010) found an increase in
activation of the cerebellum during the late phase of adaptation after rapid error correction is
complete, during the spatial realignment adaptive process.
1.5.5.2 Parietal lobe
The parietal lobe has been implicated in the ability to adapt to laterally displacing prisms. It has
specifically been associated with the strategic recalibration (rapid error correction) phase of
adaptation. The first evidence for this stemmed from the fact that participants with bilateral
parietal lobe lesions displayed an inability to use cognitive, online corrections to rapidly reduce
prism induced errors during the first few trials after exposure to laterally displacing wedge
prisms (Newport & Jackson, 2006; Pisella et al., 2004).
The posterior parietal cortex (PPC) has been identified as a necessary structure to accurately
adapt to optical displacement. It is well understood in terms of neutral visually-guided
movements to a non-adapting stimulus (Andersen, 1989; Andersen, Essick, & Siegel, 1985;
Behrmann, Geng, & Shomstein, 2004; Caminiti, Ferraina, & Mayer, 1998). The PPC is
responsible for creating a synergistic sensory signal composed of visual, somatosensory, and
vestibular information (Crawford et al., 2004), and transforming this signal into a hand-centered
coordinate frame to send to the frontal lobe and be used by the motor system (Buneo &
Andersen, 2006; Lacquaniti et al., 1995). It is thought to perform a similar function during the
early stages of prism adaptation (Luaute et al., 2009).
The anterior intraparietal sulcus (aIPS), specifically the inferior parietal lobule-supramarginal
gyrus, has been implicated as a chief structure in rapid error detection and correction during the
first few pointing trials after donning wedge prisms (Chapman et al., 2010; Danckert et al., 2008;
Luaute et al., 2009). Clower et al. (1996) demonstrated this by showing that in response to prism
perturbation, there is increased cerebral blood flow in the contralateral IPS to the pointing arm
during the strategic recalibration phase of adaptation. Danckert et al. (2008) later substantiated
this by demonstrating increased activation in the IPS under fMRI during the first three pointing

35
trials of prism adaptation where motor errors are the largest. Additionally, it can be seen that the
activation in this region as measured by MRI decreases as the terminal error between end finger
and target position shrinks, i.e. as adaptation proceeds (Danckert et al., 2008; Luaute et al.,
2009). This finding implies that it is preferentially involved in the strategic recalibration phase
of adaptation (Redding & Wallace, 2001, 2002, 2003a). Having said this, Chapman et al. (2010)
found that although the inferior parietal lobule was activated during rapid error correction, it
attained a state of significantly higher activation during the late phase of adaptation than
compared to baseline measurements. This observation may indicate that it is also involved in the
realignment phase of adaptation.
The angular gyrus has also been implicated in the ability to adapt to lateral displacing optical
wedge prisms. Chapman et al. (2010) suggested that the angular gyrus structure is preferentially
activated in response to the shift from strategic recalibration to spatial realignment. Other
structures within the parietal cortex that have been implicated are the parietal occipital sulcus
(POS; Luaute et al., 2009) and the superior parietal lobule (SPL; Chapman et al., 2010), but have
not been conclusively demonstrated to be primarily responsible for adaptation. For example,
participants with lesions to the SPL have been shown to be unable to adapt to optically
displacing prisms in Newport and Jackson (2006), but have been shown to adapt in Pisella et al.
(2004). Therefore more studies need to be conducted before verifying the role of these structures
in prism adaptation.
1.5.5.3 Temporal lobe
The temporal lobe has been implicated in the ability for the human brain to adapt to visual
displacement induced by wedge prisms. Specifically, it has been found that the superior
temporal gyrus (STG) and superior temporal sulci (STS) are readily activated in response to the
late phase of prism adaptation -- spatial realignment, and not during manual pointing in the
absence of a perturbation (Luaute et al., 2009). This is a novel finding that has yet to be
substantiated in other functional imaging studies (Chapman et al., 2010). Having said this, the
STG has been associated with the spatial awareness deficit involved in hemispatial neglect
(Karnath, Ferber, & Himmelbach, 2001) thus is a plausible correlate of prism adaptation. Wedge
prisms induce a neglect like state in visually-normal controls by resulting in selective attention of
one side of the visual field (Michel et al., 2003).
36
1.5.6 Prism adaptation in [other] pathological conditions
1.5.6.1 Cerebellar disease
As can be seen from section 1.5.5 Neural correlates, the cerebellum is absolutely necessary to
accomplish normal coordinated visually-guided movements and to be able to adapt to a
visuomotor perturbation. In cases where there is a genetic disorder of the cerebellum or an
acquired lesion from a stroke, complete adaptation to optical displacement is virtually
impossible.
Studies on patients with cerebellar dysfunction provided the first evidence of this. The results
from these studies vary, from absolute abolition (Baizer et al., 1999; Gauthier, Hofferer, Hoyt, &
Stark, 1979) to impaired adaptation (Martin et al., 1996; Pisella et al., 2005; Weiner et al., 1983).
For example, Fernandez-Ruiz et al. (2007) examined prism adaptation in patients with
spinocerebellar ataxia type 2. Spinocerebellar ataxia type 2 is a genetic disorder, caused by an
autosomal dominant mutation with severe motor coordination deficits including increased
latency of saccadic eye movements, ataxia of the limbs, abnormal posture and action tremors
(Auburger, 2012). In this subset of patients, prism adaptation is significantly impaired as
observable by decreased magnitude and rate of adaptation but interestingly a similar negative
aftereffect to visually-normal controls (Fernandez-Ruiz et al., 2007).
1.5.6.2 Hemispatial neglect
Hemispatial neglect is a disease of selective spatial inattention. In most simple terms, hemispatial
or visual neglect is caused by damage to one hemisphere of the brain. It is characterized by a
chronic lack of attention to items on the contralesional side of the body, i.e. for right hemispheric
damage there is inattention to objects or body parts in the left visual field. More often than not
neglect occurs as a result of a lesion in the right parietal lobe resulting in a lack of attention in the
left visual field (Parton, Malhotra, & Husain, 2004).
Prism adaptation has been used as a treatment for hemispatial neglect. Simply, patients are
adapted to right shifting prisms for extended periods of time. When the prisms are removed the
negative aftereffect results in pointing errors to the left of an intended target. This intervention

37
allows the patients to acknowledge the left side of space, eliminating the spatial inattention
deficit (for a comprehensive review, see Jacquin-Courtois et al., 2013).
While testing prism adaptation as a therapy for neglect, scientists have characterized deficits in
certain domains of the prism adaptation paradigm in hemispatial neglect patients. Michel et al.
(2003) demonstrated, based on anecdotal evidence, that people with hemispatial neglect rely
more on the spatial realignment phase of adaptation, as evidenced by an enhanced negative
aftereffect in these participants. The authors argued that due to the fact that neglect is associated
with a clear cognitive impairment, namely a loss of visual attention to one side of space (Parton
et al., 2004), they display deficits in the strategic recalibration phase of adaptation (dependent on
cognition) and rely more heavily on spatial realignment to adapt to an optically displaced visual
environment.
Similarly, Aimola, Rogers, Kerkhoff, Smith, and Schenk (2012) demonstrated that neglect is
associated with impairments in strategic recalibration during prism adaptation. This was readily
observable by a decreased ability to compensate for prism induced error, i.e. people with neglect
displayed diminished rapid error correction during the initial pointing trials of adaptation. This
said, the authors did not find a pathologically induced after effect in neglect, and argued that this
finding was due to the fact that the strategic recalibration and spatial realignment phases of
adaptation are independent (Aimola et al., 2012). This idea is not a favorable concept throughout
the literature, as recalibration and realignment are generally thought of as related, yet dissociable
events during the prism adaptation process (Redding & Wallace, 1993, 2001, 2002).
1.5.6.3 Optic ataxia
Optic ataxia is a disorder that results as a consequence of a lesion to the parietal cortex, resulting
in an inability to make accurate and precise visually-guided movements (Cavina-Pratesi,
Ietswaart, Humphreys, Lestou, & Milner, 2010). Typically, optic ataxia is associated with
deficits in use of visual feedback to correct limb actions online, or during that specific
movement. Only one case study to date has looked at the effect of optic ataxia on prism
adaptation. Pisella et al. (2004) demonstrated two main findings. Firstly, it was observable that
optic ataxia is associated with an increased time course of adaptation compared to visually
normal controls by showing that the participant with optic ataxia took approximately five trials to
adapt to optically displacing wedge prisms, whereas the visually-normal control group returned

38
to baseline as early as trial two. Secondly, Pisella et al. (2004) demonstrated that this participant
with optic ataxia displayed impairments in the use of online visual feedback to update the motor
command within a single pointing action. The idea that online control was affected in this patient
was shown directly by observing a greater error on the first pointing trial after adaptation begun
as compared to a cohort of visually-normal control participants. More simply, optic ataxia
resulted in a pointing error on the first trial closer to the optical displacement of the prisms as
compared to visually-normal controls. The authors argued that this pathologically increased
initial pointing error was due to impairments in changing limb trajectory online within the first
pointing trial.
1.5.6.4 Alzheimer's disease
Alzheimer's disease (AD) is the most common cause of dementia in the aging population
(Cummings & Cole, 2002). It is most often characterized by a loss of cognitive function. Prism
adaptation in Alzheimer's disease has been examined by two different groups. Weiner et al.
(1983) demonstrated that patients with Alzheimer's disease display a significantly greater
negative aftereffect than visually-normal controls. The authors argue that this finding occurred as
a result of impairments in the cognitive component of prism adaptation, now commonly known
as the strategic recalibration phase (Redding & Wallace, 1993, 2003a), resulting in patients with
AD relying more on non-cognitive processes to adapt to optically displacing wedge prisms (i.e.
spatial realignment). This finding was a similar result and explanation to the anecdotal evidence
demonstrated by Michel et al. (2003) in hemispatial neglect.
In contrast, Paulsen, Butters, Salmon, Heindel, and Swenson (1993) demonstrated that there was
no significant effect of Alzheimer's disease on prism adaptation when compared to visually-
normal controls. This said, the authors admittedly used a cohort of AD patients with mild to
moderate dementia. It is possible that they were not at an advanced enough stage to demonstrate
a similar result to Weiner et al. (1983).
1.5.6.5 Basal ganglia disorders
'Basal ganglia disorders' are a blanket term that describes a heterogeneous group of conditions
that result as a consequence of dysfunction of the basal ganglia (Albin, Young, & Penney, 1989).
The basal ganglia are a compilation of many different subcortical nuclei projecting to various

39
brain structures including the cerebral cortex, thalamus, and brain stem. One of the chief
functions of the basal ganglia is to modulate the activity of efferent neurons connecting the
cerebral cortex to the upper motor neurons in the pre- and motor cortices as well as the brainstem
to aid in the coordination of motor action (Purves, 2012b).
Prism adaptation has been investigated in two specific basal ganglia disorders, namely
Huntington's disease (HD) and Parkinson's disease (PD; Fernandez-Ruiz et al., 2003; Gutierrez-
Garralda et al., 2013; Paulsen et al., 1993; Weiner et al., 1983).
HD is characterized by the selective loss of two component nuclei of the basal ganglia,
specifically the caudate and putamen (Vonsattel et al., 1985). With respect to HD, the results
vary with respect to its effect on prism adaptation. Gutierrez-Garralda et al. (2013) demonstrated
that there was no effect of HD on wedge prism adaptation, but did observe deficits on a reversed
prism task. Additionally, Fernandez-Ruiz et al. (2003) showed that people with HD display a
comparable magnitude and rate of adaptation to visually-normal controls, however they
demonstrate a decreased negative aftereffect. In contrast, Paulsen et al. (1993) observed that
there was abolition of the rapid error correction phase of adaptation in HD patients that was
positively correlated to their dementia on clinical examination. This said, it must be noted that
these three groups of investigators used differing strength of prisms, as well as methods to induce
adaptation (two had their participants throw balls, one was to point to a visual target in a terminal
feedback condition) that may account for the varying results.
PD is characterized by a reduction of dopamine levels in the caudate and putamen as well as a
selective loss of dopamine producing neurons (Gutierrez-Garralda et al., 2013). The effects of
PD on prism adaptation range from demonstrating no observable deficits (Gutierrez-Garralda et
al., 2013) to decreased negative after-effects in PD patients (Fernandez-Ruiz et al., 2003).

40
1.5.7 Summary
Prism adaptation is a complex process that involves both strategic and subconscious processes. It
is an interesting and well-established method of visuomotor adaptation that relies on the ability
to generate and properly interpret a visual error signal. Prism adaptation requires the proper
coordination of many brain structures in order to occur, some of which are known to be affected
by amblyopia. As such, it provides a robust experimental model to examine visuomotor
adaptation in the manual motor domain in people with anisometropic amblyopia.

41
Chapter 2 Hypotheses and Objectives
This research specifically investigates the adaptive capacity of the amblyopic motor system to a
lateral shift of the visual world, or in other words to a perturbation in the external visual
environment. Amblyopia is a spatiotemporal disorder of vision, resulting in many perceptual,
sensory and motor deficits (see section 1.3.3 Deficits). Although there have been studies that
examine prehension, oculomotor function and saccadic adaptation in amblyopia, the ability for
these people to calibrate and adapt their manual motor system to a changing external visual
stimulus has yet to be investigated.
2.1 Hypotheses
Normal interpretation of a sensory prediction signal, specifically a visual error signal, is
absolutely required for perceptual adaptation to optically displacing wedge prisms (see section
1.5.3 What drives sensorimotor adaptation?). An error must be observable between predicted
and actual sensory outcomes for a given motor command (Tseng et al., 2007). In cases where
the visual system performance is degraded (such as in amblyopia), more variable visual input is
used to establish the visual error signal driving adaptation. It is therefore hypothesized that
people with amblyopia will require more trials to adapt to an optically displaced visual
environment as compared to visually-normal controls due to increased noise in their visual
system (Bonneh et al., 2004; Fronius et al., 2004; Held, 1965; Levi & Harwerth, 1977; McKee et
al., 2003; Wolpert et al., 1995b).
Based on the results observed in saccadic adaptation (Raashid et al., 2013), and that amblyopia is
associated with increased variability in the visual system (Levi & Klein, 2003; Niechwiej-
Szwedo et al., 2010) and increased spatial uncertainty (Birch & Swanson, 2000; Hong, Levi, &
Klein, 1998; Levi, Klein, & Yap, 1987), it is hypothesized that people with anisometropic
amblyopia will exhibit a decreased magnitude of adaptation as compared to visually normal
controls.
Lastly, due to an increase in variability in the visual system of people with amblyopia (Levi &
Harwerth, 1977; Levi & Klein, 1983, 1985; Levi et al., 1987; Loshin & Levi, 1983; Watt &
Hess, 1987) and undersampling of sensory neurons in V1 (Hess & Field, 1994; Hong et al.,

42
1998; Levi & Klein, 1985; Watt & Hess, 1987); see section 1.3.3 Deficits) it is hypothesized that
people with amblyopia will rely less on visual input and more on proprioceptive input during the
prism adaptation task as compared to visually-normal controls. Should there be a reweighting of
vision and proprioception during adaptation, it is hypothesized that there will be a relative
decrease in proprioceptive shift (based on vision during adaptation) and an increase visual shift
(based on proprioception during adaptation; Cohen, 1967; Hatada, Rossetti, et al., 2006; Redding
& Wallace, 1990).

43
Chapter 3 Materials and Methods
3.1 Materials and methods
Eleven visually-normal control participants (five males, age 28 ± 9 years) who had normal or
corrected-to-normal vision (20/20 Snellen visual acuity or better) and seven people with
anisometropic amblyopia (seven females, age 28 ± 8 years) participated in this study. All
participants underwent full orthoptic assessment to quantify their visual acuity, eye alignment,
refractive error and stereopsis. Amblyopia was defined as a visual acuity of 20/25 or worse in the
amblyopic eye, 20/20 or better in the fellow eye, and an interocular difference of at least two
acuity lines on clinical testing. Anisometropic amblyopia was specifically characterized as
amblyopia in the presence of an interocular refractive error difference of at least 1 diopter (D) in
spherical or cylindrical power. Anisometropic amblyopia was chosen for this particular
investigation for three main reasons. Firstly, people with anisometropic amblyopia display
uniform deficits across the entire visual field, whereas people with strabismic amblyopia display
deficits generally confined to the central visual field (Fronius & Sireteanu, 1989; Hess & Pointer,
1985; Ikeda & Wright, 1976). This cohort was chosen because we use both peripheral and
central target presentations. Secondly, people with strabismic amblyopia display an obvious
oculomotor deficit by way of an eye-turn (Simon & Kaw, 2001) which may confound the data.
Lastly, because wedge prisms cause the eyes to move in the direction of optical displacement
(Craske, 1967; Redding & Wallace, 1988; Rock & Campbell, 1975), it is possible that in
strabismic participants the change in relative position of the eyes would cause the eye to move
out of the suppression scotoma resulting in diplopia, or double vision (Holopigian, Blake, &
Greenwald, 1988; Horton, Hocking, & Adams, 1999). To avoid to this potential confounder,
these people were excluded from the study. Other exclusion criteria included decreased visual
acuity due to ocular pathology, prior refractive surgery or neurologic disease. All participants
provided informed consent prior to participation in this investigation. This study was approved
by the Research Ethics Board at the Hospital for Sick Children and conformed to the
requirements stated in the Declaration of Helsinki.

44
Table 3-1: Clinical data for all participants : 11 visually-normal controls (A) and seven people with anisometropic amblyopia (B). Blue acuities designate the amblyopic eye.
3.1.2 Apparatus
The apparatus used was similar to that described previously (Wolpert, Ghahramani, & Jordan,
1995a). Participants were seated 46 cm in front of a large table inclined at 45˚, with their heads
stabilized by a chin rest. Visual targets were presented on a Mitsubishi CRT monitor (20 inch by
15 inch viewing area) at 120 Hz, with the screen mounted above the participant’s head. The
targets were projected from the CRT and reflected off a semi-silvered mirror, which served two
purposes: 1) create virtual targets in the plane of the inclined table; and 2) block the view of the
participant's hand/arm in the darkened environment. An infrared marker (4 mm in diameter) was
placed on the subject’s right index fingertip, which was monitored in real-time using the motion
capture system described below. To reduce unwanted ambient light sources, the computer
monitor was covered by three neutral density filters (ND 0.3, 0.6 and 0.9 log units). The neutral

45
density filters also prevented the lighter background of the screen from providing a visual
reference during any component of the testing procedure. In the tasks where feedback was
required, a 10 mm diameter circle rendered on the CRT monitor and reflected off the semi-
silvered mirror appeared at the position of the infrared marker in real-time as a virtual image in
the plane of the table. It appeared at the terminus of movement, when the finger reached 75% of
the distance to the target along the Y-axis. Additionally, all tasks described below were
performed in a darkened room (Figure 3-1).
Targets were generated by a custom program (written in C++) and presented within the frame of
the computer screen. Each was a small, white square that subtended a visual angle of 0.25˚ at a
viewing distance of 46 cm.
Reaching movements of the right index finger were recorded by a non-invasive motion capture
system (Optotrak Certus system; Northern Digital, Waterloo, Canada; spatial accuracy 0.1 mm,
resolution 0.01 mm, sampling frequency 200 Hz; Figure 3-1). As the OC’s collection rate
exceeded the display rate, updated finger position data were available for each display frame;
superfluous position data (i.e., those generated between frames) were discarded. The OC was
calibrated prior to initiation of the experimental protocol using a three-point digitizing probe.
Real-time output of the finger movement traces from the OC was displayed on a computer and
monitored at all times to ensure tracking was maintained throughout the experiment. A separate
experimenter oversaw real-time feedback of finger or target position.
A force-sensitive resistor (FSR; Tekscan, Boston, MA; 15 mm diameter) was placed on the
inclined table out of the range of the monitor, 18 cm vertically aligned with the bottom left
corner of the inclined table. The FSR was used to initiate each individual trial for all tasks by
pressing it with the left index finger, triggering on the press of the button. The FSR also served to
end each trial by pressing the button a second time. The FSR signal was received by the
experiment computer via the analog-to-digital converter of a ViSaGe system (Cambridge
Research Systems, Rochester, Kent, UK).
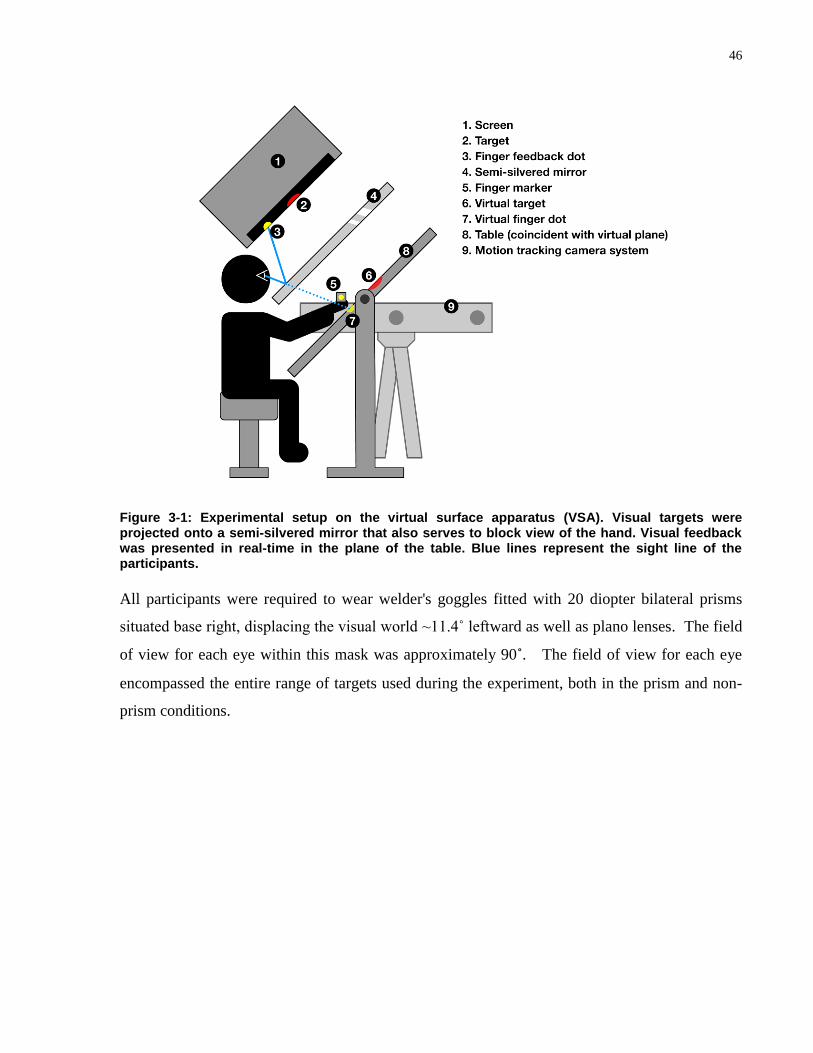
46
Figure 3-1: Experimental setup on the virtual surface apparatus (VSA). Visual targets were projected onto a semi-silvered mirror that also serves to block view of the hand. Visual feedback was presented in real-time in the plane of the table. Blue lines represent the sight line of the participants.
All participants were required to wear welder's goggles fitted with 20 diopter bilateral prisms
situated base right, displacing the visual world ~11.4˚ leftward as well as plano lenses. The field
of view for each eye within this mask was approximately 90˚. The field of view for each eye
encompassed the entire range of targets used during the experiment, both in the prism and non-
prism conditions.

47
3.2 Procedure
The procedure implemented for each participant is outlined in Figure 3-2. Specific details for
each task will be described below.
Figure 3-2: Flow chart of the procedure for all participants.
3.2.1 Pointing with feedback (prism adaptation baseline)
In order to ensure that participants were able to perform baseline pointing, to show that the
prisms induced a shift in the optical field, and to evaluate general motor performance on this task
(Fernandez-Ruiz et al., 2007), participants were asked to point to visual targets located at +9˚,
+3˚, 0, -3˚, and -9˚ along a horizontal axis in the presence of visual feedback without prisms. A
metronome set at 80 beats per minute was used to ensure equal pointing durations
(approximately 3 second cycles) across participants and to prevent oblique/secondary
movements. Fifty trials total were recorded. To begin a trial, participants placed their left index
finger on the FSR and right index finger on a coin (a dime) at the center of the inclined table that
acted as a tactile cue to ensure a consistent start position. When prepared, they tapped the FSR
with their left hand and made a pointing movement toward the target with the right hand. As they
approached the target, the feedback light became visible and the target disappeared. When they
perceived that their finger was lined up with the remembered position of the visual target, they
were instructed to tap the FSR once again to end the trial. They then returned to the coin at the

48
center of the table with their right hand and the initiated the subsequent trial by pressing down on
the FSR.
Figure 3-3: Pointing with feedback (prism adaptation baseline) task. Dotted arrow depicts expected trajectory of the hand. Grey square represents the veridical position of the target of interest. White dot represents visual feedback.
3.2.2 Open-loop pointing (total shift task)
This task was performed as described previously (Hatada, Miall, & Rossetti, 2006; Hatada,
Rossetti, et al., 2006; Redding & Wallace, 1993, 1996, 2001, 2003b, 2006; Wilkinson, 1971).
Participants were asked to point to visual targets located at +9˚, +3˚, 0˚, -3˚, and -9˚ along a
horizontal axis in the absence of prismatic displacement as well as visual feedback of limb
position. In this task, the hand was located under the semi-silvered mirror with the finger
feedback light off for the entire duration of movement. Eighty trials were given (16 to each target
position in randomized order) requiring approximately 1.5 seconds per trial (metronome set at 80
beats per minute). To begin a trial, participants placed their left index finger on the FSR and right
index finger on a coin at the center of the inclined table. When prepared, they tapped the FSR
with their left hand to initiate the trial and pointed towards the visual target with their right hand.
Once they perceived that their finger was aligned with the position of the visual target, they were
instructed to tap the FSR once again. They then returned to the coin at the center with their right

49
hand and began again. This task provides two sources of information: 1) a measure of where the
hand is perceived to be in space; and 2) a measure of a complete sensorimotor coordination loop.
As such, this task was performed twice (pre-exposure/baseline and post-prism exposure) with the
difference between the two repetitions measuring the change in motor-sensory coordination
caused by prism adaptation. This difference is commonly termed "total shift" (Redding &
Wallace, 2006).
Figure 3-4: Open loop pointing (total shift task) before (A) and after (B) prism adaptation. Dotted arrows represent expected trajectories of the hand. Grey squares represent the veridical target position.
3.2.3 Visual straight ahead (visual shift task)
The visual straight ahead task was performed as described previously (Hatada, Miall, et al.,
2006; Hatada, Rossetti, et al., 2006; Redding & Wallace, 1993, 1996, 2001, 2003b, 2006;
Wilkinson, 1971). This task required no finger pointing. Rather, participants were asked to make
a judgment of their visual straight ahead. Prior to initiation of this task, the participants were
asked to close their eyes as the experimenter checked that the head was positioned straight in the
chin rest. Subsequently, participants were asked to open their eyes and stare at the position that
appeared to be directly in front of their nose. When prepared, they were instructed to press the
FSR to begin a trial. The trial consisted of the same visual target that appeared in previous tasks.

50
This time it did not appear at the random target positions presented above, but rather appeared at
either the left or right side of the monitor and moved across the screen at 30 mm/s (Hatada,
Rossetti, et al., 2006) which constituted a trial duration of between 5 and 10 seconds depending
on where the participant perceived their visual straight ahead to be (Redding & Wallace, 1993,
1996, 2001). Sixty trials were recorded, randomly assigning the order of 30 left and 30 right start
targets. As the target lined up with the position on the table they were staring at the participants
perceived straight ahead, they were instructed to press the FSR again to end the trial. Every 15
trials, participants were given a break with their eyes closed for 10 seconds. This task was
performed twice (pre-exposure/baseline and post-prism exposure) with the difference between
the two repetitions measuring the change in the eye-in-head reference frame caused by prism
adaptation. This difference is commonly termed the "visual shift" (Redding & Wallace, 2006).
Figure 3-5: Visual straight ahead (visual shift task) before (A) and after (B) prism adaptation. Dotted grey lines represent the veridical midline of the participant. Blue targets represent target start position. Dotted arrows represent the trajectory of the target. Grey squares represent expected end target position.

51
3.2.4 Blind straight ahead pointing (proprioceptive shift task)
The straight ahead blind pointing task was performed as described previously (Hatada, Miall, et
al., 2006; Hatada, Rossetti, et al., 2006; Redding & Wallace, 1993, 1996, 2001, 2003b, 2006;
Wilkinson, 1971). A piece of masking tape oriented horizontally and subtending the entire length
the table was placed approximately 18 cm from the bottom edge. Participants were instructed to
keep their eyes closed and place their right index finger at the position of that piece of tape that
was aligned with the centre of their body. The left finger controlled the beginning and end of
trials by tapping the FSR. Participants pressed the FSR to begin each trial. After initiation, they
were instructed to point straight out from the center of their body until their arm was extended to
a comfortable length (at about eye level). Once the movement was complete, the FSR was tapped
again to end the trial. Each cycle (out and back movement) required approximately 3 seconds,
and was controlled by a metronome set at 80 beats per minute. Every 15 trials, participants were
given a break for 10 seconds and asked to re-center their finger. Once again this task was
performed twice (pre-exposure/baseline and post-prism exposure) with the difference between
the two repetitions measuring the change in the hand-head reference frame caused by prism
adaptation. This difference is commonly termed "proprioceptive shift" (Redding & Wallace,
2006).
Figure 3-6: Straight ahead blind pointing (proprioceptive shift task) before (A) and after (B) prism adaptation. Dotted arrows represent expected trajectory of the hand. Dotted lines represent the midline of the participant.

52
3.2.5 Prism adaptation
The same task as presented in section 3.2.1 Pointing with feedback was repeated in the presence
of 11.4˚ left shifting prisms. Participants were asked to point to targets located at +9˚, +3˚, 0˚, -
3˚, and -9˚ along a horizontal axis in the presence of visual feedback while wearing left-shifting
wedge prisms. A metronome set at 80 beats per minute was used to ensure similar pointing
durations and exposure time to the prism displacement (approximately 3 second cycles) across
participants and to prevent oblique/secondary movements. Two hundred trials total were
recorded in 50 trial blocks. To begin a trial, participants placed their left index finger on the FSR
and right index finger on coin (tactile cue) at the center of the inclined table. When prepared,
participants were instructed to tap the FSR with their left hand and moved straight out to the
target with the right hand. As they approached the target, the feedback light became visible and
the target disappeared when the pointing finger reaches 75% of the distance to the target along
the Y-axis. When they perceived that their finger was lined up with the vertical height of the
target position in the early trials (see Figure 3-7a), and the vertical height and horizontal position
in the later trials (see Figure 3-7b), they were instructed to tap the FSR once again. They then
returned to the coin (tactile cue) at the center with their right hand and began subsequent trials.
Figure 3-7: Prism adaptation task during early (A) and late (B) trials . Triangle in front of the eyes represents the wedge prism. Dotted arrow represents expected hand trajectory. The grey square represents veridical position of the target. White dot represents visual feedback.

53
3.2.6 Prism de-adaptation
The same task as presented above was repeated after adaptation to 11.4˚ left shifting prisms (and
after all post-adaptation "shift" tasks were complete). Participants pointed to visual targets
located at +9˚, +3˚, 0˚, -3˚, and -9˚ along a horizontal axis in the presence of visual feedback and
without prismatic displacement. A metronome set at 80 beats per minute was used to maintain
similar pointing durations (approximately 3 second cycles) across participants and to prevent
oblique/secondary movements. Seventy trials were recorded. To begin a trial, participants placed
their left index finger on the FSR and right index finger on a raised tactile reference point (coin)
at the center of the inclined table. Participants initiated a trial by tapping the FSR with their left
hand and moved straight out to the target with the right hand. As the index finger of the right
hand approached the target, the feedback light became visible and the target disappeared (at 75%
of the distance to the target along the Y-axis). When they perceived that their finger was aligned
with the remembered position of the visual target, they tapped the FSR to indicate the end the
trial. They then returned to the coin at the center with their right hand and began the next trial.
Figure 3-8: Prism de-adaptation task during early (A) and late (B) trials. Dotted arrows represented anticipated trajectory of the hand. Grey squares represented veridical position of the target. White dots represent visual feedback.

54
3.3 Data analysis
The data were post-processed offline using a customized script (in MATLAB, version 7.6.0; The
Mathworks; Natick, MA). Each pointing movement was assessed by a video that showed its
trajectory. Trials that exhibited secondary/oblique movements or where the task was done
incorrectly were eliminated from the analysis. Additionally, outlier analysis was conducted for
the adaptation and de-adaptation tasks by eliminating any trials that lie outside the ~99.9%
confidence interval (mean ± 3SD) of the exponential fit (see section 3.3.1.2.2 Temporal
properties).
All statistical analyses were performed using the Sigma plot 11.0 software package (Systat
Software Inc.; San Jose, California). Homogeneity of variance and normality assumptions were
tested for using the F-test of equality of variance and Shapiro-Wilk test respectively as well as
observing Q-Q plots. Mean ± standard deviation is presented for each outcome measure. All
negative values indicate a trial where the target, center of body or visual straight ahead
(depending on the task) was to the left of the measures veridical position in space.
All outcome measures were analyzed using the x-axis (horizontal axis), as this was the primary
direction of prism perturbation (lateral shift). This is standard practice throughout the prism
adaptation literature. By replicating previous analyses, one is able to compared the outcome of
this study to that of previous investigations (Fernandez-Ruiz & Diaz, 1999; Fernandez-Ruiz et
al., 2003; Fernandez-Ruiz, Hall, Vergara, & Diiaz, 2000; Martin et al., 1996; Pisella et al., 2004;
Redding & Wallace, 2003a, 2006; and others). Additionally, if the vertical axis was chosen for
analysis, it would have given no information about compensation for a laterally displaced optical
environment. Furthermore, Euclidian distance (i.e. radial error) removes any directionality from
the analysis as it is a 'sum of squares' approach. In this way it confounds the magnitude of
adaptation data, as most of the participants in the current study showed oscillations about the
veridical target position (i.e. slightly to the left or right of the target) at the end of adaptation. If
directionality is removed, it may appear that these participants and further away from their
baseline than they actually are in the axis of prism perturbation.

55
Prior to statistical analysis, all outcome measures were converted to degrees of visual angle by
taking the inverse tangent of the target and/or finger position and dividing it by a constant and
pre-set viewing distance of 460 mm.
3.3.1 Primary outcome measures
3.3.1.1 Pointing with feedback (prism adaptation baseline)
The outcome measures for this task included mean pointing error (accuracy) and variable error
(precision).
The mean pointing error, or accuracy, was defined as the mean difference between terminal
finger and veridical target position. This was calculated for each person individually by
averaging the mean pointing error across all 50 baseline block trials. These data were then
averaged for all participants within a group and compared across groups using Student's t-test
(people with amblyopia vs. visually-normal controls).
The variable error, or precision, was defined as mean standard deviation of the pointing accuracy
throughout the baseline block (Fernandez-Ruiz et al., 2007) The standard deviation was
calculated for each person individually using all 50 baseline block trials. These data were then
averaged within a group and compared across groups using Student's t-test (people with
amblyopia vs. visually-normal controls).
3.3.1.2 Prism adaptation and de-adaptation
3.3.1.2.1 Spatial properties
Normalized magnitude of adaptation and de-adaptation were assessed by taking the mean of the
last 10 baseline trials, and subtracting it from the mean of the last 10 trials of the adaptation and
de-adaptation block respectively (Figure 3-9). At the last ten trials of both the adaptation and de-
adaptation block, all participants across both experimental groups had reached the plateau phase
of the exponential function. The magnitude of adaptation was not expected to be 100% in
visually-normal controls, as there is sometimes head rotation in the direction opposite to visual
displacement (Redding & Wallace, 2004). The normalized magnitude of adaptation and de-

56
adaptation were calculated for each participant individually according to the sample calculation
presented in Figure 3-9. These data were then averaged within each group and compared across
groups using Student's t-test where people with amblyopia were compared directly to visually-
normal controls.
Figure 3-9: Sample calculation for normalized magnitude of adaptation for one visually-normal control. The dashed horizontal line represents mean baseline data. The circle represents the trials that were involved in this calculation.
3.3.1.2.2 Temporal properties
Time constants were computed by fitting an exponential rise to maximum function to raw data
for each participant during prism adaptation (equation 3.1; Figure 3-10a) and exponential decay
functions for de-adaptation (equation 3.2).
(3.1)
(3.2)
By definition, the time constant is the number of trials required to reach ~63.21% of total
adaptation, or the steady-state level of the function, and is equal to 1/b, where b is the rise/decay
constant of the exponential function. F represents the pointing accuracy at a given trial, yo
denotes the steady state (asymptotic) level of pointing reached at the end of adaptation and a is
the change in pointing from beginning of the adaptation block to its conclusion.

57
Prism adaptation and de-adaptation were fit well by these exponential functions, where there was
an initial rapid error correction phase, followed by a gradual error correction phase that
eventually reached a plateau at a steady state. Time constants were computed from the
exponential function for each participant individually. The time constants were then averaged
within each group. Subsequently, a comparison was made for this outcome measure between
visually-normal controls and people with anisometropic amblyopia using Student's t-test for the
adaptation and de-adaptation block individually.
Additionally, a second approach to examining the time course of adaptation was undertaken. In
this method, the data were binned in groups of five trials creating a running average over time.
These data were analyzed using a two-way repeated measures analysis of variance (ANOVA)
with Group (two levels: people with amblyopia and visually-normal control) as the between-
subject factor and bin number as the within-subject repeated factors. Significant main effects and
interactions were analyzed by Tukey's HSD post-hoc test (Figure 3-10b).
Figure 3-10: Representative data for one visually-normal control depicting the exponential fit analysis (A) and binning analysis (B) . The dashed horizontal lines depict the mean baseline data. Error bars represent SEM.

58
3.3.1.3 Realignment tasks
Total shift, visual shift and proprioceptive shift were all calculated in the same manner. These
"shifts" were obtained by subtracting the baseline/pre-adaptation measure from the post-
adaptation measure for the total shift, visual shift and proprioceptive shift individually according
to the sample calculation depicted in Figure 3-11 (Hatada, Rossetti, et al., 2006; Redding &
Wallace, 1996, 2006).
Figure 3-11: Sample calculation for the "shifts" in reference frames for one visually-normal control. Visual, proprioceptive and total shift were all calculated in the same way.
There are two components of the Wilkinson's additivity model that must be described.
The first is the relative proportion of the visual, proprioceptive and total shift tasks. This was
done to assess the impact of visual feedback on realignment. In this case, because terminal
feedback is presented, it is presumed that there will be larger visual shift (based on
proprioceptive input during adaptation) and a smaller proprioceptive shift (based on visual input
during adaptation). To assess this statistically, a two-way repeated measures ANOVA was
performed with Group (2 levels: visually-normal controls and people with anisometropic
amblyopia) as the between-subject factor and Shift (3 levels: visual, proprioceptive, and total) as
the within-subject repeated factor. All significant main effects and interactions were analyzed
using Tukey's HSD method.

59
The second aspect to evaluate when assessing whether this model holds in anisometropic
amblyopia is to assess additivity directly. To do this, a separate two-way repeated measures
ANOVA was performed with Group (2 levels: visually-normal controls and people with
anisometropic amblyopia) as the between-subject factor and Shift (2 levels: total and the sum of
the proprioceptive and visual shift) as the within-subject repeated factor. All significant main
effects and interactions were assessed by Tukey's HSD post-hoc method.
These two analyses were conducted separately because of the fact that the proprioceptive and
visual shift alone are not independent of the summed shifts, which is a violation of one of the
assumptions of ANOVA.

60
Chapter 4 Results
4.1 Pointing with feedback (prism adaptation baseline)
Figure 4-1a summarizes the result of the analysis for the comparison of control participants and
people with anisometropic amblyopia for baseline pointing accuracy. There was no significant
differences between the two groups on baseline pointing accuracy (controls = -0.34 ± 0.43˚ vs.
people with anisometropic amblyopia = -0.13 ± 0.24˚; t(16) = -1.18, p = 0.26). Figure 5-12b
depicts the mean standard deviation, or precision, of the two groups on this baseline task.
Visually-normal control participants (1.01 ± 0.29˚) and people with anisometropic amblyopia
(1.00 ± 0.14˚) displayed similar variable error on this type of pointing task (t(16) = 0.08, p = 0.94).
Figure 4-1: Group mean accuracy (A) and precision (B) for the baseline block. Error bars represent SEM.
The effect of target position on pointing accuracy and precision during this baseline task was
also examined. To assess accuracy of pointing movements to the various target positions, the
data were averaged for each target position, and compared across groups. A two-way repeated
measures mixed model ANOVA (between-subject factor: group [visually-normal control vs.
people with amblyopia]; within-subject factor: target position [-9˚, -3˚, 0˚, +3˚, +9]) was used
followed by Tukey's HSD post-hoc test. Figure 4-2a shows the results of the analysis. As can be
seen, there was no significant interaction between Group and Target Position (F (4,64) = 1.44, p =
0.23) and no significant main effect of Group (F(1,16) = 1.12, p = 0.31). This said, there was an
effect of target position (F(4,64) = 9.18, p < 0.001), where pointing accuracy to the -9˚ and +9˚

61
target significantly differed from one another. Additionally, the -9˚ and +9˚ differed
significantly in accuracy of pointing from the +3˚, 0˚ and -3˚ target positions (Figure 4-2a).
The same analysis was carried out for the precision of pointing movements to each target
eccentricity (Figure 4-2b). After subjecting the data to a two-way repeated measures ANOVA
(between-subject factor: Group [visually-normal control vs. people with amblyopia]; within-
subject factor: Target Position [-9˚, -3˚, 0˚, +3˚, +9]) there was no significant main effect of
Group (F(1,16) = 0.45, p = 0.51), Target Position (F(4,64) = 0.94, p = 0.45), or interaction between
these two factors (F(4,64) = 0.98, p = 0.42).
Figure 4-2: Comparison of pointing accuracy (A) and pointing precision (B) to different target positions averaged across all participants. Error bars represent SEM.
4.2 Prism adaptation task
4.2.1 Spatial properties
The magnitude of adaptation was analyzed according to the sample calculation provided above
(see Figure 3-9), where the mean of the last ten trials from the baseline block were subtracted
from the mean of the last ten trials of the adaptation block. Based on this comparison, the mean
normalized magnitude of adaptation for the control group (-0.03 ± 0.81˚) was not significantly
different from our amblyopic cohort (-0.60 ± 0.60˚; t(16) = 1.61, p = 0.13; Figure 4-3).

62
Figure 4-3: Mean normalized magnitude of adaptation for 11 visually-normal controls and seven people with anisometropic amblyopia. Error bars represent SEM.
Although the outcome of the statistical analysis above suggests that there is no significant
difference between the two groups, based on simple examination of the graph it appeared as
though the amblyopic group was much further from their baseline at the end of adaptation. As
such, a simple additional analysis was undertaken to assess how this normalized magnitude of
adaptation compares to zero, where pointing accuracy is expected to be after compensation for
optical displacement. This secondary evaluation was performed as an adjunct to the above
primary analysis due to the fact that the control group displayed a normalized magnitude of
adaptation with variability that crosses the zero line, whereas our experimental group did not.
Two separate one-sample t-tests were conducted comparing both the group consisting of people
with amblyopia and visually-normal control group to zero individually. Based on this analysis, it
can be seen that the anisometropic amblyopia cohort (-0.60 ± 0.60˚; t(6) = -2.64, p = 0.04)
differed significantly from zero, whereas our visually-normal control group did not (-0.03 ±
0.81˚; t(10) = -0.11, p = 0.91).
An additional analysis was conducted to assess the effect of prism adaptation on the initial
pointing error (i.e., the first trial) while wearing wedge prisms. This finding provided
information as to how well the two groups are able to modify pointing trajectories online (within
a single pointing action) using terminal visual feedback (Pisella et al., 2004). As can be seen
(Figure 4-4), there were no significant differences between the two groups on initial pointing

63
error (visually-normal controls = -8.5 ± 1.7˚, people with anisometropic amblyopia = -10.7 ±
3.5˚; t(16) = 1.8, p = 0.09). However, it appears as though the mean of the amblyopia group was
closer to the actual optical displacement of the wedge prisms (~11.4˚) than our visually-normal
control cohort.
Figure 4-4: Comparison of the initial pointing error on the first trial of prism adaptation. Dotted line represents actual optical deviation of the wedge prisms (~11.4˚), Error bars represent SEM.
Moreover, the same secondary examination was used as in the baseline pointing condition to
assess the effect of target position on this task. However, instead of using all trials from this
block (as was done in the baseline measure), only the last ten trials for each target eccentricity
were used to assess the accuracy and precision of pointing movements to these various positions
(10 trials per position; 50 total). Using the last ten trials for each target position was done to
ensure there was no effect of optical displacement on pointing accuracy and precision (the last 10
trials encompass the pointing trials where all participants had reached their plateau phase).
To assess the accuracy of pointing movements to the various target positions, the data were
averaged for each target position, and compared across groups. A two-way repeated measures
ANOVA (between-subject factor: Group [visually-normal control vs. people with amblyopia];
within-subject factor: Target Position [-9˚, -3˚, 0˚, +3˚, +9]) was used followed by Tukey's HSD
post-hoc test. Figure 4-5 shows the results of the analysis. There was a significant main effect
of Group (F (1,16) = 5.21, p = 0.04). Additionally, there was a significant effect of Target Position
on pointing accuracy (F(4,64) = 5.25, p = 0.001), where pointing to the +9˚ target differed

64
significantly from the -9˚, -3˚, and 0˚ targets. There was no significant interaction between these
two factors (F(4,64) = 0.22, p = 0.93; Figure 4-5).
Figure 4-5: Results of the analysis performed on pointing accuracy to different target positions. (A) Main effect of Group. (B) Main effect of Target Position. Error Bars represent SEM.
The same analysis was carried out for the precision of pointing movements to each target
eccentricity and these data are depicted in Figure 4-6. For each position, the standard deviation
of the data for each participant was calculated and the mean of each group was used in the
analysis. These data were subjected to a two-way repeated measures ANOVA (between-subject
factor: group [visually-normal control vs. people with amblyopia]; within-subject factor: target
position [-9˚, -3˚, 0˚, +3˚, +9]) followed by Tukey's HSD post-hoc test. There is no significant
main effect of Group (F(1,16) = 0.00, p = 0.99). As such, the data displayed in Figure 4-6 have
been pooled across all participants. Additionally, there was no significant main effect of Target
Position (F(4,64) = 1.01, p = 0.40), and no significant interaction between the two factors (F(4,64) =
0.88, p = 0.49).

65
Figure 4-6: Precision of movements to the various target positions. Error bars represent SEM.
Due to the fact that the main effect for Group in this model has an F ratio below one, two
separate one-way ANOVAs were run comparing the different target eccentricities in each group
individually. In this analysis, there were no significant differences in endpoint precision when
pointing to the various target positions in either the visually-normal control (F(4,40) = 1.32, p =
0.28) or the anisometropic amblyopia (F(4,24) = 0.71, p = 0.59) groups.
4.2.2 Temporal properties
All participants across both experimental groups displayed an exponential time course of
adaptation. Figure 4-7 depicts the adaptation data for each participant in this study, fitted with
exponential rise to maximum functions. It is noteworthy that generally, the exponential fits
require more trials to asymptote in the group consisting of people with anisometropic amblyopia
than the visually-normal control group.

66

67

68
Figure 4-7: Exponential fits for 11 visually-normal controls (blue) and seven people with anisometropic amblyopia (red).

69
People with anisometropic amblyopia required significantly more trials (mean = 15 ± 9) to adapt
to left shifting optically displacing wedge prisms than visually-normal controls (mean = 5 ± 4;
t(15) = -3.0, p = 0.008; Figure 4-8). The subject that did not display a time constant significantly
different from zero was excluded from the analysis, due to the fact that this participant’s data
was not fit well by the exponential function (Table 4-1).
Figure 4-8: Comparison of mean time constant values. Error Bars represent SEM.

70
Table 4-1: Time constant and R2 values during prism adaptation.
Participant Time Constant 1R
2
C1 2 0.20
C2 1 0.24
C3 4 0.32
C4 8 0.29
C5 2 0.27
C6 2 0.25
C7 4 0.27
C8 2 0.29
C9 9 0.51
C10 4 0.36
C11 16 0.55
A1 10 0.68
A2 12 0.78
A3 19 0.22
A4 7 0.35
A5 32 0.50
A6 10 0.69
A7 291 0.13
1 There was no significant difference between the R
2 values of the two groups (p = 0.28). The pooled mean R
2 of
the two groups (0.38 ± 1.9) was relatively low, presumably due to large dispersion of data surrounding the long
plateau phase of the exponential function.
2 Time constant did not differ significantly from zero (p > 0.05).

71
The alternate method used to analyze the time course of adaptation, namely by binning the data
to create a running average of time, resulted in a similar outcome as displayed above. Based on
this analysis, people with anisometropic amblyopia required more trials to adapt to an optical
shift of the visual world than visually-normal controls. There was a significant Group x Bin
Number interaction (F(39,624) = 3.50, p < 0.001), attributable to differences in bins 1, 2, 3, 4, 5, 6,
7 and 11 between the two groups. As can be seen from Figure 4-9, people with anisometropic
amblyopia displayed a more negative, or leftward, average pointing accuracy during the initial
stages of adaptation, indicating they adapted less than visually-normal controls during that
specific subset of five trials.
Figure 4-9: Averaged binned data for adaptation for all participants across the two experimental groups. Each data point represents the average of five trials from the adaptation block. BL represents average baseline accuracy. Error Bars represent SEM.
In order to explain this difference in the time course of adaptation further, an analysis was
conducted to better characterize the rapid error correction phase of the adaptation block. In order
to assess this phase, a calculation of mean of residuals about an estimated linear function fit to
the strategic recalibration phase of the adaptation block was conducted for each participant
individually. Residuals analysis was chosen as it characterizes the variability of points about a
fitted or estimated function.

72
A linear function (y = mx+b) was fit to the number of trials equal to the time constant plus two
for each individual participant. This approach was chosen to ensure that the plateau phase does
not contaminate the outcome, as this confounder will increase the value of the mean of residuals
by skewing the fitted line. The one subject that did not show a time constant significantly
different from zero was excluded from the analysis (Table 4-1).
To quantitatively assess the mean of residuals, the equation presented below was used to
calculate the shortest distance for each data point (time constant + 2) to the fitted line for every
participant individually and averaged within groups (equation 4.1).
(4.1)
Where is the shortest distance of the point in question to the fitted line, is the difference
between end finger and target position, is the trial number of that pointing movement, is the
slope of the fitted line, and is the y-intercept of the fitted line. A sample calculation is depicted
below (Figure 4-10).
Figure 4-10: Sample calculation of mean residual distance from linear function for one representative visually-normal control.

73
The same analysis presented above was also conducted for the last ten trials of the adaptation
block, where the exponential function had reached its plateau phase. This subsequent analysis
allowed for a direct comparison of the variability in motor output when visual error signals were
large and experimentally induced, i.e. during strategic recalibration, versus when they are similar
to that of baseline pointing, i.e. during spatial realignment, after optical displacement has been
compensated for. This analysis also ensured that there were no differences in variability due to
the prisms themselves, as they were placed over the eyes during all measures used for this
comparison.
In order to evaluate this comparison statistically, a two-way repeated measures ANOVA
(between-subject factor: Group [visually-normal control vs. people with amblyopia]; within-
subject factor: Time [strategic recalibration vs. plateau]) followed by Tukey's HSD post-hoc test.
Based on this analysis, there was a significant interaction between Time x Group (F(1,15) = 17.5, p
< 0.001). As can be seen from Figure 4-11, people with anisometropic amblyopia showed a
significantly higher mean of residuals at the initial stages of adaptation as compared to visually-
normal controls at the strategic recalibration phase of adaptation (p = 0.002), and compared to
themselves during the plateau phase of adaptation (last 10 trials; p = 0.002). Visually-normal
controls did not show a significant difference across the two time points (p = 0.23).
Figure 4-11: Comparison of the mean of residuals at the beginning (time constant + 2) and end of adaptation (last 10 trials of the adaptation block). Error bars represent SEM.

74
To assess the effect of variability on the time course of adaptation for all participants, a Pearson's
product-moment correlation was conducted between the time constant and the mean of residuals.
A correlation co-efficient (r) of +0.60 was obtained with a p-value of 0.01 which indicated a
significant, yet moderate, positive relation between the number of trials required to reach 63% of
adaptation (the time constant) and the amount of variability (mean of residuals) during the linear/
rapid error correction phase of adaptation for all participants included in this study. This said, it
must be noted that only ~36% of the variance was explained by this finding (Figure 4-12).
Figure 4-12: Relation between time constant and mean of residuals. Open symbols represent amblyopic participants.
Lastly, to assess the effect of visual acuity on the time constant of adaptation for the group
consisting of people with anisometropic amblyopia, a second Pearson's product-moment
correlation was conducted between the time constant and the visual acuity of the amblyopic eye.
There was no significant relation between these two measures (r = -0.3, p = 0.55).

75
4.3 Prism de-adaptation task
4.3.1 Spatial properties
Similar to the prism adaptation task, the spatial properties of the prism de-adaptation task were
characterized using the same outcome measures, namely the normalized magnitude of de-
adaptation.
The normalized magnitude of de-adaptation was characterized according to the sample
calculation presented in Figure 3-9. As can be seen in Figure 4-13, the mean normalized
magnitude of de-adaptation for the visually-normal control group (0.51 ± 0.56˚) was not
significantly different from that the people with anisometropic amblyopia cohort (0.13 ± 0.56˚;
t(16) = 1.40, p = 0.18).
Figure 4-13: Comparison of normalized magnitude of de-adaptation between the two groups. Error bars represent SEM.
Although there were no significant differences between the two groups based on this
comparison, it appears as though the control group was functionally further away from their
baseline at the end of adaptation as compared to the people with anisometropic amblyopia group,
whose variability crosses the zero line. As such, an additional simple analysis was conducted to
compare each group individually to zero using a one-sample t-test. Visually-normal control
participants displayed a normalized magnitude of de-adaptation that differs significantly from

76
zero (mean = 0.51 ± 0.56˚; t(10) = 3.04, p = 0.01), whereas people with anisometropic amblyopia
did not (mean = 0.13 ± 0.57˚; t(6) = 0.62, p = 0.56).
Subsequently a secondary analysis was completed to compare accuracy and precision of pointing
movements to the different target eccentricities on this task. Figure 4-14a shows the accuracy of
pointing movements to the different target positions on this task and 4-14b depicts the precision.
There was no significant main effect of Group (accuracy: F(1,16) = 2.06, p = 0.17; precision: F(1,16)
= 1.43, p = 0.25) as such the bars displayed in the figure below are pooled across groups.
Additionally, there were no significant interactions between Group x Target Position (accuracy:
F(4,64) = 1.45, p = 0.23; precision F(4,64) = 0.54, p = 0.71). The only source of significance found
was a main effect of target eccentricity on accuracy (F(4,64) = 3.62, p = 0.01) and precision (F(4,64)
= 3.5, p = 0.01), attributable to a difference in pointing accuracy between the +9˚ and -9˚ target
positions and in pointing precision between the -3˚ and the ±9˚ target positions.
Figure 4-14: Pointing accuracy (A) and precision (B) to each target position during the prism adaptation task pooled across groups. Error bars represent SEM.
4.3.2 Temporal properties
Figure 4-15 demonstrates the exponential decay functions for all of the participants included in
this study. As can be seen, three visually-normal controls and one person with anisometropic
amblyopia did not show the typical exponential decay function for the de-adaptation block
(Figure 4-15; Table 4-2). Additionally, many of the participants in this study did not show a
time constant for this task that differed significantly from zero (Table 4-2).
*

77

78

79
Figure 4-15: Exponential decay functions for the de-adaptation block for visually-normal controls (blue) and people with anisometropic amblyopia (red). Dotted lines represent the average baseline pointing accuracy.

80
Table 4-2: Time constant and R2 values during prism de-adaptation.
Participant Time Constant 1R
2
C1 29 0.18
C2 2 0.21
C3 22 0.55
C4 26 0.05
C5 4 0.23
C6 26 0.09
C7 3N/A N/A
C8 3N/A N/A
C9 4 0.21
C10 3N/A N/A
C11 13 0.33
A1 2
40 0.26
A2 2 0.51
A3 4 0.19
A4 3N/A N/A
A5 2 0.28
A6 25 0.12
A7 6 0.55
1 There was no significant difference between the R
2 values of the two groups (p = 0.34). The pooled mean R
2 of
the two groups (0.26 ± 1.6) is relatively low, presumably due to large dispersion/high variability of data surrounding
the long plateau phase of the exponential fit.
2 Time constants were not significantly different from zero (p > 0.05).
3 Could not fit exponential decay functions to the de-adaptation block for these individuals.
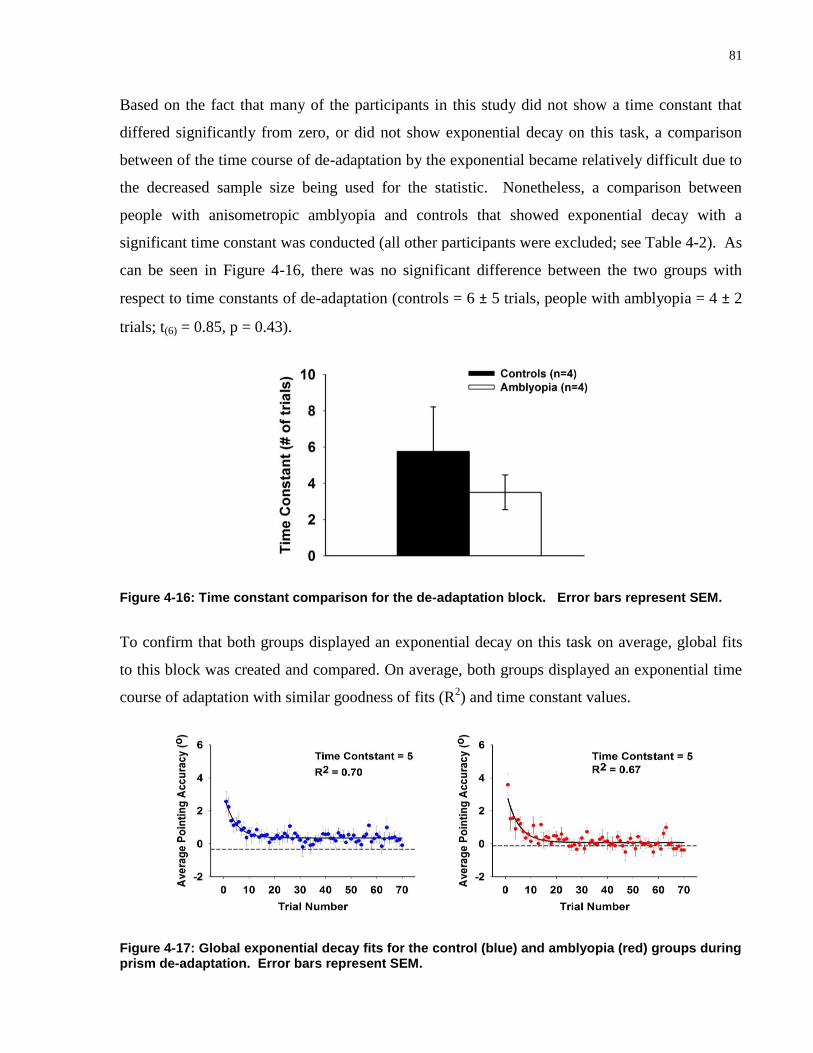
81
Based on the fact that many of the participants in this study did not show a time constant that
differed significantly from zero, or did not show exponential decay on this task, a comparison
between of the time course of de-adaptation by the exponential became relatively difficult due to
the decreased sample size being used for the statistic. Nonetheless, a comparison between
people with anisometropic amblyopia and controls that showed exponential decay with a
significant time constant was conducted (all other participants were excluded; see Table 4-2). As
can be seen in Figure 4-16, there was no significant difference between the two groups with
respect to time constants of de-adaptation (controls = 6 ± 5 trials, people with amblyopia = 4 ± 2
trials; t(6) = 0.85, p = 0.43).
Figure 4-16: Time constant comparison for the de-adaptation block. Error bars represent SEM.
To confirm that both groups displayed an exponential decay on this task on average, global fits
to this block was created and compared. On average, both groups displayed an exponential time
course of adaptation with similar goodness of fits (R2) and time constant values.
Figure 4-17: Global exponential decay fits for the control (blue) and amblyopia (red) groups during prism de-adaptation. Error bars represent SEM.

82
There was no significant main effect of Group (F(1,16) = 1.07, p = 0.32), nor was there a
significant interaction (F(14, 224) = 1.28, p = 0.22) when examining the binned data for the de-
adaptation block. However, there was significant main effect of bin number, where both groups
attained baseline accuracy by bin 3, or approximately 15 trials (F(14, 224) = 14.1, p < 0.001; Figure
4-18).
Figure 4-18: Averaged binned data for de-adaptation for all participants across the two experimental groups. Each data point represents the average of five trials from the de-adaptation block. BL represents average baseline accuracy. Error Bars represent SEM.

83
4.4 Comparison of baseline, prism adaptation and de-adaptation
4.4.1 Comparison of movement duration across the three blocks
Due to the fact that there is a well understood trade-off between speed and accuracy during
pointing movements as described by Fitt's law (Fitts, 1954), it is imperative that an assessment of
movement duration be included to ensure that the between-group differences are not the result of
different movement speeds, but rather of visual processing capabilities. Although the metronome
was used to ensure equal duration times and consistent prism exposure, a statistical evaluation of
movement duration is presented here to ensure that there are in fact no differences in the
movement durations across group, as some participants may not have had movement times
consistent with the metronome.
Movement duration was calculated by taking the interval from movement onset until end of
movement. Movement onset was defined as the point where the velocity of the limb exceeded 30
mm/s. Similarly, end movement time was defined as the point where the velocity of the limb fell
below 30 mm/s.
The statistical analysis used a two-way repeated measures ANOVA with Group (2 levels:
visually-normal controls and people with anisometropic amblyopia) as the between-subject
factor and Block (3 levels: baseline, adaptation and de-adaptation) and the within-subject
repeated factor followed by Tukey's HSD post-hoc analysis. Based on this investigation, there
was no significant main effect of Group (F(1,18) = 0.6, p = 0.46), Block (F(2,32) = 0.2, p = 0.8) nor
was there a significant interaction (F(2,32) = 1.3, p = 0.30) where movement time was equal to 490
± 22 ms collapsed across groups and blocks.

84
4.4.2 Comparison of the magnitude of adaptation and de-adaptation
There was a significant main effect of Block between the normalized magnitude of adaptation (-
0.2 ± 0.8˚) and de-adaptation (0.4 ± 0.6˚; F(1,16) = 15.99, p = 0.001) as assessed by a two-way
ANOVA with Group (visually-normal controls vs. people with anisometropic amblyopia) as the
between-subject factor and Block (adaptation vs. de-adaptation) as the within-subject factor.
There was no effect of Group (F(1,16) = 3.02, p = 0.10) and no significant interaction between
Group x Block (F(1,16) = 0.38, p = 0.55) found (Figure 4-19).
Figure 4-19: Comparison of the normalized magnitude of adaptation and de-adaptation pooled across groups. Error Bars represent SEM.
Additionally, although these two measures differ significantly in magnitude, they were positively
correlated with one another in the visually-normal control group (r = +0.63, p = 0.04; Figure 4-
20a), similar to what has been described previously (Fernandez-Ruiz & Diaz, 1999). Using
Pearson's product moment correlation, it was demonstrated that this relation could not be
replicated for the anisometropic amblyopia group (r = +0.29, p = 0.52; Figure 4-20b).

85
Figure 4-20: Relation between normalized magnitude of adaptation and de-adaptation for visually-normal controls (A) and people with amblyopia (B). There is a significant, positive correlation in the control but not the amblyopia group.
4.5 Realignment tasks
Table 4-3 outlines the shifts in the hand-eye (total), eye-in-head (visual) and hand-in-head
(proprioceptive) reference frames from before to after adaptation according to the sample
calculation presented in Figure 3-10. On average, both the visually-normal controls and people
with anisometropic amblyopia displayed shifts in the expected direction for all three reference
frames (Hatada, Rossetti, et al., 2006; Redding et al., 2005; Redding & Wallace, 1996, 2003a,
2006; Wilkinson, 1971).
When comparing the magnitudes of these shifts across groups, the only significant outcome was
a main effect of Shift (within-subject factor with levels total shift, visual shift and proprioceptive
shift; F(2,32) = 39.3, p < 0.001) where the total shift (5.8 ± 2.0˚) was significantly different from
both the proprioceptive (1.5 ± 3.8˚) and visual shifts (-2.2 ± 2.7˚). More importantly, however,
there was a significant difference between the visual and proprioceptive shift with a larger
absolute magnitude of the visual shift, as expected based on presentation of terminal feedback
(Redding & Wallace, 1990); Figure 4-21). There was no significant interaction observed
between Group x Shift (F(2,32) = 3.1, p = 0.06).
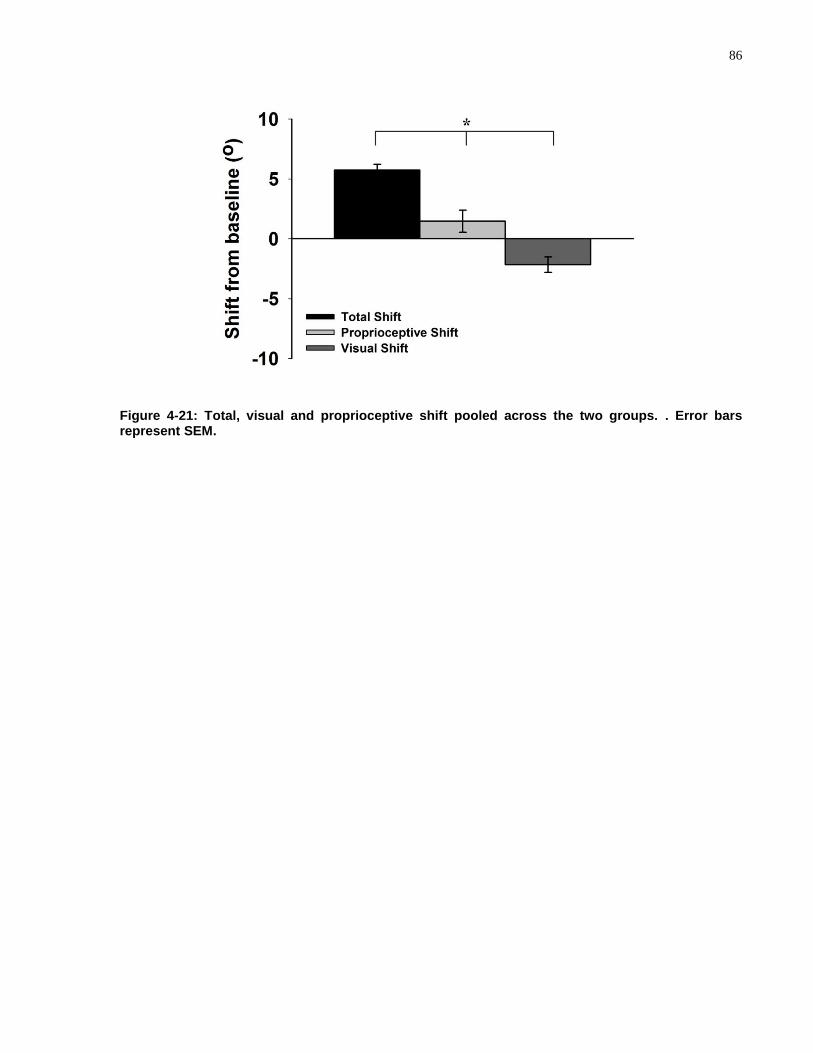
86
Figure 4-21: Total, visual and proprioceptive shift pooled across the two groups. . Error bars represent SEM.

87
Table 4-3: "shifts" for all of the participants included in this study.
Participant Total1 Visual
2 Proprioceptive
3 |Total|
|Visual| +
|Proprioceptive|
C1 4.0˚ -0.3˚4 4.3˚ 4.0˚ 4.6˚
C2 7.4˚ -7.8˚ -3.0˚5 7.4˚ 10.8˚
C3 6.4˚ -4.2˚ 2.1˚ 6.4˚ 6.4˚
C4 4.1˚ -5.0˚ 1.3˚ 4.1˚ 6.3˚
C5 3.1˚ -1.7˚ 7.3˚ 3.1˚ 9.0˚
C6 3.2˚ -2.8˚ -1.3˚5 3.2˚ 4.0˚
C7 7.1˚ 0.5˚4,5
5.3˚ 7.1˚ 5.8˚
C8 5.7˚ -4.6˚ 6.9˚ 5.7˚ 11.5˚
C9 4.8˚ -2.4˚ -0.3˚4,5
4.8˚ 2.8˚
C10 4.3˚ -7.6˚ -6.4˚5 4.3˚ 14.0˚
C11 8.7˚ -0.3˚4 4.3˚ 8.7˚ 6.1˚
Average 5.3 ± 1.8˚ -3.3 ± 2.8˚ 1.9 ± 4.4 5.3 ± 1.8˚ 7.4 ± 3.5˚
A1 8.0˚ -0.7˚ 5.9˚ 8.0˚ 6.6˚
A2 5.2˚ -1.5˚ -0.3˚4, 5
5.2˚ 1.8˚
A3 7.0˚ 0.9˚5 -1.2˚
5 7.0˚ 2.2˚
A4 10.0˚ -0.9˚ -1.5˚5 10.0˚ 2.4˚
A5 6.6˚ 1.5˚5 -0.1˚
4,5 6.6˚ 1.5˚
A6 3.1˚ -2.1˚ 3.7˚ 3.1˚ 5.8˚
A7 4.3˚ 0.1˚4,5
-2.2˚5 4.3˚ 2.4˚
Average 6.3 ± 2.4˚ -0.4 ± 1.3 0.6 ± 3.0 6.3 ± 2.4˚ 3.2 ± 2.1˚
1 Measure of the total sensorimotor co-ordination loop. Shift is expected to be rightward.
2 Measure of the change in eye-in-head reference frame after adaptation. Shift is expected to be leftward.
3 Measure of the change in hand-in-head reference frame after adaptation. Shift is expected to be rightward.
4 Post-adaptation is not significantly different from the pre-adaptation/baseline measure.
5 Shift is in the unexpected direction.

88
4.5.1 Wilkinson's additivity model
To demonstrate the overall additivity model, Figure 4-22 displays the absolute values of the total,
visual, proprioceptive and summed shifts for each group individually, situated next to a figure
adapted from the literature (Redding & Wallace, 2006). Generally, the visually-normal control
group displayed a trend similar to that of the data derived from the literature, albeit with more
variability surrounding the means presumably due to a difference in sample size, whereas the
group composed of people with amblyopia appeared on observation somewhat different.
Figure 4-22: Comparison of realignment aftereffects between literature, control and anisometropic amblyopia values. Error bars represent SEM. Copyright © 2006 by the American Psychological Association. Adapted with permission. The official citation that should be used in referencing this material is (Redding, 2006). The use of APA information does not imply endorsement by APA.

89
The second set of analyses completed compared the |total shift| to the |proprioceptive + visual|
shift, with the results displayed in Figure 4-23. From this comparison, a significant interaction
between Group x |Shift| emerged (F(1,16) = 8.6, p = 0.01), attributable to a difference in the
summed shifts between the two groups (visually-normal controls: 7.4 ± 3.5˚, people with
anisometropic amblyopia: 3.2 ± 2.0˚). Moreover, it is important to note that there was also a
significant difference between the total (6.3 ± 2.4˚) and summed shifts (3.2 ± 2.0˚) within the
amblyopic cohort, but this effect was not observed within the visually-normal control group.
Figure 4-23: Comparison of the |total| shift with the |summed| shifts. Error bars represent SEM.

90
Chapter 5 Discussion and Future Directions
This investigation is the first to examine the effect of the visual deficits in amblyopia on the
ability to adapt to an optically-displaced visual environment induced by wedge prisms. The
results of this study demonstrate that when viewing binocularly, people with anisometropic
amblyopia: 1) exhibit a longer time course of adaptation in response to a leftward shift of the
visual field; 2) show a similar spatial response to optically-displacing prisms as visually-normal
controls (demonstrated by a similar magnitude of adaptation and total shift task); and 3) do not
show typical additivity, or realignment, of the proprioceptive and visual reference frames from
before to after prism adaptation.
5.1 Justification of the experimental paradigm
Generally, investigators performing these experiments have used a single direction of optical
displacement (Efstathiou, 1969; Fernandez-Ruiz et al., 2007; Harris, 1963; Hatada, Rossetti, et
al., 2006; Hay et al., 1965; Redding & Wallace, 1990, 1993; Welch, 1969), as was done in this
study due to some physiological considerations.
Firstly, it has been demonstrated that pointing to a visual target on the same, or ipsilateral side of
the moving limb differs from the same task when the target is presented in the contralateral
visual field (Carey, Hargreaves, & Goodale, 1996; Fisk & Goodale, 1985). These dissimilarities
exist within kinematic parameters such as reaction time (Berlucchi, Crea, Di Stefano, &
Tassinari, 1977; Carey et al., 1996; Carson, Chua, Elliott, & Goodman, 1990; Stefano, Morelli,
Marzi, & Berlucchi, 1980), peak velocity (Carey et al., 1996; Carson, Goodman, & Elliott,
1992), and total duration of movement (Carey et al., 1996; Carson et al., 1990; Carson et al.,
1992) as well as in endpoint accuracy and precision (Carey et al., 1996; Carson et al., 1990;
Carson et al., 1992). Due to the fact that all participants in this study were right handed
volunteers, placing right shifting prisms over the eyes would result in ipsilateral, uncrossed
movements to the visual targets, whereas left shifting prisms would result in contralateral, or
crossed movements to the visual targets. A single direction of optical shift was chosen to ensure
that the differences listed above did not confound the data. Additionally, this finding may
explain some of the pointing differences in precision and accuracy to the various target positions,

91
where generally pointing to the more eccentric targets displayed differential results in our
experimental groups (see Chapter 4 - Results).
Secondly, many previous studies focus on the amelioration of hemispatial neglect by using right
shifting prisms (Jacquin-Courtois et al., 2013; Redding et al., 2005; Sarri et al., 2008). As was
stated earlier, hemispatial neglect results in a loss of visual attention to the left side of space
(Aimola et al., 2012; Parton et al., 2004). By adapting these patients to right-shifting prisms for
extensive periods of time, the aftereffect results in attention being shifted towards the left visual
field. Because there has been so much interest in this clinical application, many studies
examining this deficit have only used right shifting prisms. However, the basic science
underlying the neglect deficit has been studied extensively in visually-normal controls by
attempting to use prism adaptation to induce neglect like symptoms. In these studies,
investigators have used left-shifting prisms to attain neglect like symptoms (bias towards the
right visual field) in healthy controls (Goedert, Leblanc, Tsai, & Barrett, 2010; Michel et al.,
2003). Other pathological conditions such as cerebellar disease (Baizer et al., 1999; Fernandez-
Ruiz et al., 2007; Martin et al., 1996; Pisella et al., 2005; Weiner et al., 1983) have examined
both directions of shifts, but analyzed them in separate models or in separate experiments.
Left-shifting prisms were chosen for this investigation as they have been shown to induce a
larger after-effect in visually-normal controls (Goedert et al., 2010). This concept relies on the
concept that the right hemisphere codes only the left side of space whereas the left hemisphere
contains a representation of both sides of space and can therefore compensate for right
hemispheric damage (Iachini, Ruggiero, Conson, & Trojano, 2009; Weintraub, 1987). This idea
has often been used to explain the fact that generally only right hemispheric lesions result in left
spatial neglect (Weintraub, 1987).

92
5.2 The prism adaptation task
5.2.1 Spatial properties
When comparing the two participant groups involved in this study, there were no significant
differences on the normalized magnitude of adaptation between them. However, when a one-
sample t-test was conducted, it can be seen that people with amblyopia display a significantly
different normalized magnitude of adaptation from zero, meaning they did not fully compensate
for optical displacement of the visual field as visually-normal controls did. This result may have
occurred for a couple of reasons.
Firstly, as was stated above, people with amblyopia display deficits of spatial localization and
positional accuracy on various types of tasks including alignment accuracy (Bradley & Freeman,
1985; Hess & Holliday, 1992; Levi & Klein, 1982b, 1985, 1990), shape discrimination (Watt &
Hess, 1987), line detection (Levi & Klein, 1990), and spatial interval discrimination (Levi &
Klein, 1990). This decreased positional acuity may be a contributing factor for the difference
between the two groups. Like the temporal deficit associated with amblyopia on this task, it is
possible that the alternative kinematic strategy associated with having developed with abnormal
visual stimulation in amblyopia resulting in a state of normal visually-guided reaching accuracy
(Niechwiej-Szwedo, Goltz, Chandrakumar, Hirji, Crawford, et al., 2011) is more resistant to
change in response to an altered visual environment, such as an optically displaced visual world.
This increased resistance to alteration may lead to less accurate pointing movements during the
prism adaptation block. Additionally, this concept can be used to explain the finding that there is
a significant main effect for group on pointing accuracy where the amblyopic population
displays worse accuracy when pointing to visual targets in the presence of wedge prisms during
the last 10 trials of adaptation at each target position, where visual error signals are equivalent to
baseline pointing (see Chapter 4 - Results).
A second possibility to explain the difference found in the magnitude of normalized spatial
adaptation between the two groups is that people with amblyopia have demonstrated ‘mini-
neglect’ on perceptual and motor line-bisection tasks (Thiel & Sireteanu, 2009). In the line
bisection investigation, they demonstrated a slight rightward bias on baseline pointing as
compared to visually-normal controls who generally exhibit ‘pseudo-neglect’, displaying a slight

93
leftward bias (Bowers & Heilman, 1980). In our study, it can be seen that during baseline
pointing both participant cohorts display left-shifted baselines. However, it appears upon
examination that the visually-normal control group has a larger leftward bias on baseline
pointing than the group consisting of people with amblyopia. Due to the use of baseline pointing
accuracy in the calculation of normalized magnitude of adaptation, it may be that something
similar to ‘mini-neglect’ during baseline pointing is affecting the people with amblyopia group,
where as pseudo-neglect is affecting the visually-normal control group. This difference in
baseline may lead to the differences observed in magnitude of adaptation.
Other investigations into the prism adaptation paradigm have used the difference between the
initial error on the first trial and last trial of the adaptation block (Fernandez-Ruiz & Diaz, 1999;
Fernandez-Ruiz, Diaz, Aguilar, & Hall-Haro, 2004; Fernandez-Ruiz et al., 2000; Fernandez-Ruiz
et al., 2007) to measure magnitude of adaptation. When using this method to assess the
magnitude of adaptation in the current study, it can be seen that there were no significant
differences between the two groups (t(17) = 0.39, p = 0.7).
Lastly, prisms themselves result in chromatic aberration of light, and these intensity of these
aberrations are dependent on the type of material used to manufacture the optical device
(Marimont, 1994). Although this chromatic aberration is not a major factor in the prisms used
for this investigation, it is possible that the slight aberrations produced in this case affect people
with amblyopia more than our visually-normal control group. It may be that the blur in the
amblyopic eye is worsened by the slight chromatic aberrations produced by the prisms.
Additionally, it has been demonstrated that chromatic aberrations negatively affect contrast
sensitivity (Negishi, Ohnuma, Hirayama, & Noda, 2001). It is well understood that people with
amblyopia already display contrast sensitivity deficits in both the amblyopic (Abrahamsson &
Sjostrand, 1988; Hess & Howell, 1977; Levi & Harwerth, 1977) and fellow eyes (Leguire et al.,
1990; McKee et al., 2003). Therefore, it is possible that this affect of aberrations on contrast
sensitivity may potentiate the deficit already present in these participants. This potentially
enhanced contrast sensitivity deficit may have been a confounding factor in the accuracy and
precision results for pointing during adaptation when the prisms are placed over the eyes,
contributing to the group differences observed upon examination of pointing to the different
target positions.

94
5.2.2 Temporal properties
It is generally understood that the ability to adapt to an optically displaced visual environment
relies on the generation and proper interpretation of a visual error signal that is purely sensory in
nature (Harris, 1963; Tseng et al., 2007). This sensory prediction error is the driving force
behind prism adaptation, and is generated by a discrepancy between expected and actual visual
feedback of hand position in space for a given pointing movement (Tseng et al., 2007).
Conventionally, these error signals near the beginning of adaptation are experimentally larger
than what is observed during everyday life. Over time, these inaccuracies decrease in magnitude
as an effect of updating the underlying forward model of sensorimotor integration (Hinder et al.,
2010; Wolpert et al., 1995b). This modulation in motor output is based on a visual re-afference
signal that eventually results in pointing movements that are similar in precision and accuracy to
baseline trials, and result in sensory prediction errors similar to those observed in the natural
visuo-motor environment (Fernandez-Ruiz & Diaz, 1999; Redding, 2010).
The development of proper sensorimotor integration depends on exposure history to the natural
world (Welch & Goldstein, 1972), where a correlation is created between the motor action itself
and the sensory outcome of that action (Held & Freedman, 1963; von Holst, 1954; Welch &
Goldstein, 1972). On the first pointing movement in response to an optically displaced visual
environment, the central nervous system receives signals that are weakly correlated as
participants have not been exposed to them previously. Therefore, the formation of new
relations are required between the efferent copy of the motor command and the visual
information that is not already coded in the brains neural networks (Held & Freedman, 1963; von
Holst, 1954; Welch & Goldstein, 1972).
This developmental trajectory of sensorimotor integration becomes important when studying
amblyopia as it is a neurodevelopmental disorder of vision. As such, these participants
presumably develop efferent-afferent (motor-sensory) correlations based upon atypical visual
information, which would undoubtedly affect visuomotor control. It is suggested here that these
abnormal correlations may be more resistant to change than those created during normal visual
development, due to the fact they have to deal with more variable visual information (Levi &
Klein, 2003) and visual spatial undersampling (Hess & Anderson, 1993; Levi, Klein, & Wang,
1994). Because of the increased variability in the re-afferent signal driving the motor command

95
(Held, 1965), it may be that people with amblyopia require more trials to efficiently create
correlated input-output (motor-sensory) signals for this new set of visuomotor information. It has
been demonstrated previously, that people with anisometropic amblyopia display similar
precision and accuracy during binocular viewing when pointing to a visual target in a normal
(non-adapted) visual environment (Niechwiej-Szwedo, Goltz, Chandrakumar, Hirji, Crawford, et
al., 2011). This result has also been replicated in the present study, as no difference in precision
or accuracy were found between the two groups on the baseline pointing task. Niechwiej-
Szwedo, Goltz, Chandrakumar, Hirji, Crawford, et al. (2011) went further and characterized the
kinematic parameters of these pointing movements to demonstrate that people with this visual
disorder display longer acceleration phases and a lower peak acceleration and velocity for each
motor command. It is possible that people with amblyopia employ an alternative mechanism
over their lifetime of abnormal visual interpretation of the natural environment to deal with the
atypical sensory signals used to drive motor commands. In other words, when the visual error
signal is small, and similar to everyday life, people with amblyopia are able to attain a state of
visually guided reaching to an intended target with normal accuracy and precision due to this
alternate kinematic strategy.
But what happens when the visuo-motor error observed is dissimilar to the natural environment?
At the beginning of adaptation, where the error is large, experimentally induced and unlike the
natural environment, people with anisometropic amblyopia display more variability in their
motor output as compared to their visually-normal counterparts. Additionally it was
demonstrated that people with amblyopia display a significant difference within themselves
when comparing the mean of residuals at the beginning versus at the end of the adaptation block
where the error signal is similar to the normal visuo-motor environment (see Figure 4-11). This
observed increase in variability is a typical finding throughout the sensorimotor literature on
amblyopia. It has been demonstrated that these participants display spatiotemporal deficits in
vision possibly resulting from increased visual noise (Levi & Klein, 2003) and spatial
uncertainty leading to a loss of spatial precision (Levi & Klein, 1983; Levi et al., 1987; McKee et
al., 2003; Watt & Hess, 1987), as well as visual spatial undersampling (Hess & Anderson, 1993;
Hess & Field, 1994; Hong et al., 1998). Additionally, it has been shown that people with
amblyopia display increased noise in the oculomotor system demonstrated by more variable
saccadic amplitudes (Niechwiej-Szwedo et al., 2010) and latencies (Niechwiej-Szwedo et al.,

96
2010; Raashid et al., 2013) whenever the amblyopic eye is involved (i.e. during binocular and
amblyopic eye viewing). Moreover, it has been demonstrated that participants with
anisometropic amblyopia display diminished short-term saccadic adaptation when the amblyopic
eye is involved due to a less precise visual error signal driving this behavioural response to a
double-stepping target (Raashid et al., 2013).
It is possible that the strategy adopted to deal with visually-guided reaching in everyday life
(Niechwiej-Szwedo, Goltz, Chandrakumar, Hirji, Crawford, et al., 2011) cannot be modified
efficiently when visual error signals are experimentally induced and large, as in the case at the
beginning of the prism adaptation block. Consequently, the increased variability (Levi & Klein,
2003), spatial uncertainty (Levi & Klein, 1983; Levi et al., 1987; McKee et al., 2003) and spatial
undersampling (Hess & Anderson, 1993; Hess & Field, 1994; Hong et al., 1998) of the visual
system in people with amblyopia becomes more pronounced when they are exposed to a visual
error signal where efferent-afferent correlations are weak, resulting in more imprecise motor
output (Held, 1961). The more variable this visual error signal is, the more iterations will be
necessary to efficiently update the forward model of sensorimotor integration (Hinder et al.,
2010; Wolpert et al., 1995b) to allow for compensation in motor performance for the optically-
displaced visual environment. In other words, if this visual error signal, or re-afferent command,
becomes more variable, more trials will be required to attain a similar magnitude of adaptation as
the visually-normal controls. A significant correlation between the number of trials required to
reach ~63.2% of adaptation and the mean of residuals, or variability, at the beginning of the
adaptation block has been demonstrated (see Figure 4-11).
Lastly, it is possible that the temporal asynchrony (Huang et al., 2012) and integration (Altmann
& Singer, 1986) deficits observed in amblyopia can impact visuomotor function during the prism
adaptation paradigm. When feedback is switched on during the prism adaptation task,
participants are required to identify a change in the visual environment that occurs over time (i.e.
going from no vision of the hand to having a visual feedback signal of limb position in space). It
has been demonstrated that on tasks where participants must identify a change in the visual
environment by way of a temporal cue, such as the detection of a changing square on a
checkerboard pattern (Altmann & Singer, 1986) or detection of a dot flashing 180˚ out of phase
with three adjacent dots (Huang et al., 2012), people with amblyopia display slower reaction
times in identifying such a stimulus. It is possible, that the processing time of the visual feedback

97
is delayed in amblyopia, resulting less available information about limb position in space in the
last 25% of movement trajectory. If there is in fact less information when visual feedback of
finger position is available, people with amblyopia may require more trials to process a similar
amount of information as visually-normal controls.
There are only three other instances in the literature where experimental groups have displayed
an increased time course of prism adaptation as compared to visually-normal controls
(Fernandez-Ruiz et al., 2000; Pisella et al., 2004).
Fernandez-Ruiz et al. (2000) demonstrated that prism adaptation is impaired by normal aging.
Specifically it was demonstrated that normal aging results in a longer time course of adaptation
and well as significantly greater negative aftereffect than a group of younger individuals. The
authors of this paper went on to argue that these results were a consequence of impaired motor
control in the aging population. In particular, the authors went onto suggest that the results
obtained may be due to impaired cognition in the aging population resulting in deficits in the
strategic recalibration phase of adaptation. There was no difference in the magnitude of
adaptation or de-adaptation observed. Although these results are similar to those obtained from
the present investigation, there is no evidence in the literature to suggest that there is cognitive
impairment in amblyopia. As such, it appears that impaired strategic motor learning due to a loss
of cognition is probably not the cause of the deficits observed in amblyopia.
In their case study, Pisella et al. (2004) demonstrated a decreased rate of adaptation in a patient
suffering from optic ataxia. It has been demonstrated that optic ataxia results in deficits in online
control of motor action (Battaglia-Mayer & Caminiti, 2002; Cavina-Pratesi et al., 2010). In
addition to an increased time course of prism adaptation in this population, Pisella et al. (2004)
demonstrated that optic ataxia resulted in an initial pointing error closer to the actual optical
displacement of the prisms than in visually-normal controls. The authors argued that the
enhanced initial pointing error was as a result of impaired ability to correct limb trajectory within
a single movement. Interestingly, it has been demonstrated previously that online motor control
is impaired in severe anisometropic amblyopia (Niechwiej-Szwedo, Goltz, et al., 2012). Due to
the fact that the results obtained from this optic ataxia study are similar to that observed in the
present investigation, a systematic analysis of the kinematic data of pointing during prism
adaptation has been undertaken and will be reported in future studies (see section 5.9.1

98
Evaluation of the dynamics of pointing during baseline, prism adaptation and prism de-
adaptation).
Fernandez-Ruiz et al. (2007) demonstrated an increased time course of adaptation in
spinocerebellar ataxia type 2 patients (SCA 2). It was concluded that patients with SCA 2 display
deficits in spatial recalibration and not spatial realignment, as the aftereffect was comparable to
visually-normal controls. These findings were similar to what was observed in amblyopia,
however the deficit in amblyopia is presumably due to a reduced fidelity of the visual signal
reaching the cerebellum, rather than dysfunction of the cerebellum itself.
5.2.2.1 Temporal deficits in amblyopia: impaired strategic recalibration?
Prism adaptation is made up of two distinct phases: strategic recalibration for rapid error
correction and spatial realignment, which is a slower subconscious process that occurs after
recalibration is complete (Redding et al., 2005; Welch, 1978; Welch & Warren, 1986).
Strategic recalibration is a cognitive response to prism perturbation, resulting in rapid error
correction during the initial stages of adaptation (Redding & Wallace, 2001, 2003a). Strategic
recalibration signifies a conscious process where participants use cognitive reasoning, either by
side pointing (pointing in the direction of optical displacement away from the target (Redding &
Wallace, 2004), or by online use of visual feedback (Redding & Wallace, 2006), to rapidly
correct for large motor errors after prisms are placed over the eyes. It has been hypothesized that
the strategic recalibration component of the prism adaptation process is controlled by the
posterior parietal cortex due to its association with error correction during everyday life
(Chapman et al., 2010; Clower et al., 1996; Danckert et al., 2008; Luaute et al., 2009;
Mountcastle, Lynch, Georgopoulos, Sakata, & Acuna, 1975). Amblyopia is known to result in
deficits along the parietal lobe in the processing of visual information (Giaschi et al., 1992;
Hayward et al., 2010; Ho & Giaschi, 2006; Simmers et al., 2003; Simmers et al., 2006). Motor
functions that require this region may be impaired in amblyopia as it has been shown that there
are some deficits in movement initiation and execution in both adults and children (Grant et al.,
2007; Suttle et al., 2011). Strategic recalibration is the adaptive process where the deficit was
observed in the above investigation, evidenced by more variable motor output in people with

99
anisometropic amblyopia. This finding is presumably due to deficits in processing of visual
information along the parietal lobe that is required for normal visually-guided limb movements.
5.3 Comparison of prism adaptation and de-adaptation
It is understood that the magnitude of adaptation is greater than that of de-adaptation (Fernandez-
Ruiz & Diaz, 1999). In the investigation presented, it can be seen that this result has been
replicated. Based on the calculation performed for a normalized magnitude in the present
investigation, a value closer to zero indicates a greater amount of compensation for optical
displacement or the negative aftereffect in the adaptation and de-adaptation tasks respectively.
More interestingly however is that similar to previous literature (Fernandez-Ruiz & Diaz, 1999),
a significant relation between the magnitude of adaptation and de-adaptation was elucidated for
visually-normal controls, but was absent in people with anisometropic amblyopia. This result
was similar to that found in basal ganglia diseases, namely HD and PD, where these patients
displayed no significant correlation between magnitude of adaptation and de-adaptation
(Fernandez-Ruiz et al., 2003). In this case, HD and PD patients displayed a reduced negative
aftereffect as compared to visually-normal controls. Fernandez-Ruiz et al. (2003) discussed that
this finding was most likely due impairments during spatial realignment. The opposite result,
namely that more dependence on spatial realignment results in an enhanced aftereffect, has been
demonstrated in neglect patients (Michel et al., 2003). In contrast, the present investigation did
not demonstrate a magnitude change in the negative aftereffect across groups, rather it appeared
as though people with amblyopia display similar magnitudes of adaptation and de-adaptation
(Figure 4-20b). It has been argued previously that prism adaptation and de-adaptation, although
related, elicit differential processes in order to occur (Fernandez-Ruiz & Diaz, 1999) yet the
nature of these processes have not been elucidated. Based on the findings in people with
amblyopia, it is possible that the nature of this difference lies somewhere in the use of vision as
the magnitude of adaptation and de-adaptation were similar in the people with amblyopia group
and dissimilar in visually-normal controls.

100
5.4 Spatial realignment and Wilkinson's Addivity Model
Spatial realignment is an automatic process which results in the reduction of spatial discordance
of the visual, proprioceptive and motor reference frames (Redding & Wallace, 2006). It thought
to be responsible for the negative aftereffect, and depends on the number of interactions with the
world one has after donning the prisms (Fernandez-Ruiz & Diaz, 1999). It has been suggested
that the realignment phase of prism adaptation is most reliant on the function of the cerebellum
(Luaute et al., 2009; Martin et al., 1996; Pisella et al., 2004). Overall magnitude of spatial
realignment remained unimpaired in people with anisometropic amblyopia during the above
experiment as measured by the total shift task. This implies that, although the visual signal
reaching the cerebellum is more variable in amblyopia, it does result in a similar output after
prism adaptation is complete as compared to visually-normal controls (Levi & Klein, 2003;
Niechwiej-Szwedo et al., 2010).
This study is the first in the prism adaptation literature that specifically examines Wilkinson's
additivity model (Wilkinson, 1971) in a patient population. Here, it was observable that even
though the overall magnitude of the negative aftereffect was similar across groups (a direct
measure of the spatial realignment process), the additivity of the different component reference
frames within Wilkinson's model was impaired in amblyopia. This said, there are some
methodological considerations in visually-normal controls that must be addressed before
discussing the amblyopic result.
5.4.1 Considerations for Additivity in visually-normal controls
It is readily observable from the visually-normal control results (Figure 4-22) that there was a
trend towards over-additivity where the sum of the absolute value of the proprioceptive shift
(change in straight ahead blind pointing) and visual shift (change in perception of visual straight
ahead) was slightly greater than the total shift (change in open-loop pointing). This result has
been addressed in the literature as an effect it of presenting multiple target positions during
adaptation (Redding & Wallace, 1978). Additionally, previous literature has normally performed
the three post-adaptation tasks in the order: visual shift, proprioceptive shift and then total shift
(Wilkinson, 1971). In this study, it was important to determine if the prisms caused a consistent
aftereffect in people with anisometropic amblyopia. The easiest way to assess the magnitude of

101
the negative aftereffect was by observing the change in open-loop pointing from before to after
adaptation, so this was always done first. However, it is generally believed that there is normal
decay of adaptation with time (Hamilton & Bossom, 1964). Over-additivity may result as a
consequence of the differential order of tasks performed (total, visual, proprioceptive) than
previously reported (visual, proprioceptive, total).
It has been demonstrated previously that delayed and displaced visual information can impact
motor control (Smith & Bowen, 1980). Smith and Bowen (1980) demonstrated that the delay of
presentation of visual information about limb position in space can impact the adaptation
process, even when this delay is for as little as 66 ms. The set-up used in the investigation
presented in this thesis was performed on a virtual surface apparatus. If the delay in processing
of the visual feedback information approached this 66 ms threshold, it is possible that the prism
adaptation mechanism did not occur naturally, resulting in the inability to replicate the
Wilkinson's additivity model in visually-normal controls. The OC was set to sample at 200 Hz
resulting in a possible delay of 5 ms. The VSG was set to sample at 120 Hz resulting in a
possible delay of 8.3 ms. Other sources that may cause negligible delays in the presentation of
the stimuli could be the Windows operating system itself, and the CRT monitor. If the sum of
these delays are added, the worst case scenario would result in processing time of approximately
15 ms. Although this value does not reach the 66 ms cut-off threshold designated by Smith and
Bowen (1980), it is possible that the delay in presentation could account, at least partially, for the
inability to replicate the additivity model in visually-normal controls.
5.4.2 Considerations for Addivity in anisometropic amblyopia
Although the visually-normal control group replicated the additivity results previously reported
on average (Redding & Wallace, 1988, 2006; Wilkinson, 1971), people with amblyopia
displayed a completely different response. It was predicted that these participants would display
a response to prism perturbation that would have resulted in more reliance on proprioception
than vision to attain normal total sensory-motor re-coordination. However, we observed a
radically different distribution in the population composed of people with anisometropic
amblyopia as compared to visually-normal controls. This finding may be due to the fact that
there is a visual influence on proprioceptive development during infancy. The most compelling
evidence to suggest this stems from the delayed development of proper posture and locomotive

102
skills in infants who are born completely blind in both eyes (Prechtl, Cioni, Einspieler, Bos, &
Ferrari, 2001; Tobin, Bozic, Douglas, Greaney, & Ross, 1997). It is thought that during
development, visual feedback is provided to the proprioceptive and vestibular systems to
facilitate proper postural control muscles to attain normal control over limbs, torso, head, ect
(Prechtl et al., 2001). Because amblyopia is a developmental disorder of spatial and temporal
vision, it is possible that proprioception was differentially calibrated in these participants during
infancy, leading to abnormal development of the proprioceptive sensory modality when people
with amblyopia reach adulthood. Due to this fact, it is possible that proprioception in amblyopia
is not equivalent to visually-normal controls, and may even be imprecise in this disorder because
it was calibrated based on abnormal vision during early childhood. If proprioception were
abnormal in people with amblyopia, we might expect the component of realignment based on
proprioception (i.e. the visual shift), to be abnormal. Another possibility to explain this effect is
that there additivity does not hold in a non-"normal" brain, however testing in more patient
populations would be necessary to substantiate this hypothesis. Right now, all that can be
concluded is that additivity is not normal in anisometropic amblyopia.
Interestingly, it has been suggested in the literature that there may be a third component to the
additivity model other than just a proprioceptive and visual shift as initially described (Redding
& Wallace, 1993, 1996; Welch, Choe, & Heinrich, 1974; Wilkinson, 1971). Welch et al. (1974)
found that there was no additivity in 100 participants after the prism adaptation paradigm using
similar measures to what was presented in this study. They found that open-loop pointing
magnitude was 1.8˚ more than the summation of the proprioceptive and visual shifts which was
equal to 3.3˚. From this finding they argued that there must be another component involved in
the realignment of sensory coordinate frames after prism adaptation. The authors hypothesized
that this non-additivity was due to a learned visual-motor response during the rapid error
correction phase, or strategic recalibration phase, of prism adaptation (Welch et al., 1974). It is
possible, because strategic recalibration is presumably affected in amblyopia (see section 5.2.2.1
- temporal deficits in amblyopia: impaired strategic recalibration?), that it impacts the additivity
model differently in people with anisometropic amblyopia than in visually-normal controls.
Lastly, it has been suggested that multisensory integration may be impaired in amblyopia.
Narinesingh, Wan, Goltz, Chandrakumar, and Wong (2014) demonstrated that participants with

103
amblyopia display a reduced McGurk effect, a visual-auditory perceptual illusion. During this
experiment, auditory sounds are paired with visual stimuli of a face showing either the same or
different mouth position for that particular phoneme (McGurk & MacDonald, 1976). In
visually-normal participants, when there is a dissociation between the visual and auditory
information presented, they tend to hear a sound that does not match the auditory stimulus, but
they are more likely to hear to sound that matches the visual input (Saint-Amour, De Sanctis,
Molholm, Ritter, & Foxe, 2007). In contrast, people with amblyopia generally display responses
that match the auditory stimulus during these incongruent trials during all three viewing
conditions of binocular, amblyopic and fellow eye viewing. (Narinesingh et al., 2014).
This idea of abnormal multisensory integration poses an interesting question with respect to the
Wilkinson's additivity model. How can we expect normal realignment of visual and
proprioceptive coordinate frames after prism adaptation if there is a suggestion that baseline
multisensory integration, in this case visual-proprioceptive integration, is impaired before any
adaptive processes are completed? In order to assess if baseline integration is impaired in
amblyopia among these modalities, further investigation will be required (see section 5.9 Future
directions).
5.5 Are the findings due to more than just visual acuity?
One of the most common questions asked in amblyopia research is "how do we know that the
observed deficits are due to more than just monocular blur?" This is an interesting question, and
one that needs to be addressed in this complex disorder. Based on results from this study and
previous literature, it is extremely likely that the deficits observed here were the result of the
multifaceted spatiotemporal deficits associated with anisometropic amblyopia rather than just the
diminished visual acuity.
Previously, a study had been conducted to examine the effect of monocular blur on pointing
precision and accuracy in visually-normal controls as compared to people with anisometropic
amblyopia. Niechwiej-Szwedo, Kennedy, et al. (2012) placed lenses over the eyes of a visually-
normal control and blurred their vision to acuity match those of the group consisting of people
with anisometropic amblyopia. Their task was initiated reach-to-touch movements to visual
targets after five hours of monocular blurring, where both binocular and monocular testing was

104
completed. Based on this experimental protocol, it was found that there was no effect of
monocular blur on eye-hand coordination and reaching movements in healthy controls. People
with anisometropic amblyopia displayed alternate kinematics on reaching movements on the
identical task, indicating that these differences are attributable to more than just the visual acuity
deficit. It was therefore concluded that visual blur was really just one of the triggers for
anisometropic amblyopia, but the important difference between these participants and visually-
normal controls is the abnormal sensory development that results as a consequence of this blur
during early childhood (Wright, 2006).
Additionally, a correlational analysis was conducted in the present study to assess if there was a
relation between visual acuity and time constants during prism adaptation, as the difference in
time constant values between the two groups was the main and most important finding of this
investigation. There was no significant correlation determined (r = -0.3, p = 0.55), indicating
that there is no relation between these two factors. Additionally, the people with anisometropic
amblyopia who had the best visual acuity displayed time constant values similar to those with the
worst acuity and deepest form of amblyopia who participated in this study.
5.6 Insight into the prism adaptation paradigm
Prism adaptation has been extensively studied for the last century in order to better understand
the mechanisms underlying perceptuomotor control and how the CNS is able to transform
changing visual afferent commands in everyday life into sensible and efficient motor output.
Insight from this investigation has provided more merit to the idea that the sensory prediction
estimate, in this case specifically a visual error signal, is required to induce prism adaptation.
Presumably, the motor system of people with amblyopia is normal, as is their cerebellum. The
fact that there were deficits found in the temporal and spatial aspects of this paradigm suggests
that vision is being used to drive adaptation.
Secondly, it has been demonstrated previously that strategic recalibration and spatial realignment
are dissociable processes (Redding & Wallace, 1993, 1996). This investigation has helped
support this notion, as people with amblyopia display deficits during the strategic recalibration
phase, as observed by an increased time course of adaptation, but display similar negative

105
aftereffects (open-loop pointing and magnitude of de-adaptation), indicating a normal magnitude
of spatial realignment (but not spatial realignment in general as there is abnormal additivity).
Lastly, this investigation discussed Wilkinson's additivity model in a population that does not
have normal vision. This finding was very interesting as it is the first study to show that the
additivity model does not hold in this visual disorder, in that there is no apparent linear relation
between the realignment of sensory coordinate frames after adaptation (Redding & Wallace,
1993; Welch et al., 1974; Wilkinson, 1971). More investigation is required in other disorders to
assess if it is just amblyopia that affects additivity. This may also serve as another physiological
example of the "three-component" model of prism adaptation (Welch et al., 1974), but more
investigation is required to confirm this hypothesis.
5.7 Importance of this study
From a clinical perspective, this investigation helped to characterize the adaptive ability of the
amblyopic manual motor system in response to displaced visual information. The
characterization of all deficits associated with amblyopia through basic science research may
lead the way for eventual sensorimotor therapies to serve as adjuncts to current sensory-only
therapies such as patching or pharmacological penalization of the fellow eye.
From a basic science perspective, prism adaptation has been examined in many "top-down"
pathologies such as cerebellar ataxia, where these patients have shown decreased or absent
adaption to wedge prisms (Fernandez-Ruiz et al., 2007; Martin et al., 1996). This investigation is
the first study to directly investigate the influence of "bottom-up" visual disorders such as
amblyopia, where the spatiotemporal deficits are evident as early as the primary visual cortex,
during prism adaptation. Amblyopia can be thought of as a "lesion" at the sensory processing
stage, rather than the motor control stage (as in the cerebellum, basal ganglia or parietal cortex),
and provide insight as to how the visual signal processing within the occipital cortex helps to
control visuomotor function.

106
5.8 Conclusion
In conclusion, this study is the first to examine the effect of prism adaptation in anisometropic
amblyopia. The results demonstrate that participants with anisometropic amblyopia display a
decreased rate of adaptation, a similar magnitude of adaptation, a similar magnitude of the
negative aftereffect, and abnormal additivity of reference frames after adaptation. It is suggested
that people with amblyopia display deficits during the strategic recalibration phase of adaptation.
It was specifically demonstrated that there was increased variability in the strategic recalibration
phase of adaptation in people with amblyopia as compared to visually-normal controls at the
same time point and themselves at the plateau phase of adaptation and decreased rate of
adaptation. It was suggested that these deficits were due to abnormal processing of visual
information along the extra-striate visual streams, increased variability in creating new efferent-
afferent correlations in response to optically displacing wedge prisms and deficits in temporal
integration of vision when visual feedback of limb position is switched on.
5.9 Future directions
There are some questions about visual-proprioceptive-motor integration in amblyopia that are
left open ended at the conclusion of this study. The following section will outline future studies
that will hope to answer some of these remaining questions.
5.9.1 Pointing kinematics during baseline, adaptation & de-adaptation
The chief premise of the above investigation was to understand the ability to adapt the manual
motor system to an altered visual stimulus in people with anisometropic amblyopia. The main
finding that was established from this study is that participants with anisometropic amblyopia
require more trials to adapt to optically displacing wedge prisms. Based on the increased
variability observed in motor output during the rapid, cognitive, strategic recalibration phase of
adaptation, it was suggested that people with amblyopia may display deficits in the ability to
efficiently use visual feedback online to alter motor performance during a single pointing
movement or to use this feedback to update the motor command in subsequent movements. In
other words, it has been suggested that online control of motor functions may be impaired during
prism adaptation in anisometropic amblyopia (Niechwiej-Szwedo, Goltz, et al., 2012).

107
If online motor control in amblyopia is impaired during prism adaptation, we may expect that the
results obtained from this study would be similar to those obtained from prism adaptation in
optic ataxia. In their case study, Pisella et al. (2004) demonstrated that in optic ataxia there is
compensation for optical displacement, albeit at a slower pace. Additionally, it was found that
the initial pointing error on the first trial during adaptation is closer to the actual optical
displacement of the prisms than when performed by visually-normal controls due to the inability
for patients with optic ataxia to use online feedback to alter the pointing command during the
movement. These findings are similar to the behaviour observed in people with anisometropic
amblyopia in the present investigation. However, this is where the comparisons between the
behavioural manifestations of these two pathological processes end - amblyopia is a
neurodevelopmental sensory deficit whereas optic ataxia occurs due to a focal lesion along the
parietal lobule, generally due to a stroke, and is not developmental in its trajectory.
In order to test this hypothesis, it is important to assess directly the ability of the manual motor
system to integrate and receive online modifications during pointing movements, especially
during the prism adaptation task.
O'Shea et al. (2014) demonstrated that there are specific kinematic markers that distinguish the
rapid recalibration and spatial realignment phase of prism adaptation. The most compelling
finding from this paper was that during the early stages of prism adaptation, in this case the first
10 trials, a significant correlation was elucidated between the terminal finger position at the end
of a motor action and the start position of the limb on the subsequent trial. This relation was not
found in the late stages of adaptation (trial 90-100), indicating that during the early phases of
prism adaptation the motor action is updated on a trial-by-trial basis, whereas it is not in the late
stages. Additionally, O'Shea et al. (2014) showed that spatial realignment and strategic
recalibration can be separated by specific kinematic markers within a single pointing trial.
Specifically, it was demonstrated that the peak acceleration was increased during the strategic
recalibration phase (as compared to baseline), indicating that rapid error correction occurs as a
consequence of feedforward motor control. In contrast, the acceleration phase during each
pointing movement of the spatial realignment phase was similar to that of baseline pointing and
it was concluded that this phase relies chiefly on feedback mechanisms.

108
What has yet to be demonstrated is the contribution of online control of motor action during the
two phases of prism adaptation. In order to assess the impact of deficits in online motor control
during prism adaptation in anisometropic amblyopia, and to elucidate if online control
contributes to prism adaptation in visually-normal controls, a correlation co-efficient analysis
will be undertaken. Due to the fact that the feedback of hand position in space was only
presented during the last 25% of movement distance, it must first be determined if any online
control is able to take place. It has been suggested previously that the minimum threshold for the
motor system to exhibit online corrections of limb movements in response to visual stimuli
requires approximately 100ms of visual feedback (Saunders & Knill, 2003). If there is sufficient
time to assess online control in these participants, an examination of the correlation between
finger position when the feedback comes on, i.e. at 25% distance to the target, and at the end of
the trial, i.e. at 0% distance to the target, will be undertaken. A high correlation co-efficient
between these two measures indicates that no online correction has occurred -- the position of the
limb has not been modified within a single pointing trial. In contrast, a low correlation co-
efficient indicates that online modification of limb trajectory has been accomplished (Heath,
2005).
This subsequent kinematic analysis was beyond the scope of the present investigation, as these
data are currently quite variable and thus require a larger sample size in order to assess directly.
This will be carried out in future studies and provide more insight into the dissociation between
recalibration and realignment in general, and discuss how these processes are affected by
abnormal, imprecise visual input.

109
5.9.2 Visual-haptic integration in amblyopia
Abnormal integration of different sensory modalities, namely auditory and visual stimuli, have
been demonstrated previously in amblyopia (Narinesingh et al., 2014). It was suggested above
that perhaps we do not see normal realignment of the visual and proprioceptive coordinate
frames after prism adaptation due to abnormal integration of these modalities at a steady state, or
baseline level. One way to test this concept is to look at visual-haptic integration in this
population.
Haptic perception is generally defined as a combination of cutaneous and kinesthetic afferent
input (Klatzky & Lederman, 2010), and involves coordination between touch and proprioception
which are often thought to be related, yet dissociable senses (Canzoneri, Ferre, & Haggard,
2014).
It has been shown previously on numerous studies in different experimental paradigms that
haptics and vision, like other multisensory integration paradigms, associate in a statistically
optimal fashion and are well fit by the maximum likelihood estimation model (Ernst & Banks,
2002; Ernst & Bülthoff, 2004). Ernst and Banks (2002) demonstrated that on a spatially driven
task, healthy participants rely more on visual information than haptic information. In this
experiment, when asked to distinguish the difference in height between two subsequent visual-
haptic stimuli consisting of a three-dimensional visual percept combined with a haptic force
feedback device, the results were always biased towards the visual estimate of height. Once
visual noise was introduced into the system, the height estimate was pulled away from the visual
percept and driven towards the haptic percept. Similarly, Phillips and Egan (2009) found the
same results using a physical haptic stimulus, rather than a three-dimensional rendition with a
force-feedback device.
As was stated above, amblyopia has long been associated with increased variability in the visual
system (Kiorpes, 2006; Levi & Klein, 2003; Nordmann et al., 1992). As such, it should be
expected that normal, statistically optimal multisensory integration where vision is involved
would be impaired by relying less on this modality. As such, an important experiment to help
interpret the additivity results would be to understand if there are any impairments in baseline
sensory integration resulting in the anomalous additivity results observed.

110
One potential experiment would be very similar to the Helbig and Ernst (2007) study where
each modality was assessed independently to compare to the effect when the senses combine.
This investigation would work well in amblyopia, as there are no stereoscopic representation of
stimuli as in the Ernst and Banks (2002) study or dependence on frequency as in the Phillips and
Egan (2009) investigation as both of stereopsis and frequency are known to be deficient in
amblyopia (Birch, 2013; Levi & Harwerth, 1977). All three stages will involve a two-alternative
forced choice paradigm. In the haptics only task, two similar haptic stimuli will be presented in
sequence and participants will have to answer whether or not they are the same. Using the same
reasoning, the visual only task will involve two stimuli again answering whether they are the
same or different. On the final task used to assess integration, a visual and haptic stimulus will
be presented concurrently, followed by another multimodal stimulus. It will be up to the
participant to answer whether or not the two subsequent presentations are the same stimuli or
different stimuli.
If differences in baseline haptic-visual integration are observed on this task, it may help to
explain the abnormal additivity results observed in amblyopia. This will be an important
investigation to discover how multisensory integration occurs in amblyopia.
5.10 Limitations
The major limitation of this investigation was the number of patients available during the
timeline for thesis completion. Although there were enough participants recruited to result in
sensible outcomes and sufficiently powered statistics for the time course and spatial
characteristics measures presented, more subjects would have been of benefit. For example, the
Wilkinson's additivity model data are quite variable at present, so more people with
anisometropic amblyopia may have been useful in the calculation of these parameters and may
have lead to data that could have been interpreted in a clearer fashion.
111
References
Abrahamsson, M., & Sjostrand, J. (1988). Contrast sensitivity and acuity relationship in
strabismic and anisometropic amblyopia. Br J Ophthalmol, 72(1), 44-49.
Aimola, L., Rogers, G., Kerkhoff, G., Smith, D. T., & Schenk, T. (2012). Visuomotor adaptation
is impaired in patients with unilateral neglect. Neuropsychologia, 50(6), 1158-1163. doi:
10.1016/j.neuropsychologia.2011.09.029
Albin, R. L., Young, A. B., & Penney, J. B. (1989). The functional anatomy of basal ganglia
disorders. Trends Neurosci, 12(10), 366-375. doi: 10.1016/0166-2236(89)90074-x
Algaze, A., Roberts, C., Leguire, L., Schalbrock, P., & Rogers, G. (2002). Functional magnetic
resonance imaging as a tool for investigating amblyopia in the human visual cortex: a
pilot study. J AAPOS, 6(5), 300-308.
Altmann, L., & Singer, W. (1986). Temporal integration in amblyopic vision. Vision Res, 26(12),
1959-1968.
Andersen, R. A. (1989). Visual and eye movement functions of the posterior parietal cortex.
Annu Rev Neurosci, 12, 377-403. doi: 10.1146/annurev.ne.12.030189.002113
Andersen, R. A., Essick, G. K., & Siegel, R. M. (1985). Encoding of spatial location by posterior
parietal neurons. Science, 230(4724), 456-458.
Astafiev, S. V., Shulman, G. L., Stanley, C. M., Snyder, A. Z., Van Essen, D. C., & Corbetta, M.
(2003). Functional organization of human intraparietal and frontal cortex for attending,
looking, and pointing. J Neurosci, 23(11), 4689-4699.
Atkinson, J., Braddick, O., Rose, F. E., Searcy, Y. M., Wattam-Bell, J., & Bellugi, U. (2006).
Dorsal-stream motion processing deficits persist into adulthood in Williams syndrome.
Neuropsychologia, 44(5), 828-833.
Auburger, G. W. J. (2012). Chapter 26 - Spinocerebellar ataxia type 2. In H. S. Sankara & D.
Alexandra (Eds.), Handbook of Clinical Neurology (Vol. Volume 103, pp. 423-436).
Amsterdam: Elsevier.
Auerbach, S. H., & Alexander, M. P. (1981). Pure agraphia and unilateral optic ataxia associated
with a left superior parietal lobule lesion. J Neurol Neurosurg Psychiatry, 44(5), 430-432.
Baizer, J. S., Kralj-Hans, I., & Glickstein, M. (1999). Cerebellar lesions and prism adaptation in
macaque monkeys. J Neurophysiol, 81(4), 1960-1965.
Barnes, G. R., Hess, R. F., Dumoulin, S. O., Achtman, R. L., & Pike, G. B. (2001). The cortical
deficit in humans with strabismic amblyopia. J Physiol, 533(Pt 1), 281-297.
Barone, P., & Joseph, J. P. (1989). Role of the dorsolateral prefrontal cortex in organizing
visually guided behavior. Brain Behav Evol, 33(2-3), 132-135.

112
Battaglia-Mayer, A., & Caminiti, R. (2002). Optic ataxia as a result of the breakdown of the
global tuning fields of parietal neurones. Brain, 125(2), 225-237.
Behrmann, M., Geng, J. J., & Shomstein, S. (2004). Parietal cortex and attention. Curr Opin
Neurobiol, 14(2), 212-217. doi: 10.1016/j.conb.2004.03.012
Berlucchi, G., Crea, F., Di Stefano, M., & Tassinari, G. (1977). Influence of spatial stimulus-
response compatibility on reaction time of ipsilateral and contralateral hand to lateralized
light stimuli. J Exp Psychol Hum Percept Perform, 3(3), 505-517. doi:
http://dx.doi.org/10.1037/0096-1523.3.3.505
Birch, E. E. (2013). Amblyopia and binocular vision. Prog Retin Eye Res, 33(0), 67-84. doi:
10.1016/j.preteyeres.2012.11.001
Birch, E. E., & Swanson, W. H. (2000). Hyperacuity deficits in anisometropic and strabismic
amblyopes with known ages of onset. Vision Res, 40(9), 1035-1040.
Blakemore, C., & Cooper, G. F. (1970). Development of the brain depends on the visual
environment. Nature, 228(5270), 477-478.
Bonneh, Y. S., Sagi, D., & Polat, U. (2004). Local and non-local deficits in amblyopia: acuity
and spatial interactions. Vision Res, 44(27), 3099-3110. doi: 10.1016/j.visres.2004.07.031
Bonneh, Y. S., Sagi, D., & Polat, U. (2007). Spatial and temporal crowding in amblyopia. Vision
Res, 47(14), 1950-1962. doi: 10.1016/j.visres.2007.02.015
Bowers, D., & Heilman, K. M. (1980). Pseudoneglect: effects of hemispace on a tactile line
bisection task. Neuropsychologia, 18(4-5), 491-498.
Braddick, O., Atkinson, J., Julesz, B., Kropfl, W., Bodis-Wollner, I., & Raab, E. (1980). Cortical
binocularity in infants. Nature, 288(5789), 363-365.
Bradley, A., & Freeman, R. D. (1985). Is reduced vernier acuity in amblyopia due to position,
contrast or fixation deficits? Vision Res, 25(1), 55-66.
Bridgeman, B. (1995). A review of the role of efference copy in sensory and oculomotor control
systems. Ann Biomed Eng, 23(4), 409-422.
Buneo, C. A., & Andersen, R. A. (2006). The posterior parietal cortex: sensorimotor interface for
the planning and online control of visually guided movements. Neuropsychologia,
44(13), 2594-2606. doi: 10.1016/j.neuropsychologia.2005.10.011
Caminiti, R., Ferraina, S., & Mayer, A. B. (1998). Visuomotor transformations: early cortical
mechanisms of reaching. Curr Opin Neurobiol, 8(6), 753-761.
Canzoneri, E., Ferre, E. R., & Haggard, P. (2014). Combining proprioception and touch to
compute spatial information. Exp Brain Res, 232(4), 1259-1266. doi: 10.1007/s00221-
014-3842-z

113
Carey, D. P., Hargreaves, E. L., & Goodale, M. A. (1996). Reaching to ipsilateral or contralateral
targets: within-hemisphere visuomotor processing cannot explain hemispatial differences
in motor control. Exp Brain Res, 112(3), 496-504. doi: 10.1007/bf00227955
Carson, R. G., Chua, R., Elliott, D., & Goodman, D. (1990). The contribution of vision to
asymmetries in manual aiming. Neuropsychologia, 28(11), 1215-1220.
Carson, R. G., Goodman, D., & Elliott, D. (1992). Asymmetries in the discrete and
pseudocontinuous regulation of visually guided reaching. Brain Cogn, 18(2), 169-191.
doi: 10.1016/0278-2626(92)90077-y
Cavina-Pratesi, C., Ietswaart, M., Humphreys, G. W., Lestou, V., & Milner, A. D. (2010).
Impaired grasping in a patient with optic ataxia: primary visuomotor deficit or secondary
consequence of misreaching? Neuropsychologia, 48(1), 226-234. doi:
10.1016/j.neuropsychologia.2009.09.008
Chapman, H. L., Eramudugolla, R., Gavrilescu, M., Strudwick, M. W., Loftus, A., Cunnington,
R., & Mattingley, J. B. (2010). Neural mechanisms underlying spatial realignment during
adaptation to optical wedge prisms. Neuropsychologia, 48(9), 2595-2601. doi:
10.1016/j.neuropsychologia.2010.05.006
Choi, M. Y., Lee, D. S., Hwang, J. M., Choi, D. G., Lee, K. M., Park, K. H., & Yu, Y. S. (2001).
Comparison between anisometropic and strabismic amblyopia using functional magnetic
resonance imaging Br J Ophthalmol, 85(9), 1052-1056.
Choi, M. Y., Lee, D. S., Hwang, J. M., Choi, D. G., Lee, K. M., Park, K. H., & Yu, Y. S. (2002).
Characteristics of glucose metabolism in the visual cortex of amblyopes using positron-
emission tomography and statistical parametric mapping. J Pediatr Ophthalmol
Strabismus, 39(1), 11-19.
Clower, D. M., Hoffman, J. M., Votaw, J. R., Faber, T. L., Woods, R. P., & Alexander, G. E.
(1996). Role of posterior parietal cortex in the recalibration of visually guided reaching.
Nature, 383(6601), 618-621. doi: 10.1038/383618a0
Cohen, M. M. (1967). Continuous versus terminal visual feedback in prism aftereffects. Percept
Mot Skills, 24(3), 1295-1302.
Cohen, M. R., & Newsome, W. T. (2009). Estimates of the contribution of single neurons to
perception depend on timescale and noise correlation. J Neurosci, 29(20), 6635-6648.
doi: 10.1523/JNEUROSCI.5179-08.2009
Connolly, J. D., Andersen, R. A., & Goodale, M. A. (2003). FMRI evidence for a 'parietal reach
region' in the human brain. Exp Brain Res, 153(2), 140-145. doi: 10.1007/s00221-003-
1587-1
Constantine-Paton, M., Cline, H. T., & Debski, E. (1990). Patterned activity, synaptic
convergence, and the NMDA receptor in developing visual pathways. Annu Rev
Neurosci, 13, 129-154. doi: 10.1146/annurev.ne.13.030190.001021

114
Constantinidis, C., Franowicz, M. N., & Goldman-Rakic, P. S. (2001). The sensory nature of
mnemonic representation in the primate prefrontal cortex. Nat Neurosci, 4(3), 311-316.
doi: 10.1038/85179
Craske, B. (1967). Adaptation to prisms: change in internally registered eye-position. Br J
Psychol, 58(3), 329-335.
Crawford, J. D., Medendorp, W. P., & Marotta, J. J. (2004). Spatial transformations for eye-hand
coordination. J Neurophysiol, 92(1), 10-19. doi: 10.1152/jn.00117.2004
Crawshaw, M., & Craske, B. (1974). No retinal component in prism adaptation. Acta Psychol,
38(6), 421-423.
Culham, J. C., Danckert, S. L., De Souza, J. F., Gati, J. S., Menon, R. S., & Goodale, M. A.
(2003). Visually guided grasping produces fMRI activation in dorsal but not ventral
stream brain areas. Exp Brain Res, 153(2), 180-189.
Cummings, J. L., & Cole, G. (2002). Alzheimer disease. JAMA, 287(18), 2335-2338. doi:
10.1001/jama.287.18.2335
Dallala, R., Wang, Y.-Z., & Hess, R. F. (2010). The global shape detection deficit in strabismic
amblyopia: contributions of local orientation and position. Vision Res, 50(16), 1612-
1617.
Danckert, J., Ferber, S., & Goodale, M. A. (2008). Direct effects of prismatic lenses on
visuomotor control: an event-related functional MRI study. Eur J Neurosci, 28(8), 1696-
1704. doi: 10.1111/j.1460-9568.2008.06460.x
Davis, A. R., Sloper, J. J., Neveu, M. M., Hogg, C. R., Morgan, M. J., & Holder, G. E. (2003).
Electrophysiological and psychophysical differences between early- and late-onset
strabismic amblyopia. Invest Ophthalmol Vis Sci, 44(2), 610-617.
Daw, N. W. (1998). Critical periods and amblyopia. Arch Ophthalmol, 116(4), 502-505.
Daw, N. W. (2006). Functional Organization of the Visual System Visual Development (Vol. c,
pp. 18-39). New York, NY: Springer.
De Valois, R. L., & De Valois, K. K. (2002). Spatial Vision. In V. S. Ramachandran (Ed.),
Encyclopedia of the Human Brain (pp. 419-431). New York: Academic Press.
Deng, W., Saxe, M. D., Gallina, I. S., & Gage, F. H. (2009). Adult-born hippocampal dentate
granule cells undergoing maturation modulate learning and memory in the brain. J
Neurosci, 29(43), 13532-13542. doi: 10.1523/JNEUROSCI.3362-09.2009
Derrington, A. (2001). The lateral geniculate nucleus. Curr Biol, 11(16), R635-637. doi:
10.1016/s0960-9822(01)00379-7
Diener, H. C., & Dichgans, J. (1992). Pathophysiology of cerebellar ataxia. Mov Disord, 7(2),
95-109. doi: 10.1002/mds.870070202

115
Efstathiou, E. (1969). Effects of exposure time and magnitude of prism transform on eye-hand
coordination. J Exp Psychol, 81(2), 235-240.
Ellemberg, D., Lewis, T. L., Maurer, D., & Brent, H. P. (2000). Influence of monocular
deprivation during infancy on the later development of spatial and temporal vision.
Vision Res, 40(23), 3283-3295.
Ernst, M. O., & Banks, M. S. (2002). Humans integrate visual and haptic information in a
statistically optimal fashion. Nature, 415(6870), 429-433. doi: 10.1038/415429a
Ernst, M. O., & Bülthoff, H. H. (2004). Merging the senses into a robust percept. Trends Cogn
Sci, 8(4), 162-169.
Eugene, D., Deforges, S., Vibert, N., & Vidal, P. P. (2009). Vestibular critical period, maturation
of central vestibular neurons, and locomotor control. Ann N Y Acad Sci, 1164, 180-187.
doi: 10.1111/j.1749-6632.2008.03727.x
Fernandez-Ruiz, J., & Diaz, R. (1999). Prism adaptation and aftereffect: specifying the properties
of a procedural memory system. Learn Mem, 6(1), 47-53.
Fernandez-Ruiz, J., Diaz, R., Aguilar, C., & Hall-Haro, C. (2004). Decay of prism aftereffects
under passive and active conditions. Brain Res Cogn Brain Res, 20(1), 92-97. doi:
10.1016/j.cogbrainres.2004.01.007
Fernandez-Ruiz, J., Diaz, R., Hall-Haro, C., Vergara, P., Mischner, J., Nunez, L., . . . Alonso, M.
E. (2003). Normal prism adaptation but reduced after-effect in basal ganglia disorders
using a throwing task. Eur J Neurosci, 18(3), 689-694.
Fernandez-Ruiz, J., Hall, C., Vergara, P., & Diiaz, R. (2000). Prism adaptation in normal aging:
slower adaptation rate and larger aftereffect. Brain Res Cogn Brain Res, 9(3), 223-226.
doi: 10.1016/s0926-6410(99)00057-9
Fernandez-Ruiz, J., Velasquez-Perez, L., Diaz, R., Drucker-Colin, R., Perez-Gonzalez, R.,
Canales, N., . . . Auburger, G. (2007). Prism adaptation in spinocerebellar ataxia type 2.
Neuropsychologia, 45(12), 2692-2698. doi: 10.1016/j.neuropsychologia.2007.04.006
Field, D. P., Shipley, T. F., & Cunningham, D. W. (1999). Prism adaptation to dynamic events.
Percept Psychophys, 61(1), 161-176.
Fisk, J. D., & Goodale, M. A. (1985). The organization of eye and limb movements during
unrestricted reaching to targets in contralateral and ipsilateral visual space. Exp Brain
Res, 60(1), 159-178. doi: 10.1007/bf00237028
Fitts, P. M. (1954). The information capacity of the human motor system in controlling the
amplitude of movement. J Exp Psychol, 47(6), 381-391.
Friel, K., Chakrabarty, S., Kuo, H. C., & Martin, J. (2012). Using motor behavior during an early
critical period to restore skilled limb movement after damage to the corticospinal system
during development. J Neurosci, 32(27), 9265-9276.

116
Fronius, M., & Sireteanu, R. (1989). Monocular geometry is selectively distorted in the central
visual field of strabismic amblyopes. Invest Ophthalmol Vis Sci, 30(9), 2034-2044.
Fronius, M., Sireteanu, R., & Zubcov, A. (2004). Deficits of spatial localization in children with
strabismic amblyopia. Graefes Arch Clin Exp Ophthalmol, 242(10), 827-839. doi:
10.1007/s00417-004-0936-5
Fujita, N., Tanaka, H., Takanashi, M., Hirabuki, N., Abe, K., Yoshimura, H., & Nakamura, H.
(2001). Lateral geniculate nucleus: anatomic and functional identification by use of MR
imaging. American journal of neuroradiology, 22(9), 1719-1726.
Gauthier, G. M., Hofferer, J. M., Hoyt, W. F., & Stark, L. (1979). Visual-motor adaptation.
Quantitative demonstration in patients with posterior fossa involvement. Arch Neurol,
36(3), 155-160.
Giaschi, D. E., Regan, D., Kraft, S. P., & Hong, X. H. (1992). Defective processing of motion-
defined form in the fellow eye of patients with unilateral amblyopia. Invest Ophthalmol
Vis Sci, 33(8), 2483-2489.
Goedert, K. M., Leblanc, A., Tsai, S. W., & Barrett, A. M. (2010). Asymmetrical effects of
adaptation to left- and right-shifting prisms depends on pre-existing attentional biases. J
Int Neuropsychol Soc, 16(5), 795-804. doi: 10.1017/S1355617710000597
Gonzalez, E. G., Wong, A. M., Niechwiej-Szwedo, E., Tarita-Nistor, L., & Steinbach, M. J.
(2012). Eye position stability in amblyopia and in normal binocular vision. Invest
Ophthalmol Vis Sci, 53(9), 5386-5394. doi: 10.1167/iovs.12-9941
Goodale, M. A. (2011). Transforming vision into action. Vision Res, 51(13), 1567-1587.
Goodale, M. A., & Milner, A. D. (1992). Separate visual pathways for perception and action.
Trends Neurosci, 15(1), 20-25.
Goodale, M. A., & Westwood, D. A. (2004). An evolving view of duplex vision: separate but
interacting cortical pathways for perception and action. Curr Opin Neurobiol, 14(2), 203-
211.
Goodyear, B. G., Nicolle, D. A., & Menon, R. S. (2002). High resolution fMRI of ocular
dominance columns within the visual cortex of human amblyopes. Strabismus, 10(2),
129-136. doi: 10.1076/stra.10.2.129.8140
Gordon, J. A., & Stryker, M. P. (1996). Experience-dependent plasticity of binocular responses
in the primary visual cortex of the mouse. J Neurosci, 16(10), 3274-3286.
Granet, D. B., & Khayali, S. (2011). Amblyopia and strabismus. Pediatr Ann, 40(2), 89-94. doi:
10.3928/00904481-20110117-08
Grant, S., Melmoth, D. R., Morgan, M. J., & Finlay, A. L. (2007). Prehension deficits in
amblyopia. Invest Ophthalmol Vis Sci, 48(3), 1139-1148. doi: 10.1167/iovs.06-0976

117
Griepentrog, G. J., Diehl, N., & Mohney, B. G. (2013). Amblyopia in childhood eyelid ptosis.
Am J Ophthalmol, 155(6), 1125-1128 e1121. doi: 10.1016/j.ajo.2012.12.015
Guillery, R. W. (1972). Binocular competition in the control of geniculate cell growth. J Comp
Neurol, 144(1), 117-129. doi: 10.1002/cne.901440106
Gupta, N. (2008). Refractive Errors. Encyclopedia of Global Health. SAGE Publications, Inc.
Thousand Oaks, CA: SAGE Publications, Inc.
Gutierrez-Garralda, J. M., Moreno-Briseno, P., Boll, M. C., Morgado-Valle, C., Campos-Romo,
A., Diaz, R., & Fernandez-Ruiz, J. (2013). The effect of Parkinson's disease and
Huntington's disease on human visuomotor learning. Eur J Neurosci, 38(6), 2933-2940.
doi: 10.1111/ejn.12288
Hakuta, K., Bialystok, E., & Wiley, E. (2003). Critical evidence: a test of the critical-period
hypothesis for second-language acquisition. Psychol Sci, 14(1), 31-38. doi:
10.1111\1467-9280.01415
Hamasaki, D. I., & Flynn, J. T. (1981). Amblyopic eyes have longer reaction times. Invest
Ophthalmol Vis Sci, 21(6), 846-853.
Hamilton, C. R., & Bossom, J. (1964). Decay of Prism Aftereffects. J Exp Psychol, 67(2), 148-
150. doi: http://dx.doi.org/10.1037/h0047777
Harris, C. S. (1963). Adaptation to displaced vision: visual, motor, or proprioceptive change?
Science, 140(3568), 812-813.
Hatada, Y., Miall, R. C., & Rossetti, Y. (2006). Long lasting aftereffect of a single prism
adaptation: Directionally biased shift in proprioception and late onset shift of internal
egocentric reference frame. Exp Brain Res, 174(1), 189-198. doi: 10.1007/s00221-006-
0437-3
Hatada, Y., Rossetti, Y., & Miall, R. C. (2006). Long-lasting aftereffect of a single prism
adaptation: shifts in vision and proprioception are independent. Exp Brain Res, 173(3),
415-424. doi: 10.1007/s00221-006-0381-2
Hay, J. C., Pick, H. L., & Ikeda, K. (1965). Visual capture produced by prism spectacles.
Psychon Sci, 2, 215-216.
Hayward, J., Truong, G., Partanen, M., & Giaschi, D. E. (2010). The effect of speed, age and
amblyopia on the perception of motion-defined form J Vis, 10(7), 2216-2223.
Heath, M. (2005). Role of limb and target vision in the online control of memory-guided reaches.
Motor Control, 9(3), 281-311.
Hebart, M. N., & Hesselmann, G. (2012). What visual information is processed in the human
dorsal stream? J Neurosci, 32(24), 8107-8109.

118
Helbig, H. B., & Ernst, M. O. (2007). Optimal integration of shape information from vision and
touch. Exp Brain Res, 179(4), 595-606. doi: 10.1007/s00221-006-0814-y
Held, R. (1961). Exposure-history as a factor in maintaining stability of perception and
coordination. J Nerv Ment Dis, 132, 26-32.
Held, R. (1965). Plasticity in sensory-motor systems. Sci Am, 213(5), 84-94.
Held, R., & Freedman, S. J. (1963). Plasticity in Human Sensorimotor Control. Science,
142(3591), 455-462.
Held, R., & Hein, A. V. (1958). Adaptation of Disarranged Hand-Eye Coordination Contingent
Upon Re-Afferent Stimulation. Perceptual and Motor Skills, 8(3), 87-90. doi:
10.2466/pms.1958.8.3.87
Heron, G., Dholakia, S., Collins, D. E., & McLaughlan, H. (1985). Stereoscopic thresholds in
children and adults. Am J Optom Phys Opt, 62(8), 505-515.
Hess, R. F., & Anderson, S. J. (1993). Motion sensitivity and spatial undersampling in
amblyopia. Vision Res, 33(7), 881-896.
Hess, R. F., & Field, D. J. (1994). Is the spatial deficit in strabismic amblyopia due to loss of
cells or an uncalibrated disarray of cells? Vision Res, 34(24), 3397-3406.
Hess, R. F., & Holliday, I. E. (1992). The spatial localization deficit in amblyopia. Vision Res,
32(7), 1319-1339. doi: http://dx.doi.org/10.1016/0042-6989(92)90225-8
Hess, R. F., & Howell, E. R. (1977). The threshold contrast sensitivity function in strabismic
amblyopia: evidence for a two type classification. Vision Res, 17(9), 1049-1055.
Hess, R. F., & Pointer, J. S. (1985). Differences in the neural basis of human amblyopia: the
distribution of the anomaly across the visual field. Vision Res, 25(11), 1577-1594.
Hess, R. F., & Thompson, B. (2013). New insights into amblyopia: binocular therapy and
noninvasive brain stimulation. J AAPOS, 17(1), 89-93.
Hess, R. F., Wang, Y. Z., Demanins, R., Wilkinson, F., & Wilson, H. R. (1999). A deficit in
strabismic amblyopia for global shape detection. Vision Res, 39(5), 901-914.
Hinder, M. R., Riek, S., Tresilian, J. R., de Rugy, A., & Carson, R. G. (2010). Real-time error
detection but not error correction drives automatic visuomotor adaptation. Exp Brain Res,
201(2), 191-207.
Ho, C. S., & Giaschi, D. E. (2006). Deficient maximum motion displacement in amblyopia.
Vision Res, 46(28), 4595-4603. doi: 10.1016/j.visres.2006.09.025
Ho, C. S., Giaschi, D. E., Boden, C., Dougherty, R., Cline, R., & Lyons, C. (2005). Deficient
motion perception in the fellow eye of amblyopic children. Vision Res, 45(12), 1615-
1627. doi: 10.1016/j.visres.2004.12.009

119
Holmes, J. M., & Clarke, M. P. (2006). Amblyopia. Lancet, 32(5), 1343-1351.
Holopigian, K., Blake, R., & Greenwald, M. J. (1988). Clinical suppression and amblyopia.
Invest Ophthalmol Vis Sci, 29(3), 444-451.
Hong, W., Levi, D. M., & Klein, S. A. (1998). Spatial uncertainty and sampling efficiency in
amblyopic position acuity. Vision Research, 38(9), 1239-1251.
Horton, J. C., & Hocking, D. R. (1996). Pattern of ocular dominance columns in human striate
cortex in strabismic amblyopia. Vis Neurosci, 13(4), 787-795.
Horton, J. C., Hocking, D. R., & Adams, D. L. (1999). Metabolic mapping of suppression
scotomas in striate cortex of macaques with experimental strabismus. J Neurosci, 19(16),
7111-7129.
Horton, J. C., Hocking, D. R., & Kiorpes, L. (1997). Pattern of ocular dominance columns and
cytochrome oxidase activity in a macaque monkey with naturally occurring
anisometropic amblyopia. Vis Neurosci, 14(4), 681-689.
Huang, P. C., Li, J., Deng, D., Yu, M., & Hess, R. F. (2012). Temporal synchrony deficits in
amblyopia. Invest Ophthalmol Vis Sci, 53(13), 8325-8332. doi: 10.1167/iovs.12-10835
Hubel, D. H., & Wiesel, T. N. (1962). Receptive fields, binocular interaction and functional
architecture in the cat's visual cortex. J Physiol, 160(1), 106-154.
Hubel, D. H., & Wiesel, T. N. (1965). Binocular interaction in striate cortex of kittens reared
with artifical squint. J Neurophysiol, 28(6), 1041-1059.
Hubel, D. H., Wiesel, T. N., & LeVay, S. (1977). Plasticity of ocular dominance columns in
monkey striate cortex. Philos Trans R Soc Lond B Biol Sci, 278(961), 377-409.
Husk, J. S., & Hess, R. F. (2013). Global processing of orientation in amblyopia. Vision Res,
82(0), 22-30. doi: 10.1016/j.visres.2013.02.005
Iachini, T., Ruggiero, G., Conson, M., & Trojano, L. (2009). Lateralization of egocentric and
allocentric spatial processing after parietal brain lesions. Brain Cogn, 69(3), 514-520.
doi: 10.1016/j.bandc.2008.11.001
Ikeda, H., & Wright, M. J. (1976). Properties of LGN cells in kittens reared with convergent
squint: a neurophysiological demonstration of amblyopia. Exp Brain Res, 25(1), 63-77.
Jacquin-Courtois, S., O'Shea, J., Luaute, J., Pisella, L., Revol, P., Mizuno, K., . . . Rossetti, Y.
(2013). Rehabilitation of spatial neglect by prism adaptation: a peculiar expansion of
sensorimotor after-effects to spatial cognition. Neurosci Biobehav Rev, 37(4), 594-609.
doi: 10.1016/j.neubiorev.2013.02.007
Jeffrey, B. G., Wang, Y. Z., & Birch, E. E. (2004). Altered global shape discrimination in
deprivation amblyopia. Vision Res, 44(2), 167-177.

120
Johnson, J. S., & Newport, E. L. (1989). Critical period effects in second language learning: The
influence of maturational state on the acquisition of English as a second language.
Cognitive Psychology, 21(1), 60-99. doi: 10.1016/0010-0285(89)90003-0
Karnath, H. O., Ferber, S., & Himmelbach, M. (2001). Spatial awareness is a function of the
temporal not the posterior parietal lobe. Nature, 411(6840), 950-953. doi:
10.1038/35082075
Karnath, H. O., & Perenin, M. T. (2005). Cortical control of visually guided reaching: evidence
from patients with optic ataxia. Cereb Cortex, 15(10), 1561-1569. doi:
10.1093/cercor/bhi034
Katz, L. C. (1999). What's critical for the critical period in visual cortex? Cell, 99(7), 673-676.
Keech, R. V., & Kutschke, P. J. (1995). Upper age limit for the development of amblyopia. J
Pediatr Ophthalmol Strabismus, 32(2), 89-93.
Kelly, S. P., & O'Connell, R. G. (2013). Internal and external influences on the rate of sensory
evidence accumulation in the human brain. J Neurosci, 33(50), 19434-19441. doi:
10.1523/JNEUROSCI.3355-13.2013
Kiorpes, L. (2006). Visual processing in amblyopia: animal studies. Strabismus, 14(1), 3-10. doi:
10.1080/09273970500536193
Kiorpes, L., Kiper, D. C., & Movshon, J. A. (1993). Contrast sensitivity and vernier acuity in
amblyopic monkeys. Vision Res, 33(16), 2301-2311.
Kiorpes, L., Kiper, D. C., O'Keefe, L. P., Cavanaugh, J. R., & Movshon, J. A. (1998). Neuronal
correlates of amblyopia in the visual cortex of macaque monkeys with experimental
strabismus and ansiometropia J Neurosci, 18(16), 6411-6424.
Kiorpes, L., & Wallman, J. (1995). Does experimentally-induced amblyopia cause hyperopia in
monkeys? Vision Res, 35(9), 1289-1297.
Klatzky, R. L., & Lederman, S. J. (2010). Haptics. Encyclopedia of Perception. SAGE
Publications, Inc. Thousand Oaks, CA: SAGE Publications, Inc.
Kornheiser, A. S. (1976). Adaptation to laterally displaced vision: a review. Psychol Bull, 83(5),
783-816.
Lacquaniti, F., Guigon, E., Bianchi, L., Ferraina, S., & Caminiti, R. (1995). Representing spatial
information for limb movement: role of area 5 in the monkey. Cereb Cortex, 5(5), 391-
409. doi: 10.1093/cercor/5.5.391
Lamotte, R. H., & Acuna, C. (1978). Defects in accuracy of reaching after removal of posterior
parietal cortex in monkeys. Brain Res, 139(2), 309-326.
Leat, S. J., Yadav, N. K., & Irving, E. L. (2009). Development of visual acuity and contrast
sensitivity in children. J Am Optom Assoc, 2(1), 19-26.

121
Leguire, L. E., Rogers, G. L., & Bremer, D. L. (1990). Amblyopia: the normal eye is not normal.
J Pediatr Ophthalmol Strabismus, 27(1), 32-38.
Lepard, C. W. (1975). Comparative changes in the error of refraction between fixing and
amblyopic eyes during growth and development. Am J Ophthalmol, 80(3 Pt 2), 485-490.
LeVay, S., Wiesel, T. N., & Hubel, D. H. (1980). The development of ocular dominance
columns in normal and visually deprived monkeys. J Comp Neurol, 191(1), 1-51. doi:
10.1002/cne.901910102
Levi, D. M. (2006). Visual processing in amblyopia: human studies. Strabismus, 14(1), 11-19.
doi: 10.1080/09273970500536243
Levi, D. M. (2013). Linking assumptions in amblyopia. Vis Neurosci, 30(5-6), 277-287. doi:
10.1017/S0952523813000023
Levi, D. M., & Harwerth, R. S. (1977). Spatio-temporal interactions in anisometropic and
strabismic amblyopia. Invest Ophthalmol Vis Sci, 16(1), 90-95.
Levi, D. M., & Klein, S. A. (1982a). Differences in vernier discrimination for grating between
strabismic and anisometropic amblyopes. Invest Ophthalmol Vis, 23(3), 398-407.
Levi, D. M., & Klein, S. A. (1982b). Hyperacuity and amblyopia. Nature, 298(5871), 268-270.
Levi, D. M., & Klein, S. A. (1983). Spatial localization in normal and amblyopic vision. Vision
Res, 23(10), 1005-1017.
Levi, D. M., & Klein, S. A. (1985). Vernier acuity, crowding and amblyopia. Vision Res, 25(7),
979-991.
Levi, D. M., & Klein, S. A. (1990). Equivalent intrinsic blur in amblyopia. Vision Res, 30(12),
1995-2022.
Levi, D. M., & Klein, S. A. (2003). Noise provides some new signals about the spatial vision of
amblyopes. J Neurosci, 23(7), 2522-2526.
Levi, D. M., Klein, S. A., & Wang, H. (1994). Amblyopic and peripheral vernier acuity: a test-
pedestal approach. Vision Res, 34(24), 3265-3292. doi: http://dx.doi.org/10.1016/0042-
6989(94)90065-5
Levi, D. M., Klein, S. A., & Yap, Y. L. (1987). Positional uncertainty in peripheral and
amblyopic vision. Vision Res, 27(4), 581-597.
Levi, D. M., & Li, R. W. (2009). Improving the performance of the amblyopic visual system.
Philos Trans R Soc Lond B Biol Sci, 364(1515), 399-407. doi: 10.1098/rstb.2008.0203
Levi, D. M., Yu, C., Kuai, S. G., & Rislove, E. (2007). Global contour processing in amblyopia.
Vision Res, 47(4), 512-524. doi: 10.1016/j.visres.2006.10.014

122
Lewis, T. L., & Maurer, D. (2005). Multiple sensitive periods in human visual development:
evidence from visually deprived children. Dev Psychobiol, 46(3), 163-183. doi:
10.1002/dev.20055
Li, J., Thompson, B., Deng, D., Chan, L. Y., Yu, M., & Hess, R. F. (2013). Dichoptic training
enables the adult amblyopic brain to learn. Curr Biol, 23(8), R308-309. doi:
10.1016/j.cub.2013.01.059
Li, R. W., & Levi, D. M. (2004). Characterizing the mechanisms of improvement for position
discrimination in adult amblyopia. J Vis, 4(6), 476-487. doi: 10:1167/4.6.7
Li, R. W., Ngo, C., Nguyen, J., & Levi, D. M. (2011). Video-game play induces plasticity in the
visual system of adults with amblyopia. PLoS Biol, 9(8), e1001135. doi:
10.1371/journal.pbio.1001135
Li, X., Dumoulin, S. O., Mansouri, B., & Hess, R. F. (2007). Cortical deficits in human
amblyopia: their regional distribution and their relationship to the contrast detection
deficit. Invest Ophthalmol Vis Sci, 48(4), 1575-1591. doi: 10.1167/iovs.06-1021
Loshin, D. S., & Levi, D. M. (1983). Suprathreshold contrast perception in functional amblyopia.
Doc Ophthalmol, 55(3), 213-236. doi: 10.1007/BF00140810
Luaute, J., Schwartz, S., Rossetti, Y., Spiridon, M., Rode, G., Boisson, D., & Vuilleumier, P.
(2009). Dynamic changes in brain activity during prism adaptation. J Neurosci, 29(1),
169-178. doi: 10.1523/JNEUROSCI.3054-08.2009
Mansouri, B., Stacy, R. C., Kruger, J., & Cestari, D. M. (2013). Deprivation amblyopia and
congenital hereditary cataract. Semin Ophthalmol, 28(5-6), 321-326. doi:
10.3109/08820538.2013.825289
Marimont, D. H. (1994). Matching color images: the effects of axial chromatic abberation. J Opt
Soc Am, 11, 3113.
Martin, T. A., Keating, J. G., Goodkin, H. P., Bastian, A. J., & Thach, W. T. (1996). Throwing
while looking through prisms. I. Focal olivocerebellar lesions impair adaptation. Brain,
119(Pt 4), 1183-1198.
McGurk, H., & MacDonald, J. (1976). Hearing lips and seeing voices. Nature, 264(5588), 746-
748.
McKee, S. P., Levi, D. M., & Movshon, J. A. (2003). The pattern of visual deficits in amblyopia.
J Vis, 3(5), 380-405. doi: 10:1167/3.5.5
Michel, C., Pisella, L., Halligan, P. W., Luauté, J., Rode, G., Boisson, D., & Rossetti, Y. (2003).
Simulating unilateral neglect in normals using prism adaptation: implications for theory.
Neuropsychologia, 41(1), 25-39. doi: 10.1016/s0028-3932(02)00135-5

123
Mountcastle, V. B., Lynch, J. C., Georgopoulos, A., Sakata, H., & Acuna, C. (1975). Posterior
parietal association cortex of the monkey: command functions for operations within
extrapersonal space. J Neurophysiol, 38(4), 871-908.
Narinesingh, C., Wan, M., Goltz, H. C., Chandrakumar, M., & Wong, A. M. (2014). Audiovisual
perception in adults with amblyopia: a study using the McGurk effect. Invest Ophthalmol
Vis Sci, 55(5), 3158-3164.
Negishi, K., Ohnuma, K., Hirayama, N., & Noda, T. (2001). Effect of chromatic aberration on
contrast sensitivity in pseudophakic eyes. Arch Ophthalmol, 119(8), 1154-1158.
Newport, R., & Jackson, S. R. (2006). Posterior parietal cortex and the dissociable components
of prism adaptation. Neuropsychologia, 44(13), 2757-2765. doi:
10.1016/j.neuropsychologia.2006.01.007
Niechwiej-Szwedo, E., Goltz, H. C., Chandrakumar, M., Hirji, Z., Crawford, J. D., & Wong, A.
M. (2011). Effects of anisometropic amblyopia on visuomotor behavior, part 2: visually
guided reaching. Invest Ophthalmol Vis Sci, 52(2), 795-803. doi: 10.1167/iovs.10-6092
Niechwiej-Szwedo, E., Goltz, H. C., Chandrakumar, M., Hirji, Z., & Wong, A. M. (2011).
Effects of anisometropic amblyopia on visuomotor behavior, III: Temporal eye-hand
coordination during reaching. Invest Ophthalmol Vis Sci, 52(8), 5853-5861. doi:
10.1167/iovs.11-7314
Niechwiej-Szwedo, E., Goltz, H. C., Chandrakumar, M., Hirji, Z. A., & Wong, A. M. (2010).
Effects of anisometropic amblyopia on visuomotor behavior, I: saccadic eye movements.
Invest Ophthalmol Vis Sci, 51(12), 6348-6354. doi: 10.1167/iovs.10-5882
Niechwiej-Szwedo, E., Goltz, H. C., Chandrakumar, M., & Wong, A. M. (2012). The effect of
sensory uncertainty due to amblyopia (lazy eye) on the planning and execution of
visually-guided 3D reaching movements. PLoS One, 7(2), e31075. doi:
10.1371/journal.pone.0031075
Niechwiej-Szwedo, E., Kennedy, S. A., Colpa, L., Chandrakumar, M., Goltz, H. C., & Wong, A.
M. (2012). Effects of induced monocular blur versus anisometropic amblyopia on
saccades, reaching, and eye-hand coordination. Invest Ophthalmol Vis Sci, 53(8), 4354-
4362. doi: 10.1167/iovs.12-9855
Niparko, J. K., Tobey, E. A., Thal, D. J., Eisenberg, L. S., Wang, N. Y., Quittner, A. L., & Fink,
N. E. (2010). Spoken language development in children following cochlear implantation.
JAMA, 303(15), 1498-1506. doi: 10.1001/jama.2010.451
Nordmann, J. P., Freeman, R. D., & Casanova, C. (1992). Contrast sensitivity in amblyopia:
masking effects of noise. Invest Ophthalmol Vis Sci, 33(10), 2975-2985.
O'Leary, D. D., Ruff, N. L., & Dyck, R. H. (1994). Development, critical period plasticity, and
adult reorganizations of mammalian somatosensory systems. Curr Opin Neurobiol, 4(4),
535-544. doi: http://dx.doi.org/10.1016/0959-4388(94)90054-X

124
O'Shea, J., Gaveau, V., Kandel, M., Koga, K., Susami, K., Prablanc, C., & Rossetti, Y. (2014).
Kinematic markers dissociate error correction from sensorimotor realignment during
prism adaptation. Neuropsychologia, 55, 15-24. doi:
10.1016/j.neuropsychologia.2013.09.021
Parton, A., Malhotra, P., & Husain, M. (2004). Hemispatial neglect. J Neurol Neurosurg
Psychiatry, 75(1), 13-21.
Paulsen, J. S., Butters, N., Salmon, D. P., Heindel, W. C., & Swenson, M. R. (1993). Prism
adaptation in Alzheimer's and Huntington's disease. Neuropsychology, 7(1), 73-81. doi:
10.1037/0894-4105.7.1.73
Perenin, M. T., & Vighetto, A. (1988). Optic ataxia: a specific disruption in visuomotor
mechanisms. I. Different aspects of the deficit in reaching for objects. Brain, 111 ( Pt
3)(Pt 3), 643-674.
Phillips, F., & Egan, E. J. L. (2009). Crossmodal information for visual and haptic
discrimination.
Piscopo, D. M., El-Danaf, R. N., Huberman, A. D., & Niell, C. M. (2013). Diverse visual
features encoded in mouse lateral geniculate nucleus. J Neurosci, 33(11), 4642-4656. doi:
10.1523/JNEUROSCI.5187-12.2013
Pisella, L., Michel, C., Grea, H., Tilikete, C., Vighetto, A., & Rossetti, Y. (2004). Preserved
prism adaptation in bilateral optic ataxia: strategic versus adaptive reaction to prisms. Exp
Brain Res, 156(4), 399-408. doi: 10.1007/s00221-003-1746-4
Pisella, L., Rossetti, Y., Michel, C., Rode, G., Boisson, D., Pelisson, D., & Tilikete, C. (2005).
Ipsidirectional impairment of prism adaptation after unilateral lesion of anterior
cerebellum. Neurology, 65(1), 150-152. doi: 10.1212/01.wnl.0000167945.34177.5e
Prado, J., Clavagnier, S., Otzenberger, H., Scheiber, C., Kennedy, H., & Perenin, M. T. (2005).
Two cortical systems for reaching in central and peripheral vision. Neuron, 48(5), 849-
858. doi: 10.1016/j.neuron.2005.10.010
Prechtl, H. F., Cioni, G., Einspieler, C., Bos, A. F., & Ferrari, F. (2001). Role of vision on early
motor development: lessons from the blind. Dev Med Child Neurol, 43(3), 198-201. doi:
10.1017.s0012162201000378
Purves, D. (2012a). Central Visual Pathway. In D. Purves, G. J. Augustine, D. Fitzpatrick, W. C.
Hall, A.-S. LaMantia & L. E. White (Eds.), Neuroscience 5e (pp. 257-277): Sinauer
Associates, Inc.
Purves, D. (2012b). Modulation of Movement by the Basal Ganglia. In D. Purves, G. J.
Augustine, D. Fitzpatrick, W. C. Hall, A.-S. LaMantia & L. E. White (Eds.),
Neuroscience 5e (pp. 399-416): Sinauer Associates, Inc.

125
Raashid, R. A., Wong, A. M., Chandrakumar, M., Blakeman, A., & Goltz, H. C. (2013). Short-
term saccadic adaptation in patients with anisometropic amblyopia. Invest Ophthalmol
Vis Sci, 54(10), 6701-6711. doi: 10.1167/iovs.13-12553
Redding, G. M. (1981). Effects of homogeneous and variable exposure on magnitude of
adaptation to optical tilt. J Exp Psychol Hum Percept Perform, 7(1), 130-140.
Redding, G. M. (2010). Prism Adaptation. Encyclopedia of Perception. SAGE Publications, Inc.
Thousand Oaks, CA: SAGE Publications, Inc.
Redding, G. M., Rossetti, Y., & Wallace, B. (2005). Applications of prism adaptation: a tutorial
in theory and method. Neurosci Biobehav Rev, 29(3), 431-444. doi:
10.1016/j.neubiorev.2004.12.004
Redding, G. M., & Wallace, B. (1978). Sources of "overadditivity" in prism adaptation. Percept
Psychophys, 24(1), 58-62. doi: 10.3758/bf03202974
Redding, G. M., & Wallace, B. (1988). Components of prism adaptation in terminal and
concurrent exposure: organization of the eye-hand coordination loop. Percept
Psychophys, 44(1), 59-68.
Redding, G. M., & Wallace, B. (1990). Effects on prism adaptation of duration and timing of
visual feedback during pointing. J Mot Behav, 22(2), 209-224.
Redding, G. M., & Wallace, B. (1993). Adaptive coordination and alignment of eye and hand. J
Mot Behav, 25(2), 75-88. doi: 10.1080/00222895.1993.9941642
Redding, G. M., & Wallace, B. (1996). Adaptive spatial alignment and strategic perceptual-
motor control. J Exp Psychol Hum Percept Perform, 22(2), 379-394.
Redding, G. M., & Wallace, B. (2001). Calibration and alignment are separable: evidence from
prism adaptation. J Mot Behav, 33(4), 401-412. doi: 10.1080/00222890109601923
Redding, G. M., & Wallace, B. (2002). Strategic Calibration and Spatial Alignment: A Model
From Prism Adaptation. J Mot Behav, 34(2), 126-138.
Redding, G. M., & Wallace, B. (2003a). Dual prism adaptation: calibration or alignment? J Mot
Behav, 35(4), 399-408. doi: 10.1080/00222890309603159
Redding, G. M., & Wallace, B. (2003b). First-trial adaptation to prism exposure. J Mot Behav,
35(3), 229-245. doi: 10.1080/00222890309602137
Redding, G. M., & Wallace, B. (2004). First-trial adaptation to prism exposure: artifact of visual
capture. J Mot Behav, 36(3), 291-304. doi: 10.3200/JMBR.36.3.291-304
Redding, G. M., & Wallace, B. (2006). Generalization of prism adaptation. J Exp Psychol Hum
Percept Perform, 32(4), 1006-1022. doi: 10.1037/0096-1523.32.4.1006
Rock, I., & Campbell, B. (1975). An introduction to perception: Macmillan New York.
126
Rossetti, Y., Koga, K., & Mano, T. (1993). Prismatic displacement of vision induces transient
changes in the timing of eye-hand coordination. Percept Psychophys, 54(3), 355-364.
Saint-Amour, D., De Sanctis, P., Molholm, S., Ritter, W., & Foxe, J. J. (2007). Seeing voices:
High-density electrical mapping and source-analysis of the multisensory mismatch
negativity evoked during the McGurk illusion. Neuropsychologia, 45(3), 587-597. doi:
10.1016/j.neuropsychologia.2006.03.036
Sarri, M., Greenwood, R., Kalra, L., Papps, B., Husain, M., & Driver, J. (2008). Prism adaptation
aftereffects in stroke patients with spatial neglect: pathological effects on subjective
straight ahead but not visual open-loop pointing. Neuropsychologia, 46(4), 1069-1080.
Saunders, J. A., & Knill, D. C. (2003). Humans use continuous visual feedback from the hand to
control fast reaching movements. Exp Brain Res, 152(3), 341-352.
Scholl, B., Tan, A. Y., & Priebe, N. J. (2013). Strabismus disrupts binocular synaptic integration
in primary visual cortex. J Neurosci, 33(43), 17108-17122. doi:
10.1523/JNEUROSCI.1831-13.2013
Seim, T., Valberg, A., & Lee, B. B. (2012). Visual signal processing in the macaque lateral
geniculate nucleus. Vis Neurosci, 29(2), 105-117. doi: 10.1017/S0952523812000065
Sengpiel, F., Stawinski, P., & Bonhoeffer, T. (1999). Influence of experience on orientation
maps in cat visual cortex. Nat Neurosci, 2(8), 727-732. doi: 10.1038/11192
Shadlen, M. N., Britten, K. H., Newsome, W. T., & Movshon, J. A. (1996). A computational
analysis of the relationship between neuronal and behavioral responses to visual motion.
J Neurosci, 16(4), 1486-1510.
Shors, T. J., Miesegaes, G., Beylin, A., Zhao, M., Rydel, T., & Gould, E. (2001). Neurogenesis
in the adult is involved in the formation of trace memories. Nature, 410(6826), 372-376.
doi: 10.1038/35066584
Simmers, A. J., Ledgeway, T., Hess, R. F., & McGraw, P. V. (2003). Deficits to global motion
processing in human amblyopia. Vision Res, 43(6), 729-738.
Simmers, A. J., Ledgeway, T., Mansouri, B., Hutchinson, C. V., & Hess, R. F. (2006). The
extent of the dorsal extra-striate deficit in amblyopia. Vision Res, 46(16), 2571-2580. doi:
10.1016/j.visres.2006.01.009
Simon, J. W., & Kaw, P. (2001). Commonly missed diagnoses in the childhood eye examination.
Am Fam Physician, 64(4), 623-628.
Sireteanu, R. (1982). Binocular vision in strabsimic humans with alternating fixation. Vision Res,
22(8), 889-896.
Smith, S. L., & Trachtenberg, J. T. (2007). Experience-dependent binocular competition in the
visual cortex begins at eye opening. Nat Neurosci, 10(3), 370-375.

127
Smith, W. M., & Bowen, K. F. (1980). The effects of delayed and displaced visual feedback on
motor control. J Mot Behav, 12(2), 91-101.
Snow, C. E., & Hoefnagel-Hohle, M. (1978). The Critical Period for Language Acquisition:
Evidence from Second Language Learning. Child Development, 49(4), 1114. doi:
10.2307/1128751
Snyder, J. S., Hong, N. S., McDonald, R. J., & Wojtowicz, J. M. (2005). A role for adult
neurogenesis in spatial long-term memory. Neuroscience, 130(4), 843-852. doi:
10.1016/j.neuroscience.2004.10.009
Soiza-Reilly, M., Fossati, M., Ibarra, G. R., & Azcurra, J. M. (2004). Different dopamine D1 and
D2 receptors expression after motor activity in the striatal critical period. Brain Res,
1004(1-2), 217-221. doi: 10.1016/j.brainres.2004.01.050
Sollars, P. J., Smeraski, C. A., Kaufman, J. D., Ogilvie, M. D., Provencio, I., & Pickard, G. E.
(2003). Melanopsin and non-melanopsin expressing retinal ganglion cells innervate the
hypothalamic suprachiasmatic nucleus. Vis Neurosci, 20(6), 601-610. doi:
10.1017/s0952523803206027
Stefano, M., Morelli, M., Marzi, C. A., & Berlucchi, G. (1980). Hemispheric control of unilateral
and bilateral movements of proximal and distal parts of the arm as inferred from simple
reaction time to lateralized light stimuli in man. Experimental Brain Research, 38(2),
197-204. doi: 10.1007/bf00236741
Stein, J. F., & Glickstein, M. (1992). Role of the cerebellum in visual guidance of movement
(Vol. 72).
Suttle, C. M., Melmoth, D. R., Finlay, A. L., Sloper, J. J., & Grant, S. (2011). Eye-hand
coordination skills in children with and without amblyopia. Invest Ophthalmol Vis, 52(3),
1851-1864.
Tanji, J., & Hoshi, E. (2001). Behavioral planning in the prefrontal cortex. Curr Opin Neurobiol,
11(2), 164-170.
The Pediatric Eye Disease Investigator Group. (2002). The Clinical Profile of Moderate
Amblyopia in Children Younger Than 7 Years. Archives of Ophthalmology, 120(3), 281.
doi: 10.1001/archopht.120.3.281
The Pediatric Eye Disease Investigator Group. (2005). Randomized trial of treatment of
amblyopia in children aged 7 to 17 years. Arch Ophthalmol, 123(4), 437-447. doi:
10.1001/archopht.123.4.437
The Pediatric Eye Disease Investigator Group. (2006). Treatment of anisometropic amblyopia in
children with refractive correction. Ophthalmology, 113(6), 895-903. doi:
10.1016/j.ophtha.2006.01.068
Thiel, A., & Sireteanu, R. (2009). Strabismic amblyopes show a bilateral rightward bias in a line
bisection task: evidence for a visual attention deficit. Vision Res, 49(3), 287-294.

128
Tobin, M. J., Bozic, N., Douglas, G., Greaney, J., & Ross, S. (1997). Visually impaired children:
Development and implications for education. European Journal of Psychology of
Education, 12(4), 431-447. doi: 10.1007/bf03172803
Tsai, L., & Barnea, G. (2014). A critical period defined by axon-targeting mechanisms in the
murine olfactory bulb. Science, 344(6180), 197-200. doi: 10.1126/science.1248806
Tseng, Y. W., Diedrichsen, J., Krakauer, J. W., Shadmehr, R., & Bastian, A. J. (2007). Sensory
prediction errors drive cerebellum-dependent adaptation of reaching. J Neurophysiol,
98(1), 54-62. doi: 10.1152/jn.00266.2007
von Helmholtz, H. (1867). Treatise on Physiological Optics Vol. III.
von Holst, E. (1954). Relations between the central Nervous System and the peripheral organs.
The British Journal of Animal Behaviour, 2(3), 89-94. doi: 10.1016/s0950-
5601(54)80044-x
von Noorden, G. K. (1973). Histological studies of the visual system in monkeys with
experimental amblyopia. Invest Ophthalmol, 12(10), 727-738.
von Noorden, G. K. (1977). Mechanisms of amblyopia. Adv Ophthalmol, 34, 93-115.
von Noorden, G. K., & Crawford, M. L. (1992). The lateral geniculate nucleus in human
strabismic amblyopia. Invest Ophthalmol Vis Sci, 33(9), 2729-2732.
von Noorden, G. K., & Middleditch, P. R. (1975). Histology of the monkey lateral geniculate
nucleus after unilateral lid closure and experimental strabismus: further observations.
Invest Ophthalmol, 14(9), 674-683.
Vonsattel, J. P., Myers, R. H., Stevens, T. J., Ferrante, R. J., Bird, E. D., & Richardson, E. P., Jr.
(1985). Neuropathological classification of Huntington's disease. J Neuropathol Exp
Neurol, 44(6), 559-577.
Wallace, D. K., Lazar, E. L., Melia, M., Birch, E. E., Holmes, J. M., Hopkins, K. B., . . . Weise,
K. K. (2011). Stereoacuity in children with anisometropic amblyopia. J AAPOS, 15(5),
455-461. doi: 10.1016/j.jaapos.2011.06.007
Walton, K. D., Lieberman, D., Llinas, A., Begin, M., & Llinas, R. R. (1992). Identification of a
critical period for motor development in neonatal rats. Neuroscience, 51(4), 763-767. doi:
10.1016/0306-4522(92)90517-6
Watt, R. J., & Hess, R. F. (1987). Spatial information and uncertainty in anisometropic
amblyopia. Vision Res, 27(4), 661-674. doi: 10.1016/0042-6989(87)90050-2
Weiner, M. J., Hallett, M., & Funkenstein, H. H. (1983). Adaptation to lateral displacement of
vision in patients with lesions of the central nervous system. Neurology, 33(6), 766-772.
Weintraub, S. (1987). Right Cerebral Dominance in Spatial Attention. Arch Neurol, 44(6), 621.
doi: 10.1001/archneur.1987.00520180043014

129
Welch, R. B. (1969). Adaptation to prism-displaced vision: The importance of target-pointing.
Percept Psychophys, 5(5), 305-309.
Welch, R. B. (1978). Perceptual modification: adapting to altered sensory environments New
York: Academic Press.
Welch, R. B., Choe, C. S., & Heinrich, D. R. (1974). Evidence for a three-component model of
prism adaptation. J Exp Psychol, 103(4), 700-705. doi:
http://dx.doi.org/10.1037/h0037152
Welch, R. B., & Goldstein, G. (1972). Prism adaptation and brain damage. Neuropsychologia,
10(4), 387-394. doi: http://dx.doi.org/10.1016/0028-3932(72)90001-2
Welch, R. B., & Warren, D. H. (1986). Intersensory interactions. In K. R. Boff, L. Kaufman & J.
R. Thomas (Eds.), Handbook of perception and human performance sensory processes
and perception (Vol. 1). New York: Wiley
Wensveen, J. M., Harwerth, R. S., & Smith, E. L., 3rd. (2001). Clinical suppression in monkeys
reared with abnormal binocular visual experience. Vision Res, 41(12), 1593-1608. doi:
http://dx.doi.org/10.1016/S0042-6989(00)00319-9
Wesson, M. D., & Loop, M. S. (1982). Temporal contrast sensitivity in amblyopia. Invest
Ophthalmol Vis Sci, 22(1), 98-102.
Wiesel, T. N., & Hubel, D. H. (1963a). Effects of visual deprivation on morphology and
physiology of cells in the cats lateral geniculate body. J Neurophysiol, 26(978-993).
Wiesel, T. N., & Hubel, D. H. (1963b). Single-cell responses in striate cortex of kittens deprived
of vision in one eye. J Neurophysiol, 26, 1003-1018.
Wiesel, T. N., & Hubel, D. H. (1965). Comparison of the effects of unilateral and bilateral eye
closure on cortical unit responses in kittens. J Neurophysiol, 28(6), 1029-1040.
Wilkinson, D. A. (1971). Visual-motor control loop: a linear system? J Exp Psychol, 89(2), 250-
257.
Wolpert, D. M., Ghahramani, Z., & Jordan, M. I. (1995a). Are arm trajectories planned in
kinematic or dynamic coordinates? An adaptation study. Exp Brain Res, 103(3), 460-470.
Wolpert, D. M., Ghahramani, Z., & Jordan, M. I. (1995b). An internal model for sensorimotor
integration. Science, 269(5232), 1880-1882.
Wong, A. M. (2011). Implications of interocular suppression in the treatment of amblyopia. J
AAPOS, 15(5), 417-418. doi: 10.1016/j.jaapos.2011.08.001
Wong, A. M. (2014). Amblyopia (lazy eye) in children. CMAJ, 186(4), 292. doi:
10.1503/cmaj.130666

130
Wright, K. W. (2006). Visual Development and Amblyopia. In K. W. Wright, P. H. Spiegel & L.
S. Thompson (Eds.), Handbook of pediatric strabismus and amblyopia (pp. 103-137).
New York: Springer.