vital signs report - wmata
TRANSCRIPT
Customer Service and Operations Committee
Board Information Item III-B
March 10, 2011
Vital Signs Report
Page 38 of 89
Washington Metropolitan Area Transit Authority
Board Action/Information Summary
Action Information MEAD Number:Resolution:
Yes No
TITLE: Vital Signs Report PURPOSE: Report Metro’s actual performance in key areas of safety, security and service reliability. DESCRIPTION: This report analyzes why performance is changing and documents what is working well and what’s not. Areas in need of performance improvement will have specific actions documented that will drive execution toward targets. A companion scorecard appears as an on-line dashboard on Metro’s web page where these key performance indicators and other measures can be accessed by the public at any time. Measuring and reporting on Metro’s performance is an essential part of the overall assessment of how well this region’s primary transit system is delivering service to its customers. FUNDING IMPACT: No impact on funding. RECOMMENDATION: None
Page 39 of 89
Washington Metropolitan Area Transit Authority
Vital Signs Report
A Scorecard of Metro’s Key Performance Indicators
Customer Service and Operations Committee
March 10, 2011
Page 40 of 89
Purpose of Presentation
• Summarize the most recent results for Metro’s KeyPerformance Indicators (KPIs)
• Highlight actions being taken to improve performance
Page 41 of 89
Vital SignsMetro’s KPIs for JanuaryMetro s KPIs for January
• Bus on time performance steadily
Prior Month
Jan-11 Jan-10 Dec-10
Year over Year
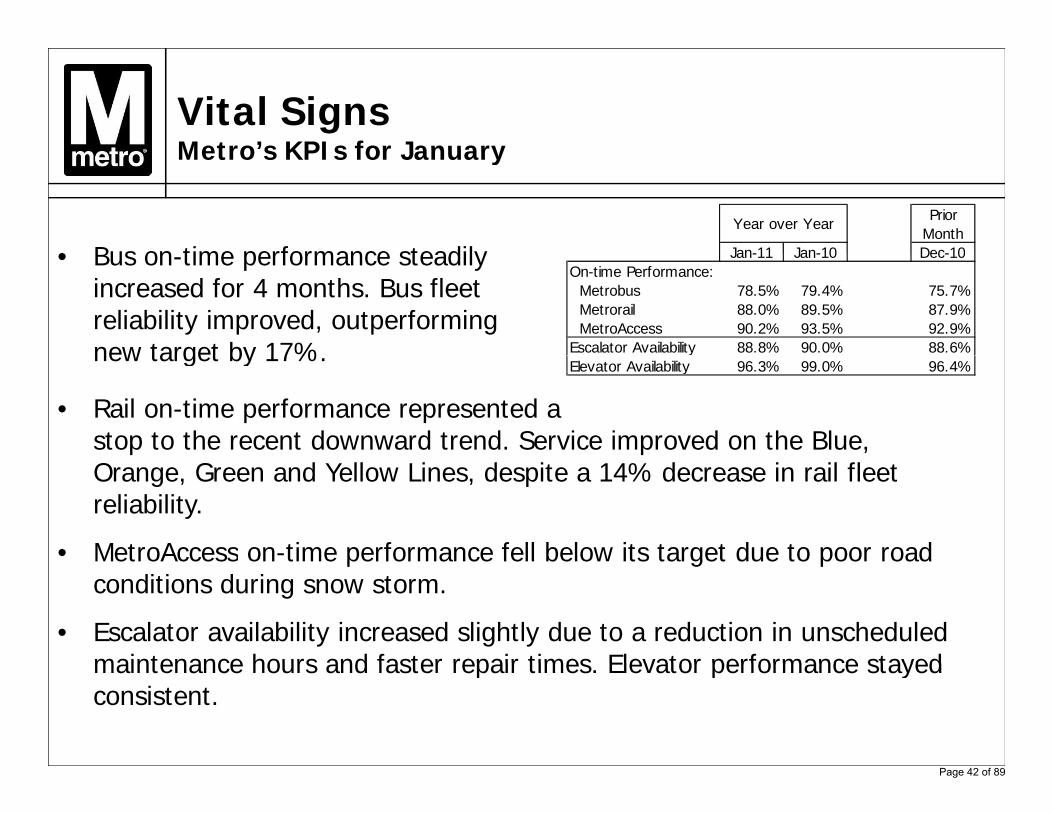
• Bus on-time performance steadily increased for 4 months. Bus fleet reliability improved, outperforming new target by 17%
Jan-11 Jan-10 Dec-10
78.5% 79.4% 75.7%88.0% 89.5% 87.9%90.2% 93.5% 92.9%88.8% 90.0% 88.6%
On-time Performance: Metrobus Metrorail MetroAccess
Escalator Availabilitynew target by 17%.
• Rail on-time performance represented a stop to the recent downward trend. Service improved on the Blue,
96.3% 99.0% 96.4%Elevator Availability
Orange, Green and Yellow Lines, despite a 14% decrease in rail fleet reliability.
• MetroAccess on-time performance fell below its target due to poor roadMetroAccess on time performance fell below its target due to poor road conditions during snow storm.
• Escalator availability increased slightly due to a reduction in unscheduled maintenance hours and faster repair times Elevator performance stayedmaintenance hours and faster repair times. Elevator performance stayed consistent.
Page 42 of 89
Vital SignsMetro’s KPIs for JanuaryMetro s KPIs for January
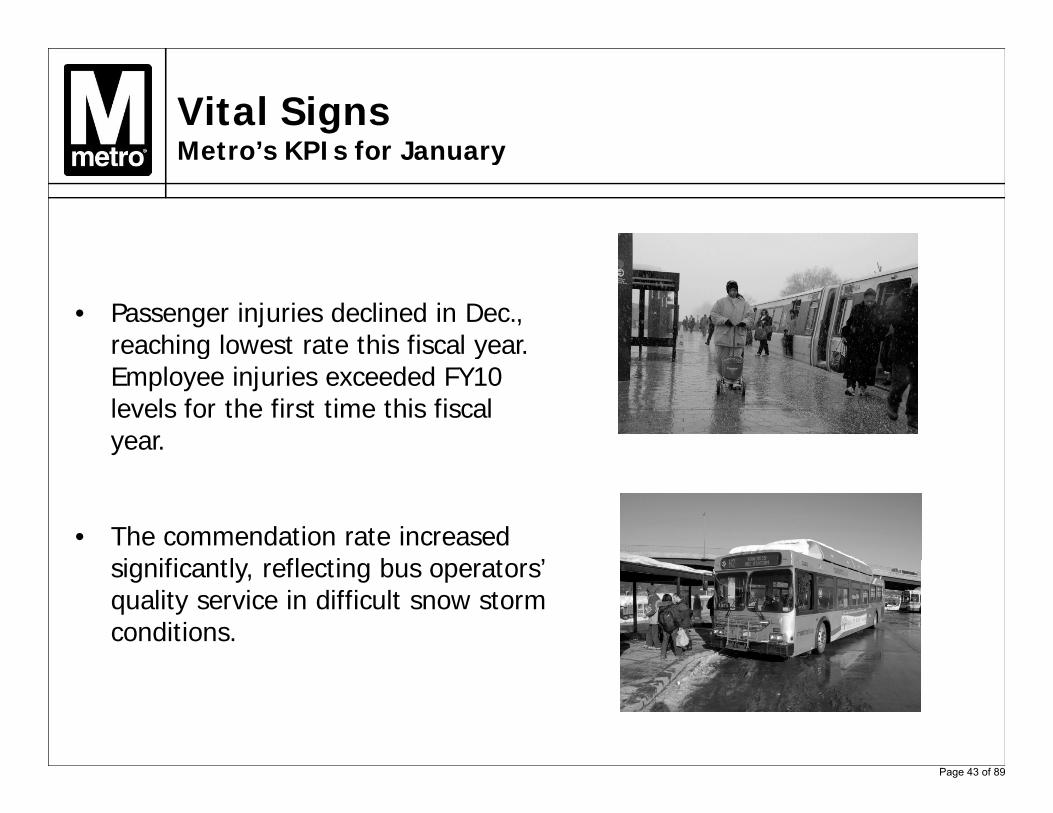
• Passenger injuries declined in Dec., reaching lowest rate this fiscal year. g yEmployee injuries exceeded FY10 levels for the first time this fiscal year.
• The commendation rate increased i ifi tl fl ti b t ’significantly, reflecting bus operators’
quality service in difficult snow storm conditions.
Page 43 of 89
Future Performance Action Highlightsg g
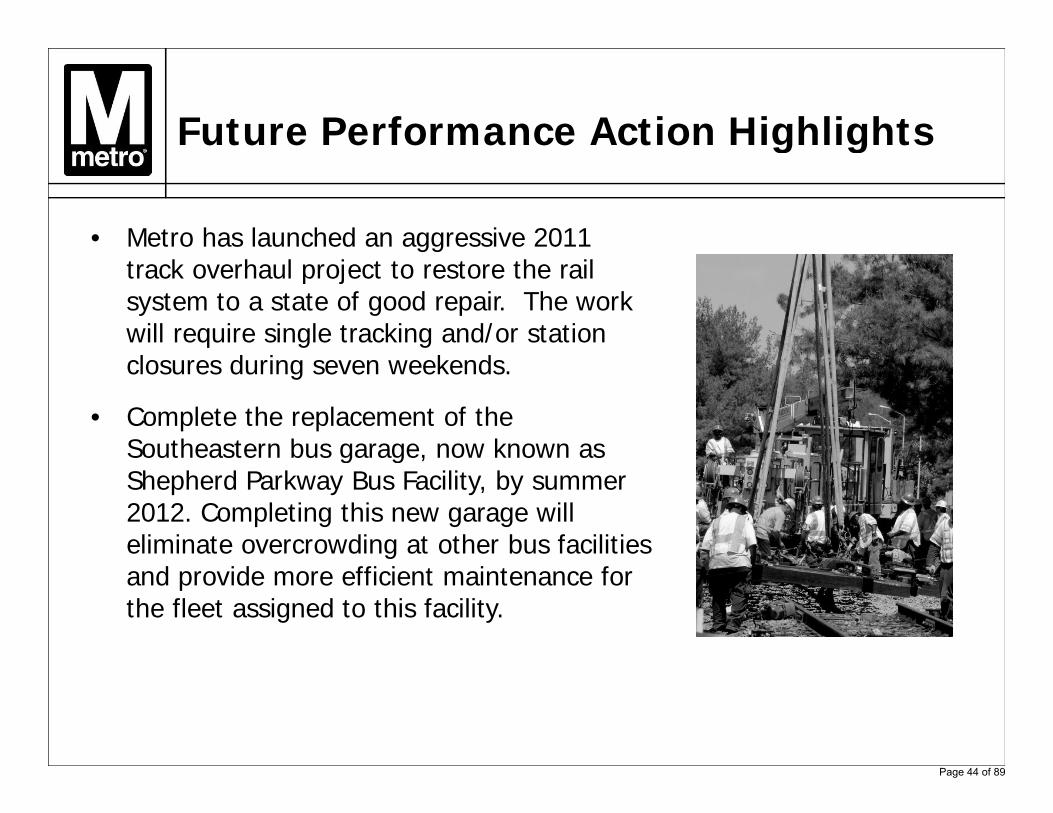
• Metro has launched an aggressive 2011 track overhaul project to restore the rail system to a state of good repair. The work will require single tracking and/or station l d i k dclosures during seven weekends.
• Complete the replacement of the Southeastern bus garage, now known as Sou eas e bus ga age, o o asShepherd Parkway Bus Facility, by summer 2012. Completing this new garage will eliminate overcrowding at other bus facilities and provide more efficient maintenance for the fleet assigned to this facility.
Page 44 of 89
Future Performance Action Highlightsg g
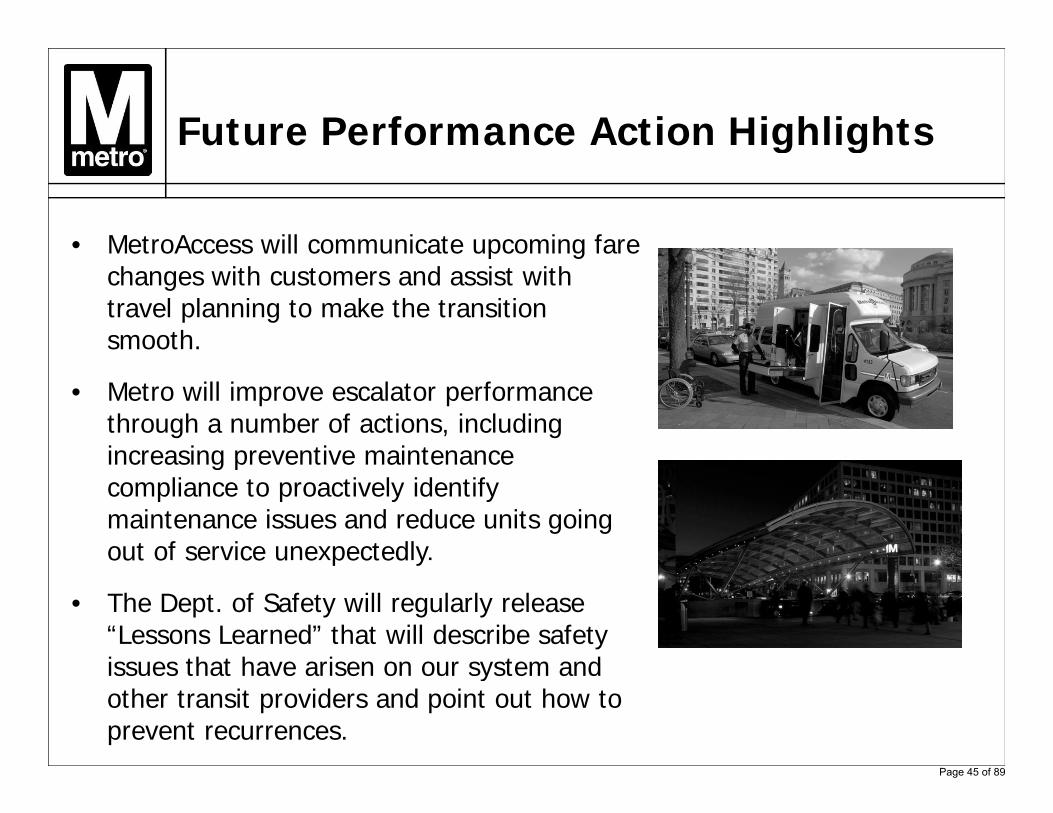
• MetroAccess will communicate upcoming fareMetroAccess will communicate upcoming fare changes with customers and assist with travel planning to make the transition smooth.
• Metro will improve escalator performance through a number of actions, including increasing preventive maintenanceincreasing preventive maintenance compliance to proactively identify maintenance issues and reduce units going out of service unexpectedly.out o se ce u e pected y
• The Dept. of Safety will regularly release “Lessons Learned” that will describe safety issues that have arisen on our system andissues that have arisen on our system and other transit providers and point out how to prevent recurrences.
Page 45 of 89
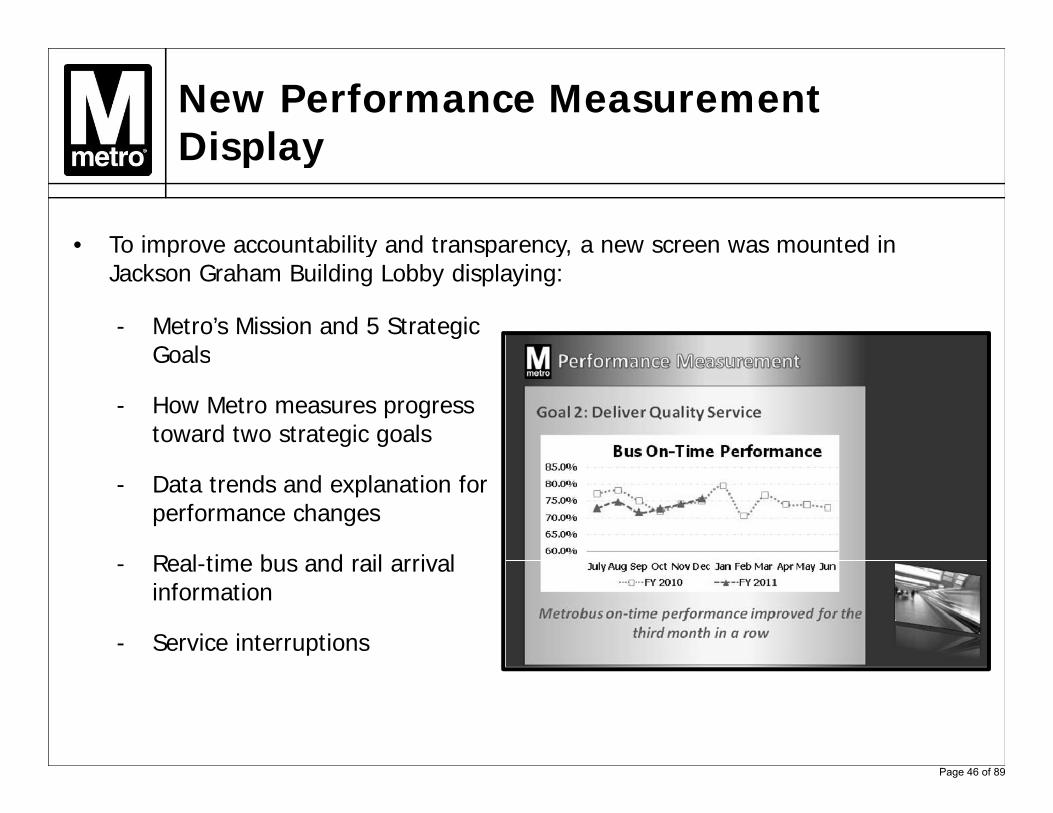
New Performance Measurement DisplayDisplay
• To improve accountability and transparency, a new screen was mounted in o p o a ou ab y a d a pa y, a a ou dJackson Graham Building Lobby displaying:
- Metro’s Mission and 5 Strategic GoalsGoals
- How Metro measures progress toward two strategic goals
- Data trends and explanation for performance changes
Real time bus and rail arrival- Real-time bus and rail arrival information
- Service interruptions
Page 46 of 89
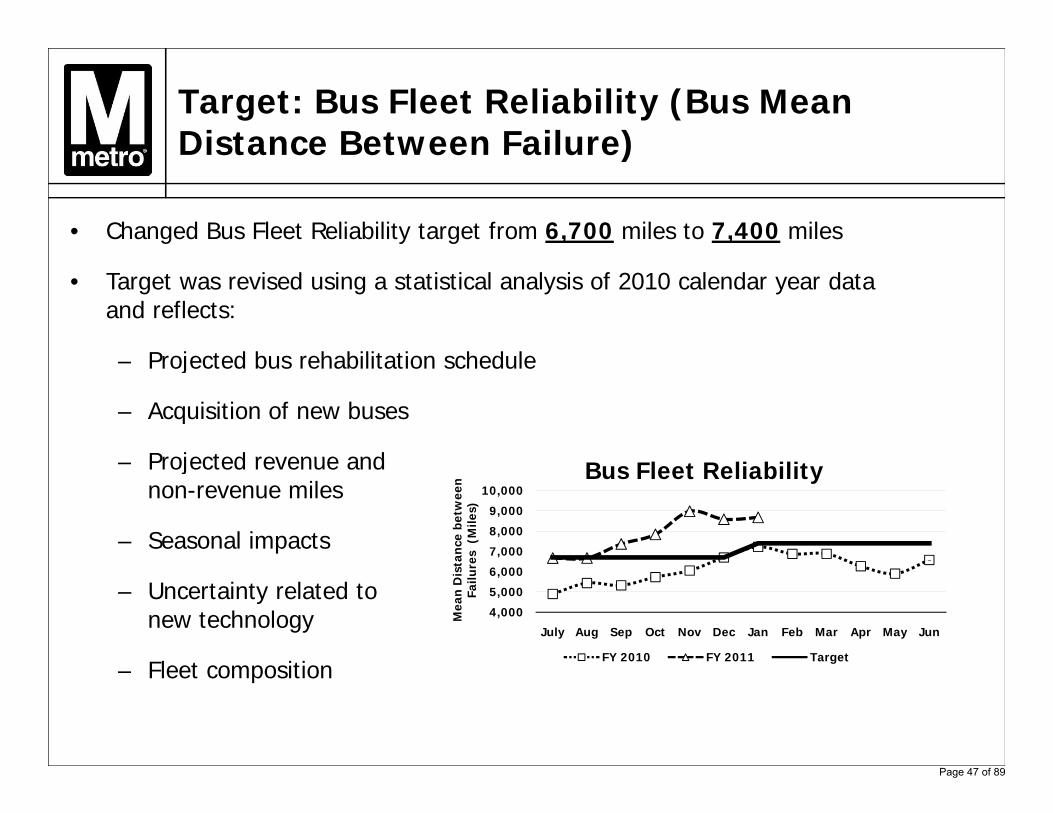
Target: Bus Fleet Reliability (Bus Mean Distance Between Failure)Distance Between Failure)
• Changed Bus Fleet Reliability target from 6,700 miles to 7,400 miles
• Target was revised using a statistical analysis of 2010 calendar year data and reflects:
P ojected b s ehabilitation sched le– Projected bus rehabilitation schedule
– Acquisition of new buses
Projected revenue and– Projected revenue and non-revenue miles
– Seasonal impacts 7,000
8,000
9,000
10,000
ance
bet
wee
n
es (
Mile
s)Bus Fleet Reliability
– Uncertainty related to new technology
Fl t iti
4,000
5,000
6,000
July Aug Sep Oct Nov Dec Jan Feb Mar Apr May Jun
Mea
n D
ista
Failu
re
FY 2010 FY 2011 Target– Fleet composition
g
Page 47 of 89
Next Steps
• Evaluate targets for other Vital Signs measures
• Revise employee safety measure
• Present benefits and limitations of benchmarking
Page 48 of 89
Vital Signs Report A Scorecard of Metro’s
Key Performance Indicators (KPI)
Chief Performance Officer
Published: March 2011
Page 49 of 89

Washington Metropolitan Area Transit Authority March 2011 2
Page Left Intentionally Blank
Page 50 of 89
Washington Metropolitan Area Transit Authority March 2011 3
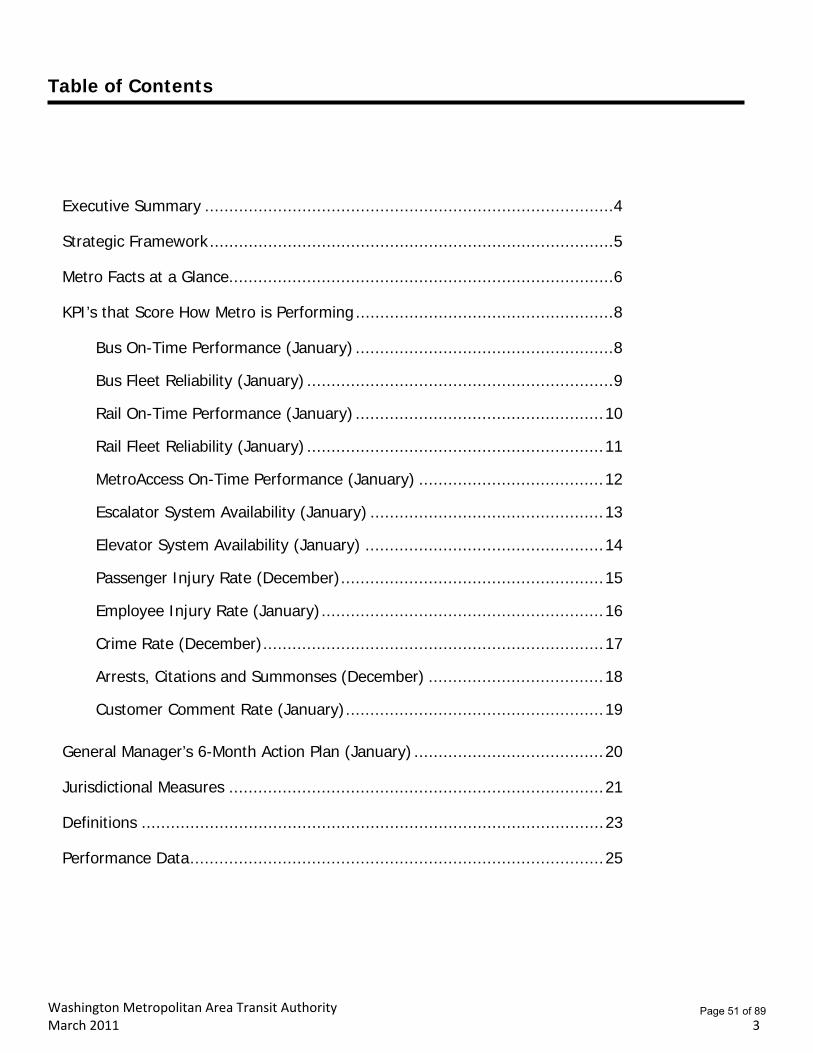
Table of Contents
Executive Summary .................................................................................... 4
Strategic Framework ................................................................................... 5
Metro Facts at a Glance ............................................................................... 6
KPI’s that Score How Metro is Performing ..................................................... 8
Bus On-Time Performance (January) ..................................................... 8
Bus Fleet Reliability (January) ............................................................... 9
Rail On-Time Performance (January) ................................................... 10
Rail Fleet Reliability (January) ............................................................. 11
MetroAccess On-Time Performance (January) ...................................... 12
Escalator System Availability (January) ................................................ 13
Elevator System Availability (January) ................................................. 14
Passenger Injury Rate (December) ...................................................... 15
Employee Injury Rate (January) .......................................................... 16
Crime Rate (December) ...................................................................... 17
Arrests, Citations and Summonses (December) .................................... 18
Customer Comment Rate (January) ..................................................... 19
General Manager’s 6-Month Action Plan (January) ....................................... 20
Jurisdictional Measures ............................................................................. 21
Definitions ............................................................................................... 23
Performance Data ..................................................................................... 25
Page 51 of 89
Washington Metropolitan Area Transit Authority March 2011 4
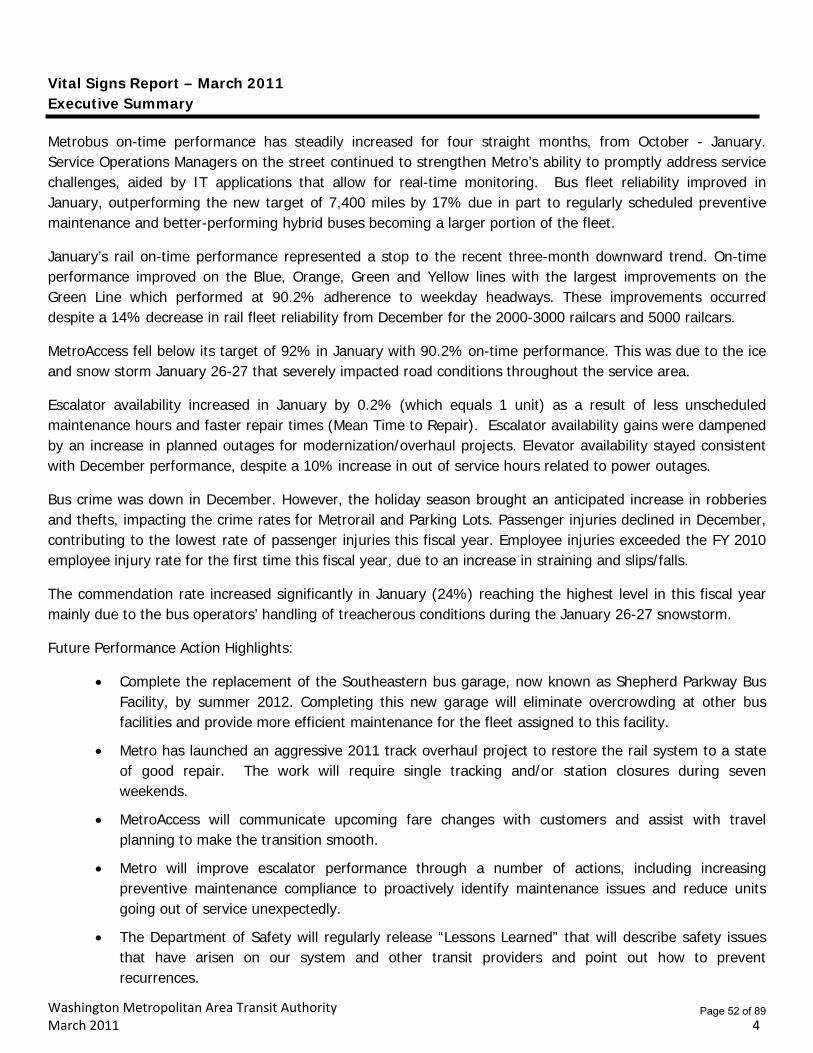
Vital Signs Report – March 2011 Executive Summary Metrobus on-time performance has steadily increased for four straight months, from October - January. Service Operations Managers on the street continued to strengthen Metro’s ability to promptly address service challenges, aided by IT applications that allow for real-time monitoring. Bus fleet reliability improved in January, outperforming the new target of 7,400 miles by 17% due in part to regularly scheduled preventive maintenance and better-performing hybrid buses becoming a larger portion of the fleet.
January’s rail on-time performance represented a stop to the recent three-month downward trend. On-time performance improved on the Blue, Orange, Green and Yellow lines with the largest improvements on the Green Line which performed at 90.2% adherence to weekday headways. These improvements occurred despite a 14% decrease in rail fleet reliability from December for the 2000-3000 railcars and 5000 railcars.
MetroAccess fell below its target of 92% in January with 90.2% on-time performance. This was due to the ice and snow storm January 26-27 that severely impacted road conditions throughout the service area.
Escalator availability increased in January by 0.2% (which equals 1 unit) as a result of less unscheduled maintenance hours and faster repair times (Mean Time to Repair). Escalator availability gains were dampened by an increase in planned outages for modernization/overhaul projects. Elevator availability stayed consistent with December performance, despite a 10% increase in out of service hours related to power outages.
Bus crime was down in December. However, the holiday season brought an anticipated increase in robberies and thefts, impacting the crime rates for Metrorail and Parking Lots. Passenger injuries declined in December, contributing to the lowest rate of passenger injuries this fiscal year. Employee injuries exceeded the FY 2010 employee injury rate for the first time this fiscal year, due to an increase in straining and slips/falls.
The commendation rate increased significantly in January (24%) reaching the highest level in this fiscal year mainly due to the bus operators’ handling of treacherous conditions during the January 26-27 snowstorm.
Future Performance Action Highlights:
Complete the replacement of the Southeastern bus garage, now known as Shepherd Parkway Bus Facility, by summer 2012. Completing this new garage will eliminate overcrowding at other bus facilities and provide more efficient maintenance for the fleet assigned to this facility.
Metro has launched an aggressive 2011 track overhaul project to restore the rail system to a state of good repair. The work will require single tracking and/or station closures during seven weekends.
MetroAccess will communicate upcoming fare changes with customers and assist with travel planning to make the transition smooth.
Metro will improve escalator performance through a number of actions, including increasing preventive maintenance compliance to proactively identify maintenance issues and reduce units going out of service unexpectedly.
The Department of Safety will regularly release “Lessons Learned” that will describe safety issues that have arisen on our system and other transit providers and point out how to prevent recurrences.
Page 52 of 89
Washington Metropolitan Area Transit Authority March 2011 5
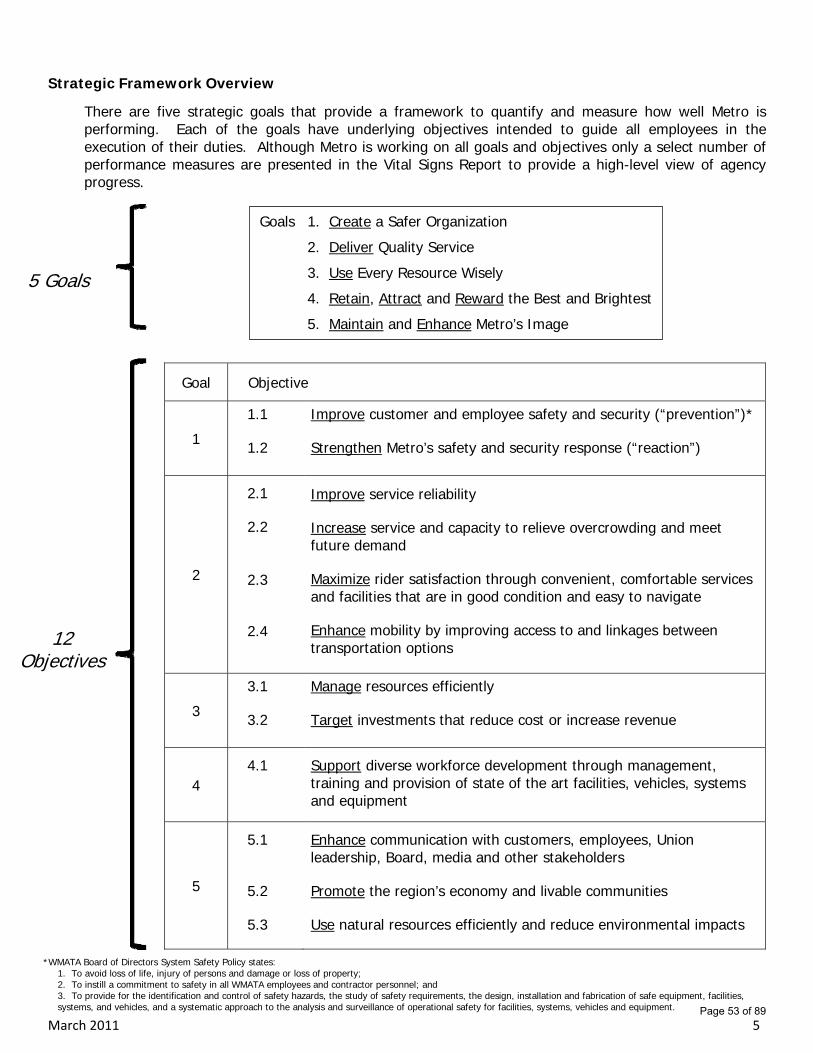
Strategic Framework Overview
There are five strategic goals that provide a framework to quantify and measure how well Metro is performing. Each of the goals have underlying objectives intended to guide all employees in the execution of their duties. Although Metro is working on all goals and objectives only a select number of performance measures are presented in the Vital Signs Report to provide a high-level view of agency progress.
Goal Objective
1
1.1
1.2
Improve customer and employee safety and security (“prevention”)*
Strengthen Metro’s safety and security response (“reaction”)
2
2.1
2.2 2.3
2.4
Improve service reliability
Increase service and capacity to relieve overcrowding and meet future demand
Maximize rider satisfaction through convenient, comfortable services and facilities that are in good condition and easy to navigate
Enhance mobility by improving access to and linkages between transportation options
3
3.1
3.2
Manage resources efficiently
Target investments that reduce cost or increase revenue
4 4.1 Support diverse workforce development through management,
training and provision of state of the art facilities, vehicles, systems and equipment
5
5.1
5.2
5.3
Enhance communication with customers, employees, Union leadership, Board, media and other stakeholders
Promote the region’s economy and livable communities
Use natural resources efficiently and reduce environmental impacts
Goals 1. Create a Safer Organization
2. Deliver Quality Service
3. Use Every Resource Wisely
4. Retain, Attract and Reward the Best and Brightest
5. Maintain and Enhance Metro’s Image
5 Goals
12 Objectives
*WMATA Board of Directors System Safety Policy states: 1. To avoid loss of life, injury of persons and damage or loss of property; 2. To instill a commitment to safety in all WMATA employees and contractor personnel; and 3. To provide for the identification and control of safety hazards, the study of safety requirements, the design, installation and fabrication of safe equipment, facilities, systems, and vehicles, and a systematic approach to the analysis and surveillance of operational safety for facilities, systems, vehicles and equipment. Page 53 of 89
Washington Metropolitan Area Transit Authority March 2011 6
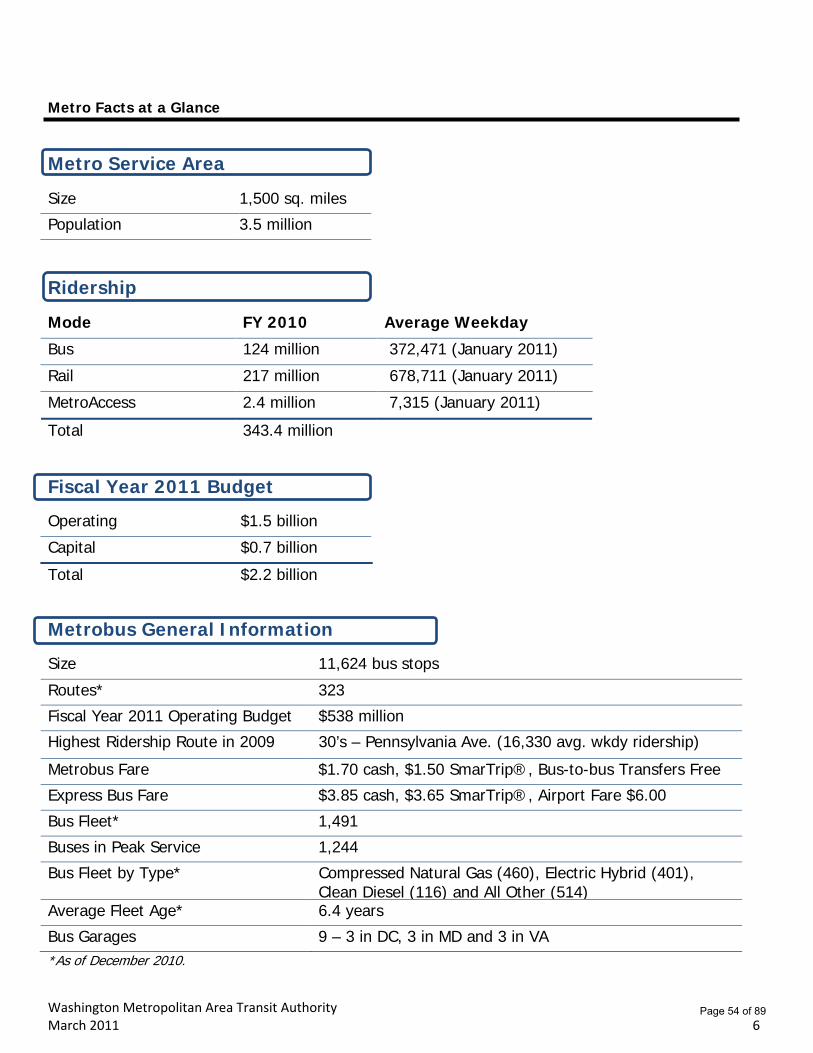
Metro Facts at a Glance
Metro Service Area
Size 1,500 sq. miles
Population 3.5 million
Ridership
Mode FY 2010 Average Weekday
Bus 124 million 372,471 (January 2011)
Rail 217 million 678,711 (January 2011)
MetroAccess 2.4 million 7,315 (January 2011)
Total 343.4 million
Fiscal Year 2011 Budget
Operating $1.5 billion
Capital $0.7 billion
Total $2.2 billion
Metrobus General Information
Size 11,624 bus stops
Routes* 323
Fiscal Year 2011 Operating Budget $538 million
Highest Ridership Route in 2009 30’s – Pennsylvania Ave. (16,330 avg. wkdy ridership)
Metrobus Fare $1.70 cash, $1.50 SmarTrip®, Bus-to-bus Transfers Free
Express Bus Fare $3.85 cash, $3.65 SmarTrip®, Airport Fare $6.00
Bus Fleet* 1,491
Buses in Peak Service 1,244
Bus Fleet by Type* Compressed Natural Gas (460), Electric Hybrid (401), Clean Diesel (116) and All Other (514)
Average Fleet Age* 6.4 years
Bus Garages 9 – 3 in DC, 3 in MD and 3 in VA *As of December 2010.
Page 54 of 89
Washington Metropolitan Area Transit Authority March 2011 7
Metrorail General Information
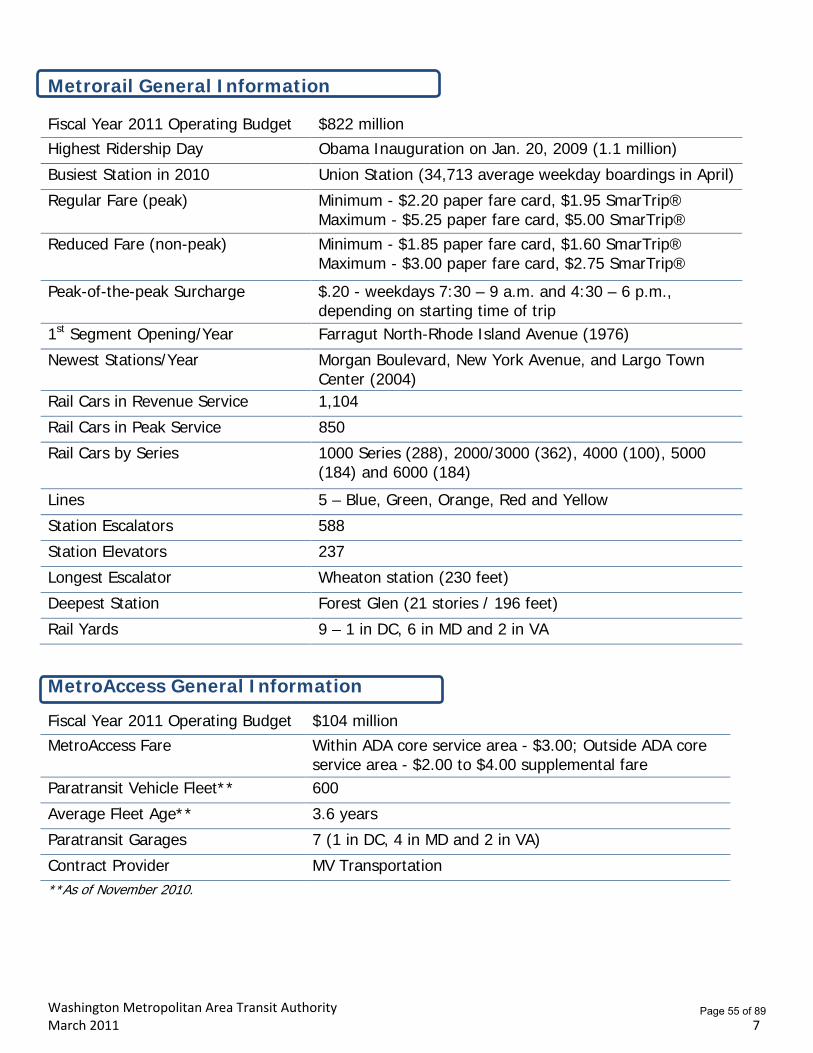
Fiscal Year 2011 Operating Budget $822 million Highest Ridership Day Obama Inauguration on Jan. 20, 2009 (1.1 million)
Busiest Station in 2010 Union Station (34,713 average weekday boardings in April)
Regular Fare (peak) Minimum - $2.20 paper fare card, $1.95 SmarTrip® Maximum - $5.25 paper fare card, $5.00 SmarTrip®
Reduced Fare (non-peak) Minimum - $1.85 paper fare card, $1.60 SmarTrip® Maximum - $3.00 paper fare card, $2.75 SmarTrip®
Peak-of-the-peak Surcharge $.20 - weekdays 7:30 – 9 a.m. and 4:30 – 6 p.m., depending on starting time of trip
1st Segment Opening/Year Farragut North-Rhode Island Avenue (1976)
Newest Stations/Year Morgan Boulevard, New York Avenue, and Largo Town Center (2004)
Rail Cars in Revenue Service 1,104
Rail Cars in Peak Service 850
Rail Cars by Series 1000 Series (288), 2000/3000 (362), 4000 (100), 5000 (184) and 6000 (184)
Lines 5 – Blue, Green, Orange, Red and Yellow
Station Escalators 588
Station Elevators 237
Longest Escalator Wheaton station (230 feet)
Deepest Station Forest Glen (21 stories / 196 feet)
Rail Yards 9 – 1 in DC, 6 in MD and 2 in VA
MetroAccess General Information
Fiscal Year 2011 Operating Budget $104 million MetroAccess Fare Within ADA core service area - $3.00; Outside ADA core
service area - $2.00 to $4.00 supplemental fare Paratransit Vehicle Fleet** 600
Average Fleet Age** 3.6 years
Paratransit Garages 7 (1 in DC, 4 in MD and 2 in VA)
Contract Provider MV Transportation **As of November 2010.
Page 55 of 89
Washington Metropolitan Area Transit Authority March 2011 8
KPI’s that Score How Metro is Performing
KPI: Bus On-Time Performance (January) Objective 2.1 Improve Service Reliability
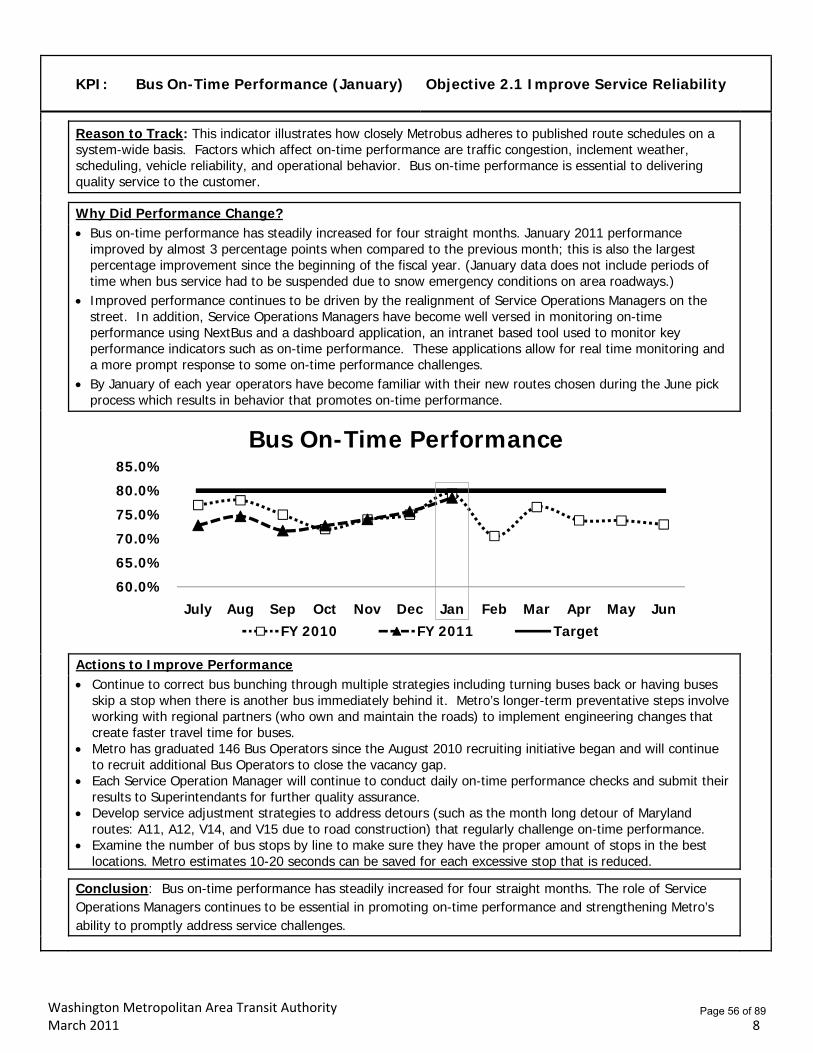
Reason to Track: This indicator illustrates how closely Metrobus adheres to published route schedules on a system-wide basis. Factors which affect on-time performance are traffic congestion, inclement weather, scheduling, vehicle reliability, and operational behavior. Bus on-time performance is essential to delivering quality service to the customer.
Why Did Performance Change?
Bus on-time performance has steadily increased for four straight months. January 2011 performance improved by almost 3 percentage points when compared to the previous month; this is also the largest percentage improvement since the beginning of the fiscal year. (January data does not include periods of time when bus service had to be suspended due to snow emergency conditions on area roadways.)
Improved performance continues to be driven by the realignment of Service Operations Managers on the street. In addition, Service Operations Managers have become well versed in monitoring on-time performance using NextBus and a dashboard application, an intranet based tool used to monitor key performance indicators such as on-time performance. These applications allow for real time monitoring and a more prompt response to some on-time performance challenges.
By January of each year operators have become familiar with their new routes chosen during the June pick process which results in behavior that promotes on-time performance.
Actions to Improve Performance
Continue to correct bus bunching through multiple strategies including turning buses back or having buses skip a stop when there is another bus immediately behind it. Metro’s longer-term preventative steps involve working with regional partners (who own and maintain the roads) to implement engineering changes that create faster travel time for buses.
Metro has graduated 146 Bus Operators since the August 2010 recruiting initiative began and will continue to recruit additional Bus Operators to close the vacancy gap.
Each Service Operation Manager will continue to conduct daily on-time performance checks and submit their results to Superintendants for further quality assurance.
Develop service adjustment strategies to address detours (such as the month long detour of Maryland routes: A11, A12, V14, and V15 due to road construction) that regularly challenge on-time performance.
Examine the number of bus stops by line to make sure they have the proper amount of stops in the best locations. Metro estimates 10-20 seconds can be saved for each excessive stop that is reduced.
Conclusion: Bus on-time performance has steadily increased for four straight months. The role of Service Operations Managers continues to be essential in promoting on-time performance and strengthening Metro’s ability to promptly address service challenges.
60.0%
65.0%
70.0%
75.0%
80.0%
85.0%
July Aug Sep Oct Nov Dec Jan Feb Mar Apr May Jun
Bus On-Time Performance
FY 2010 FY 2011 Target
Page 56 of 89
Washington Metropolitan Area Transit Authority March 2011 9
KPI:
Bus Fleet Reliability (January) (Mean Distance Between Failures)
Objective 2.1 Improve Service Reliability
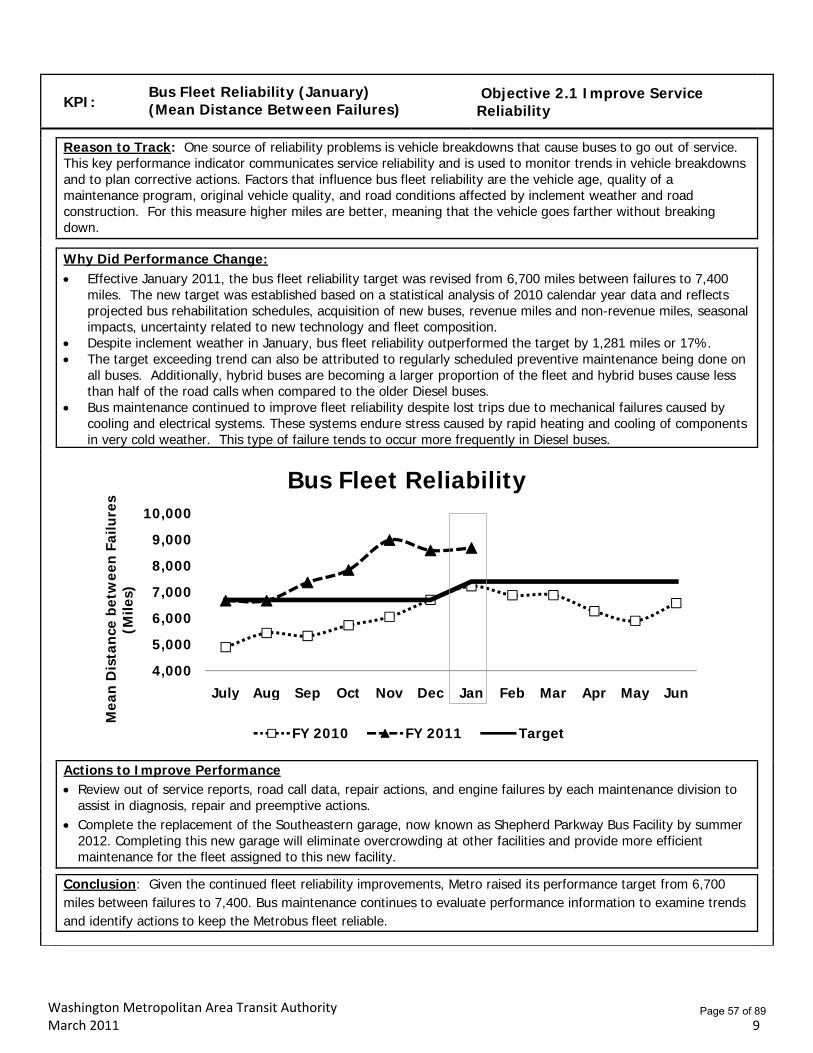
Reason to Track: One source of reliability problems is vehicle breakdowns that cause buses to go out of service. This key performance indicator communicates service reliability and is used to monitor trends in vehicle breakdowns and to plan corrective actions. Factors that influence bus fleet reliability are the vehicle age, quality of a maintenance program, original vehicle quality, and road conditions affected by inclement weather and road construction. For this measure higher miles are better, meaning that the vehicle goes farther without breaking down.
Why Did Performance Change:
Effective January 2011, the bus fleet reliability target was revised from 6,700 miles between failures to 7,400 miles. The new target was established based on a statistical analysis of 2010 calendar year data and reflects projected bus rehabilitation schedules, acquisition of new buses, revenue miles and non-revenue miles, seasonal impacts, uncertainty related to new technology and fleet composition.
Despite inclement weather in January, bus fleet reliability outperformed the target by 1,281 miles or 17%. The target exceeding trend can also be attributed to regularly scheduled preventive maintenance being done on
all buses. Additionally, hybrid buses are becoming a larger proportion of the fleet and hybrid buses cause less than half of the road calls when compared to the older Diesel buses.
Bus maintenance continued to improve fleet reliability despite lost trips due to mechanical failures caused by cooling and electrical systems. These systems endure stress caused by rapid heating and cooling of components in very cold weather. This type of failure tends to occur more frequently in Diesel buses.
Actions to Improve Performance Review out of service reports, road call data, repair actions, and engine failures by each maintenance division to
assist in diagnosis, repair and preemptive actions. Complete the replacement of the Southeastern garage, now known as Shepherd Parkway Bus Facility by summer
2012. Completing this new garage will eliminate overcrowding at other facilities and provide more efficient maintenance for the fleet assigned to this new facility.
Conclusion: Given the continued fleet reliability improvements, Metro raised its performance target from 6,700 miles between failures to 7,400. Bus maintenance continues to evaluate performance information to examine trends and identify actions to keep the Metrobus fleet reliable.
4,000
5,000
6,000
7,000
8,000
9,000
10,000
July Aug Sep Oct Nov Dec Jan Feb Mar Apr May Jun
Mea
n D
ista
nce
bet
wee
n F
ailu
res
(M
iles)
Bus Fleet Reliability
FY 2010 FY 2011 Target
Page 57 of 89
Washington Metropolitan Area Transit Authority March 2011 10
KPI: Rail On-Time Performance (January) Objective 2.1 Improve Service Reliability
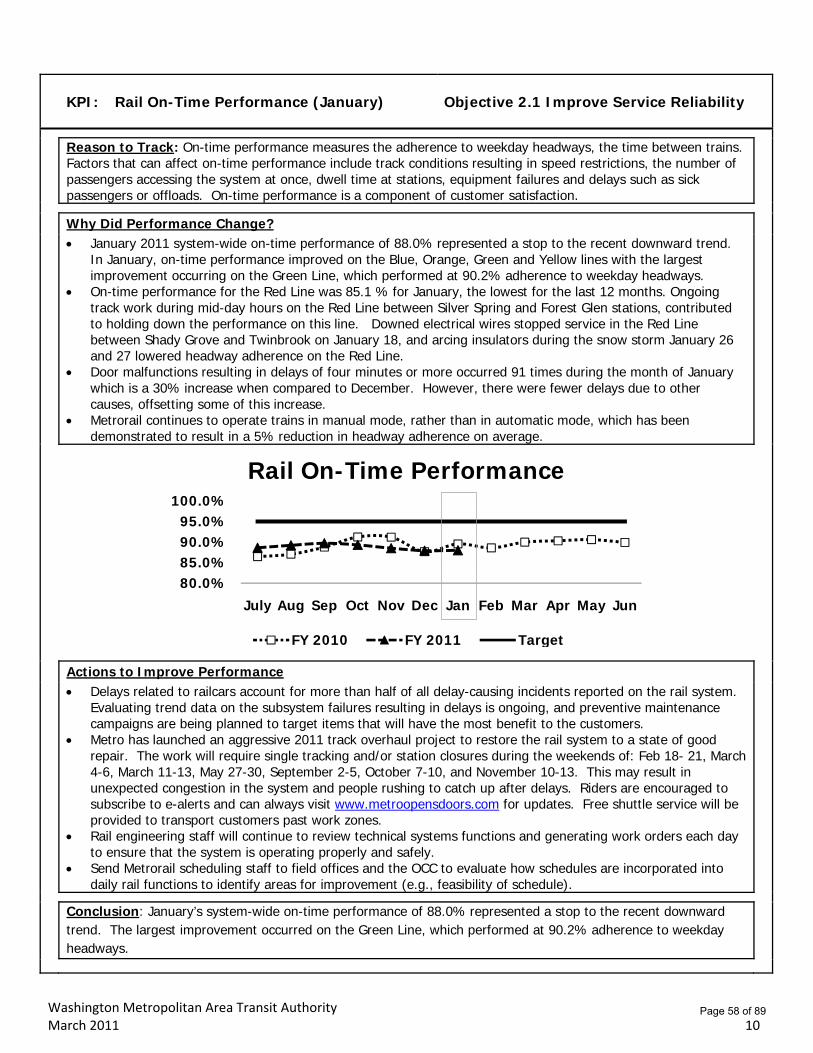
Reason to Track: On-time performance measures the adherence to weekday headways, the time between trains. Factors that can affect on-time performance include track conditions resulting in speed restrictions, the number of passengers accessing the system at once, dwell time at stations, equipment failures and delays such as sick passengers or offloads. On-time performance is a component of customer satisfaction.
Why Did Performance Change?
January 2011 system-wide on-time performance of 88.0% represented a stop to the recent downward trend. In January, on-time performance improved on the Blue, Orange, Green and Yellow lines with the largest improvement occurring on the Green Line, which performed at 90.2% adherence to weekday headways.
On-time performance for the Red Line was 85.1 % for January, the lowest for the last 12 months. Ongoing track work during mid-day hours on the Red Line between Silver Spring and Forest Glen stations, contributed to holding down the performance on this line. Downed electrical wires stopped service in the Red Line between Shady Grove and Twinbrook on January 18, and arcing insulators during the snow storm January 26 and 27 lowered headway adherence on the Red Line.
Door malfunctions resulting in delays of four minutes or more occurred 91 times during the month of January which is a 30% increase when compared to December. However, there were fewer delays due to other causes, offsetting some of this increase.
Metrorail continues to operate trains in manual mode, rather than in automatic mode, which has been demonstrated to result in a 5% reduction in headway adherence on average.
Actions to Improve Performance
Delays related to railcars account for more than half of all delay-causing incidents reported on the rail system. Evaluating trend data on the subsystem failures resulting in delays is ongoing, and preventive maintenance campaigns are being planned to target items that will have the most benefit to the customers.
Metro has launched an aggressive 2011 track overhaul project to restore the rail system to a state of good repair. The work will require single tracking and/or station closures during the weekends of: Feb 18- 21, March 4-6, March 11-13, May 27-30, September 2-5, October 7-10, and November 10-13. This may result in unexpected congestion in the system and people rushing to catch up after delays. Riders are encouraged to subscribe to e-alerts and can always visit www.metroopensdoors.com for updates. Free shuttle service will be provided to transport customers past work zones.
Rail engineering staff will continue to review technical systems functions and generating work orders each day to ensure that the system is operating properly and safely.
Send Metrorail scheduling staff to field offices and the OCC to evaluate how schedules are incorporated into daily rail functions to identify areas for improvement (e.g., feasibility of schedule).
Conclusion: January’s system-wide on-time performance of 88.0% represented a stop to the recent downward trend. The largest improvement occurred on the Green Line, which performed at 90.2% adherence to weekday headways.
80.0%85.0%90.0%95.0%
100.0%
July Aug Sep Oct Nov Dec Jan Feb Mar Apr May Jun
Rail On-Time Performance
FY 2010 FY 2011 Target
Page 58 of 89
Washington Metropolitan Area Transit Authority March 2011 11
KPI:
Rail Fleet Reliability (January) (Mean Distance Between Delays) Objective 2.1 Improve Service Reliability
Reason to Track: Mean distance between delays communicates the effectiveness of Metro’s railcar maintenance program. This measure reports the number of miles between railcar failures resulting in delays of service greater than three minutes. Factors that influence railcar reliability are the age of the railcars, the amount the railcars are used, and the interaction between railcars and the track. The higher the mileage for the mean distance between delays, the more reliable the railcars.
Why Did Performance Change?
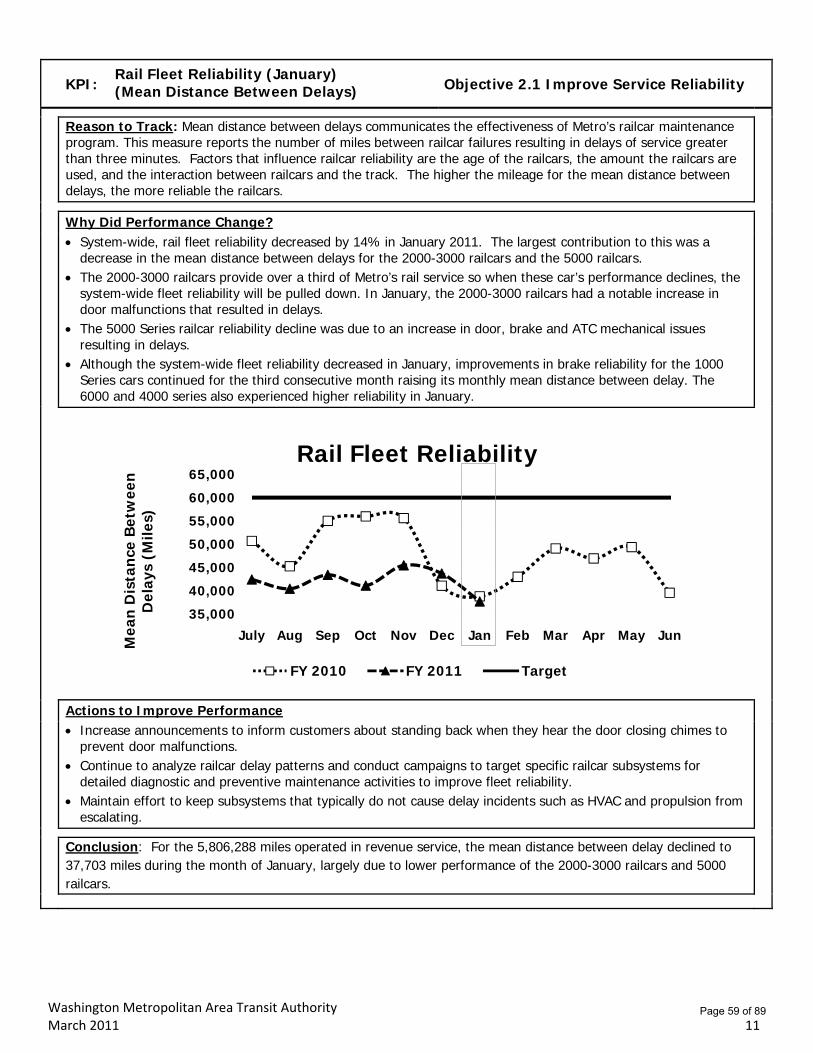
System-wide, rail fleet reliability decreased by 14% in January 2011. The largest contribution to this was a decrease in the mean distance between delays for the 2000-3000 railcars and the 5000 railcars.
The 2000-3000 railcars provide over a third of Metro’s rail service so when these car’s performance declines, the system-wide fleet reliability will be pulled down. In January, the 2000-3000 railcars had a notable increase in door malfunctions that resulted in delays.
The 5000 Series railcar reliability decline was due to an increase in door, brake and ATC mechanical issues resulting in delays.
Although the system-wide fleet reliability decreased in January, improvements in brake reliability for the 1000 Series cars continued for the third consecutive month raising its monthly mean distance between delay. The 6000 and 4000 series also experienced higher reliability in January.
Actions to Improve Performance
Increase announcements to inform customers about standing back when they hear the door closing chimes to prevent door malfunctions.
Continue to analyze railcar delay patterns and conduct campaigns to target specific railcar subsystems for detailed diagnostic and preventive maintenance activities to improve fleet reliability.
Maintain effort to keep subsystems that typically do not cause delay incidents such as HVAC and propulsion from escalating.
Conclusion: For the 5,806,288 miles operated in revenue service, the mean distance between delay declined to 37,703 miles during the month of January, largely due to lower performance of the 2000-3000 railcars and 5000 railcars.
35,000
40,000
45,000
50,000
55,000
60,000
65,000
July Aug Sep Oct Nov Dec Jan Feb Mar Apr May JunMea
n D
ista
nce
Bet
wee
n
Del
ays
(Mile
s)
Rail Fleet Reliability
FY 2010 FY 2011 Target
Page 59 of 89
Washington Metropolitan Area Transit Authority March 2011 12
KPI: MetroAccess On-Time Performance (January) Objective 2.1 Improve Service Reliability
Reason to Track: On-time performance is a measure of MetroAccess service reliability and how well service meets both regulatory and customer expectations. Adhering to the customer's scheduled pick-up window is comparable to Metrobus adhering to scheduled timetables. Factors which affect on-time performance are traffic congestion, inclement weather, scheduling, vehicle reliability and operational behavior. MetroAccess on-time performance is essential to delivering quality service to customers, and meeting service criteria established through Federal Transit Administration regulatory guidance.
Why Did Performance Change?
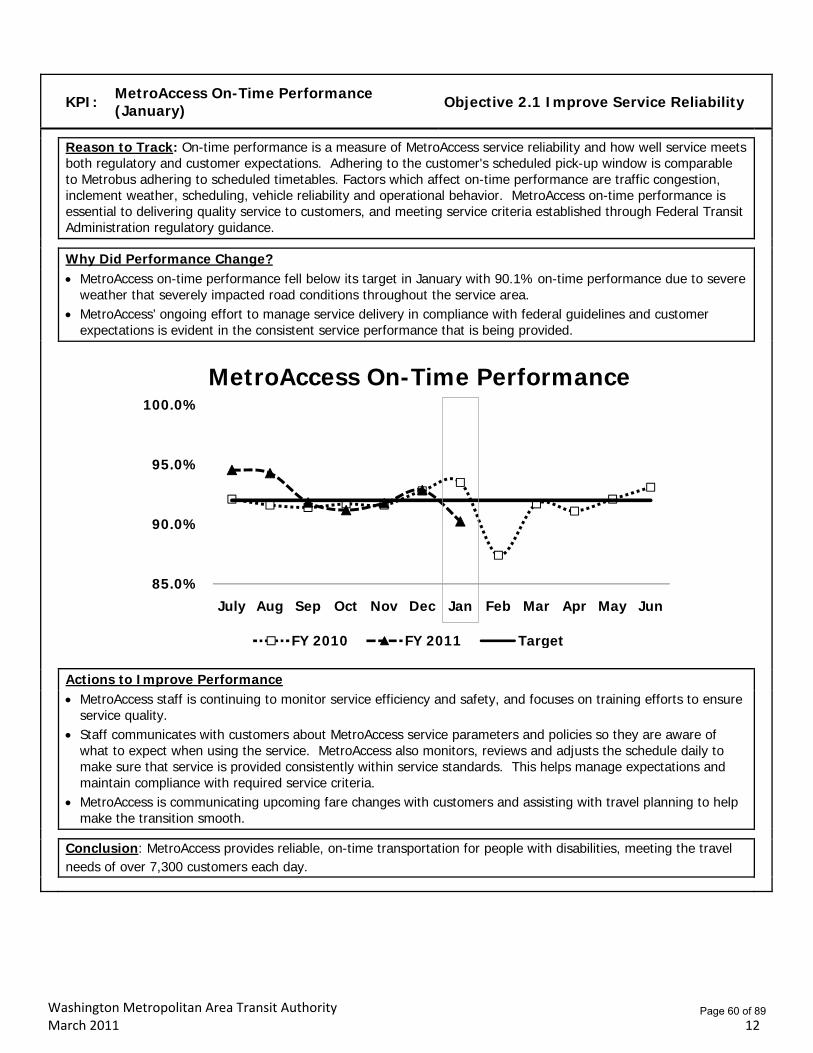
MetroAccess on-time performance fell below its target in January with 90.1% on-time performance due to severe weather that severely impacted road conditions throughout the service area.
MetroAccess’ ongoing effort to manage service delivery in compliance with federal guidelines and customer expectations is evident in the consistent service performance that is being provided.
Actions to Improve Performance
MetroAccess staff is continuing to monitor service efficiency and safety, and focuses on training efforts to ensure service quality.
Staff communicates with customers about MetroAccess service parameters and policies so they are aware of what to expect when using the service. MetroAccess also monitors, reviews and adjusts the schedule daily to make sure that service is provided consistently within service standards. This helps manage expectations and maintain compliance with required service criteria.
MetroAccess is communicating upcoming fare changes with customers and assisting with travel planning to help make the transition smooth.
Conclusion: MetroAccess provides reliable, on-time transportation for people with disabilities, meeting the travel needs of over 7,300 customers each day.
85.0%
90.0%
95.0%
100.0%
July Aug Sep Oct Nov Dec Jan Feb Mar Apr May Jun
MetroAccess On-Time Performance
FY 2010 FY 2011 Target
Page 60 of 89
Washington Metropolitan Area Transit Authority March 2011 13
KPI: Escalator System Availability (January) Objective 2.1 Improve Service Reliability
Reason to Track: Customers access Metrorail stations via escalators to the train platform. An out-of-service escalator requires walking up or down a stopped escalator, which can add to total travel time and may make stations inaccessible to some customers. Escalator availability is a key component of customer satisfaction with Metrorail service. This measure communicates system-wide escalator performance (at all stations over the course of the day) and will vary from an individual customer’s experience.
Why Did Performance Change?
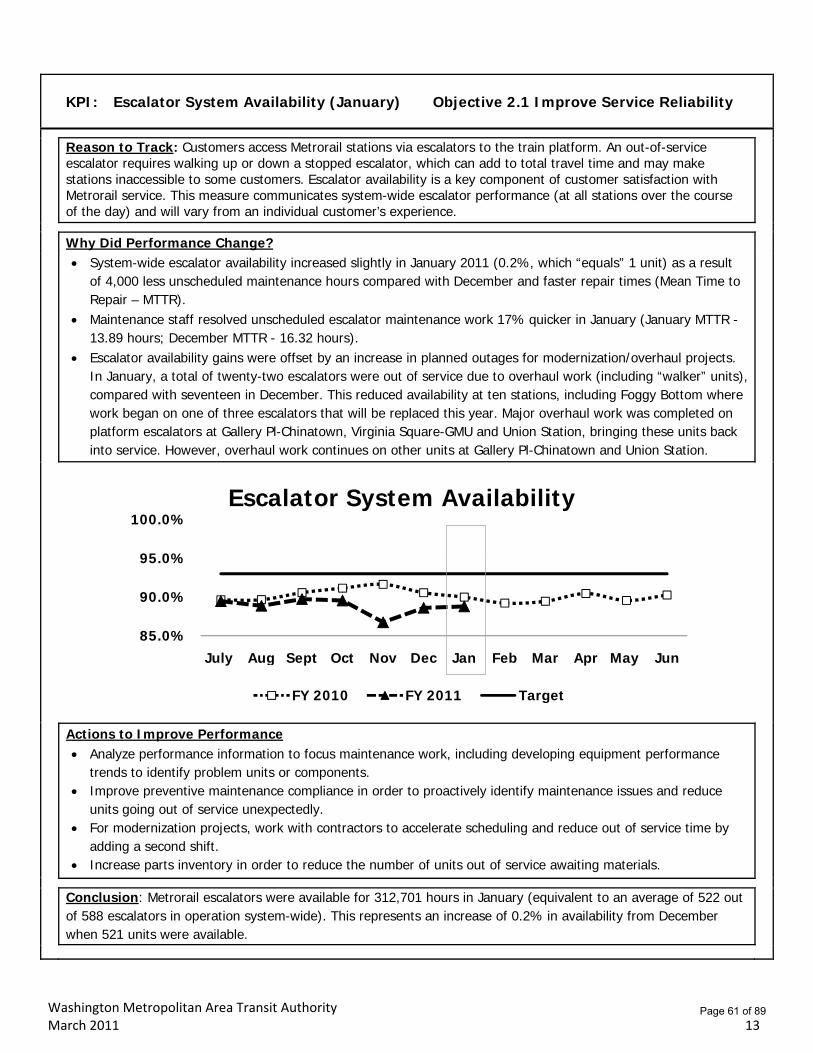
System-wide escalator availability increased slightly in January 2011 (0.2%, which “equals” 1 unit) as a result of 4,000 less unscheduled maintenance hours compared with December and faster repair times (Mean Time to Repair – MTTR).
Maintenance staff resolved unscheduled escalator maintenance work 17% quicker in January (January MTTR - 13.89 hours; December MTTR - 16.32 hours).
Escalator availability gains were offset by an increase in planned outages for modernization/overhaul projects. In January, a total of twenty-two escalators were out of service due to overhaul work (including “walker” units), compared with seventeen in December. This reduced availability at ten stations, including Foggy Bottom where work began on one of three escalators that will be replaced this year. Major overhaul work was completed on platform escalators at Gallery Pl-Chinatown, Virginia Square-GMU and Union Station, bringing these units back into service. However, overhaul work continues on other units at Gallery Pl-Chinatown and Union Station.
Actions to Improve Performance
Analyze performance information to focus maintenance work, including developing equipment performance trends to identify problem units or components.
Improve preventive maintenance compliance in order to proactively identify maintenance issues and reduce units going out of service unexpectedly.
For modernization projects, work with contractors to accelerate scheduling and reduce out of service time by adding a second shift.
Increase parts inventory in order to reduce the number of units out of service awaiting materials.
Conclusion: Metrorail escalators were available for 312,701 hours in January (equivalent to an average of 522 out of 588 escalators in operation system-wide). This represents an increase of 0.2% in availability from December when 521 units were available.
85.0%
90.0%
95.0%
100.0%
July Aug Sept Oct Nov Dec Jan Feb Mar Apr May Jun
Escalator System Availability
FY 2010 FY 2011 Target
Page 61 of 89
Washington Metropolitan Area Transit Authority March 2011 14
KPI: Elevator System Availability (January) Objective 2.1 Improve Service Reliability
Reason to Track: Metrorail elevators provide an accessible path of travel for persons with disabilities, seniors, customers with strollers, travelers carrying luggage and other riders. When an elevator is out of service, Metro is required to provide alternative services, which may include a shuttle bus service to another station.
Why Did Performance Change?
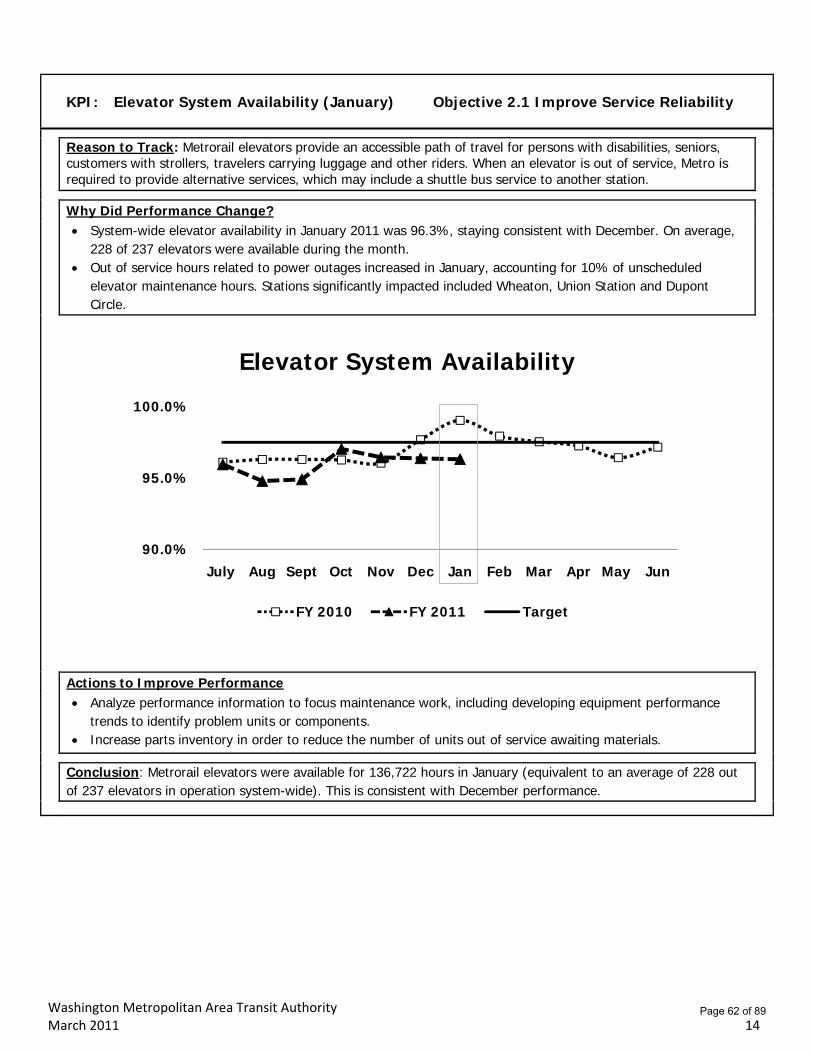
System-wide elevator availability in January 2011 was 96.3%, staying consistent with December. On average, 228 of 237 elevators were available during the month.
Out of service hours related to power outages increased in January, accounting for 10% of unscheduled elevator maintenance hours. Stations significantly impacted included Wheaton, Union Station and Dupont Circle.
Actions to Improve Performance
Analyze performance information to focus maintenance work, including developing equipment performance
trends to identify problem units or components. Increase parts inventory in order to reduce the number of units out of service awaiting materials.
Conclusion: Metrorail elevators were available for 136,722 hours in January (equivalent to an average of 228 out of 237 elevators in operation system-wide). This is consistent with December performance.
90.0%
95.0%
100.0%
July Aug Sept Oct Nov Dec Jan Feb Mar Apr May Jun
Elevator System Availability
FY 2010 FY 2011 Target
Page 62 of 89
Washington Metropolitan Area Transit Authority March 2011 15
KPI: Passenger Injury Rate (December) Objective 1.1 Improve Customer and
Employee Safety and Security
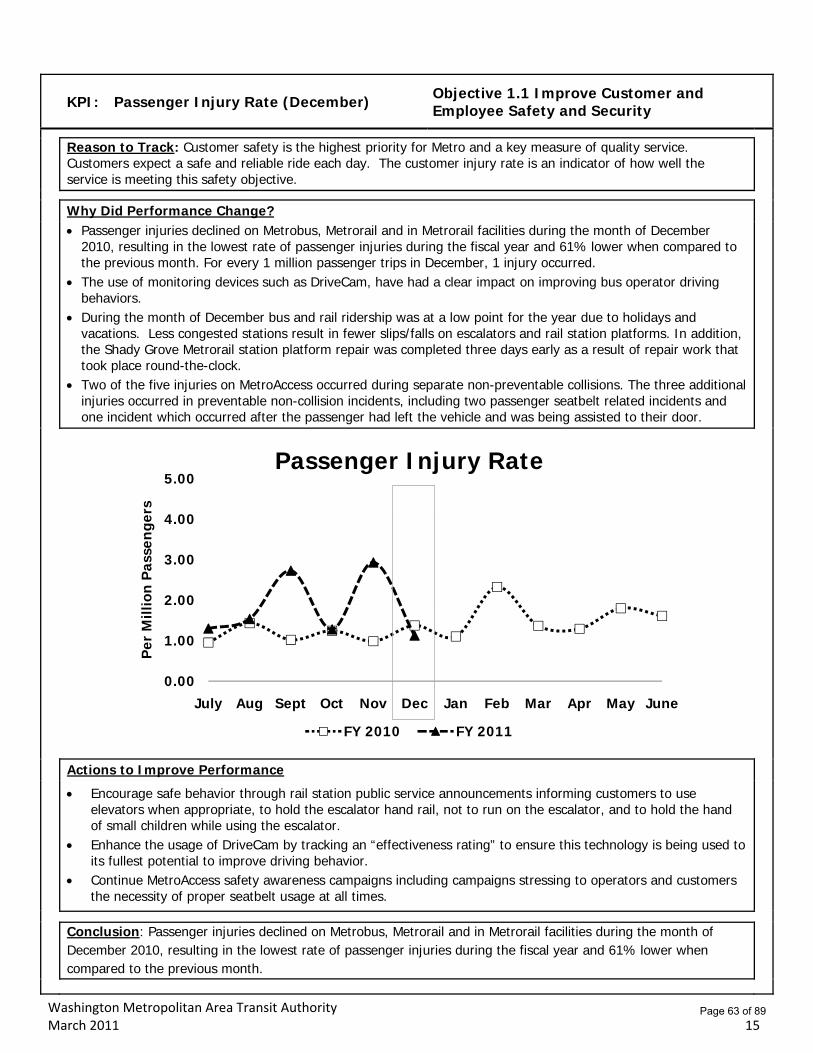
Reason to Track: Customer safety is the highest priority for Metro and a key measure of quality service. Customers expect a safe and reliable ride each day. The customer injury rate is an indicator of how well the service is meeting this safety objective.
Why Did Performance Change?
Passenger injuries declined on Metrobus, Metrorail and in Metrorail facilities during the month of December 2010, resulting in the lowest rate of passenger injuries during the fiscal year and 61% lower when compared to the previous month. For every 1 million passenger trips in December, 1 injury occurred.
The use of monitoring devices such as DriveCam, have had a clear impact on improving bus operator driving behaviors.
During the month of December bus and rail ridership was at a low point for the year due to holidays and vacations. Less congested stations result in fewer slips/falls on escalators and rail station platforms. In addition, the Shady Grove Metrorail station platform repair was completed three days early as a result of repair work that took place round-the-clock.
Two of the five injuries on MetroAccess occurred during separate non-preventable collisions. The three additional injuries occurred in preventable non-collision incidents, including two passenger seatbelt related incidents and one incident which occurred after the passenger had left the vehicle and was being assisted to their door.
Actions to Improve Performance
Encourage safe behavior through rail station public service announcements informing customers to use elevators when appropriate, to hold the escalator hand rail, not to run on the escalator, and to hold the hand of small children while using the escalator.
Enhance the usage of DriveCam by tracking an “effectiveness rating” to ensure this technology is being used to its fullest potential to improve driving behavior.
Continue MetroAccess safety awareness campaigns including campaigns stressing to operators and customers the necessity of proper seatbelt usage at all times.
Conclusion: Passenger injuries declined on Metrobus, Metrorail and in Metrorail facilities during the month of December 2010, resulting in the lowest rate of passenger injuries during the fiscal year and 61% lower when compared to the previous month.
0.00
1.00
2.00
3.00
4.00
5.00
July Aug Sept Oct Nov Dec Jan Feb Mar Apr May June
Per
Mill
ion
Pas
sen
gers
Passenger Injury Rate
FY 2010 FY 2011
Page 63 of 89
Washington Metropolitan Area Transit Authority March 2011 16
KPI: Employee Injury Rate (January) Objective 1.1 Improve Customer and Employee Safety and Security
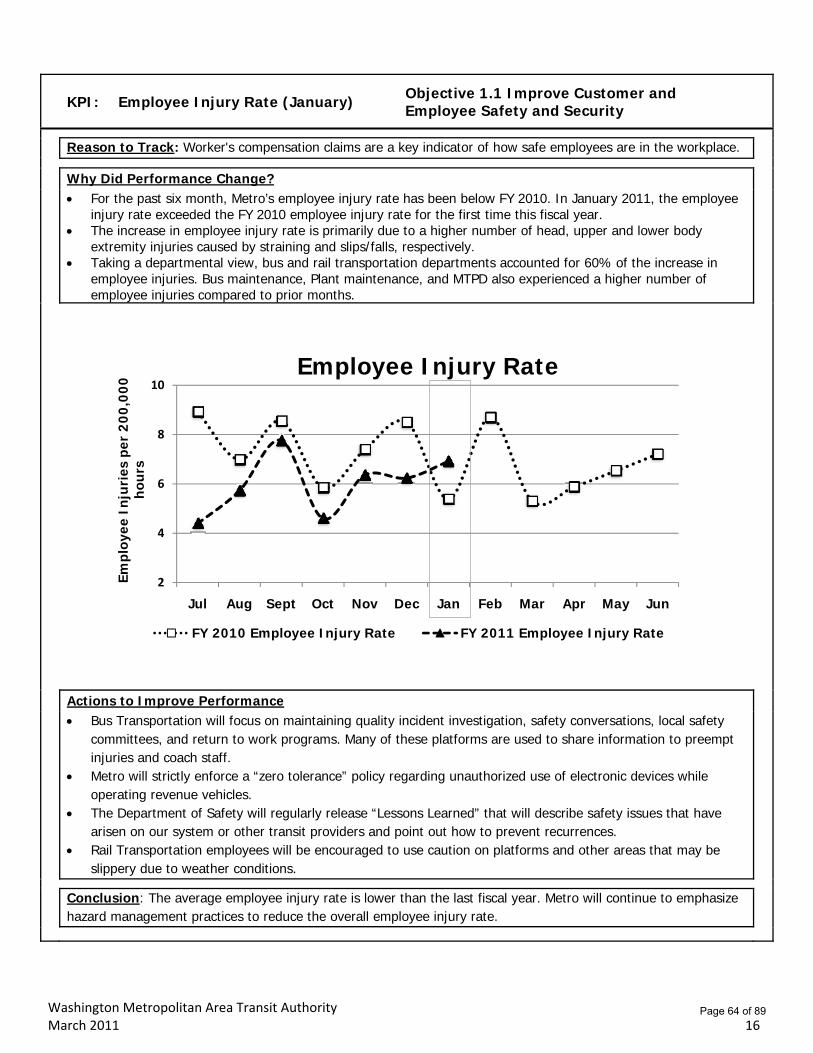
Reason to Track: Worker's compensation claims are a key indicator of how safe employees are in the workplace.
Why Did Performance Change?
For the past six month, Metro’s employee injury rate has been below FY 2010. In January 2011, the employee injury rate exceeded the FY 2010 employee injury rate for the first time this fiscal year.
The increase in employee injury rate is primarily due to a higher number of head, upper and lower body extremity injuries caused by straining and slips/falls, respectively.
Taking a departmental view, bus and rail transportation departments accounted for 60% of the increase in employee injuries. Bus maintenance, Plant maintenance, and MTPD also experienced a higher number of employee injuries compared to prior months.
Actions to Improve Performance
Bus Transportation will focus on maintaining quality incident investigation, safety conversations, local safety committees, and return to work programs. Many of these platforms are used to share information to preempt injuries and coach staff.
Metro will strictly enforce a “zero tolerance” policy regarding unauthorized use of electronic devices while operating revenue vehicles.
The Department of Safety will regularly release “Lessons Learned” that will describe safety issues that have arisen on our system or other transit providers and point out how to prevent recurrences.
Rail Transportation employees will be encouraged to use caution on platforms and other areas that may be slippery due to weather conditions.
Conclusion: The average employee injury rate is lower than the last fiscal year. Metro will continue to emphasize hazard management practices to reduce the overall employee injury rate.
2
4
6
8
10
Jul Aug Sept Oct Nov Dec Jan Feb Mar Apr May Jun
Empl
oyee
In
juri
es p
er 2
00,0
00
hou
rs
Employee Injury Rate
FY 2010 Employee Injury Rate FY 2011 Employee Injury Rate
Page 64 of 89

Washington Metropolitan Area Transit Authority March 2011 17
KPI: Crime Rate (December) Per Million Passengers
Objective 1.1 Improve Customer and Employee Safety and Security
Reason to Track: This measure provides an indication of the perception of safety and security customers experience when traveling the Metro system. Increases or decreases in crime statistics can have a direct effect on whether customers feel safe in the system.
Why Did Performance Change?
Bus crimes per million riders was reduced by over 13% in December 2010 due to better identification and focus on crime hot spots resulting from MetroStat crime analysis.
The Metrorail crime rate increased slightly in December due to an increase in robberies. In anticipation of increased crime during the holiday season, MTPD added undercover robbery suppression teams. MTPD also established officer details to address youth disorder during holiday school closings. As a result of these efforts, robberies only increased by 6.6% in December, bicycle thefts (included in the Metrorail crime rate) continued to reduce (down 84% in Dec.) due to seasonal influences (Nov: 19; Dec: 3).
Parking lot crime increased for the month of December (Nov: 58; Dec: 71) due to thefts of parts/accessories (typically GPS devices or radios) and thefts from automobiles (e.g., personal items such as clothing, CDs, electronic devices, or change). It is not unusual to experience an increase in thefts during the holiday season, when criminals expect to exchange stolen items for cash. Despite the increase, overall parking lot crime for the calendar year is reduced by over 8% (2009 – 819, 2010 – 747).
Actions to Improve Performance
Continue to enhance crime analysis provided in MTPD’s MetroStat process through GIS mapping, providing additional information for targeting deployment strategies based on geographic concentrations of crime.
Midnight mobile patrol officers are giving special attention to parking lots where commuters park vehicles for multiple days and overnight. Officers will be encouraged to establish a base of operation at high crime stations.
In order to increase officer presence in the transit system and enhance organizational effectiveness, MTPD will examine new deployment strategies such as moving specialized units to patrol operations.
Conclusion: Bus crime was down in December. The holiday season brought an anticipated increase in robberies and thefts, impacting the crime rates for Metrorail and Parking Lots.
-
2
4
6
8
July Aug Sept Oct Nov Dec Jan Feb Mar Apr May Jun
FY 2010 Metrobus
FY 2011 Metrobus
-
2
4
6
8
July Aug Sept Oct Nov Dec Jan Feb Mar Apr May Jun
FY 2010 Metrorail
FY 2011 Metrorail
-
2
4
6
8
July Aug Sept Oct Nov Dec Jan Feb Mar Apr May Jun
FY 2010 Parking
FY 2011 Parking
Per
Mill
ion
Pas
sen
gers
Crime Rate
Page 65 of 89
Washington Metropolitan Area Transit Authority March 2011 18
KPI: Arrests, Citations and Summonses
(December) Objective 1.2 Strengthen Metro’s Safety and Security Response
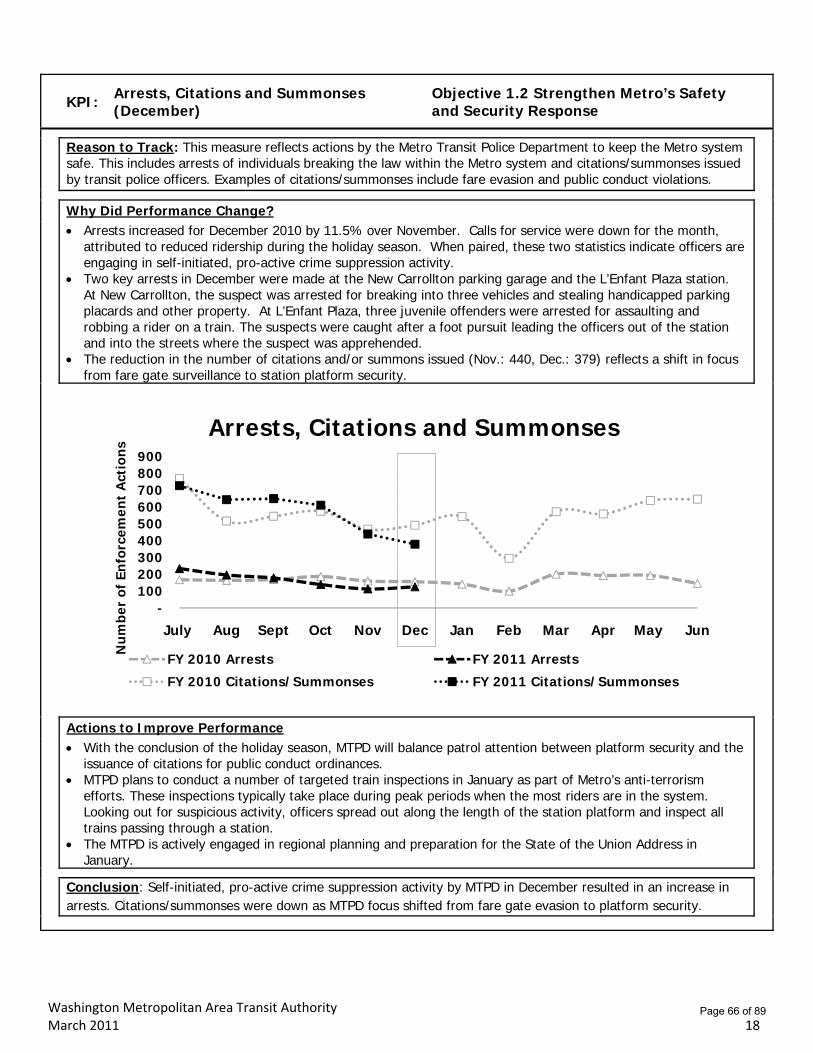
Reason to Track: This measure reflects actions by the Metro Transit Police Department to keep the Metro system safe. This includes arrests of individuals breaking the law within the Metro system and citations/summonses issued by transit police officers. Examples of citations/summonses include fare evasion and public conduct violations.
Why Did Performance Change?
Arrests increased for December 2010 by 11.5% over November. Calls for service were down for the month, attributed to reduced ridership during the holiday season. When paired, these two statistics indicate officers are engaging in self-initiated, pro-active crime suppression activity.
Two key arrests in December were made at the New Carrollton parking garage and the L’Enfant Plaza station. At New Carrollton, the suspect was arrested for breaking into three vehicles and stealing handicapped parking placards and other property. At L’Enfant Plaza, three juvenile offenders were arrested for assaulting and robbing a rider on a train. The suspects were caught after a foot pursuit leading the officers out of the station and into the streets where the suspect was apprehended.
The reduction in the number of citations and/or summons issued (Nov.: 440, Dec.: 379) reflects a shift in focus from fare gate surveillance to station platform security.
Actions to Improve Performance
With the conclusion of the holiday season, MTPD will balance patrol attention between platform security and the issuance of citations for public conduct ordinances.
MTPD plans to conduct a number of targeted train inspections in January as part of Metro’s anti-terrorism efforts. These inspections typically take place during peak periods when the most riders are in the system. Looking out for suspicious activity, officers spread out along the length of the station platform and inspect all trains passing through a station.
The MTPD is actively engaged in regional planning and preparation for the State of the Union Address in January.
Conclusion: Self-initiated, pro-active crime suppression activity by MTPD in December resulted in an increase in arrests. Citations/summonses were down as MTPD focus shifted from fare gate evasion to platform security.
-100 200 300 400 500 600 700 800 900
July Aug Sept Oct Nov Dec Jan Feb Mar Apr May Jun
Nu
mbe
r of
En
forc
emen
t A
ctio
ns
Arrests, Citations and Summonses
FY 2010 Arrests FY 2011 Arrests
FY 2010 Citations/Summonses FY 2011 Citations/Summonses
Page 66 of 89
Washington Metropolitan Area Transit Authority March 2011 19
KPI: Customer Comment Rate (January) Objective 2.3 Maximize Rider Satisfaction
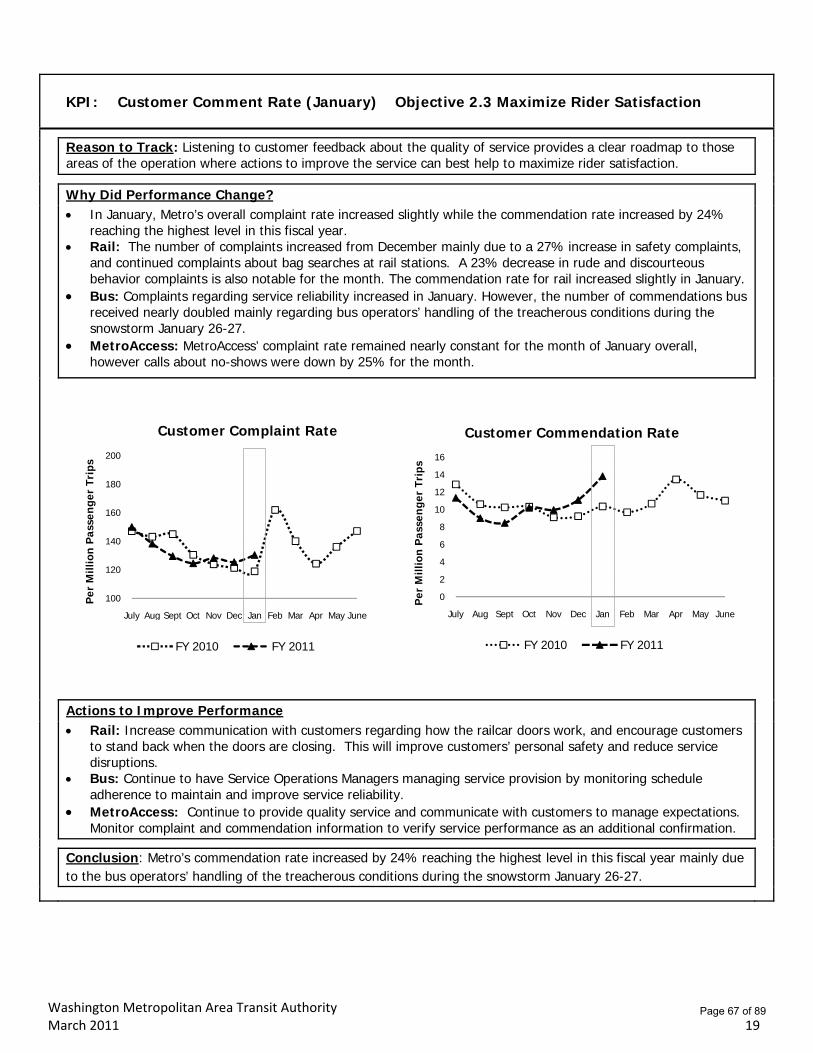
Reason to Track: Listening to customer feedback about the quality of service provides a clear roadmap to those areas of the operation where actions to improve the service can best help to maximize rider satisfaction.
Why Did Performance Change?
In January, Metro’s overall complaint rate increased slightly while the commendation rate increased by 24% reaching the highest level in this fiscal year.
Rail: The number of complaints increased from December mainly due to a 27% increase in safety complaints, and continued complaints about bag searches at rail stations. A 23% decrease in rude and discourteous behavior complaints is also notable for the month. The commendation rate for rail increased slightly in January.
Bus: Complaints regarding service reliability increased in January. However, the number of commendations bus received nearly doubled mainly regarding bus operators’ handling of the treacherous conditions during the snowstorm January 26-27.
MetroAccess: MetroAccess’ complaint rate remained nearly constant for the month of January overall, however calls about no-shows were down by 25% for the month.
Actions to Improve Performance
Rail: Increase communication with customers regarding how the railcar doors work, and encourage customers to stand back when the doors are closing. This will improve customers’ personal safety and reduce service disruptions.
Bus: Continue to have Service Operations Managers managing service provision by monitoring schedule adherence to maintain and improve service reliability.
MetroAccess: Continue to provide quality service and communicate with customers to manage expectations. Monitor complaint and commendation information to verify service performance as an additional confirmation.
Conclusion: Metro’s commendation rate increased by 24% reaching the highest level in this fiscal year mainly due to the bus operators’ handling of the treacherous conditions during the snowstorm January 26-27.
100
120
140
160
180
200
July Aug Sept Oct Nov Dec Jan Feb Mar Apr May June
Per
Mill
ion
Pas
sen
ger
Trip
s
Customer Complaint Rate
FY 2010 FY 2011
0
2
4
6
8
10
12
14
16
July Aug Sept Oct Nov Dec Jan Feb Mar Apr May June
Per
Mill
ion
Pas
sen
ger
Trip
sCustomer Commendation Rate
FY 2010 FY 2011
Page 67 of 89
Washington Metropolitan Area Transit Authority March 2011 20
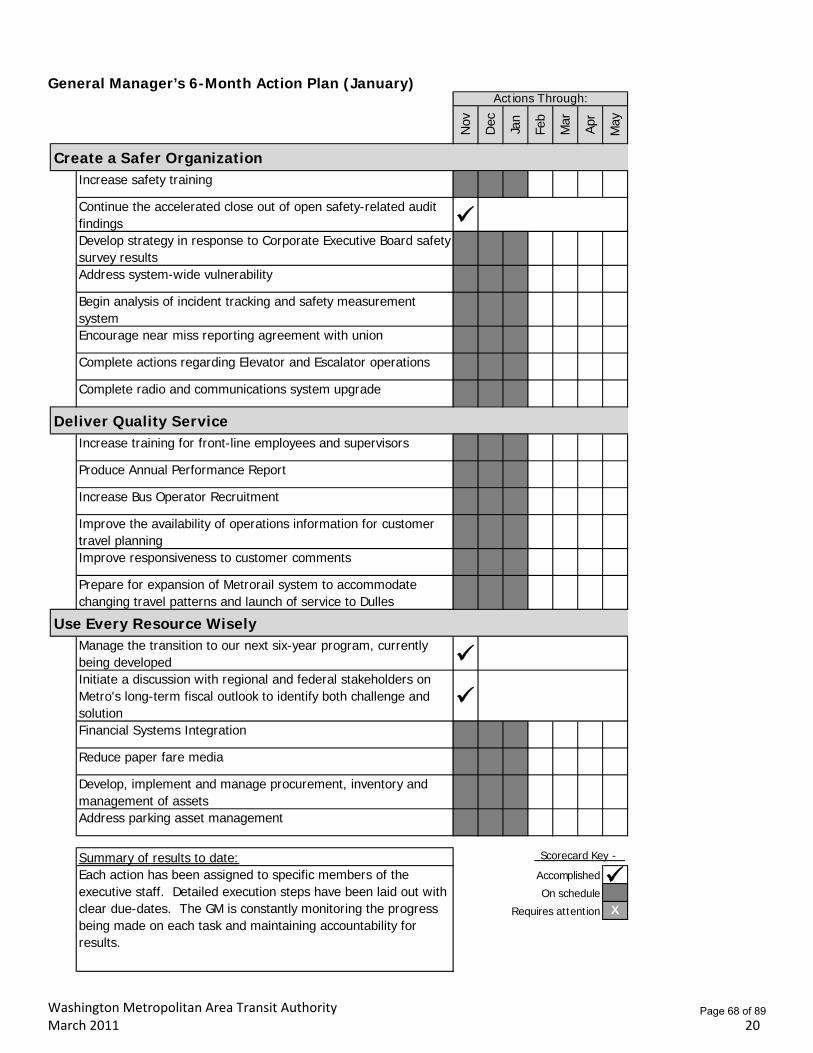
General Manager’s 6-Month Action Plan (January)
Nov
Dec Jan
Feb
Mar
Apr
May
Create a Safer OrganizationIncrease safety training
Continue the accelerated close out of open safety-related audit findings Develop strategy in response to Corporate Executive Board safety survey resultsAddress system-wide vulnerability
Begin analysis of incident tracking and safety measurement systemEncourage near miss reporting agreement with union
Complete actions regarding Elevator and Escalator operations
Complete radio and communications system upgrade
Deliver Quality ServiceIncrease training for front-line employees and supervisors
Produce Annual Performance Report
Increase Bus Operator Recruitment
Improve the availability of operations information for customer travel planningImprove responsiveness to customer comments
Prepare for expansion of Metrorail system to accommodate changing travel patterns and launch of service to Dulles
Use Every Resource WiselyManage the transition to our next six-year program, currently being developed Initiate a discussion with regional and federal stakeholders on Metro's long-term fiscal outlook to identify both challenge and solution
Financial Systems Integration
Reduce paper fare media
Develop, implement and manage procurement, inventory and management of assetsAddress parking asset management
Summary of results to date: Scorecard Key -
AccomplishedOn schedule
Requires attention X
Each action has been assigned to specific members of the executive staff. Detailed execution steps have been laid out with clear due-dates. The GM is constantly monitoring the progress being made on each task and maintaining accountability for results.
Actions Through:
Page 68 of 89
Washington Metropolitan Area Transit Authority March 2011 21
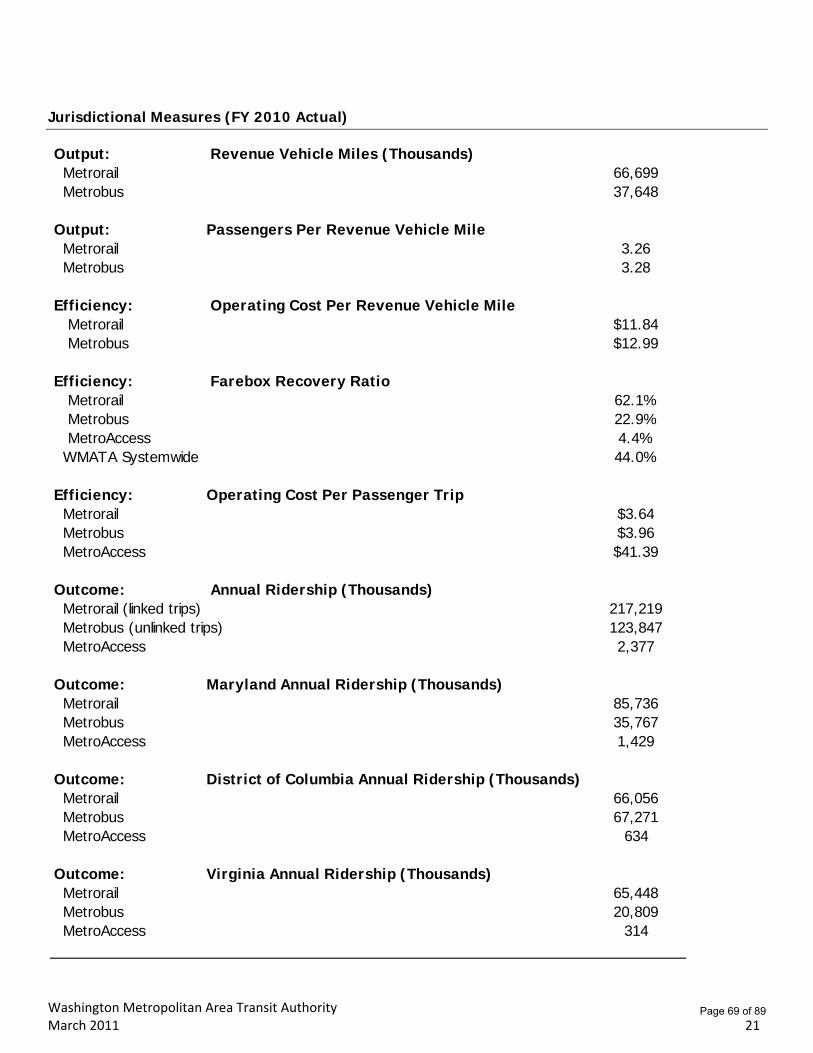
Jurisdictional Measures (FY 2010 Actual)
Output: Revenue Vehicle Miles (Thousands) Metrorail 66,699 Metrobus 37,648
Output: Passengers Per Revenue Vehicle Mile Metrorail 3.26 Metrobus 3.28
Efficiency: Operating Cost Per Revenue Vehicle Mile Metrorail $11.84 Metrobus $12.99
Efficiency: Farebox Recovery Ratio Metrorail 62.1% Metrobus 22.9% MetroAccess 4.4% WMATA Systemwide 44.0%
Efficiency: Operating Cost Per Passenger Trip Metrorail $3.64 Metrobus $3.96 MetroAccess $41.39
Outcome: Annual Ridership (Thousands) Metrorail (linked trips) 217,219 Metrobus (unlinked trips) 123,847 MetroAccess 2,377
Outcome: Maryland Annual Ridership (Thousands) Metrorail 85,736 Metrobus 35,767 MetroAccess 1,429
Outcome: District of Columbia Annual Ridership (Thousands) Metrorail 66,056 Metrobus 67,271 MetroAccess 634
Outcome: Virginia Annual Ridership (Thousands) Metrorail 65,448 Metrobus 20,809 MetroAccess 314
Page 69 of 89
Washington Metropolitan Area Transit Authority March 2011 22
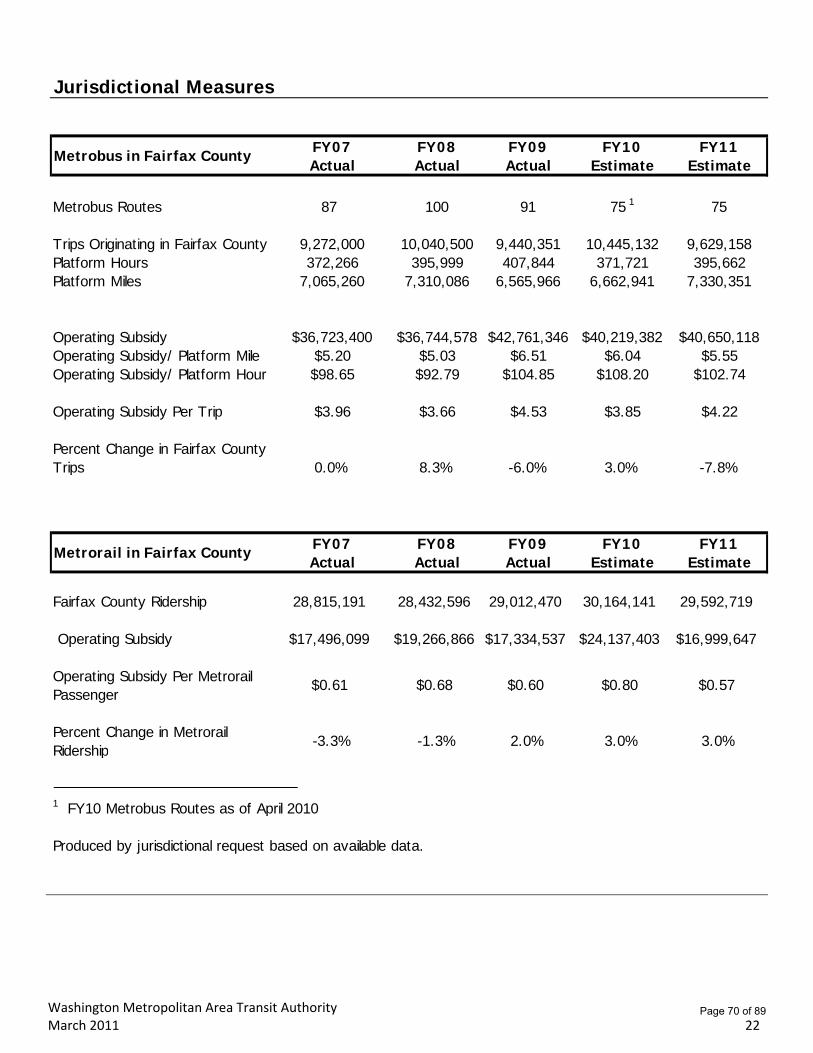
Jurisdictional Measures
FY07 FY08 FY09 FY10 FY11Actual Actual Actual Estimate Estimate
Metrobus Routes 87 100 91 75 1 75
Trips Originating in Fairfax County 9,272,000 10,040,500 9,440,351 10,445,132 9,629,158Platform Hours 372,266 395,999 407,844 371,721 395,662Platform Miles 7,065,260 7,310,086 6,565,966 6,662,941 7,330,351
Operating Subsidy $36,723,400 $36,744,578 $42,761,346 40,219,382$ 40,650,118$ Operating Subsidy/ Platform Mile $5.20 $5.03 $6.51 $6.04 $5.55Operating Subsidy/ Platform Hour $98.65 $92.79 $104.85 $108.20 $102.74
Operating Subsidy Per Trip $3.96 $3.66 $4.53 $3.85 $4.22
Percent Change in Fairfax County Trips 0.0% 8.3% -6.0% 3.0% -7.8%
FY07 FY08 FY09 FY10 FY11Actual Actual Actual Estimate Estimate
Fairfax County Ridership 28,815,191 28,432,596 29,012,470 30,164,141 29,592,719
Operating Subsidy $17,496,099 $19,266,866 $17,334,537 $24,137,403 $16,999,647
Operating Subsidy Per Metrorail Passenger
$0.61 $0.68 $0.60 $0.80 $0.57
Percent Change in Metrorail Ridership
-3.3% -1.3% 2.0% 3.0% 3.0%
1 FY10 Metrobus Routes as of April 2010
Produced by jurisdictional request based on available data.
Metrobus in Fairfax County
Metrorail in Fairfax County
Page 70 of 89
Washington Metropolitan Area Transit Authority March 2011 23
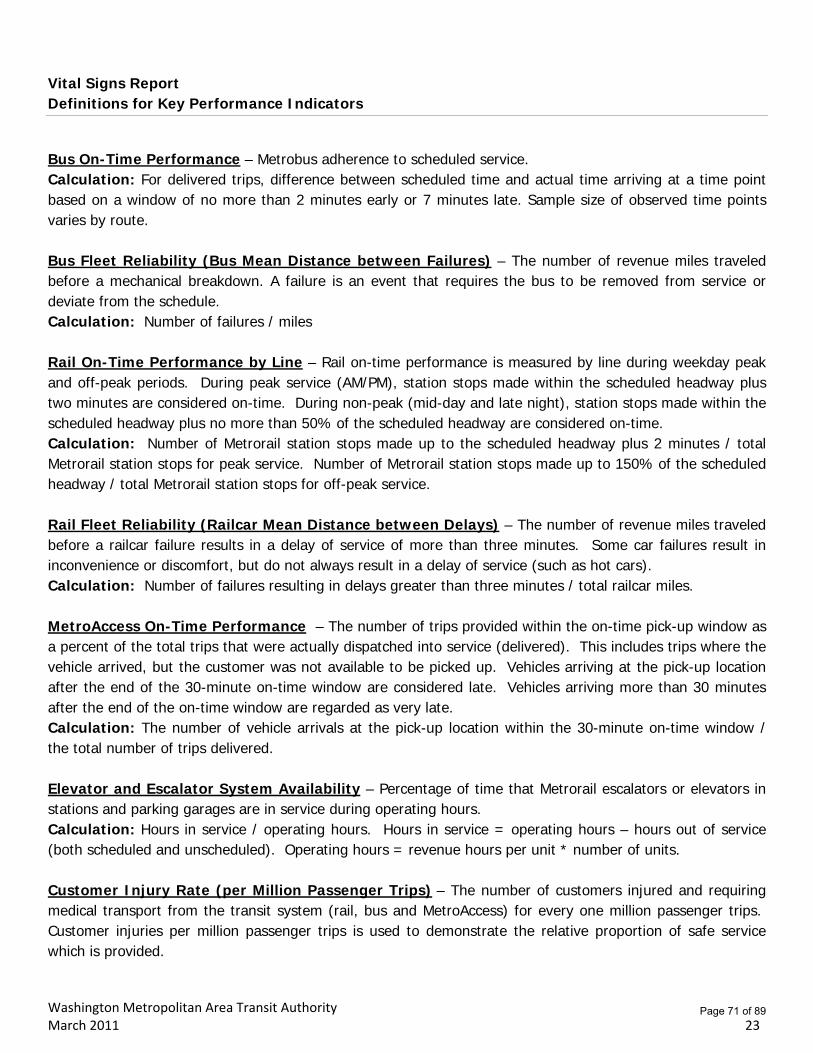
Vital Signs Report Definitions for Key Performance Indicators
Bus On-Time Performance – Metrobus adherence to scheduled service. Calculation: For delivered trips, difference between scheduled time and actual time arriving at a time point based on a window of no more than 2 minutes early or 7 minutes late. Sample size of observed time points varies by route. Bus Fleet Reliability (Bus Mean Distance between Failures) – The number of revenue miles traveled before a mechanical breakdown. A failure is an event that requires the bus to be removed from service or deviate from the schedule. Calculation: Number of failures / miles Rail On-Time Performance by Line – Rail on-time performance is measured by line during weekday peak and off-peak periods. During peak service (AM/PM), station stops made within the scheduled headway plus two minutes are considered on-time. During non-peak (mid-day and late night), station stops made within the scheduled headway plus no more than 50% of the scheduled headway are considered on-time. Calculation: Number of Metrorail station stops made up to the scheduled headway plus 2 minutes / total Metrorail station stops for peak service. Number of Metrorail station stops made up to 150% of the scheduled headway / total Metrorail station stops for off-peak service. Rail Fleet Reliability (Railcar Mean Distance between Delays) – The number of revenue miles traveled before a railcar failure results in a delay of service of more than three minutes. Some car failures result in inconvenience or discomfort, but do not always result in a delay of service (such as hot cars). Calculation: Number of failures resulting in delays greater than three minutes / total railcar miles. MetroAccess On-Time Performance – The number of trips provided within the on-time pick-up window as a percent of the total trips that were actually dispatched into service (delivered). This includes trips where the vehicle arrived, but the customer was not available to be picked up. Vehicles arriving at the pick-up location after the end of the 30-minute on-time window are considered late. Vehicles arriving more than 30 minutes after the end of the on-time window are regarded as very late. Calculation: The number of vehicle arrivals at the pick-up location within the 30-minute on-time window / the total number of trips delivered. Elevator and Escalator System Availability – Percentage of time that Metrorail escalators or elevators in stations and parking garages are in service during operating hours. Calculation: Hours in service / operating hours. Hours in service = operating hours – hours out of service (both scheduled and unscheduled). Operating hours = revenue hours per unit * number of units. Customer Injury Rate (per Million Passenger Trips) – The number of customers injured and requiring medical transport from the transit system (rail, bus and MetroAccess) for every one million passenger trips. Customer injuries per million passenger trips is used to demonstrate the relative proportion of safe service which is provided.
Page 71 of 89
Washington Metropolitan Area Transit Authority March 2011 24
Calculation: Bus passenger injuries, rail passenger injuries, rail facility injuries (including escalator injuries) and MetroAccess injuries / (passenger trips / 1,000,000). Employee Injury Rate (per 200,000 hours) – The number of worker’s compensation claims made by employees per month in relation to total hours worked. Calculation: Number of Worker’s Compensation Claims * 200,000 hours / total hours worked. Crime Rate (per Million Passengers) – Crimes reported to Metro Transit Police Department on bus, rail, or at parking lots, Metro facilities, bus stops and other locations in relation to Metro’s monthly passenger trips. Reported by Metrobus, Metrorail, and Metro parking lots. Calculation: Number of crimes / (passenger trips / 1,000,000) Arrests, Citations and Summonses – The number of arrests and citations/summonses issued by the Metro Transit Police Department. Examples of citations/summonses include minor misdemeanors, fare evasion and public conduct violations. Customer Comment Rate – A complaint is defined as any phone call, e-mail or letter resulting in investigation and response to a customer. This measure includes the subject of fare policy but excludes specific Smartrip matters handled through the regional customer service center. A commendation is any form of complimentary information received regarding the delivery of Metro service. Calculation: Number of complaints or commendations / (passenger trips / 1,000,000)
Page 72 of 89
Washington Metropolitan Area Transit Authority 25
Vital Signs Report Performance Data March 2011
KPI: Bus On-Time Performance / Target = 80%
Jul Aug Sep Oct Nov Dec Jan Feb Mar Apr May JunAvg.
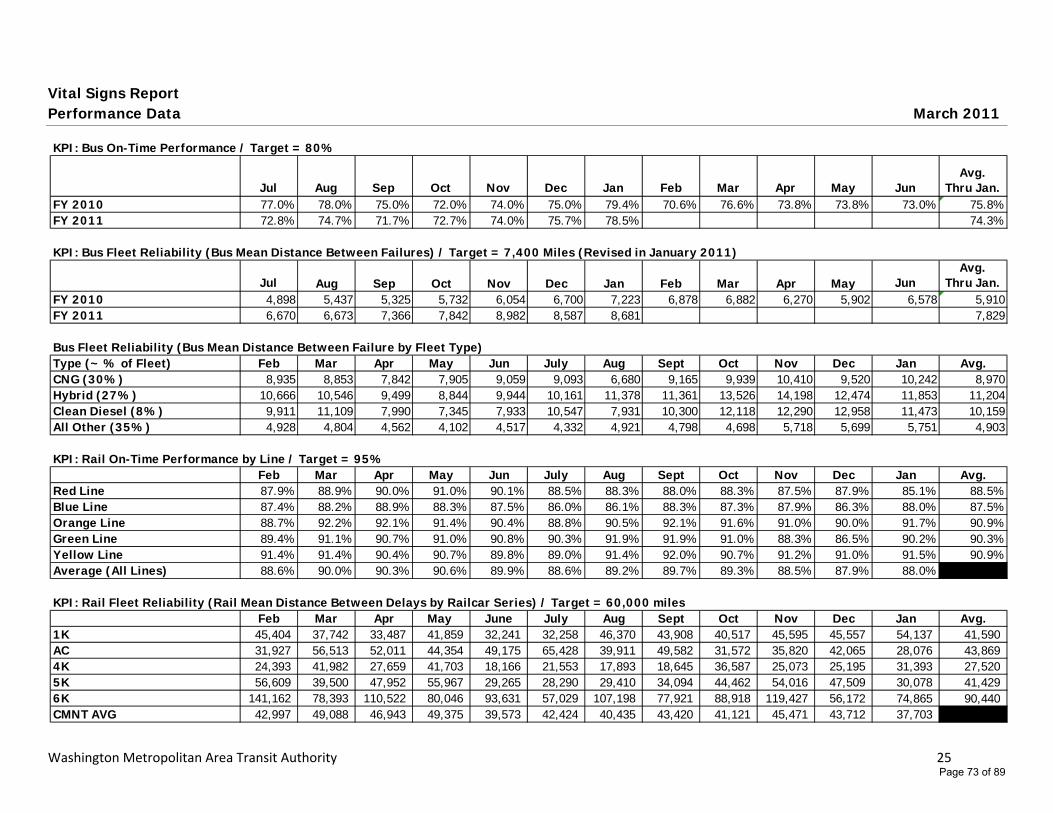
Thru Jan.FY 2010 77.0% 78.0% 75.0% 72.0% 74.0% 75.0% 79.4% 70.6% 76.6% 73.8% 73.8% 73.0% 75.8%FY 2011 72.8% 74.7% 71.7% 72.7% 74.0% 75.7% 78.5% 74.3%
KPI: Bus Fleet Reliability (Bus Mean Distance Between Failures) / Target = 7,400 Miles (Revised in January 2011)
Jul Aug Sep Oct Nov Dec Jan Feb Mar Apr May JunAvg.
Thru Jan.FY 2010 4,898 5,437 5,325 5,732 6,054 6,700 7,223 6,878 6,882 6,270 5,902 6,578 5,910FY 2011 6,670 6,673 7,366 7,842 8,982 8,587 8,681 7,829
Bus Fleet Reliability (Bus Mean Distance Between Failure by Fleet Type)Type (~ % of Fleet) Feb Mar Apr May Jun July Aug Sept Oct Nov Dec Jan Avg.CNG (30%) 8,935 8,853 7,842 7,905 9,059 9,093 6,680 9,165 9,939 10,410 9,520 10,242 8,970Hybrid (27%) 10,666 10,546 9,499 8,844 9,944 10,161 11,378 11,361 13,526 14,198 12,474 11,853 11,204Clean Diesel (8%) 9,911 11,109 7,990 7,345 7,933 10,547 7,931 10,300 12,118 12,290 12,958 11,473 10,159All Other (35%) 4,928 4,804 4,562 4,102 4,517 4,332 4,921 4,798 4,698 5,718 5,699 5,751 4,903
KPI: Rail On-Time Performance by Line / Target = 95%Feb Mar Apr May Jun July Aug Sept Oct Nov Dec Jan Avg.
Red Line 87.9% 88.9% 90.0% 91.0% 90.1% 88.5% 88.3% 88.0% 88.3% 87.5% 87.9% 85.1% 88.5%Blue Line 87.4% 88.2% 88.9% 88.3% 87.5% 86.0% 86.1% 88.3% 87.3% 87.9% 86.3% 88.0% 87.5%Orange Line 88.7% 92.2% 92.1% 91.4% 90.4% 88.8% 90.5% 92.1% 91.6% 91.0% 90.0% 91.7% 90.9%Green Line 89.4% 91.1% 90.7% 91.0% 90.8% 90.3% 91.9% 91.9% 91.0% 88.3% 86.5% 90.2% 90.3%Yellow Line 91.4% 91.4% 90.4% 90.7% 89.8% 89.0% 91.4% 92.0% 90.7% 91.2% 91.0% 91.5% 90.9%Average (All Lines) 88.6% 90.0% 90.3% 90.6% 89.9% 88.6% 89.2% 89.7% 89.3% 88.5% 87.9% 88.0% 89.2%
KPI: Rail Fleet Reliability (Rail Mean Distance Between Delays by Railcar Series) / Target = 60,000 milesFeb Mar Apr May June July Aug Sept Oct Nov Dec Jan Avg.
1K 45,404 37,742 33,487 41,859 32,241 32,258 46,370 43,908 40,517 45,595 45,557 54,137 41,590 AC 31,927 56,513 52,011 44,354 49,175 65,428 39,911 49,582 31,572 35,820 42,065 28,076 43,869 4K 24,393 41,982 27,659 41,703 18,166 21,553 17,893 18,645 36,587 25,073 25,195 31,393 27,520 5K 56,609 39,500 47,952 55,967 29,265 28,290 29,410 34,094 44,462 54,016 47,509 30,078 41,429 6K 141,162 78,393 110,522 80,046 93,631 57,029 107,198 77,921 88,918 119,427 56,172 74,865 90,440 CMNT AVG 42,997 49,088 46,943 49,375 39,573 42,424 40,435 43,420 41,121 45,471 43,712 37,703 43,522
Page 73 of 89
Washington Metropolitan Area Transit Authority 26
Vital Signs Report Performance Data (cont.) March 2011
KPI: MetroAccess On-Time Performance / Target = 92%
Jul Aug Sep Oct Nov Dec Jan Feb Mar Apr May JunAvg.
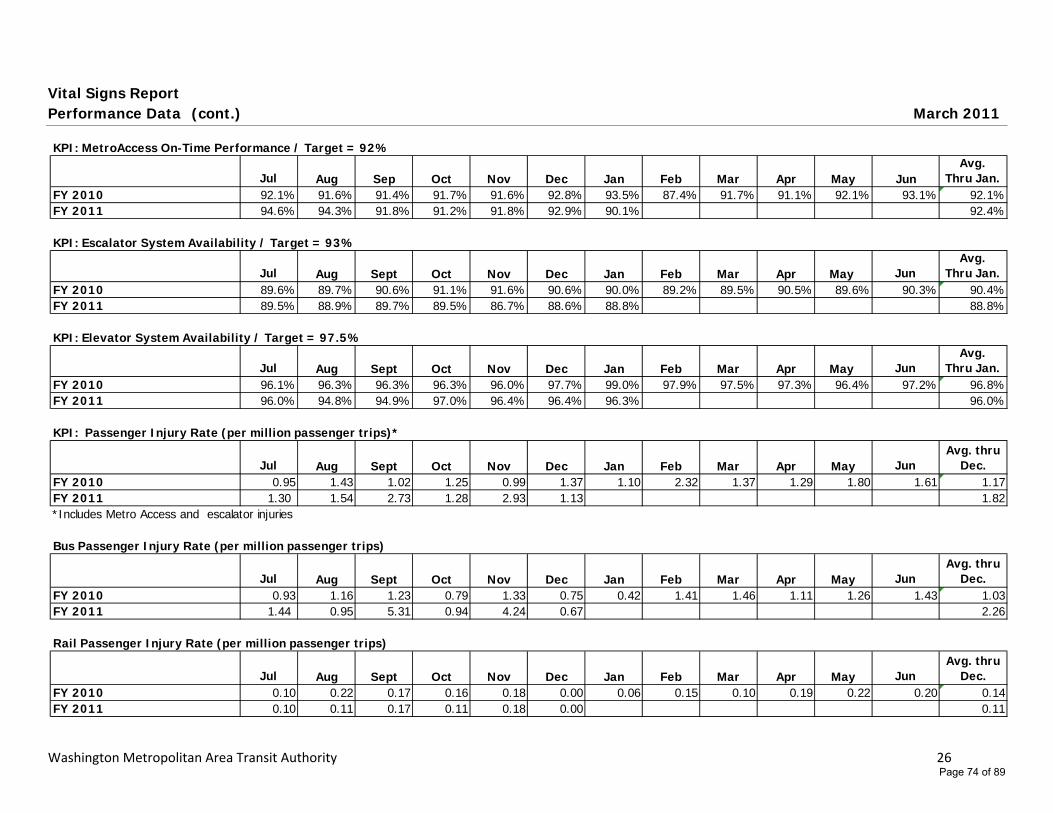
Thru Jan.FY 2010 92.1% 91.6% 91.4% 91.7% 91.6% 92.8% 93.5% 87.4% 91.7% 91.1% 92.1% 93.1% 92.1%FY 2011 94.6% 94.3% 91.8% 91.2% 91.8% 92.9% 90.1% 92.4%
KPI: Escalator System Availability / Target = 93%
Jul Aug Sept Oct Nov Dec Jan Feb Mar Apr May JunAvg.
Thru Jan.FY 2010 89.6% 89.7% 90.6% 91.1% 91.6% 90.6% 90.0% 89.2% 89.5% 90.5% 89.6% 90.3% 90.4%FY 2011 89.5% 88.9% 89.7% 89.5% 86.7% 88.6% 88.8% 88.8%
KPI: Elevator System Availability / Target = 97.5%
Jul Aug Sept Oct Nov Dec Jan Feb Mar Apr May JunAvg.
Thru Jan.FY 2010 96.1% 96.3% 96.3% 96.3% 96.0% 97.7% 99.0% 97.9% 97.5% 97.3% 96.4% 97.2% 96.8%FY 2011 96.0% 94.8% 94.9% 97.0% 96.4% 96.4% 96.3% 96.0%
KPI: Passenger Injury Rate (per million passenger trips)*
Jul Aug Sept Oct Nov Dec Jan Feb Mar Apr May JunAvg. thru
Dec.FY 2010 0.95 1.43 1.02 1.25 0.99 1.37 1.10 2.32 1.37 1.29 1.80 1.61 1.17FY 2011 1.30 1.54 2.73 1.28 2.93 1.13 1.82*Includes Metro Access and escalator injuries
Bus Passenger Injury Rate (per million passenger trips)
Jul Aug Sept Oct Nov Dec Jan Feb Mar Apr May JunAvg. thru
Dec.FY 2010 0.93 1.16 1.23 0.79 1.33 0.75 0.42 1.41 1.46 1.11 1.26 1.43 1.03FY 2011 1.44 0.95 5.31 0.94 4.24 0.67 2.26
Rail Passenger Injury Rate (per million passenger trips)
Jul Aug Sept Oct Nov Dec Jan Feb Mar Apr May JunAvg. thru
Dec.FY 2010 0.10 0.22 0.17 0.16 0.18 0.00 0.06 0.15 0.10 0.19 0.22 0.20 0.14FY 2011 0.10 0.11 0.17 0.11 0.18 0.00 0.11
Page 74 of 89
Washington Metropolitan Area Transit Authority 27
Vital Signs Report Performance Data (cont.) March 2011
Rail Transit Facilities Occupant Injury Rate (per million passenger trips)*
Jul Aug Sept Oct Nov Dec Jan Feb Mar Apr May JunAvg. thru
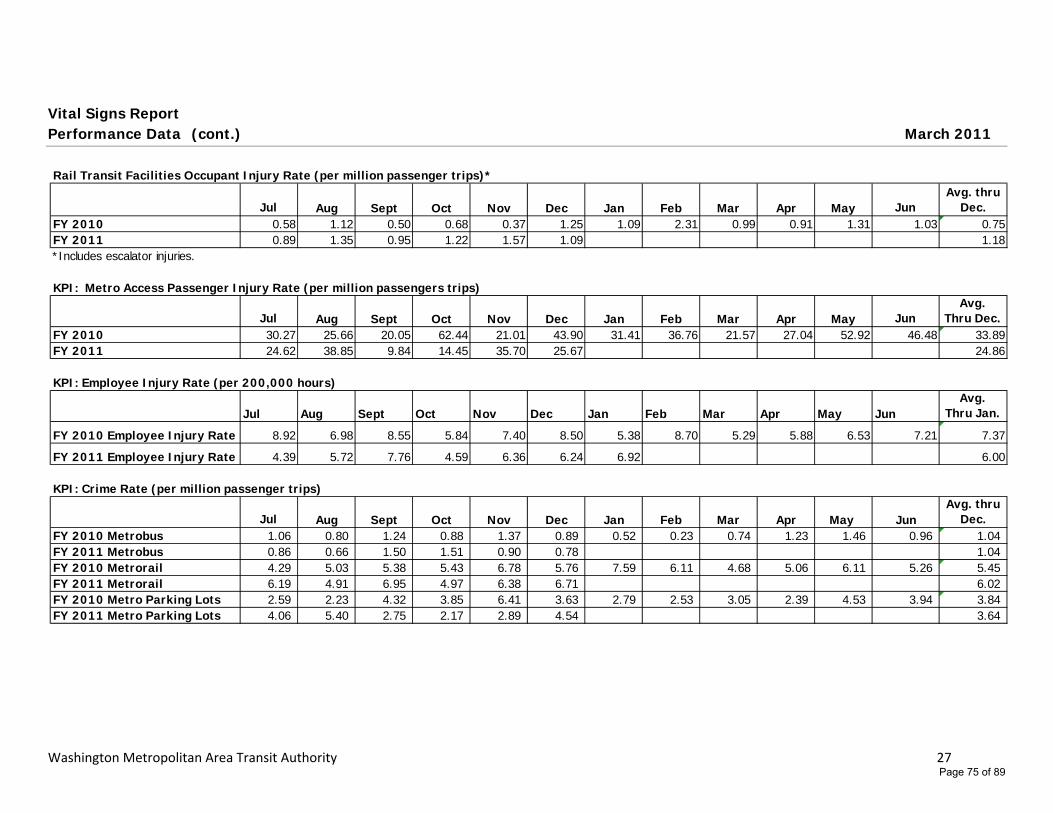
Dec.FY 2010 0.58 1.12 0.50 0.68 0.37 1.25 1.09 2.31 0.99 0.91 1.31 1.03 0.75FY 2011 0.89 1.35 0.95 1.22 1.57 1.09 1.18*Includes escalator injuries.
KPI: Metro Access Passenger Injury Rate (per million passengers trips)
Jul Aug Sept Oct Nov Dec Jan Feb Mar Apr May JunAvg.
Thru Dec.FY 2010 30.27 25.66 20.05 62.44 21.01 43.90 31.41 36.76 21.57 27.04 52.92 46.48 33.89FY 2011 24.62 38.85 9.84 14.45 35.70 25.67 24.86
KPI: Employee Injury Rate (per 200,000 hours)
Jul Aug Sept Oct Nov Dec Jan Feb Mar Apr May JunAvg.
Thru Jan.
FY 2010 Employee Injury Rate 8.92 6.98 8.55 5.84 7.40 8.50 5.38 8.70 5.29 5.88 6.53 7.21 7.37
FY 2011 Employee Injury Rate 4.39 5.72 7.76 4.59 6.36 6.24 6.92 6.00
KPI: Crime Rate (per million passenger trips)
Jul Aug Sept Oct Nov Dec Jan Feb Mar Apr May JunAvg. thru
Dec.FY 2010 Metrobus 1.06 0.80 1.24 0.88 1.37 0.89 0.52 0.23 0.74 1.23 1.46 0.96 1.04 FY 2011 Metrobus 0.86 0.66 1.50 1.51 0.90 0.78 1.04 FY 2010 Metrorail 4.29 5.03 5.38 5.43 6.78 5.76 7.59 6.11 4.68 5.06 6.11 5.26 5.45 FY 2011 Metrorail 6.19 4.91 6.95 4.97 6.38 6.71 6.02 FY 2010 Metro Parking Lots 2.59 2.23 4.32 3.85 6.41 3.63 2.79 2.53 3.05 2.39 4.53 3.94 3.84 FY 2011 Metro Parking Lots 4.06 5.40 2.75 2.17 2.89 4.54 3.64
Page 75 of 89
Washington Metropolitan Area Transit Authority 28
Vital Signs Report Performance Data (cont.) March 2011
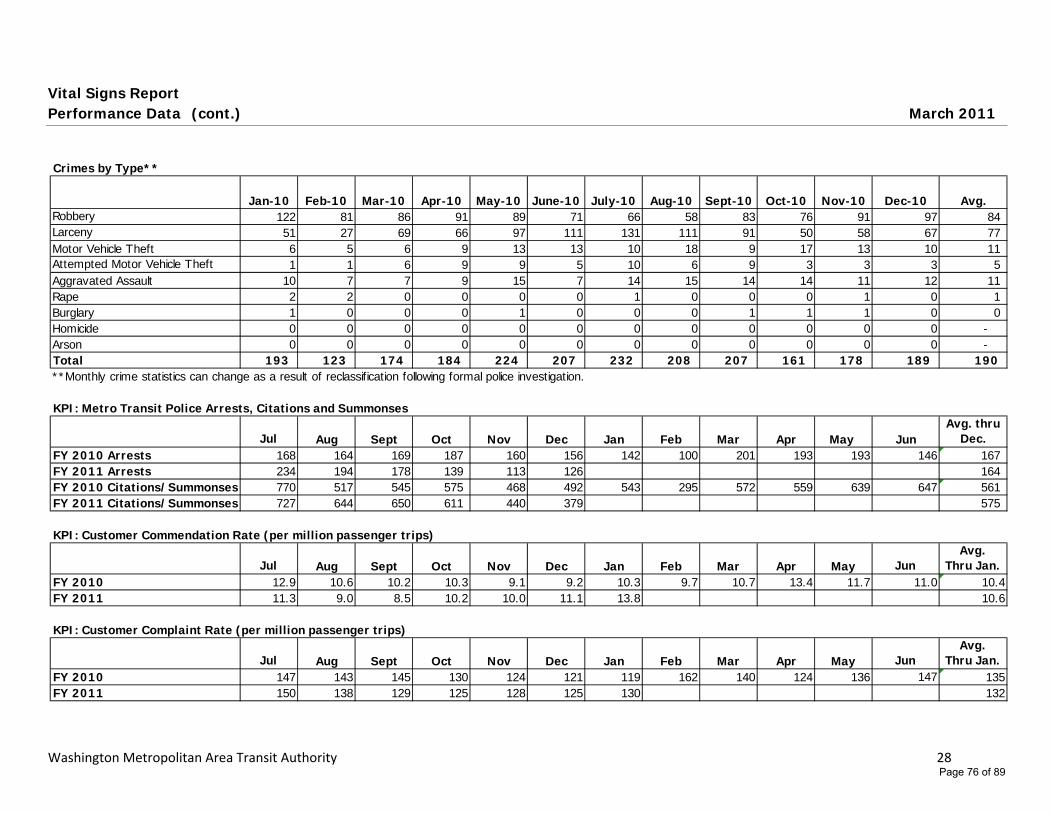
Crimes by Type**
Jan-10 Feb-10 Mar-10 Apr-10 May-10 June-10 July-10 Aug-10 Sept-10 Oct-10 Nov-10 Dec-10 Avg.Robbery 122 81 86 91 89 71 66 58 83 76 91 97 84 Larceny 51 27 69 66 97 111 131 111 91 50 58 67 77 Motor Vehicle Theft 6 5 6 9 13 13 10 18 9 17 13 10 11 Attempted Motor Vehicle Theft 1 1 6 9 9 5 10 6 9 3 3 3 5 Aggravated Assault 10 7 7 9 15 7 14 15 14 14 11 12 11 Rape 2 2 0 0 0 0 1 0 0 0 1 0 1 Burglary 1 0 0 0 1 0 0 0 1 1 1 0 0 Homicide 0 0 0 0 0 0 0 0 0 0 0 0 - Arson 0 0 0 0 0 0 0 0 0 0 0 0 - Total 193 123 174 184 224 207 232 208 207 161 178 189 190 **Monthly crime statistics can change as a result of reclassification following formal police investigation.
KPI: Metro Transit Police Arrests, Citations and Summonses
Jul Aug Sept Oct Nov Dec Jan Feb Mar Apr May JunAvg. thru
Dec.FY 2010 Arrests 168 164 169 187 160 156 142 100 201 193 193 146 167 FY 2011 Arrests 234 194 178 139 113 126 164 FY 2010 Citations/Summonses 770 517 545 575 468 492 543 295 572 559 639 647 561 FY 2011 Citations/Summonses 727 644 650 611 440 379 575
KPI: Customer Commendation Rate (per million passenger trips)
Jul Aug Sept Oct Nov Dec Jan Feb Mar Apr May JunAvg.
Thru Jan.FY 2010 12.9 10.6 10.2 10.3 9.1 9.2 10.3 9.7 10.7 13.4 11.7 11.0 10.4FY 2011 11.3 9.0 8.5 10.2 10.0 11.1 13.8 10.6
KPI: Customer Complaint Rate (per million passenger trips)
Jul Aug Sept Oct Nov Dec Jan Feb Mar Apr May JunAvg.
Thru Jan.FY 2010 147 143 145 130 124 121 119 162 140 124 136 147 135FY 2011 150 138 129 125 128 125 130 132
Page 76 of 89
Washington Metropolitan Area Transit Authority 29
Vital Signs Report Performance Data (cont.) March 2011
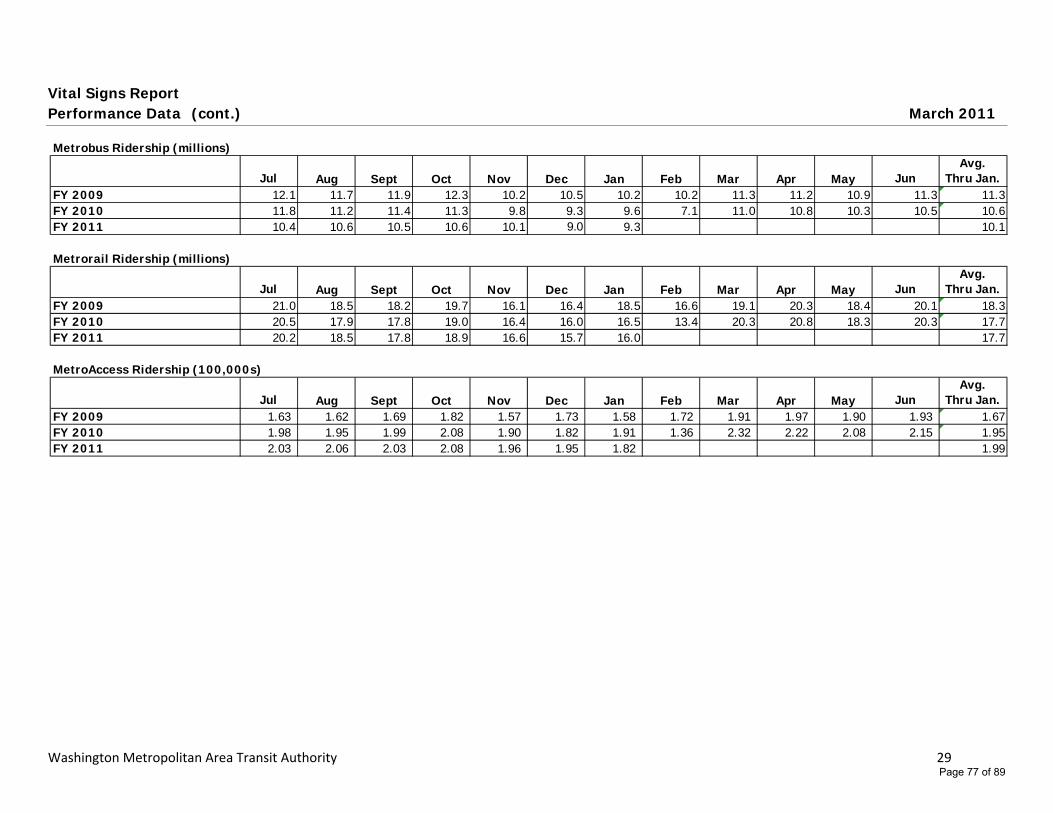
Metrobus Ridership (millions)
Jul Aug Sept Oct Nov Dec Jan Feb Mar Apr May JunAvg.
Thru Jan.FY 2009 12.1 11.7 11.9 12.3 10.2 10.5 10.2 10.2 11.3 11.2 10.9 11.3 11.3FY 2010 11.8 11.2 11.4 11.3 9.8 9.3 9.6 7.1 11.0 10.8 10.3 10.5 10.6FY 2011 10.4 10.6 10.5 10.6 10.1 9.0 9.3 10.1
Metrorail Ridership (millions)
Jul Aug Sept Oct Nov Dec Jan Feb Mar Apr May JunAvg.
Thru Jan.FY 2009 21.0 18.5 18.2 19.7 16.1 16.4 18.5 16.6 19.1 20.3 18.4 20.1 18.3FY 2010 20.5 17.9 17.8 19.0 16.4 16.0 16.5 13.4 20.3 20.8 18.3 20.3 17.7FY 2011 20.2 18.5 17.8 18.9 16.6 15.7 16.0 17.7
MetroAccess Ridership (100,000s)
Jul Aug Sept Oct Nov Dec Jan Feb Mar Apr May JunAvg.
Thru Jan.FY 2009 1.63 1.62 1.69 1.82 1.57 1.73 1.58 1.72 1.91 1.97 1.90 1.93 1.67FY 2010 1.98 1.95 1.99 2.08 1.90 1.82 1.91 1.36 2.32 2.22 2.08 2.15 1.95FY 2011 2.03 2.06 2.03 2.08 1.96 1.95 1.82 1.99
Page 77 of 89