vital statistics of india based on the civil … · based on the civil registration system 2012...
TRANSCRIPT

VITAL STATISTICS OF INDIA
BASED ON THE
CIVIL REGISTRATION
SYSTEM
2012
OFFICE OF THE REGISTRAR GENERAL, INDIA
MINISTRY OF HOME AFFAIRS
VITAL STATISTICS DIVISION
WEST BLOCK-I, R. K. PURAM
NEW DELHI- 110066
ENSURE REGISTRATION OF EVERY BIRTH AND DEATH

PREFACE
The Civil Registration System (CRS) may be defined as a unified process of
continuous, permanent and compulsory recording of the vital events and characteristics
thereof, as per legal requirements in the country. In India, the Civil Registration System
covers registration of births and deaths only. It provides the best source of information
on the vital rates at all levels.
2. This issue of the Report on ‘Vital Statistics of India based on the Civil Registration
System’ for the year 2012 provides an overview of the working of the Civil Registration
System (CRS) in the country and presents a compilation of data on registered births,
deaths and infant deaths with rural-urban & sex-wise break-up and sex ratio at birth
based on Civil Registration Records. Ideally, an Annual Report on vital statistics
containing more detailed information should have been brought out. However, due to
non-availability of Annual Reports from some of the major States and limited
availability of information contained in the Annual Reports of some of other States, the
report for the year 2012 containing key information has been brought out for the
convenience of users. An attempt has been made to present more detailed analysis as
compared to previous Reports.
3. The publication is divided into two parts. Part I provides a brief review of the
Civil Registration System and contains a summary analysis of data on registered births,
deaths, infant deaths and sex ratio at birth at State level. Part II consist of the main
tables which provide State and District-wise data on registered births, deaths, infant
deaths and still births with rural-urban & sex-wise break-up and sex ratio at birth.
4. The data source for the report is the statutory Annual Statistical Report prepared
by the Chief Registrars of Births & Deaths. In respect of States where these reports have
not been prepared, the information provided by the Chief Registrars has been used. I
take this opportunity to express my sincere gratitude to all the Chief Registrars of Births
& Deaths of various States/UTs for their kind co-operation in providing the requisite
information.
5. The report has been prepared by the Vital Statistics Division of this office. I
would like to place on record my appreciation for the efforts put in by Smt. P. A. Mini
and Shri R. K. Gautam, Deputy Registrar Generals, Shri Ajay Khanna, Deputy Director,
Shri Sandeep Rai, Assistant Director and Shri Vimal Kaul, Sr. Compiler under the overall
guidance of Shri Deepak Rastogi, Additional Registrar General, India.
Dr. C. Chandramouli
New Delhi Registrar General
March, 2015 & Census Commissioner, India

Page No.
Map 1 Level of Registration of Births, 2012 v
Map 2 Level of Registration of Deaths, 2012 vi
Map 3 Sex Ratio at Birth, 2012 vii
Overview of Civil Registration System viii-ix
Executive Summary x-xi
Glossary of Terms xii
Chapter I Civil Registration System - An Introduction 5 - 7
Chapter II Annual Report on the working of the RBDAct for the year 2012 8 - 18
Chapter III A Brief Analysis of Data on registered Births, Deaths and Infant Deaths 19 - 45
Statement 1 Civil Registration System - At a Glance 3
Statement 2 Estimated events and Level of Registration by India, States 2012 4
Statement 3 Penalties imposed on registration functionaries 7
Statement 4 Details of inspections undertaken 11-12
Statement 5 Details of issuance of birth/death certificates 18
Statement 6 Number of registration units and level of reporting by place, India, States and Uts, 2012 20
Statement 7 Number of registered births and deaths at the national level, 1981 – 2012 21
Statement 8 Number of registered births by States/ Union Territories, 2003-2012 23
Statement 9 Number of registered deaths by States/ Union Territories, 2003-2012 24
Statement 10 Number of registered infant deaths by States/ Union Territories, 2003-2012 25
Statement 11 Sex-wise Registered Births and Deaths of Major States (in '000), 2012 27
Statement 12 Total Registered and Estimated Births & Deaths of Major States, 2012 29
Statement 13 Percentage distribution of registered infant deaths by place of occurrence, 2012 32
Statement 14 Percentage distribution of infant deaths by sex, 2012 32
Statement 15 33
Statement 16 Level of Registration of Births, 2003-2012 34-35
Statement 17 Level of Registration of Deaths, 2003-2012 37
Statement 18 Major States (Population above 10 million as per 2011 Census) classified by their level of 38
registration, 2011 and 2012
Statement 19 Sex Ratio at Birth based on registered events, 2003-2012 42
Statement 20 Registered Births & Deaths of Indian Nationals in Indian Missions/Post abroad 44-45
Chart 1 Number of Registered Live Births, 1981-2012 22
Chart 2 Number of Registered Deaths, 1981-2012 22
Chart 3 Sex-wise Distribution of Registered Births, 2012 26
Chart 4 Sex-wise Distribution of Registered Deaths, 2012 26
Chart 5 Sex-wise Registered Births of Major States, 2012 27
Chart 6 Sex-wise Registered Deaths of Major States, 2012 28
Chart 7 Estimated & Registered Births, 2003-2012 28
Chart 8 Estimated & Registered Deaths, 2003-2012 29
Chart 9 Total Registered & Estimated Births of Major States, 2012 30
Chart 10 Total Registered & Estimated Deaths of Major States, 2012 30
Chart 11 Live Birth by medical attention at birth 31
Chart 12 Medical Attention at the time of Death 31
Chart 13 Level of Registration of Births and Deaths, 2003-2012 34
Chart 14 Level of Registration of Births of States/UTs, 2012 35
Chart 15 Level of Registration of Deaths of States/UTs, 2012 36
Chart 16 Level of Registration of Births and Deaths , 2012 39
Chart 17 Level of Registration excluding Uttar Pradesh and Bihar, 2003-2012 40
Chart 18 LOR of births for EAG & Assam, Southern and Other States/UTs, 2003-2012 41
Chart 19 LOR of deaths for EAG & Assam, Southern and Other States/UTs, 2003-2012 41
CONTENTS
Part I - Review and Analysis
List of Statements
List of Charts
Still Births registered during 2012

Chart 20 Sex Ratio based on Registered Births, 2012 43
Chart 21 Sex Ratio at Births based on CRS and SRS, 2002-2011 43
Table 1 Number of live births registered by sex and residence, 2012 48
Table 2 Number of deaths registered by sex and residence, 2012 49
Table 3 Number of infant deaths registered by sex and residence, 2012 50
Table 4 51
Table 5 Level of Registration of births and deaths - States / Union Territories, 2012 52
Table 6 Death by Age and Sex of the deceased, 2012 53-58
Table 7 Number of live births registered - States/Union Territories/Districts, 2012 59-70
Table 8 Number of deaths registered - States/Union Territories/Districts, 2012 71-83
Table 9 Number of infant deaths registered - States/Union Territories/Districts, 2012 84-95
Table 10 Number of still births registered - States/Union Territories/Districts, 2012 96-105
Table 11 Districtwise birth and death rates, 2012 106-113
Civil Registration Hierarchy in States and Union Territories 116-121
Annexure
Part II - List of Detailed Tables
Number of still births registered by sex and residence, 2012

v

vi

vii

viii
Overview of Civil Registration System (CRS)
1. Registration of birth is a right of the child and is the first step towards establishing
their identity.
2. It is compulsory to report births and deaths to the Registrar of Births and Deaths
under the Registration of Births and Deaths Act, 1969.
3. Births and Deaths are registered only at the place of their occurrence.
4. Head of the household is responsible to report births and deaths that occurred in
the house to the Registrar of Births and Deaths.
5. It is the responsibility of the officer in charge to report the births and deaths that
occur in hospitals, nursing homes, health centres, etc. to the Registrar of Births and
Deaths of the concerned area.
6. For reporting of events, prescribed forms are used, Form 1 for live birth, Form 2 for
death and Form 3 for still birth.
7. Midwives and other Medical and Para-medical persons who have attended a birth of
a child are duty bound to notify the Registrar about the occurrence of the birth.
8. Keepers of crematoria and burial grounds, and persons required to be present at
such places by a local authority are required to notify the Registrar about the
occurrence of the death.
9. The Registrar of Births and Deaths have the power to obtain information regarding
birth/death from those who are in the knowledge.
10. Births and deaths are to be reported within 21 days of occurrence of the event.
11. A Birth/Death certificate is to be issued free of charge for events reported within 21
days.
12. Births and deaths reported after 21 days but within 30 days can be registered on
payment of prescribed late fee.
13. Births and death reported after 30 days but within one year can be registered on
production of an affidavit, permission of the prescribed authority and payment of a
late fee.
14. Births and deaths reported after one year can be registered only with the
permission of a First Class Magistrate and payment of prescribed late fee.
15. Births can be registered without name of the child.
ix
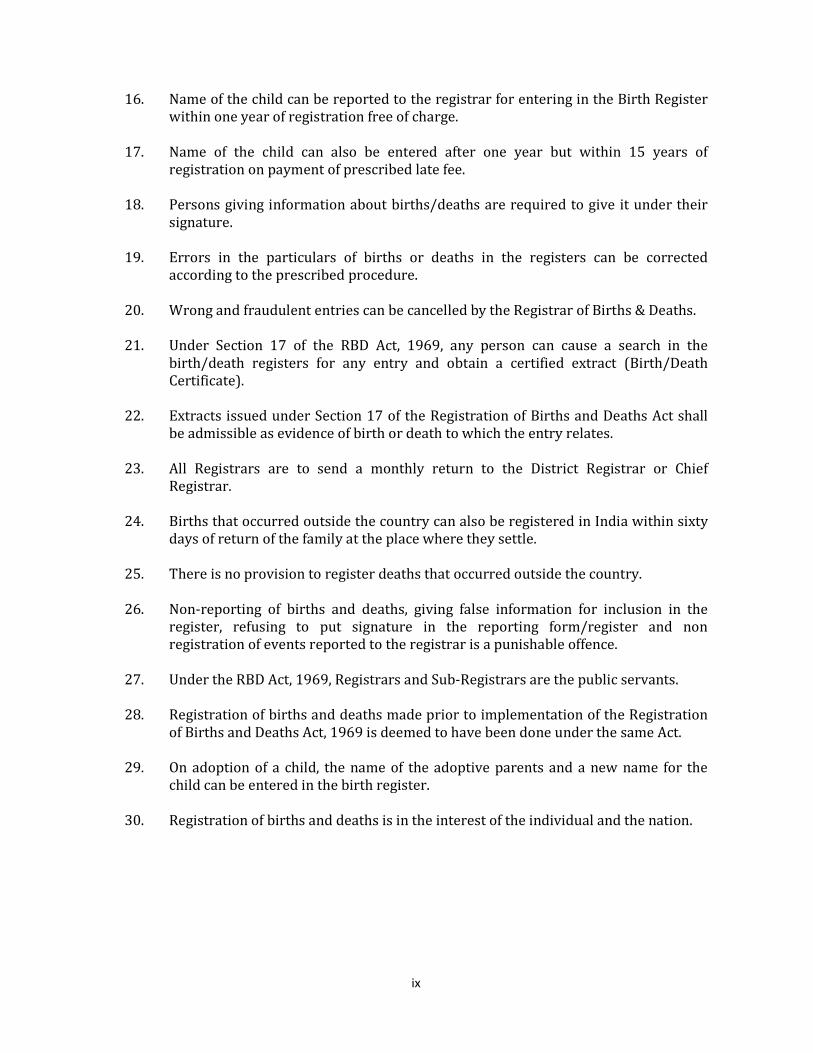
16. Name of the child can be reported to the registrar for entering in the Birth Register
within one year of registration free of charge.
17. Name of the child can also be entered after one year but within 15 years of
registration on payment of prescribed late fee.
18. Persons giving information about births/deaths are required to give it under their
signature.
19. Errors in the particulars of births or deaths in the registers can be corrected
according to the prescribed procedure.
20. Wrong and fraudulent entries can be cancelled by the Registrar of Births & Deaths.
21. Under Section 17 of the RBD Act, 1969, any person can cause a search in the
birth/death registers for any entry and obtain a certified extract (Birth/Death
Certificate).
22. Extracts issued under Section 17 of the Registration of Births and Deaths Act shall
be admissible as evidence of birth or death to which the entry relates.
23. All Registrars are to send a monthly return to the District Registrar or Chief
Registrar.
24. Births that occurred outside the country can also be registered in India within sixty
days of return of the family at the place where they settle.
25. There is no provision to register deaths that occurred outside the country.
26. Non-reporting of births and deaths, giving false information for inclusion in the
register, refusing to put signature in the reporting form/register and non
registration of events reported to the registrar is a punishable offence.
27. Under the RBD Act, 1969, Registrars and Sub-Registrars are the public servants.
28. Registration of births and deaths made prior to implementation of the Registration
of Births and Deaths Act, 1969 is deemed to have been done under the same Act.
29. On adoption of a child, the name of the adoptive parents and a new name for the
child can be entered in the birth register.
30. Registration of births and deaths is in the interest of the individual and the nation.

x
EXECUTIVE SUMMARY
A unified process of continuous, permanent and compulsory recording of the vital
events and characteristics thereof, as provided through the legal requirements of the country,
is called Civil Registration System (CRS). In India, the Registration of Births and Deaths Act,
1969, provides for the compulsory registration of births and deaths. Civil Registration records
are the best source of Vital Statistics. The records resulting from Civil Registration System
have two main uses. First, as a personal legal document, required by citizens as proof of facts
e.g. age, identity etc and second, the data generated through a complete and up to date System
of Civil Registration are essential for socio-economic planning and also to evaluate the
effectiveness of various public’s related programs. They also serve as the cornerstone of
public health systems. This Annual Statistical Report on Vital Statistics of India for the year
2012 has been brought out on the basis of data made available by the Chief Executive
Authorities i.e. Chief Registrar of Births and Deaths of States/Union Territories. The main
findings of the report have been summarized below:
VITAL INDICATORS: Notwithstanding the difference in approach of data collection between
CRS and Sample Registration System (SRS), a comparison of vital rates based on these two
sources helps in evaluating the performance of CRS over SRS. Level of reporting helps in
reviewing the registration system and defining measures that would be necessary to improve
registration levels across the country. The level of reporting is around 95.2% at National level
during 2012 as compared to 92.5% in 2012. Such reporting level by rural and urban
registration units are about 95.2% and 97.5% respectively.
Birth Registration:
• The number of reported registered births has reached to 21.9 million in 2012 as
compared to 8.6 million in 1981.
• The share of registered births to total estimated births under SRS is increasing year by
year which in result shows the significant improvement in birth registration.
• The share of male registration (52%) is more than the female (48%) for registered
births during 2012.
• Share of Institutional births in total registered births 68.4% during 2012. It is based on
information received from 22 States/UTs.
• The level of registration of births has increased from 57.7 per cent in 2003 to 84.4 per
cent in 2012.
• 17 States/UTs have achieved the target of cent per cent level of registration of births
during 2012.
• 10 among 19 major States have crossed the level of registration of births of 90 percent.
These States are Gujarat, Haryana, Karnataka, Kerala, Maharashtra, Odisha, Punjab,
Rajasthan, Tamil Nadu and West Bengal.
• After excluding 2 most populous and poor performing States namely Bihar and Uttar
Pradesh, the level of registration of births comes out to be 94.8%.
• The level of registration of births for other States/UTs is higher than that of Southern
as well as EAG States& Assam persistently over the period of 2003-2012.
• The Sex Ratio at Birth for the year 2012 comes out to be 908.
xi
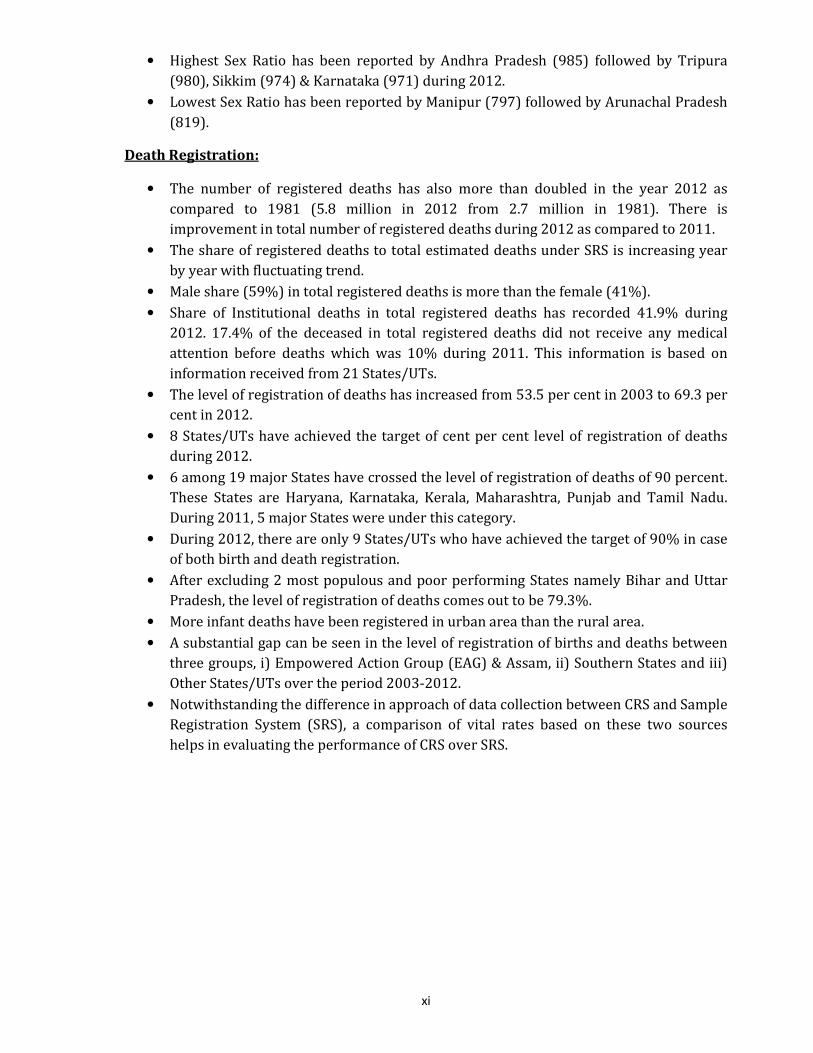
• Highest Sex Ratio has been reported by Andhra Pradesh (985) followed by Tripura
(980), Sikkim (974) & Karnataka (971) during 2012.
• Lowest Sex Ratio has been reported by Manipur (797) followed by Arunachal Pradesh
(819).
Death Registration:
• The number of registered deaths has also more than doubled in the year 2012 as
compared to 1981 (5.8 million in 2012 from 2.7 million in 1981). There is
improvement in total number of registered deaths during 2012 as compared to 2011.
• The share of registered deaths to total estimated deaths under SRS is increasing year
by year with fluctuating trend.
• Male share (59%) in total registered deaths is more than the female (41%).
• Share of Institutional deaths in total registered deaths has recorded 41.9% during
2012. 17.4% of the deceased in total registered deaths did not receive any medical
attention before deaths which was 10% during 2011. This information is based on
information received from 21 States/UTs.
• The level of registration of deaths has increased from 53.5 per cent in 2003 to 69.3 per
cent in 2012.
• 8 States/UTs have achieved the target of cent per cent level of registration of deaths
during 2012.
• 6 among 19 major States have crossed the level of registration of deaths of 90 percent.
These States are Haryana, Karnataka, Kerala, Maharashtra, Punjab and Tamil Nadu.
During 2011, 5 major States were under this category.
• During 2012, there are only 9 States/UTs who have achieved the target of 90% in case
of both birth and death registration.
• After excluding 2 most populous and poor performing States namely Bihar and Uttar
Pradesh, the level of registration of deaths comes out to be 79.3%.
• More infant deaths have been registered in urban area than the rural area.
• A substantial gap can be seen in the level of registration of births and deaths between
three groups, i) Empowered Action Group (EAG) & Assam, ii) Southern States and iii)
Other States/UTs over the period 2003-2012.
• Notwithstanding the difference in approach of data collection between CRS and Sample
Registration System (SRS), a comparison of vital rates based on these two sources
helps in evaluating the performance of CRS over SRS.
xii
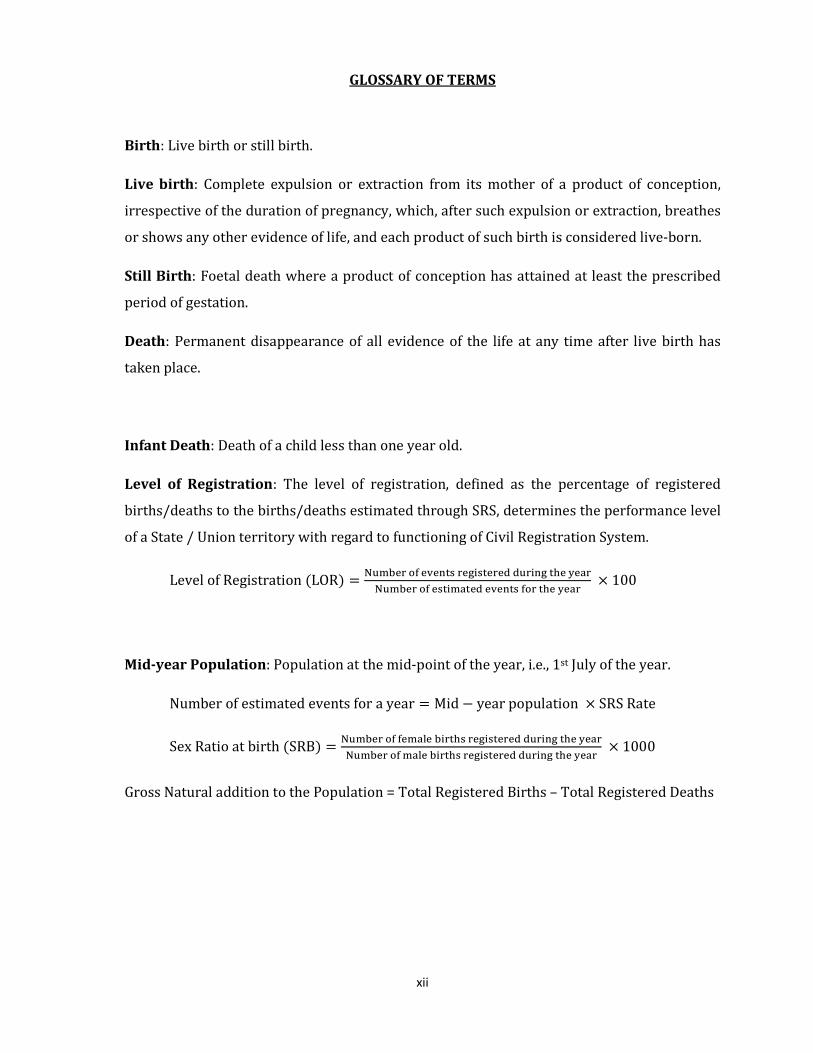
GLOSSARY OF TERMS
Birth: Live birth or still birth.
Live birth: Complete expulsion or extraction from its mother of a product of conception,
irrespective of the duration of pregnancy, which, after such expulsion or extraction, breathes
or shows any other evidence of life, and each product of such birth is considered live-born.
Still Birth: Foetal death where a product of conception has attained at least the prescribed
period of gestation.
Death: Permanent disappearance of all evidence of the life at any time after live birth has
taken place.
Infant Death: Death of a child less than one year old.
Level of Registration: The level of registration, defined as the percentage of registered
births/deaths to the births/deaths estimated through SRS, determines the performance level
of a State / Union territory with regard to functioning of Civil Registration System.
LevelofRegistration(LOR) =���������������� !�����""��!� �#�$�%�
�����������!�%��"����������#�$�%�× 100
Mid-year Population: Population at the mid-point of the year, i.e., 1st July of the year.
Numberofestimatedeventsforayear = Mid − yearpopulation × SRSRate
SexRatioatbirth(SRB) =�����������%6��!��#��� !�����""��!� �#�$�%�
���������%6��!��#��� !�����""��!� �#�$�%�× 1000
Gross Natural addition to the Population = Total Registered Births – Total Registered Deaths

PART-I
REVIEW AND ANALYSIS
1
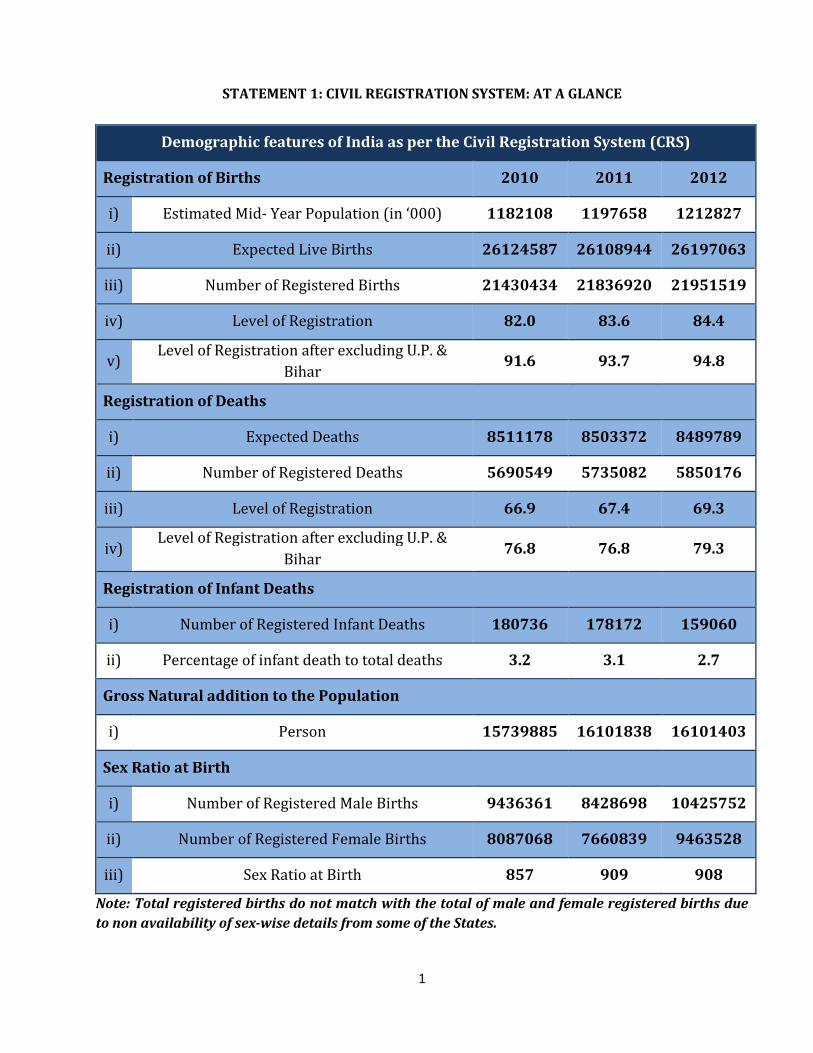
STATEMENT 1: CIVIL REGISTRATION SYSTEM: AT A GLANCE
Note: Total registered births do not match with the total of male and female registered births due
to non availability of sex-wise details from some of the States.
Demographic features of India as per the Civil Registration System (CRS)
Registration of Births 2010 2011 2012
i) Estimated Mid- Year Population (in ‘000) 1182108 1197658 1212827
ii) Expected Live Births 26124587 26108944 26197063
iii) Number of Registered Births 21430434 21836920 21951519
iv) Level of Registration 82.0 83.6 84.4
v) Level of Registration after excluding U.P. &
Bihar 91.6 93.7 94.8
Registration of Deaths
i) Expected Deaths 8511178 8503372 8489789
ii) Number of Registered Deaths 5690549 5735082 5850176
iii) Level of Registration 66.9 67.4 69.3
iv) Level of Registration after excluding U.P. &
Bihar 76.8 76.8 79.3
Registration of Infant Deaths
i) Number of Registered Infant Deaths 180736 178172 159060
ii) Percentage of infant death to total deaths 3.2 3.1 2.7
Gross Natural addition to the Population
i) Person 15739885 16101838 16101403
Sex Ratio at Birth
i) Number of Registered Male Births 9436361 8428698 10425752
ii) Number of Registered Female Births 8087068 7660839 9463528
iii) Sex Ratio at Birth 857 909 908

2
STATEMENT 2: Estimated events and Level of Registration by India, States 2012
Sl. No. India/ States/
Union Territories
Mid-Year
Population
(in '000)
SRS
BR*
Estimated
Births
SRS
DR*
Estimated
Deaths
Level of
Registration
Births Deaths
India 1212827 21.6 26197063 7.0 8489789 84.4 69.3
States
1. Andhra Pradesh 85744 17.5 1500520 7.4 634506 74.8 64.0
2. Arunachal Pradesh 1260 19.4 24444 5.8 7308 100.0 23.4
3. Assam 31071 22.5 699098 7.9 245461 87.6 45.5
4. Bihar 99457 27.7 2754959 6.6 656416 74.7 37.1
5. Chhattisgarh 24695 24.5 605028 7.9 195091 74.2 72.8
6. Goa 1474 13.1 19309 6.6 9728 100.0 100.0
7. Gujarat 60062 21.1 1267308 6.6 396409 100.0 79.5
8. Haryana 25994 21.6 561470 6.4 166362 100.0 96.6
9. Himachal Pradesh 6878 16.2 111424 6.7 46083 100.0 96.1
10. Jammu & Kashmir 11915 17.6 209704 5.4 64341 69.8 55.1
11. Jharkhand 32050 24.7 791635 6.8 217940 61.9 51.8
12. Karnataka 60229 18.5 1114237 7.1 427626 100.0 95.2
13. Kerala 34882 14.9 519742 6.9 240686 100.0 98.7
14. Madhya Pradesh 73730 26.6 1961218 8.1 597213 87.2 60.2
15. Maharashtra 114697 16.6 1903970 6.3 722591 100.0 90.2
16. Manipur 2487 14.6 36310 4.0 9948 83.1 44.2
17. Meghalaya 2662 24.1 64154 7.6 20231 100.0 70.7
18. Mizoram 1020 16.3 16626 4.4 4488 100.0 100.0
19. Nagaland 2284 15.6 35630 3.2 7309 100.0 95.7
20. Odisha 41224 19.9 820358 8.5 350404 96.4 83.1
21. Punjab 28083 15.9 446520 6.8 190964 100.0 100.0
22. Rajasthan 69250 25.9 1793575 6.6 457050 98.0 78.1
23. Sikkim 622 17.2 10698 5.4 3359 80.3 100.0
24. Tamil Nadu 68002 15.7 1067631 7.4 503215 100.0 98.7
25. Tripura 3672 13.9 51041 4.8 17626 91.0 54.1
26. Uttar Pradesh 205426 27.4 5628672 7.7 1581780 57.5 42.3
27. Uttarakhand 10131 18.5 187424 6.1 61799 79.0 54.5
28. West Bengal 90595 16.1 1458580 6.3 570749 100.0 73.6
Union Territories
1. A & N Islands 381 15.0 5715 4.6 1753 95.3 100.0
2. Chandigarh 1532 14.8 22674 4.0 6128 100.0 100.0
3. D & N Haveli 363 25.6 9293 4.5 1634 71.9 73.5
4. Daman & Diu 243 18.1 4398 4.8 1166 96.1 91.6
5. Delhi 19164 17.3 331537 4.2 80489 100.0 100.0
6. Lakshadweep 77 14.8 1140 6.4 493 64.4 75.1
7. Puducherry 1471 15.8 23242 7.1 10444 100.0 100.0
*SRS BR: Sample Registration System Birth Rate, *SRS DR: Sample Registration System Death Rate

3
CHAPTER – I
CIVIL REGISTRATION SYSTEM - AN INTRODUCTION
1.1 The requirement for a complete and up to date Vital Statistical System to yield reliable data on
vital events hardly needs any emphasis. These data are essential for socio-economic planning and
development and also to evaluate the effective implementation of various programs. The chief sources
for data on vital events in India are Civil Registration System (CRS), Sample Registration System (SRS)
and Population Census. The Population Census remains the main source of information on population
and its characteristics; however, being a decennial exercise, it does not provide the measure of
population change from year to year. The measures of fertility and mortality derived from the Census
are centered on the midpoint of the decade and as such do not provide annual change in the population.
Of the other two sources of vital statistics for getting the vital rates on a regular basis, the SRS has been
designed to provide reliable estimates at National and State level. Robust estimates of vital rates at
District and sub-district level on an annual basis through sample survey are difficult to obtain on
account of prohibitively large sample size and variety of resultant factors such as controlling of non-
sampling errors etc. CRS is thus the only source for providing vital rates at district and sub-District level.
Rather a complete CRS can provide these rates at all administrative levels.
1.2 The Civil Registration System (CRS) may be defined as a unified process of continuous,
permanent and compulsory recording of the vital events and characteristics thereof, as per legal
requirements in the country. In India, the Civil Registration System cover registration of births and
deaths only. Civil registration system provides the best source of information on the vital rates at all
levels. Full coverage of vital events by registration machinery only can help in reaching to the high-
quality vital rates which may be used for planning or research. Therefore, concentration should be given
to the proper monitoring of the activities under the system. Civil registration systems are considered to
be complete if they cover 90 per cent or more of all live births and deaths taking place within a country
or area. However, in India the coverage of registration system is incomplete and not up to the mark to be
utilized for statistical purposes at the National level but there are 22 States/UTs where the coverage of
birth registration is more than 90 per cent and 16 States/UTs where the coverage of death registration
is more than 90 per cent.
1.3 The registration records are primarily useful for their value as legal documents and secondarily
as the source of vital statistics. Civil registration as a source of vital statistics is relatively less expensive,
as the statistics generated from the registration records are the by-products of an essential
administrative process. The registration records can also generate current and continuous statistics,
which can be more accurate than any other method of data collection. However, the reliability of the
statistics obtained through the registration system depends much on the completeness and promptness
with which events are registered and the accuracy of the information in the registration records. The
improvement in the system of registration of births and deaths is critically dependent on how much
importance is attached to the data on births and deaths by the respective States and District
administrations. Besides, the level of awareness among the public about the utility of birth/death
certificate also plays a crucial role.

4
1.4 Vital statistics generated through registration records enable estimation of the size, structure
and geographical distribution of the population for the current year except for migration. Vital statistics
also enables the projections for future years on the basis of probable trends of fertility and mortality as
derived from a study of these factors and their interactions with social, economic and other
demographic factors. The vital statistics data generated through an effective Civil Registration System is
of immense use for formulation of various development and welfare programmes/ schemes. Civil
Registration data can act as an objective source for allocation of financial resources at State and District
level. The Civil Registration data acquires paramount importance in the wake of 73rd and 74th
amendments to the constitution of India, as it can provide data at local level for micro level planning,
monitoring and evaluation of schemes. At national level, the vital statistics data generated through Civil
Registration is quite useful for medical research and in the study of sex ratio, mortality and morbidity
rates and also in the study of causes of deaths.
Registration of births and deaths in India
1.5 In India, the registration of births and deaths is carried out under provisions of the Registration
of Births and Deaths (RBD) Act, 1969. The registration is done by the local Registrar appointed by the
State Government under whose jurisdiction the event has taken place.
1.6 Provision for registration of births and deaths and the mechanism thereof had been in existence
in India for more than a century, however, the work of registration was carried out under various laws
and byelaws existing at that time in different parts of the country. The need for improvement in the vital
statistics system was felt for long time and, therefore, on recommendations of various committees and
conferences, the Registration of Births & Deaths Act, 1969 providing for compulsory registration of
births and deaths was enacted. Since then, this Act has been enforced uniformly across all the States and
Union territories. This Act provides for registration of births and deaths and publication of statistical
reports annually based on the civil registration data. The enactment of the Registration of Births &
Deaths Act, 1969 has provided a common framework for putting in place a sound system of registration
of births and deaths in the country.
1.7 The registration work at various levels in States/Union Territories is performed by involving
officers of different Departments. The existing organizational set-up involved in the work of civil
registration at various levels in different States/Union Territories is given at Annexure-A. A uni-linear
hierarchy exists in 10 States/ UTs where single department is involved at all levels of registration. In 7
States namely Assam, Haryana, Meghalaya, Odisha, Punjab, Sikkim and A&N Islands Health Department
is involved at all levels of registration. Panchayats in Kerala, Revenue in Dadra & Nagar Haveli and Local
Administration Department in Puducherry are responsible for execution of this work at all levels. At
present, Health Department supervises the civil registration work at State level in 19 States/Union
Territories, Department of Panchayats in 1 UT namely Lakshadweep and Department of Planning,
Economics & Statistics in 12 States/ Union territories.
1.8 In order to simplify and speed up the process of registration and to bring in uniformity in birth
and death registration formats, the registration system was revamped in the year 2000. Under the
revamped system, the procedure for registration of births and deaths was also modified to some extent

5
and the forms redesigned. Most of the tables to be part of the Annual Report of the Chief Registrars
based on registration of births and deaths data under revamped system would be based on the
information of place of usual residence of mother in case of births and place of usual residence of the
deceased in case of deaths. The revamped system became operational in 2000 in all States/Union
Territories except Assam, Arunachal Pradesh, Gujarat, Haryana, Himachal Pradesh, Odisha, Punjab,
Uttarakhand and Uttar Pradesh. It was implemented in Assam, Arunachal Pradesh and Odisha in 2001,
Haryana in 2002, Himachal Pradesh, Uttarakhand and Uttar Pradesh in 2003 and Gujarat and Punjab in
2004.
Statistical Reports
1.9 System of Registration of Births and Deaths is constantly generating statistical information at the
local level. The information contained in the Reporting Forms is consolidated for onward transmission
to the Chief Registrar of a State/UT. Every Chief Registrar is required to submit an Annual Report on the
Working of the Act and a Statistical Report to the State Government by July and December respectively
of the following year to which the report relates. The Chief Registrars are also required to send a copy of
these Reports to the Registrar General, India, Govt. of India.
1.10 Based on the Annual Statistical Report prepared by the States, the Office of the Registrar General,
India, brings out annually a comprehensive statistical report entitled “Vital Statistics of India based on
Civil Registration System”. This series of reports have been brought out since 1958. However, most of
the States are not bringing out their Annual Statistical Reports in time, and this in turn, delays the
publication of the corresponding national report. It has also been observed that many of the States do
not include all the prescribed tables in their reports making the utility of the national report very
limited. However, most of the States have sent the annual information on births and deaths registered
up to 2012. This information is available for most of the Districts with rural- urban and sex wise break-
up. Therefore, this report has been prepared by compiling this information. Keeping in view the
importance and use of the data on registered births and deaths, this report provides the District-wise
registered births and deaths along with infant deaths with sex-wise and rural-urban break-up of
registered events for the year 2012.
*****

6
CHAPTER – II
Annual Report on the working of the RBD Act for the Year 2012
1. Printing of Training Manual – To improve the capabilities of officials engaged in Civil
registration Work in the various part of the Country, this office has prepared a Training Manual namely
“Training Manual for Civil Registration Functionaries in India”. This training manual has been developed
by the Office of the Registrar General India, New Delhi through the Indian Institute of Health
Management Research (IIHMR), Jaipur and with the support of UNICEF, New Delhi. The manual has been
pre-tested and suitably modified on the basis of feedbacks received from the participants in the pre-test
workshops organized during May and June, 2012 at Delhi and Jaipur. The said Manual will serve as the
reference guide for the CRS functionaries in understanding the registration process and provisions of
the Registration of Births and Deaths (RBD) Act, 1969 and Rules framed thereunder from time to time.
The said Manual has been printed in 11 regional languages namely Marathi, Guajarati, Kannada, Tamil,
Assamese, Malayalam, Urdu, Oriya, Telugu, Bengali and Punjabi and also in Hindi and English. These
Manuals has already been distributed to the concerned State and district authorities.
2. Circular issued for making / changing entries in the birth record of children taken on
adoption –The issue relating to registration of birth of children taken on adoption hitherto were dealt
as per the guidelines issued by ORGI during 1999. In order to add the objectivity to the entire process
and also to keep abreast with the changes taken place, an emergent need was felt to revisit the subject.
Accordingly, a new birth reporting form 1-A (Birth Report for adopted child) is introduced for making /
changing entries in the birth record of children taken on adoption, in order to facilitate the adoptive
parents to have a proper birth certificate with their name as the parents. These guidelines covered both
adoptions i.e. adoptions through institutions or outside institutions. All adoptions are subject to order of
the Magistrate having jurisdiction over the area in which the event falls. A circular in this regard has
been issued by this office on 12th March, 2012.
3. A circular on determination of place and date of death of missing person for registration
of death –There are instances, where a person is missing but the family does not have her / his current
status i.e. whether the person is alive or dead. In such situations, people ask for providing death
certificate for missing persons. However, it has been observed that in many circumstances, the date and
place of death is not mentioned in the order issued by the court regarding presumed dead, which is
mandatory for registering the death. In this connection, the matter was taken up with the Union Law
Ministry and a clarification was issued to all States/ UTs. The gist of the clarification is given below:
Ordinarily, if the person is missing or unheard, she / he shall be presumed to be dead by the court under
Section 107 and 108 of Indian Evidence Act on expiry of seven years from the date missing and not earlier.
The presumption of death and its date and place of occurrence is a matter of burden of proof. The same
may be determined by the competent court / authority based on the oral and documentary evidence
produced before the court by the plaintiff. If the Court does not mention the date of death in its order, the
date on which plaintiff approached to the Court would be taken as the date of death. In case of place of
death, if it is not mentioned in the court order, the place of death’ may be that place where plaintiff
approached the court.
7
4. Registration Machinery: Section 3 to 7 of the Registration of Births and Deaths (RBD)Act 1969
provides for the appointment of functionaries at all levels like (i) National level -Registrar General, India;
(ii) State level - Chief Registrar; (iii) District level - District Registrar (iv) local area level- Registrar for a
village, Panchayat, municipality, municipal corporation or other local bodies; and (v) Sub-Registrar for
specified area within the area under the jurisdiction of a Registrar.
Under Section 3(3) of the RBD Act, 1969, the Registrar General, India (RGI), take steps to
coordinate and unify the activities of Chief Registrars of Births and Deaths of all States/Union
territories and require to issue general directions regarding registration of births and deaths. The RGI
also require to submit a report to the Central Government on the working of the RBD Act. The work
relating to Civil Registration in the office of the Registrar General, India is handled in Vital Statistics
Division. The work of registration is carried out by a three-tier hierarchy: The Chief. Registrar, District
Registrar and local Registrar at the periphery level, they are appointed under Section 4, 6 and 7
respectively by the State Government/Union territory Administration. The Chief Registrars of Births
and Deaths has been declared as the chief executive authority in the respective States/ UTs for
implementing the provisions of RBD Act and the Rules and orders made thereunder. The actual work
of registration of births and deaths in the field is carried out by the local registrars. There is a wide
variation in the registration machinery across the country:
� The Chief Registrars of births and deaths in 17 States and 2 union territories are from the Health
Department, in 10 States and 2 union territories are from Planning, Economics & Statistics
Department, in 1 State and 1 UT from Panchayat Department and in remaining 2 UTs it is with
other Department viz. Local Administration and Revenue Department.
� The district level authorities are mainly divided among District Collectors/ District Magistrate
(in 9 States and 1 UT), Chief Medical Officers/ District Medical and Health (11States and 2 UT),
District Statistical/ Planning Officers (in 4 States and 1 UT) and Deputy Director / Assistant
Director (Panchayat) in 1 State and 1 UT and in remaining States/ UT are others.
� At Rural level, the registration work is entrusted to the officials of Panchayat Department in 15
States and 3 UTs, Health Department in 7 States and 4 UTs, Revenue Department in 3 States),
Education Department in 2 States and Police Department in 1 State and 1 UT.
5. Inter Departmental Coordination Committees(IDCC): For effective implementation the
provisions of the RBD Act in the States and in order to resolve the operational problems and to sort out
the issues of mutual coordination among the various departments engaged in registration work an
Inter-Departmental Coordination Committee (IDCC) has been set up in all States / UTs. The State
Governments are required to convene the meeting of such committee at least once in a year to
formulate the strategies for further improvements in civil Registration system. However, it has been
observed that despite persuasion by this office, such meetings have not being convened regularly by
the most of the States/ UTs. During 2012, such meetings were held only in six States/UTs namely
Bihar, Manipur, Nagaland, Punjab Tamil Nadu and Uttar Pradesh. Such type of Committees i.e. Inter
Departmental Coordination committees have also been set up at District and Sub district level also (at
Mandal and Taluk level). However, the information on regular convening of below State level meetings
has not been received from most of the States. As per the information provided by the Chief Registrars:

8
� The State of Karnataka has convened the meetings of 52 District Level Coordination Committee
(DLCC) and 349 Taluk level Coordination Committees (TLCC) during the year.
� In Maharashtra, such Committees has been set up at various level i.e. district, Block and village
level. However the percentage of convening the meetings of such committee is very less. At
district level, only 04 districts namely Ratnagiri, Ahmednagar, Nanded and Akola conducted such
meetings during the year. The percentage of meetings at Block level is 43% and Village level is
47%. The committees have also been established at Municipal Corporation level in Six
Corporations.
� Tamil Nadu has convened 16 District Level meetings during 2012.
� In Himachal Pradesh district and block level committees have been setup with the standing
instruction to hold committee meeting frequently. Monthly meetings with the District Registrar
(DM & collectors) were held under the Chairmanship of Commissioner and Principal Secretary
(Health).
The States of Andhra Pradesh, Assam, Rajasthan, Uttarakhand and Punjab have also convened
such meetings during 2012 but specific details not provided.
6. Penalties: Section 23 of the RBD Act provides for imposing penalties on defaulting institutions,
Registrars and the individuals for non-registration, non-reporting and for negligence or refusal to
register any birth or death without any reasonable cause. However, it has been found that very few
States have been reported to imposing the penalties, as a means to improve the functioning of the
system. As per the information made available, the States of Kerala, Maharashtra and Punjab have
imposed such penalties during 2012. The details of which are given below:
Statement 3: Penalties imposed on Registration Functionaries
Name of States / UTs Penalties imposed on
No. of prosecutions No of offences
Kerala
453
(Rs.22,317/-)
630
(Rs. 33050/-)
Amount collected from defaulter for non / late reporting
(in Rs.)
Punjab Rural 3,12,766/-
Urban 1,29,990/-
Total Rs. 4,42,756/-
Maharashtra District Registrars Raigarh and Jalna imposed fine of Rs.
200/and Rs.300/respectively for non-submission of report.
Few states have initiated several actions on imposing the penalties, details of which are given below:
� Andhra Pradesh- District Registrars and Municipal commissioners/ Municipal Health Officers
have been authorized to launch prosecution and compounding offences against the defaulters.
Instructions were reiterated to exercise their powers.

9
� Karnataka- No prosecution was launched during the year; penalization was avoided through
educative, publicity / propaganda and persuasive programmes.
� Odisha- District Registrars and Registrar of Births and Deaths have been authorized to
prosecute the defaulters in reporting for registration, submission of reports / returns and
reporting of false events.
The States of Assam, Bihar, Jharkhand, Nagaland, Manipur, Tripura, Karnataka, Rajasthan, West
Bengal, Andaman & Nicobar and Puducherry have not imposed any penalties during the year and
furnished Nil information. The States of Gujarat, Himachal Pradesh, and Uttar Pradesh has not provided
any information on this issue.
7. Registration of Births and Deaths occurring to Indian Citizens abroad: The event of births and
deaths of Indian citizens occurring abroad are registered by the respective Indian Consulates under the
Citizenship Act 1955. The Consulates are statutorily required under Rule 5 of Citizen’s (Registration at
Indian Consulates) Rules 1956 to send the annual returns of births and deaths of Indian Citizens to the
ORGI. Such returns for the year 2012 have been received from 78 missions, covering 12601 births and
1754 deaths. Out of total birth registered at the various missions during 2012, Kuwait alone accounted
for 35.5%, UAE 22.4%, Oman 14.3% and Spain 4.0% births. In case of total registered deaths at various
missions, Kuwait accounted for 28.6% deaths, UAE 20.4% and Malaysia 10.6% deaths in 2012.
8. Annual report on the working of the RBD Act: The Chief Registrars are required to submit an
Annual Report on the working of the RBD Act under Section 4 (4) of the Act to the respective State
Governments as well as to the ORGI. The statutory Annual Reports for the year 2012 have been received
from 30 States and UTs except Chhattisgarh, Goa, J&K, Madhya Pradesh and Lakshadweep.
9. Inspection of Registration units- For improvement of registration system in both qualitative and
quantitative terms, inspection of registration centers and registration records at regular interval is
essential. Specific provisions in this regard have been made under Section 18 of the RBD Act which
allows inspection of registration offices and examine the registers kept therein. Regular inspections are
required to be done by the office of the Chief Registrar and District Registrars in each States/UTs. Such
inspections could have been more meaningful, if organized and conducted frequently within a regular
time frame, however, as per the information provided by the States, the inspection of registration
centers in the States were irregular and extremely insufficient in most of the States/UTs during 2012.
The actual information in respect of number of units inspected is not provided by the majority of the
States /UTs, only few States/ UTs have furnished the desired information, the details of which are given
below:

10
Statement 4: Details of inspection undertaken
Name of State Number of Districts Covered No. of Rural units
Inspected
No. of Urban units
Inspected
1. Bihar 17 217 60
Haryana
5 4
28@
6
Karnataka
Not given 2731 -----
Punjab Not given 118 Block PHC’s/
CHC’s
101
Rajasthan Rural & Urban units inspected by the officer/ officials of DSO’s. The officers of
Chief Registrar’s offices also inspected Municipalities and many Gram Panchyat
but exact number is not given.
Manipur 08 54 units
Puducherry 04 All 40 Units inspected.
Jharkhand Not given 35 24
@ Record of 28 registration centers were inspected at Chief Registrar’s office.
Other States have furnished the following information regarding inspection:
1. Andhra Pradesh: District Registrars have been requested to deploy District Level Programme
Officers and Statistical Staff to inspect Registration centers regularly every month.
2. Kerala:In rural units, the Performance Audit Teams under the Assistant Director of Panchyat
conducted inspection during every quarter. The schedule of inspection is prepared in advance
and the report is submitted to the District Registrar. The District Registrar will forward the
report to the Chief Registrar with specific remarks. The urban units are to be inspected by the
Secretary of the Local Self Government concerned and report submitted to the Chief Registrar.
3. Tamilnadu: Regular and periodical inspections by the Officers of the State Head Quarter are
being carried out and the feedback of the inspection is also communicated to the District
Registrars, Municipal Commissioners and Additional District Registrars for follow up.
4. Sikkim- The routine inspections were done by the Chief Registrar’s Office.
5. Punjab: In order to inspect all registration centers of the district in a year, District registrars
have been instructed to ensure inspection of 4 Rural and 2 Urban registration units in a month.
6. Nagaland: The District Registrars and Circle Registrars were instructed to carry out inspection
to the Registration Units under their jurisdiction. Due to huge number of units, cent percent
inspection could not be undertaken during 2012. With the message of birth and death. More
campaigns are required to be undertaken in order to create awareness.
7. Delhi: Registration centers, zonal offices and major hospitals were inspected from time to time
by the officers/ officials of Chief registrar office to examine the working and ascertain the
difficulties faced by the public in getting birth / death certificate.
8. Daman & Diu: Regular inspection of registration units are carried out in the territory.
9. Tripura - No inspections were performed during 2012.
The inspections have also been made by the Officers/ officials of the ORGI and DCO offices from

11
time to time. The observations found during the inspections were forwarded to the respective States/
UTs for remedial measures.
10. Training of Civil Registration Functionaries- In most of the States/UTs, registration functionaries
involved in Civil Registration work (i.e. registration of births and deaths) at various levels are from
different departments and transferred frequently. Almost all these functionaries perform registration
work as an additional work along with other work assigned to them by the respective department.
Further, there is a need to impart training at a regular interval to these officials on registration rules,
procedures and practices framed under the provisions of the RBD Act and the corresponding State rules
due to frequent transfers of these functionaries. As per the details furnished by the States, the following
training programmes have been organized in the various States during the year 2012, viz. Andhra
Pradesh organized 6 programmes, Mizoram 9 programmes, Haryana 5 programmes, Punjab 29
programmes, Jharkhand 214 block level training programme and 24 district level programmes ,
Karnataka 210 Training programmes were organized, Rajasthan 24 district level & 60 block level
training programmes, Tamil Nadu 7 such training programmes, 6 training programmes in Uttarakhand
and Puducherry conducted 1 such programmes during the year. The details of other training
programmes are given below:
� Himachal Pradesh, one day Training of Trainers (TOT) for Additional District Registrars and
other CRS functionaries were arranged at Shimla on 6th December, 2012.
� Nagaland Government has conducted training for the Registrars and Notifiers regularly once in
a year.
� Sikkim arranged reorientation training for the local Registrars.
� Kerala, the subject of registration of births and deaths has been included in the various Training
Programmes conducted by the Kerala Institute of Local Administration (KILA).
11. Computerization of Civil registration record/ work- The information on computerization of Civil
registration record and online registration have been furnished by the following States/ UTs-
� Kerala- Up to the end of 2012, Civil Registration work in Kerala has been computerized in all
Municipal corporations and Municipalities and 978 Rural Registration Units (Gram Panchayats),
using “Sevana” Civil Registration Software developed by Information Kerala Mission (IKM). The
Civil Registration records prior to date of computerization are being digitized. The certificates in
respect of the registers maintained under the traditional system are also issued using the
software in computerized units. The legal part of the reporting forms is preserved as Statutory
Register in addition to the electronic data.
Under the Hospital Kiosk Project the report of births and deaths are sent to the Registration Unit
as electronic data through telephone line from the kiosk functioning in the hospital. The project
for online registration of the events in Hospitals has been implemented in 5 Corporations, 39
Municipalities and 65 Gram Panchayats up to the end of 2012. Under this scheme, the report of
births and deaths are sent to the registration units as electronic data through telephone lines
from the kiosk functioning in the hospital. The electronic report is registered by the Registration
unit after verification and certificate issued under Section12 through the hospital.
� Punjab:The State has initiated the procedure of computerization of record of births and deaths.

12
In first phase, the record of rural area of district Amritsar, Bhatinda and Patiala for the year 2000
to 2008 has been digitized.
� Daman & Diu: The work of registration of births and deaths in all rural and urban areas have
been computerized .NIC Daman has prepared a uniform software for the UT where data entry
work is being carried out at HQ level , a provision for generation of statuary tables is also
available.
� Delhi: All local bodies have computerized their operations resulting in improvement in the
quality of service rendered to the public. All major Government / Private hospitals have been
provided the facility of online reporting of birth/ death events, this has speed up the process of
reporting and registration of events.
� Odisha: Online Registration of Births and Deaths in 44 registration units functioned from 28-10-
2010. The Web site for urban Registration is www.ulbodisha.gov.in.
� Puducherry: All the local bodies are issuing computerized birth and death certificates for the
event registered under the Act. In order to cater the needs of the public who requires birth and
death certificates of their ancestors, computerization of birth and death record prior to 1979 in
Puducherry and Oulgaret Municipalities has been taken up.
� Gujarat: Summary reports are being compiled at state level through From No. 11, 12 and 13 and
entered in BADEA (Birth and Death Entry Application) for validation of data entry of Births &
Deaths registered at District/Taluka level under BADEA. All tables of birth under the RBD Act
1969 (B1 TO B23) are being generated through BADEA. Out of 8 Municipal Corporation, three
Municipal Corporation have computerized Civil Registration System and issue Computerized
Birth & Death Certificate. Some of the Municipalities/Nagar Palika and Gram Panchayats also
initiated issue of Computerized Birth & Death Certificate.
� Tamilnadu: All District offices have been equipped with computers. Computerization of Birth
and Death data is done in all corporations, Municipalities and at Taluks. Computerization of Birth
and Death data is also done in Town Panchayats. Computerized Birth and Death certificates are
issued from all the urban local bodies. In rural areas, computerization of birth and death records
have been started from 2008 onwards, using web-based software developed with the support of
NIC. The computerizations of birth and death records are done at taluk level and at Primary
Health Centre level in the rural areas. The process of Digitization of birth and death records of
past 10 years in respect of two million plus cities of Trichy and Coimbatore were taken.
� Andaman & Nicobar Islands: New software (BIRDS) for issuance of birth & death certificates
has been developed in the territory by the NIC. This software is web based in open source
platform and presently and installed in the NIC server and accessed through broadband
connectivity.
Other States have also taken various measures on computerization of civil registration record but
details have not been given in their annual reports.
12. 12. Publicity efforts for improving Registration of Births and Deaths:
Publicity measures taken by ORGI: One of the reasons for low levels of registration in the country is
the lack of awareness among the general public about the need and importance of registration and lack
of procedural knowledge among the registration functionaries. In order to make the public aware about
13
the need and importance of registration, Registrar General’s Office undertook wide spread publicity
campaigns through various media such as telecasting video spot through National Network of
Doordarshan Kendra’s & Private T.V. Channels, Broadcasting the messages on importance of births and
deaths through various stations of AIR, advertisement through leading newspapers at the time of school
admission, Printing of message on the importance of registration of births and deaths through other
means.
Publicity measures taken by State Governments: The state governments had also undertaken
publicity measures through their own funds by printing of posters, cloth banners, pamphlets, leaflets on
the importance of registration of births and deaths. Radio talks were arranged on the importance of
registration of births and deaths, advertisements were published in leading newspapers. Arrangements
were also made by the state governments for showing the cinema slides and documentary films.
As per the details given by the States, following publicity measures has been taken during the year-
Andhra Pradesh: The following measures were taken by the State:
The Commissioner, Family welfare requested to include the Civil Registration of Births and Deaths in the
IEC activities of the Family welfare programmes.
The Women and Child Welfare Department issued necessary instructions to all Project Directors to
arrange distribution and display of posters at Anganwadi centers and ensure regular monthly reporting
from them to village Secretaries.
District Collectors issued instructions to all Tehsildars & Officers and Municipal Commissioner to ensure
the display of posters at all public place.
Panel boards, Stickers, Pamphlets on importance of civil registration were printed and supplied to poor
performing districts.
Bihar: The following measures were taken by the State:
An advertisement on importance of registration of births and deaths was published in Hindi, Urdu and
English Newspaper during the year.
The State Government from its own funds telecasted the message from Doordarshan Patna to attract the
attention of rural and urban people towards registration
Carried out wide publicity on the importance of registration of births and deaths by putting Stalls,
posters, wall hangers etc. in “Melas” like SoanpurMela and ShravaniMela and others in various part of
the State.
Messages on the importance of registration of births and deaths through Wall Painting were made in the
rural areas of the State.
In order to accelerate the Vital Statistics work and to create the awareness among the public, an
descriptive analysis was published in the quarterly report of Directorate of Economics & Statistics
namely “Bihar Sankhyaki Darpan”.
Himachal Pradesh: The following measures were taken by the State:
1339 flex board and wooden board bearing the message on birth and death registration were printed
out in the district of Bilaspur, Hamirpur, Mandi, Kullu & Solan and distributed to all Hospitals, Maternity

14
home and Delivery Center.
Rajasthan: The following measures were taken by the State:
To create the awareness among public, slogans on birth and death registration were printed on
Prescription slip of Doctors, Immunization Card and Ration Card.
An appeal on the importance of registration of births and deaths were released in local Newspapers by
all District Collectors.
Stickers on the importance of registration of births and deaths were distributed among children.
Financial and mobility support from UNICEF has also taken for publicity in the rural areas.
Karnataka: The state Government has taken publicity advertisements through various means for
improving registration system. Publicity measures have also yielding significant results since the last
decade.
Haryana: In order to strengthen the civil registration system, during 2012-13 financial assistance of Rs.
11.2 lakh under NRHM (PIP) has been taken for the activities like- Purchase of Laptop/Computer system,
Training for Registrars, appointment of Civil Registration Officer/ Assistants/Field Investigators and also
for conducting Field visits.
On the request of District Registrars, the Chief Registrar office has arranged funds for preservation of old
registers which were in torn condition. NRHM has also provided funds of Rs. 2.00 Lakh during 2012-13
for 8 districts for binding and lamination of old record @ Rs. 25,000/ per district. The districts of
Ambala, Bhiwani, Faridabad, Fatehabad, Gurgaon, Hissar, Jhajjar and Jind were provided such assistance.
Kerala: Permanent notice boards were exhibited in front of all registration units. Cinema Slides were
exhibited in almost all cinema Theaters. Messages on Civil Registration System were printed in
Panchayat department publication ‘Panchayat Raj’, a monthly magazine of the state. The details of
services given and the duties of the public under civil registration System has been included in the
‘Citizen Charter’.
Maharashtra:The following measures were taken by the State
In order to register all birth events that are being immunized, a column has been included in
immunization card “as to whether the event has been recorded in Gram Panchayat record or not” if yes,
then date and registration number should entered in the Immunization card.
To abridge the gap of registration in tribal and inaccessible area, ASHA’s are appointed as notifier under
NRHM. They have also given training for birth and death registration.
Nagaland: The Department has been taking various steps for publicizing on the importance of
registration of births and deaths; these were exhibited to the public in the form of posters, pamphlets,
wall hangers, bill board etc. with the message of birth and death.
Punjab: The following measures were taken by the State:
A slogan on timely registration of birth has been incorporated in the immunization cards printed by the
Health Department.
Regular announcements on the importance of registration of births and deaths have been made through

15
public address system of Village Gurdwaras. Paramedical staff also spread awareness in immunization
camps during their routine visits.
Advertisement was published in leading Newspaper apprising the general public about the special
permission of registration of name of the child in the time barred cases.
Production of birth certificate at the time of entering the name of child ion ration card has been
compulsory. A stamp in this regard also placed by the Department on the Ration Card.
The subject of birth and death registration was also discussed in live Programmes telecasted by
Doordarshan (PB) on Quarterly basis. During 2012, four such talks were given by the local Radio of
Jalandhar city. The queries of general public were also answered in these programmes.
Wall painting at Sub Centers and villages falling under the sub center were done depicting the messages
on birth and death registration.
1300 Sun flex boards were also displayed in all District /Divisional hospitals and CHC’s.
Mizoram: Adequate publicity was made on the importance of civil registration. Advertisements on
importance of registration of births and death were displayed in the daily Newspapers and Periodicals in
local language. In some localities , Non-Government Organization called ‘Young Mizo Association’ and
Village Council took up the responsible role of informing the public on the importance of reporting the
birth and deaths events
Sikkim: Displayed video telecast through local television all over Sikkim. Verbal communication
methods were also applied for creating awareness among public.
Tripura: Publicity and other promotional activities were made in Health Fair and different Health
Camps. Message on importance of registration of births and deaths was printed on OPD ticket of the
government institutions.
Uttarakhand: Slogans on the importance of registration of births and deaths pasted on roadways buses.
Advertisement on importance of registration of births and deaths also released in local leading
Newspapers. Display board installed in 2310 registration units.
Andaman & Nicobar Islands: Advertisements for the benefits of registration of births and deaths was
published in local papers regularly to acquaint general public with the provision of RBD Act, 1969.
Chandigarh: 300 hoarding boards on the importance of registration of births and deaths were installed
in different places – Hospitals, Dispensaries, Bus Strands, Railway Station, Agaanwadi Centers and
Cremation grounds. To educate the public regarding timely registration of birth and death and the type
of particulars to be furnished, the Department is showing one 35mm Hindi film in all local cinemas on
rotation. A 16mm film is also exhibited in rural areas.
Delhi: The following measures were taken:
Advertisement on the importance of registration of births and deaths are being released in leading
Newspapers on the important occasions like World Population Day & Children’s day. The other
advertisements released by the Directorate also contain the message pertaining to birth and death
registration.

16
NGO’s and other voluntary organizations were involved in the propagation of benefits of registration and
identification of unregistered cases if any in slum areas.
A Citizen’s Charter for registration of births and deaths has been implemented and the issuance of birth/
death certificate has been covered under e-service Level agreement (SLA) to facilitate the public.
Puducherry: Adequate publicity was made on the importance of Civil Registration. Advertisements
were released on the importance of registration of births and deaths in leading dailies on National Days.
13. Issuance of birth and death extracts / certificates:
Under the provision of Section 12 of the RBD Act, 1969 the Registrar are required to give an extract of
prescribed particulars from the register relating to such birth or death to the person free of charge to the
informant, who gives information under Section 8 and 9 of the Act. In addition to that, under Section 17
of the Act, the extract relating to birth or death has also been issued to the person asking for it on the
payment of prescribed fee.
Most of the States / UTs are not furnishing the desired information on issuance of extract/ certificate
under Section 12 and 17 of the Act. For the year 2012, only four States/ UTs namely Haryana, Kerala,
Uttar Pradesh and UT of Puducherry have furnished the requisite information. The State of Kerala has
not furnished the breakup of birth & death certificate under Section 12 of the Act, although breakup is
given under Section 17 of the Act. The UT of Puducherry has not provided the details separately for
Section 12 & 17 of Act. The information in respect of issuance of extract/certificate is given below:
Statement 5: Details of issuance of birth/death certificates
State Total Certificates/Extract
issued
Under Section 12 Under Section 17
Birth Death Total Birth Death Birth Death
Haryana 1027962 520291 1548253 453656 138894 574306 381397
Kerala NA NA 1596564 725892 626970 243702
Uttar Pradesh 21 47564 496645 2644209 NA NA NA NA
Puducherry 177170 43289 220459 NA NA NA NA
…………..

17
CHAPTER – III
A BRIEF ANALYSIS OF DATA ON REGISTERED
BIRTHS, DEATHS AND INFANT DEATHS
3.1 Births and deaths are the two most important vital events in the life of an individual and for the
society as a whole. Based on the data collected under the Civil Registration System on registered births
and deaths, this Chapter presents the trend in the level of registration, vital rates and other related
indicators, at the State and National level. To get an idea as to the coverage of Civil Registration in the
country, the data generated from the Civil Registration System has been compared with corresponding
estimates thrown up by the Sample Registration System. However, while interpreting the two statistics
it should be borne in mind that data under Civil Registration is based on place of occurrence and Sample
Registration System is by the place of usual residence of mother. It will not be out of place to mention
that although the registration data continues to be deficient due to not reporting of the events for
registration or not being registered, and also due to non-reporting of the registered events to the
Districts Registrar’s office in time by the local registration units, the silver lining is that the overall level
of registration across the States / Union Territories (UTs) largely show an upward trend.
3.2 Statement 5 gives the number of registration units along with the level of reporting at the
national level and across the States and Union Territories by rural and urban place of occurrence of the
event in 2012. Level of reporting indicates how many registration units from those within a State / UT
submitted monthly returns of registered births and deaths to the District Registrar’s Office during the
year. Expressed as percentage, it helps in reviewing the registration system and defining measures that
would be necessary to improve registration levels across the country.
3.3 It may be seen from the Statement that nearly 95.2 per cent of the registration units at national
level reported monthly returns of registered births and deaths to the District Registrar’s Office during
2012. Such reporting level by rural and urban registration units is about 95.2 and 97.5 percent
respectively. These figures exclude information from Bihar, Chhattisgarh, Jammu & Kashmir, Jharkhand,
Odisha and Uttar Pradesh due to non-receipt of returns during the year.
3.4 Among the States, cent-per-cent level of reporting from both rural and urban areas has been
reported from 8 States viz. Goa, Gujarat, Haryana, Kerala, Maharashtra, Punjab, Sikkim, Tripura and
West Bengal. It is interesting and heartening to note that all Union Territories have had cent-per-cent
level of reporting during the year.

18
Statement 6: Number of registration units and level of reporting by place, India, States and UTs, 2012
Sl.
No.
India / State / UT Registration units (Number) Level of reporting (%)
Rural Urban Total Rural Urban Total
India 254701 5090 259985 95.2 97.5 95.2
States
1. Andhra Pradesh 21590 135 21725 70.7 88.9 70.8
2. Arunachal Pradesh - - 194 n.a. n.a. 43.3
3. Assam 590 94 684 96.7 100.0 97.2
4. Bihar 9049 214 9263 n.a. n.a. n.a.
5. Chhattisgarh 9745 166 9911 n.a. n.a. n.a.
6. Goa 191 14 205 100.0 100.0 100.0
7. Gujarat 18131 168 18299 100.0 100.0 100.0
8. Haryana 435 90 525 100.0 100.0 100.0
9. Himachal Pradesh 3243 56 3299 99.4 97.6 99.4
10. Jammu & Kashmir 229 86 315 n.a. n.a. n.a.
11. Jharkhand 4594 80 4674 n.a. n.a. n.a.
12. Karnataka 28328 405 28733 94.9 99.6 94.9
13. Kerala 978 66 1044 100.0 100.0 100.0
14. Madhya Pradesh 23846 704 24550 97.5 99.9 97.6
15. Maharashtra 41085 380 41465 100.0 100.0 100.0
16. Manipur 56 32 88 58.9 97.0 94.1
17. Meghalaya 139 12 151 100.0 91.7 99.3
18. Mizoram 561 193 754 79.8 82.0 80.3
19. Nagaland 1185 28 1213 86.9 74.7 86.6
20. Odisha 314 105 419 n.a. n.a. n.a.
21. Punjab 2951 144 3095 100.0 100.0 100.0
22. Rajasthan 9177 185 9362 90.8 100.0 91.0
23. Sikkim 22 10 32 100.0 100.0 100.0
24. Tamil Nadu 14443 721 15164 99.3 93.9 99.0
25. Tripura 1064 103 1167 100.0 100.0 100.0
26. Uttar Pradesh 52029 642 52671 n.a. n.a. n.a.
27. Uttarakhand 7227 75 7302 72.1 84.1 72.2
28. West Bengal 3357 139 3496 100.0 100.0 100.0
Union Territories
1. A & N Islands 85 1 86 100.0 100.0 100.0
2. Chandigarh 6 5 11 100.0 100.0 100.0
3. D & N Haveli 10 1 11 100.0 100.0 100.0
4. Daman & Diu 10 3 13 100.0 100.0 100.0
5. Delhi 2 13 15 100.0 100.0 100.0
6. Lakshadweep 9 - 9 100.0 - 100.0
7. Puducherry 20 20 40 100.0 100.0 100.0

19
3.5 Statement 7 presents overall number of registered births and deaths at the national level for the
years 1981 to 2012.
Statement 7: Number of registered births and deaths at the national level, 1981– 2012
Notes:
1. The figures are based on the data made available by the States/UTs.
2. For the period 1981 to 2000, total registered births/deaths of States/Union Territories exclude data for Assam from 1981 to
1987 & 1990 to 1994, for Bihar from 1997 to 1999, for Kerala of 1983, for Meghalaya from 1984 to 1994, for Sikkim from
1982 to 1987 and of 1989, for Uttar Pradesh of 1983 and from 1996 to 2000, for Uttarakhand of 2000, for West Bengal of
1982 & 1985, for A&N Islands 1981 to 1982, from 1987 to 1988 and from 1991 to 1992 and for Lakshadweep of 1982. 3. In 2001, total registered births/deaths of States/Union Territories exclude data from Assam, Uttar Pradesh and
Uttarakhand. 4. Total registered births and deaths of States/Union Territories do not include data for Uttarakhand from 2002 to 2003,
Tripura for 2005 and2007-2009 and Jammu & Kashmir for the year 2012. 5. The registered births/deaths have been taken from the Annual Reports of the Chief Registrars and in its absence from the
data provided by the Chief Registrar’s office.
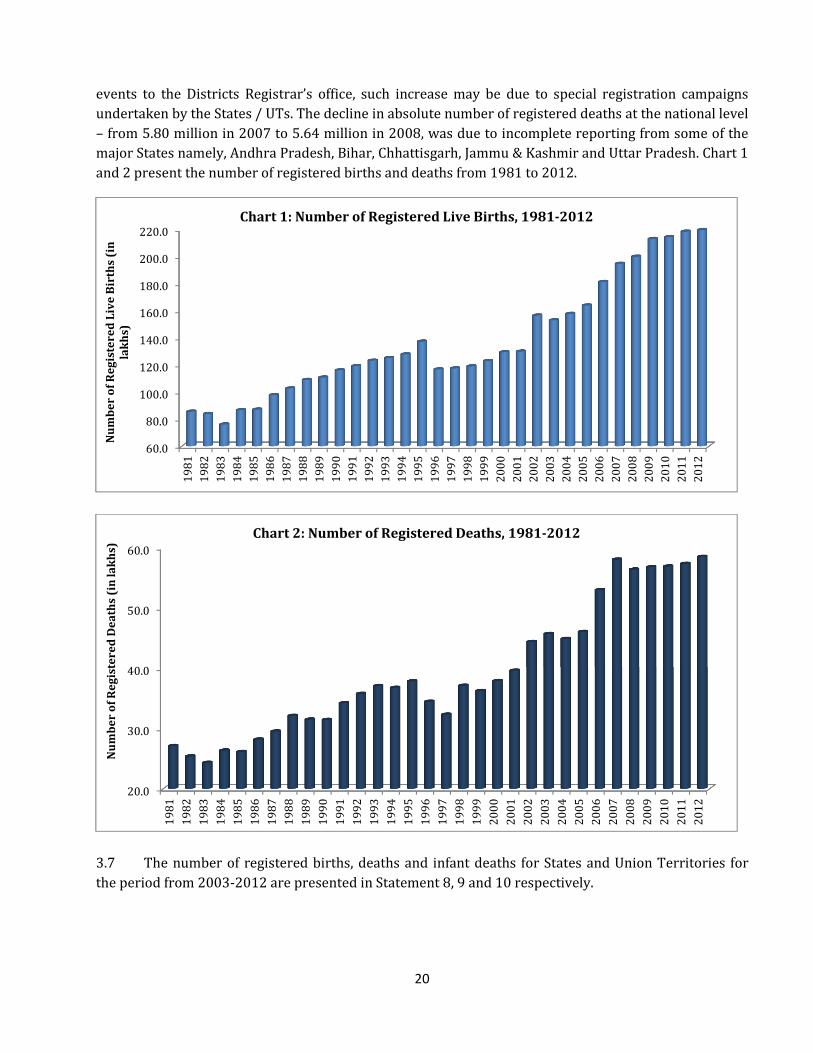
3.6 Statement 7 reveals that there is an absolute increase in the number of registered births and
deaths over the period 1981 - 2012. The number of registered births has gone up from 8.56 million in
1981 to 21.95 million in 2012 - an increase of 157%. Such increase in the number of registered deaths,
from 2.70 million in 1981 to 5.85 million in 2012, is to the tune of 116%. However, disaggregated to
reveal year to year change in the registered births and death, the pattern does not reveal a continuous
increasing trend. Whereas, sizable decline in the number of registered births and deaths between two
consecutive years is largely due to incomplete reporting by the local registration units of all registered
Year Live Births Deaths
1981 8556636 2708957
1982 8380443 2537741
1983 7608517 2431121
1984 8656291 2634858
1985 8706192 2611139
1986 9777045 2818386
1987 10273688 2951430
1988 10895747 3210942
1989 11074930 3149312
1990 11601446 3144023
1991 11910093 3420669
1992 12324796 3576449
1993 12519182 3704881
1994 12788061 3676353
1995 13725993 3784469
1996 11671143 3445395
Year Live Births Deaths
1997 11745719 3231333
1998 11893946 3711612
1999 12287748 3623079
2000 12946823 3789466
2001 12993577 3961767
2002 15645632 4436100
2003 15290261 4569026
2004 15777612 4487886
2005 16394625 4602727
2006 18121295 5298279
2007 19469756 5804922
2008 19993799 5638131
2009 21292574 5677705
2010 21430434 5690549
2011 21836920 5735082
2012 21951519 5850176
20
events to the Districts Registrar’s office, such increase may be due to special registration campaigns
undertaken by the States / UTs. The decline in absolute number of registered deaths at the national level
– from 5.80 million in 2007 to 5.64 million in 2008, was due to incomplete reporting from some of the
major States namely, Andhra Pradesh, Bihar, Chhattisgarh, Jammu & Kashmir and Uttar Pradesh. Chart 1
and 2 present the number of registered births and deaths from 1981 to 2012.
3.7 The number of registered births, deaths and infant deaths for States and Union Territories for
the period from 2003-2012 are presented in Statement 8, 9 and 10 respectively.
60.0
80.0
100.0
120.0
140.0
160.0
180.0
200.0
220.0
19
81
19
82
19
83
19
84
19
85
19
86
19
87
19
88
19
89
19
90
19
91
19
92
19
93
19
94
19
95
19
96
19
97
19
98
19
99
20
00
20
01
20
02
20
03
20
04
20
05
20
06
20
07
20
08
20
09
20
10
20
11
20
12
Nu
mb
er
of
Re
gis
tere
d L
ive
Bir
ths
(in
lak
hs)
Chart 1: Number of Registered Live Births, 1981-2012
20.0
30.0
40.0
50.0
60.0
19
81
19
82
19
83
19
84
19
85
19
86
19
87
19
88
19
89
19
90
19
91
19
92
19
93
19
94
19
95
19
96
19
97
19
98
19
99
20
00
20
01
20
02
20
03
20
04
20
05
20
06
20
07
20
08
20
09
20
10
20
11
20
12
Nu
mb
er
of
Re
gis
tere
d D
ea
ths
(in
la
kh
s)
Chart 2: Number of Registered Deaths, 1981-2012

21
Statement 8: Number of registered births by States/ Union Territories, 2003-2012
Sl.
No.
India/ State/
Union Territory
Number of registered births
2003 2004 2005 2006 2007 2008 2009 2010 2011 2012
India 15290261 15777612 16394625 18121295 19469756
19993799
21292574 21430434 21836920 21951519
States
1 Andhra Pradesh 913607 952629 933498 1124280 1184555 1179114 1164942 1192721 1186895 1122879
2 Arunachal Pradesh 27416 22920 19974 29437 26940 33091 30828 37110 32513 41619
3 Assam 421511 474737 505966 528559 544321 554997 580027 732788 600656 612576
4 Bihar 156625 307181 460746 553998 713433 858936 1223561 1268550 1626655 2058637
5 Chhattisgarh 322143 333004 384815 391804 381247 285886 301153 315082 334288 448675
6 Goa 24757 24869 24631 22971 22396 22577 21495 21168 21995 22339
7 Gujarat 1097119 1236195 1154608 1254293 1261262 1315978 1345861 1327404 1280441 1276330
8 Haryana 434852 470531 471968 508970 511973 536521 538910 544620 563557 564280
9 Himachal Pradesh 133062 137473 134664 140329 133157 135575 137328 134719 129263 127611
10 Jammu & Kashmir 123883 128296 132635 136747 139795 144912 146410 145385 146370 n.a.
11 Jharkhand 179664 215442 255325 285562 349079 409037 406657 443182 479632 489953
12 Karnataka 1001749 988520 1007868 1046531 1046424 1082450 1076383 1071518 1108562 1124490
13 Kerala 549719 558933 555122 556326 545154 535738 544348 546964 559828 544388
14 Madhya Pradesh 789985 981723 1027916 1266936 1412344 1632402 1618379 1605729 1688046 1710508
15 Maharashtra 1863585 1688893 1694344 1717571 1771368 1963281 1976493 1937727 1925204 1956286
16 Manipur 22667 23741 24231 24851 26431 26532 26722 28487 28762 30172
17 Meghalaya 43521 39035 76396 68828 62183 65837 78129 87103 92994 102012
18 Mizoram 20301 20222 20133 22141 22838 23294 25535 25752 25420 26042
19 Nagaland 41917 45129 47279 47027 42247 49133 42679 45269 45669 45709
20 Odisha 697766 696217 734474 754723 751163 747370 738772 767060 785524 790648
21 Punjab 476527 480088 485625 494830 495063 506704 516246 507665 511058 478176
22 Rajasthan 828107 996765 1149817 1445675 1480684 1532705 1659437 1745057 1728321 1757693
23 Sikkim 11057 11354 10886 10825 9957 9650 9512 8424 8588 8591
24 Tamil Nadu 1088659 1091016 1071863 1054929 1073635 1053826 1058142 1065271 1157979 1205092
25 Tripura 38520 57747 n.a. 52768 n.a. n.a. n.a. 40511 44615 46449
26 Uttar Pradesh 1903188 1610172 1939790 2514834 3416225 3228841 4111043 3906734 3641066 3237346
27 Uttarakhand n.a. 111271 117265 111755 126708 125645 132094 136196 146295 148078
28 West Bengal 1693078 1681102 1542634 1540222 1505964 1510306 1337034 1295324 1495880 1530332
Union Territories
1 A & N Islands 6242 6318 5594 6103 6018 6074 5887 5785 5613 5448
2 Chandigarh 20353 22179 22776 23923 24341 24731 24248 24965 25723 26947
3 D & N Haveli 6775 5524 5999 6290 6405 6572 7325 6316 6865 6678
4 Daman & Diu 4572 4223 3924 4031 4082 4174 4254 4044 4127 4226
5 Delhi 301165 305974 324336 322750 322044 333908 354482 359463 353759 360473
6 Lakshadweep 1065 936 1039 1020 923 818 668 675 734 734
7 Puducherry 45104 47253 46484 49456 49397 47184 47590 45666 44023 40102

22
Statement 9: Number of registered deaths by States/ Union Territories, 2003-2012
Sl.
No.
India/State/Union
Territory
Number of registered deaths
2003 2004 2005 2006 2007 2008 2009 2010 2011 2012
0. India 4569026 4487886 4602727 5298279 5804922 5638131 5677705 5690549 5735082 5850176
States
1. Andhra Pradesh 374679 375521 354261 403800 427698 412561 434064 415050 420646 405909
2. Arunachal Pradesh 1276 1520 1364 1405 1609 1598 1580 2593 1560 1711
3. Assam 70862 72025 86740 91858 77458 80211 99165 103943 111054 111676
4. Bihar 92776 129689 157791 172789 176040 168133 137801 108705 155176 243466
5. Chhattisgarh 133775 128377 140115 140962 151146 107017 109230 115544 114842 142123
6. Goa 10949 11164 11373 11980 11966 11515 11513 11998 11326 12067
7. Gujarat 257514 274560 251699 297787 305752 311990 317985 323689 324080 315236
8. Haryana 127611 123803 112478 123501 133581 143929 141681 147113 153530 160633
9. Himachal Pradesh 37453 36386 37659 40337 39915 42386 42393 41798 42524 44271
10. Jammu & Kashmir 29678 30127 31007 31756 34489 35265 35997 35360 35425 n.a.
11. Jharkhand 73344 83987 94597 98743 100569 96798 107940 107916 116615 112814
12. Karnataka 359661 343644 364415 387604 381890 372062 373290 381743 384745 407015
13. Kerala 194264 199017 204157 219094 238691 221769 232020 238864 244295 237615
14. Madhya Pradesh 324460 308225 310299 339943 330922 304783 322335 325118 351621 359342
15. Maharashtra 602711 498807 543052 568611 603112 629770 633206 663383 624791 651731
16. Manipur 3567 4182 4769 4195 4975 3323 4296 4157 4253 4458
17. Meghalaya 7322 11227 9790 12747 11235 10850 14842 13863 14848 14310
18. Mizoram 4697 4661 4686 4697 4907 5587 5942 5365 5484 6503
19. Nagaland 5423 6049 6349 7239 6204 7347 6465 6836 6961 6996
20. Odisha 247789 235291 253413 249427 260843 272417 284146 278710 277484 291027
21. Punjab 164258 149965 158257 163549 173989 183141 185930 186519 187675 193882
22. Rajasthan 266034 297562 283813 315308 323587 328953 337248 370460 360560 356946
23. Sikkim 2564 2686 2644 2717 2720 2890 3125 3035 3094 3510
24. Tamil Nadu 420107 408799 419119 443503 433970 429981 447900 472450 476709 496876
25. Tripura 10597 14202 n.a. 13698 n.a. n.a. n.a. 7810 8911 9527
26. Uttar Pradesh 312402 297681 334152 720950 1117312 927328 868240 813822 751596 668780
27. Uttarakhand n.a. 24483 28112 24378 28673 27990 29696 29127 29300 33654
28. West Bengal 322298 305695 276699 279321 293114 360977 346630 319581 371079 420014
Union Territories
1. A. N. Islands 1547 1607 1633 1953 1889 1824 1899 2000 2073 2179
2. Chandigarh 9626 9471 10852 11455 12690 14098 14918 15105 15713 16203
3. D & N Haveli 1092 1038 1002 1122 1165 1187 1201 1216 1302 1201
4. Daman & Diu 945 924 839 956 1030 962 1017 1012 1298 1068
5. Delhi 87743 85378 94187 98908 100974 107600 112013 124353 112142 104616
6. Lakshadweep 353 327 313 390 347 370 316 289 292 292
7. Puducherry 9649 9806 11091 11596 10460 11519 11681 12022 12078 12525

23
Statement 10: Number of registered infant deaths by States/ Union Territories, 2003-2012
Sl.
No.
India/ States/ Union
Territory
Number of registered infant deaths
2003 2004 2005 2006 2007 2008 2009 2010 2011 2012
0. India 165029 152113 159230 133333 152460 175207 180865 175250 178172 159060
States
1. Andhra Pradesh 7030 5846 5346 3978 6509 7418 10254 5048 9586 7561
2. Arunachal Pradesh 9 16 17 4 18 6 8 1 5 6
3. Assam 366 204 216 n.a. 315 1033 2319 n.a. 5016 620
4. Bihar 1858 2130 n.a. n.a. n.a. n.a. 8487 10220 n.a. n.a.
5. Chhattisgarh 8493 7525 6335 3806 4317 1914 1855 2025 2716 n.a.
6. Goa 289 329 320 234 218 291 332 202 188 215
7. Gujarat 8579 8612 11294 9570 9467 8301 9578 8954 8468 8223
8. Haryana 4034 4279 4125 4074 5044 5676 5326 5793 6873 6692
9. Himachal Pradesh 1441 1260 1364 1451 1170 1158 1024 976 1012 1034
10. Jammu & Kashmir 1883 1743 1758 1792 1799 1728 1774 1693 1632 n.a.
11. Jharkhand n.a. n.a. n.a. n.a. n.a. n.a. n.a. n.a. n.a. n.a.
12. Karnataka 10063 9767 9069 10304 11726 12875 13394 13199 10231 13435
13. Kerala 2459 2391 4109 4508 4622 4060 3724 4059 4218 4352
14. Madhya Pradesh 16360 19786 15894 14399 10804 10053 11676 13854 13437 12658
15. Maharashtra 25579 20474 22379 n.a. 15328 21144 23550 21778 19339 21734
16. Manipur 135 172 188 262 398 184 222 191 347 392
17. Meghalaya 856 844 1204 2617 1789 1877 2509 1984 2308 2173
18. Mizoram 285 457 444 477 681 896 971 854 856 933
19. Nagaland 106 115 109 122 98 80 71 76 72 116
20. Odisha 24397 23864 22996 24642 25689 25494 21638 20482 17808 18001
21. Punjab 4261 2469 2320 1894 2200 2199 2138 3090 3417 3216
22. Rajasthan 7212 7880 8799 7724 8679 8294 7620 9495 9713 15324
23. Sikkim 135 178 196 212 221 138 143 143 173 134
24. Tamil Nadu 12525 10762 11130 9824 11952 10432 8839 9204 10061 10321
25. Tripura 21 1 n.a. n.a. n.a. n.a. n.a. 240 n.a. 884
26. Uttar Pradesh n.a. n.a. n.a. 8144 3588 14374 20156 17781 22823 n.a.
27. Uttarakhand n.a. 667 434 859 888 836 1133 899 653 461
28. West Bengal 19010 14190 22125 13702 14335 25524 12478 11988 16304 18669
Union Territories
1. A. & N. Islands 137 121 114 100 150 101 114 118 112 136
2. Chandigarh 928 735 1005 1086 1111 1545 1662 1815 1892 2140
3. D & N Haveli 63 75 53 64 52 47 50 53 29 21
4. Daman & Diu 3 6 11 8 11 6 11 8 13 9
5. Delhi 5245 4003 4182 5825 8194 6138 6721 8078 7752 8628
6. Lakshadweep 24 19 7 20 15 10 13 12 9 9
7. Puducherry 1243 1193 1687 1631 1072 1375 1075 937 1109 963

24
3.8 Sex-wise Distribution of Registered Vital Events, 2012
Sex No. of Registered
Births
% No. of Registered Deaths %
Male 10160507 52.4 3285733 58.6
Female 9238820 47.6 2320081 41.4
Person* 19399327 100.0 5605814 100.0
*: Does not include the cases of sex not reported, so does not match with total registered deaths.
3.8.1 Chart 3 on sex wise distribution of registered births reveal that share of female registered births
is about 4 per cent short of registered male births. The figures exclude Bihar, Jammu & Kashmir and
Lakshadweep due to non-receipt of information on gender wise registered births during 2012.
3.8.2 On the other hand, in case of death registration, the chart 4 shows the share of male registration
is about 18 per cent more than female. These figures have been arrived after excluding the incomplete
figure of Bihar, Jammu & Kashmir and Lakshadweep.
3.9 Sex-wise Distribution of Registered Vital Events of Major States
3.9.1 Chart 5 and 6 respectively shows the sex-wise distribution of registered births and deaths for the
major States. Sex-wise distribution of birth reveals that the share of male registration is more than the
female in almost all of these major States. This gap is much wider for Maharashtra, Madhya Pradesh,
Rajasthan and Uttar Pradesh. Similar pattern can also be seen in case of death registration. State-wise
figures have been appended in Statement 11 below.
Male
52%
Female
48%
Chart 3: Sex-wise Distribution of Registered Births, 2012
Male
59%
Female
41%
Chart 4: Sex-wise Distribution of Registered Deaths, 2012

25
Statement 10: Sex-wise Registered Births and Deaths of Major States (in’000), 2012
Sl. No. States Registered Births Registered Deaths
Male Female Male Female
1. Andhra Pradesh 565.6 557.3 229.2 176.7
2. Assam 327.3 285.3 59.6 52.1
3. Chhattisgarh 235.3 210.5 84.7 56.8
4. Gujarat 671.0 605.4 195.2 120.0
5. Haryana 308.1 256.2 101.5 59.1
6. Karnataka 570.4 554.1 247.8 159.3
7. Kerala 278.5 265.9 128.8 108.8
8. Madhya Pradesh 894.7 815.8 200.9 158.4
9. Maharashtra 1032.9 923.4 381.8 270.0
10. Odisha 413.5 370.6 163.6 127.4
11. Punjab 259.3 218.9 117.2 76.6
12. Rajasthan 944.4 813.3 213.5 143.5
13. Tamil Nadu 633.0 572.1 289.7 207.2
14. Uttar Pradesh 1878.0 1359.0 387.9 280.9
15. Uttarakhand 80.2 67.9 20.1 13.6
16. West Bengal 794.7 735.6 246.2 173.8
0.0
20.0
40.0
60.0
80.0
100.0
120.0
140.0
160.0
180.0
200.0
An
dh
ra P
rad
esh
Ass
am
Ch
ha
ttis
ga
rh
Gu
jara
t
Ha
rya
na
Ka
rna
tak
a
Ke
rala
Ma
dh
ya
Pra
de
sh
Ma
ha
rash
tra
Od
ish
a
Pu
nja
b
Ra
jast
ha
n
Ta
mil
Na
du
Utt
ar
Pra
de
sh
Utt
ara
kh
an
d
We
st B
en
ga
l
Nu
mb
er
of
Re
gis
tere
d B
irth
s (i
n '
00
00
)
Chart 5: Sex-wise Registered Births of Major States, 2012
Male Female

26
3.10 Distribution of registered births and deaths vis-à-vis estimated births
and deaths for the period 2003-2012
3.10.1 The time series data on registered births and deaths for the years 2003 to 2012 reveals a
significant growth in coverage of registration. Share of birth registration has crossed the level of 80
percent and has reached to 84.4 percent during 2012 which is good indication for the system of Civil
Registration. In case of death registration, this share has been reduced during 2008-2009 as compared
to 2007 due to less reporting of registered death events from some of the major States. However in
2012, death registration has reached 69.3 percent. During 2012, out of the total 26.2 and 8.5 million
estimated births and deaths, 21.9 and 5.8 million births and deaths respectively have got registered
during 2012.
0.0
50.0
100.0
150.0
200.0
250.0
300.0
350.0
400.0
An
dh
ra
Pra
de
sh
Ass
am
Ch
ha
ttis
ga
rh
Gu
jara
t
Ha
rya
na
Ka
rna
tak
a
Ke
rala
Ma
dh
ya
Pra
de
sh
Ma
ha
rash
tra
Od
ish
a
Pu
nja
b
Ra
jast
ha
n
Ta
mil
Na
du
Utt
ar
Pra
de
sh
Utt
ara
kh
an
d
We
st B
en
ga
l
Nu
mb
er
of
Re
gis
tere
d B
irth
s (i
n '0
00
) Chart 6: Sex-wise Registered Deaths of Major States, 2012
Male Female
100.0
120.0
140.0
160.0
180.0
200.0
220.0
240.0
260.0
2003 2004 2005 2006 2007 2008 2009 2010 2011 2012
Est
ima
ted
an
d R
eg
iste
red
Bir
ths
(in
La
kh
s)
Chart 7: Estimated and Registered Births, 2003-2012
Estimated Births
Registered Births

27
3.11 Distribution of estimated and registered events in Major States
Statement 11: Total Registered and Estimated Births & Deaths of Major States, 2012
Sl. No. States Estimated
Births
Registered
Births
Estimated
Deaths
Registered
Deaths
1. Andhra Pradesh 1500520 1122879 634506 405909
2. Assam 699098 612576 245461 111676
3. Bihar 2754959 2058637 656416 243466
4. Chhattisgarh 605028 448554 195091 142123
5. Gujarat 1267308 1276330 396409 315236
6. Haryana 561470 564280 166362 160633
7. Jharkhand 791635 489953 217940 112814
8. Karnataka 1114237 1124490 427626 407015
9. Kerala 519742 544388 240686 237615
10. Madhya Pradesh 1961218 1710508 597213 359342
11. Maharashtra 1903970 1956286 722591 651731
12. Odisha 820358 790648 350404 291027
13. Punjab 446520 478176 190964 193882
14. Rajasthan 1793575 1757693 457050 356946
15. Tamil Nadu 1067631 1205092 503215 496876
16. Uttar Pradesh 5628672 3237346 1581780 668780
17. Uttarakhand 187424 148078 61799 33654
18. West Bengal 1458580 1530332 570749 420014
30.0
40.0
50.0
60.0
70.0
80.0
90.0
2003 2004 2005 2006 2007 2008 2009 2010 2011 2012
Est
ima
ted
an
d R
eg
iste
red
De
ath
s (i
n L
ak
hs)
Chart 8: Estimated and Registered Deaths, 2003-2012
Estimated Deaths
Registered Deaths

28
3.11.1 In the analysis, States having population less than a million have not been taken into
consideration. On comparison of estimated and registered births, it is found that there is significant gap
in estimated and registered births in Andhra Pradesh, Bihar, Chhattisgarh, Jharkhand and Uttar Pradesh.
The States of Maharashtra, Tamil Nadu and West Bengal have registered births more than estimated
births. This may be partly due to better medical facilities available in these States as compared to
neighboring States. Chart 9 shows the distribution of estimated and registered births respectively in
major States.
3.11.2 On comparison of estimated and registered deaths, it is found that there is significant gap in
estimated and registered deaths in Andhra Pradesh, Assam, Bihar, Chhattisgarh, Jharkhand, Madhya
Pradesh, Uttar Pradesh, Uttarakhand and West Bengal. Death registration in major States such as Assam,
Bihar, Chhatisgarh, Jammu & Kashmir, Jhakhand, Madhya Pradesh, Uttar Pradesh, Uttarakhand and West
Bengal need to be improved. Chart 10 shows the distribution of estimated and registered deaths
respectively in major States.
0
10
20
30
40
50
60
An
dh
ra P
rad
esh
Ass
am
Bih
ar
Ch
ha
ttis
ga
rh
Gu
jara
t
Ha
rya
na
Jha
rkh
an
d
Ka
rna
tak
a
Ke
rala
Ma
dh
ya
Pra
de
sh
Ma
ha
rash
tra
Od
ish
a
Pu
nja
b
Ra
jast
ha
n
Ta
mil
Na
du
Utt
ar
Pra
de
sh
Utt
ara
kh
an
d
We
st B
en
ga
l
x 1
00
00
0
Chart 9: Share of Major States in Total Registered & Estimated Births, 2012
Estimated Births Registered Births
0
2
4
6
8
10
12
14
16
An
dh
ra P
rad
esh
Ass
am
Bih
ar
Ch
ha
ttis
ga
rh
Gu
jara
t
Ha
rya
na
Jha
rkh
an
d
Ka
rna
tak
a
Ke
rala
Ma
dh
ya
Pra
de
sh
Ma
ha
rash
tra
Od
ish
a
Pu
nja
b
Ra
jast
ha
n
Ta
mil
Na
du
Utt
ar
Pra
de
sh
Utt
ara
kh
an
d
We
st B
en
ga
l
x 1
00
00
0
Chart 10: Share of Major States in Total Registered & Estimated Deaths, 2012
Estimated Deaths Registered Deaths

29
3.12 Medical attention received at the time of birth and death
3.12.1 The data on live birth by type of medical attention received at the time of delivery has been
reported from 22 States/UTs and the combined distribution of medical attention received at the time of
birth of these States/UTs has been presented in Chart 11. Chart 11 shows that majority of live births
have been occurred in an institution, either in Government or private hospitals. Institutional births
occurred in about 68% of cases, 12.5% of the cases were attended by the Physicians/Nurse/Midwife and
about 7% of registered births were domiciliary in the year 2012. Other than these, in spite of having
enough better medical facilities about 4% of the events are still attended by untrained Mid-
wife/Dai/others.
3.12.2 Chart 12 represents the distribution of medical attention, received by the deceased at the time of
death on the basis of data received from 21 States/UTs. It is evident from Chart 12 that 42% of the total
registered deaths have occurred in institutions which is on higher than that of other places from where
the deceased had received medical attention. About 10% of the total registered deaths during 2011 have
received medical attention from qualified allopathic professional and17.4% of deceased did not receive
any medical attention at the time of death.
3.13 Infant Deaths
3.13.1 Statement 12 presents the infant deaths registered by place of occurrence (Rural /Urban) of the
event for the year 2012. It may be observed that share of rural area is only 28.6% and urban area is
71.4% in total infant deaths registered during the year. Non registration of infant deaths in rural area is
Institutional
68.4%
Domiciliary
7.0%
Physician/Nu
rse/ Mid Wife
12.5%
Un-Trained
Midwife/Dai
3.9%
Others
7.8%
Not Available
0.4%
Chart 11: Medical attention at the time of birth, 2012
Institutional
41.9%
Qualified
Medical
Practioner
allopathy
3.5%
Qualified
Medical
Practioner
other system
10.1%
Others
26.4%
No Medical
Attention
17.4%
Not Available
0.8%
Chart 12: Medical attention at the time of death, 2012

30
a cause of concern which may be due to non-reporting of infant deaths to the Registrars especially
domiciliary events. This figure is exclusive of returns of Bihar, Chhattisgarh, Jammu & Kashmir,
Jharkhand and Uttar Pradesh because the information on registered infant deaths for the year 2012 has
not been received from these 5 States. Share of infant deaths to total registered deaths is more in urban
area as compared to rural area. Statement 13 gives the percentage distribution of sex wise infant deaths
which shows that female infant deaths are reported more than male infant deaths.
Statement 12: Percentage distribution of registered infant deaths by place of occurrence, 2012
Place of
occurrence
No. of
Registered
Deaths
No. of
Registered
Infant Deaths
% share of registered Infant
Deaths by place of
occurrence
% of Registered Infant
deaths to total registered
deaths
Rural 3273688 45636 28.7 1.4
Urban 2576488 113424 71.3 4.4
Total 5850176 159060 100.0 2.7
Statement 13: Percentage distribution of infant deaths by sex, 2012
Sex No. of Registered Deaths No. of Registered Infant
Deaths
% of Infant deaths to total
registered deaths
Male 3285733 90229 2.7
Female 2320081 68794 3.0
Person* 5850176 159060 2.7
*: Includes the cases of sex not reported, so does not match with the addition of male and female.
3.14 Still Births
3.14.1 The birth of a baby that has died in the womb after having survived through at least the first 28
weeks of pregnancy i.e. a still birth occurs when a fetus has died in the uterus. Still birth also known as
fetal death has been defined as ‘death prior to the complete expulsion or extraction from its mother of a
product of human conception, irrespective of the duration of pregnancy and which is not an induced
termination of pregnancy. The death is indicated by the fact that after such expulsion or extraction, the
fetus does not breathe or show any other evidence of life, such as beating of the heart, pulsation of the
umbilical cord, or definite movement of voluntary muscles. Heartbeats are to be distinguished from
transient cardiac contractions; respirations are to be distinguished from fleeting respiratory efforts or
gasps.’
3.14.2 Statement 14 presents still births registered by place of occurrence (Rural /Urban) of the event
for the year 2012 and it may be observed that in total registered still births, share of rural registered
births is only 28.0% which may be due to poor netting of still births in rural areas. In urban areas, this
share is about 72.0% due to better netting of still births from medical institutions. Non registration of
still births in rural area is a cause of concern. This total still birth is based on registered events from 26
States/UTs. State-wise registered still births has been depicted in Table 4.

31
Statement 14: Still Births registered during 2012
Place of
occurrence No. of Registered Still Births
% share of registered still births by
place of occurrence
Rural 27472 28.0
Urban 70700 72.0
Total 98172 100.0
3.15 Analysis and Findings
3.15.1 Level of Registration (LOR)
3.15.1.1 The level of registration, defined as the percentage of registered births/deaths to the
births/deaths estimated through SRS, determines the performance level of a State / Union Territory in
respect of registration of births and deaths. In the absence of reliable estimates of number of births and
deaths on a year to year basis from any other source, the number of events as revealed from SRS is used
to calculate the level of registration. The level of registration so calculated is very high for some of the
smaller States/Union Territories either due to the lower estimates of vital events than the actual and
due to the fact that SRS estimates of vital events are based on the place of usual residence while events
are registered at the place of occurrence irrespective of the place of residence.
3.15.1.2 In the absence of number of registered events of Jammu & Kashmir for the year 2012, the
same for the year 2011 has been used for the calculation of level of registration for the year 2012. This
has been done to ensure that the level of registration for the country as a whole for the year 2012 is not
devoid of non-reporting of registration data by the State.
3.15.1.3 The levels of registration of births and deaths for India and States/UTs for the period
2003 to 2012 are presented in Statements 15 and 16 respectively. The level of registration of births has
increased to 84.4 percent in 2012 from 57.7 percent in 2003 i.e. in last 10 years an increase of about 27
per cent has been shown in birth registration. The level of registration of deaths has also increased to
69.3 percent in 2012 from 53.5 percent during the corresponding period. Chart 13 depicts the trend of
level of registration of births and deaths from 2003 to 2012. The level of registration for births has
recorded sharp exponential increase after 2005 and has shown consistent improvement over the years.
However, the existing gap of about 16 percent in case of registration of births and about 31 percent for
registration of deaths at all India level remains a cause of concern. In order to universalize the
registration of events, a mission mode approach is required especially in the poor performing States.

32
3.15.1.3 Statement 15 reveals that the States/UTs continue to function at different levels of
registration efficiency during 2003-2012. The level of registration of births in some States is highly
erratic even after more than 40 years of enactment of the Registration of Births and Deaths Act, 1969.
Statement 15: Level of Registration of Births, 2003-2012
Sl. No. India/ States/ UTs 2003 2004 2005 2006 2007 2008 2009 2010 2011 2012
India 57.7 60.4 62.5 69.0 74.5 76.4 81.3 82.0 83.6 84.4
States
1. Andhra Pradesh 57.1 63.2 61.0 73.4 77.4 77.5 76.3 79.1 79.8 74.8
2. Arunachal Pradesh 100.0 94.3 73.9 100.0 100.0 100.0 100.0 100.0 100.0 100.0
3. Assam 58.0 67.5 71.2 74.6 76.8 78.5 82.1 100.0 85.8 87.6
4. Bihar 5.9 11.5 16.9 20.3 26.2 31.6 45.0 46.6 59.8 74.7
5. Chhattisgarh 59.0 55.2 63.3 64.1 62.4 46.8 49.4 51.8 55.1 74.2
6. Goa 100.0 100.0 100.0 100.0 97.9 100.0 95.0 100.0 92.6 100.0
7. Gujarat 84.6 94.9 89.5 96.6 97.8 100.0 100.0 100.0 100.0 100.0
8. Haryana 74.6 83.0 84.3 90.8 91.6 95.9 96.0 97.1 100.0 100.0
9. Himachal Pradesh 100.0 100.0 100.0 100.0 100.0 100.0 100.0 100.0 100.0 100.0
10. Jammu & Kashmir 63.3 64.3 64.8 66.5 66.0 68.2 68.7 68.4 69.9 69.8
11. Jharkhand 24.3 28.8 32.9 37.0 44.7 52.3 51.6 56.2 60.7 61.9
12. Karnataka 84.3 85.8 87.6 92.2 92.0 94.6 94.5 94.6 98.9 100.0
13. Kerala 100.0 100.0 100.0 100.0 100.0 100.0 100.0 100.0 100.0 100.0
14. Madhya Pradesh 41.4 51.1 53.3 65.2 72.9 84.3 83.1 82.3 86.5 87.2
15. Maharashtra 93.1 86.6 85.9 88.1 91.5 100.0 100.0 100.0 100.0 100.0
16. Manipur 65.5 75.5 72.0 80.0 77.2 70.7 72.2 57.2 81.2 83.1
17. Meghalaya 73.8 64.0 100.0 100.0 100.0 100.0 100.0 100.0 100.0 100.0
18. Mizoram 100.0 100.0 100.0 100.0 100.0 100.0 100.0 100.0 100.0 100.0
19. Nagaland 100.0 100.0 100.0 100.0 100.0 100.0 100.0 100.0 100.0 100.0
57.760.4
62.5
69.0
74.5
76.4
81.3 82.083.6 84.4
53.555.2 55.0
63.2
69.366.4 66.9 66.9 67.4
69.3
45.0
50.0
55.0
60.0
65.0
70.0
75.0
80.0
85.0
90.0
2003 2004 2005 2006 2007 2008 2009 2010 2011 2012
Le
ve
l o
f R
eg
istr
ati
on
(in
%)
Chart 13: Level of Registration of Births and Deaths, 2003-2012
LOR (Births) LOR (Deaths)

33
20. Odisha 80.2 80.2 85.3 88.3 88.7 87.8 87.6 92.4 95.6 96.4
21. Punjab 92.0 100.0 100.0 100.0 100.0 100.0 100.0 100.0 100.0 100.0
22. Rajasthan 46.2 56.9 65.3 81.5 83.2 85.9 92.4 97.4 96.7 98.0
23. Sikkim 90.6 100.0 95.8 97.5 93.9 88.4 87.6 77.8 79.3 80.3
24. Tamil Nadu 93.3 99.3 100.0 99.7 100.0 99.4 97.3 99.8 100.0 100.0
25. Tripura 80.6 100.0 100.0 100.0 89.1 97.8 100.0 75.8 85.9 91.0
26. Uttar Pradesh 34.9 29.4 35.3 45.3 61.6 58.0 73.5 69.6 64.9 57.5
27. Uttarakhand 73.3 60.5 61.5 57.4 66.0 65.4 69.1 71.6 77.5 79.0
28. West Bengal 100.0 100.0 97.0 97.9 97.3 98.9 88.2 86.7 100.0 100.0
Union Territories
1. A. & N. Islands 95.6 94.6 86.9 91.7 87.0 79.2 76.8 76.5 97.6 95.3
2. Chandigarh 100.0 100.0 100.0 100.0 100.0 100.0 100.0 100.0 100.0 100.0
3. D& N Haveli 96.8 78.9 79.4 82.6 80.6 79.8 83.5 69.0 73.1 71.9
4. Daman & Diu 100.0 100.0 98.3 99.6 99.3 99.0 87.9 81.8 91.2 96.1
5. Delhi 100.0 100.0 100.0 100.0 100.0 100.0 100.0 100.0 100.0 100.0
6. Lakshadweep 82.4 66.5 76.6 73.9 68.2 77.3 59.4 62.9 76.8 75.1
7. Puducherry 100.0 100.0 100.0 100.0 100.0 100.0 100.0 100.0 100.0 100.0
Note: n.c. – not calculated and n.a. – not available
3.15.1.4 Chart 14 portrays the level of registration of births for India and States/UTs for the year
2012. 17 States/UTs namely Arunachal Pradesh, Goa, Gujarat, Haryana, Himachal Pradesh, Kerala,
Maharashtra, Meghalaya, Mizoram, Nagaland, Punjab, Tamil Nadu, West Bengal, Chandigarh, Delhi and
Puducherry have recorded cent percent registration of births in 2012.
40.0
60.0
80.0
100.0
Utt
ar
Pra
de
sh
Jha
rkh
an
d
Jam
mu
& K
ash
mir
D &
N H
av
eli
Ch
ha
ttis
ga
rh
Bih
ar
An
dh
ra P
rad
esh
La
ksh
ad
we
ep
Utt
ara
kh
an
d
Sik
kim
Ma
nip
ur
Ind
ia
Ma
dh
ya
Pra
de
sh
Ass
am
Tri
pu
ra
A &
N I
sla
nd
s
Da
ma
n &
Diu
Od
ish
a
Ra
jast
ha
n
Aru
na
cha
l P
rad
esh
Go
a
Gu
jara
t
Ha
rya
na
Him
ach
al
Pra
de
sh
Ka
rna
tak
a
Ke
rala
Ma
ha
rash
tra
Me
gh
ala
ya
Miz
ora
m
Na
ga
lan
d
Pu
nja
b
Ta
mil
Na
du
We
st B
en
ga
l
Ch
an
dig
arh
De
lhi
Pu
du
che
rry
Le
ve
l o
f R
eg
istr
ati
on
of
Bir
ths
(in
%)
Chart 14: Level of Registration of Births of States/UTs, 2012
50-80 (9)
Cent Percent (17)80-99.9 (9)

34
3.15.1.5 7 States/UTs namely, Himachal Pradesh, Kerala, Mizoram, Nagaland, Chandigarh, Delhi
and Puducherry have maintained their level of registration of births as cent percent since last 10 years.
22 States/UTs have recorded their level of registration of births above the level of 90 per cent. 24
States/UTs have recorded their level of registration of births higher than the National level and on the
other side, this number is 11. Statement 5 shows that the States of Sikkim, Tripura and the UT of A & N
Islands, D & N Haveli, Daman & Diu and Lakshadweep where the level of reporting is cent percent, the
level of registration of birth has not achieved the target of cent percent which may be due to less
registration of birth events/differences in the actual and projected Mid- Year Population.
3.15.1.6 Statement 16 shows that the level of registration of deaths in the country and the States.
In 2012, Goa, Mizoram, Punjab, Delhi, A &N, Chandigarh, Puducherry and Sikkim are the only States
recording cent percent registration of deaths followed by the States of Tamil Nadu, Kerala, Haryana,
Himachal Pradesh, Nagaland, Karnataka, Daman & Diu and Maharashtra reporting more than 90 percent
registration of deaths. The Union Territories of Chandigarh, Delhi and Puducherry have maintained cent
percent level of registration of deaths during last 10 years. 23 States/UTs have recorded their level of
registration of deaths higher than the National level and on the other side, there are 12 States/ UTs.
Chart 15 depicts the level of registration of deaths for India and States/UTs for the years 2012.
20.0
40.0
60.0
80.0
100.0
Aru
na
cha
l P
rad
esh
Bih
ar
Utt
ar
Pra
de
sh
Ma
nip
ur
Ass
am
Jha
rkh
an
d
Tri
pu
ra
Utt
ara
kh
an
d
Jam
mu
& K
ash
mir
Ma
dh
ya
Pra
de
sh
An
dh
ra P
rad
esh
La
ksh
ad
we
ep
Ind
ia
Me
gh
ala
ya
Ch
ha
ttis
ga
rh
D &
N H
av
eli
We
st B
en
ga
l
Ra
jast
ha
n
Gu
jara
t
Od
ish
a
Ma
ha
rash
tra
Da
ma
n &
Diu
Ka
rna
tak
a
Na
ga
lan
d
Him
ach
al
Pra
de
sh
Ha
rya
na
Ke
rala
Ta
mil
Na
du
A &
N I
sla
nd
s
Go
a
Pu
du
che
rry
Miz
ora
m
Pu
nja
b
Sik
kim
Ch
an
dig
arh
De
lhi
Le
ve
l o
f R
eg
istr
ati
on
of
De
ath
s (i
n %
)
Chart 15: Level of Registration of Deaths of States/UTs, 2012
Below 50 (5)
Cent Percent (8)80-99.9 (9)
50-80 (13)

35
Statement 16: Level of Registration of Deaths, 2003-2012
Sl. No. India/ States/ UTs 2003 2004 2005 2006 2007 2008 2009 2010 2011 2012
0. India 53.5 55.2 55.0 63.4 69.3 66.4 66.9 66.9 67.4 69.3
States
1. Andhra Pradesh 59.8 67.7 60.5 68.3 70.6 66.6 68.4 64.8 66.0 64.0
2. Arunachal Pradesh 24.0 28.2 23.5 23.9 26.6 25.5 21.3 35.7 21.6 23.4
3. Assam 28.2 29.2 35.1 36.7 30.9 31.5 39.4 41.8 45.2 45.5
4. Bihar 13.5 18.1 21.7 24.6 25.3 24.5 20.6 16.5 23.6 37.1
5. Chhattisgarh 72.6 75.7 77.3 76.6 81.0 56.5 56.9 60.1 59.7 72.8
6. Goa 97.7 100.0 100.0 100.0 100.0 100.0 100.0 100.0 94.7 100.0
7. Gujarat 64.3 74.3 65.1 73.8 75.7 79.5 79.9 82.6 81.6 79.5
8. Haryana 81.1 83.0 72.9 81.0 84.7 85.8 86.8 88.6 92.3 96.6
9. Himachal Pradesh 84.3 84.5 85.2 91.6 85.8 86.5 88.1 89.7 93.1 96.1
10. Jammu & Kashmir 49.5 50.4 52.0 49.0 53.3 53.8 55.1 53.4 54.7 55.1
11. Jharkhand 32.6 36.8 41.3 44.7 46.1 45.0 50.1 49.4 53.5 51.8
12. Karnataka 91.7 90.3 91.9 96.7 91.6 87.0 88.8 91.1 90.9 95.2
13. Kerala 94.8 99.5 96.4 98.0 100.0 99.1 99.9 99.2 100.0 98.7
14. Madhya Pradesh 52.4 52.0 52.6 57.2 56.0 51.3 54.0 54.8 59.1 60.2
15. Maharashtra 83.2 78.8 78.1 80.6 85.5 87.9 85.9 91.4 87.6 90.2
16. Manipur 33.3 43.0 50.8 40.2 48.2 28.0 38.1 40.7 42.2 44.2
17. Meghalaya 41.4 63.6 53.3 64.2 59.7 54.1 71.3 67.5 72.4 70.7
18. Mizoram 100.0 96.7 97.9 89.9 98.1 100.0 100.0 100.0 100.0 100.0
19. Nagaland 69.6 78.8 79.5 70.9 57.6 73.3 81.4 85.1 93.4 95.7
20. Odisha 67.6 64.1 69.1 68.7 71.9 76.1 80.4 80.0 79.9 83.1
21. Punjab 93.3 91.9 91.4 91.9 93.8 94.8 97.8 97.0 99.3 100.0
22. Rajasthan 59.1 70.4 65.9 72.9 74.6 74.5 77.4 82.4 78.9 78.1
23. Sikkim 92.1 97.2 90.8 83.9 87.6 93.7 91.4 89.1 89.8 100.0
24. Tamil Nadu 86.7 84.8 87.4 90.5 91.6 87.7 100.0 92.6 95.3 98.7
25. Tripura 58.5 77.4 73.7 63.6 60.9 66.2 n.a 43.5 49.1 54.1
26. Uttar Pradesh 18.9 19.1 21.2 45.4 69.9 57.7 54.3 50.6 47.1 42.3
27. Uttarakhand 42.7 37.9 41.6 39.3 44.8 45.7 47.1 46.9 47.3 54.5
28. West Bengal 59.1 58.0 51.1 52.7 53.8 66.7 63.4 59.9 66.7 73.6
Union Territories
1. A. & N. Islands 72.3 100.0 84.7 90.3 95.8 83.7 98.5 95.9 100.0 100.0
2. Chandigarh 100.0 100.0 100.0 100.0 100.0 100.0 100.0 100.0 100.0 100.0
3. D & N Haveli 77.5 82.1 76.4 86.3 84.9 72.1 77.0 75.2 78.6 73.5
4. Daman & Diu 76.6 80.5 71.7 79.0 81.1 75.3 79.1 78.5 100.0 91.6
5. Delhi 100.0 100.0 100.0 100.0 100.0 100.0 100.0 100.0 100.0 100.0
6. Lakshadweep 99.8 64.9 70.0 83.5 72.1 70.4 72.6 60.2 70.2 69.1
7. Puducherry 100.0 100.0 100.0 100.0 100.0 100.0 100.0 100.0 100.0 100.0
Note: n.c. – not calculated and n.a. – not available
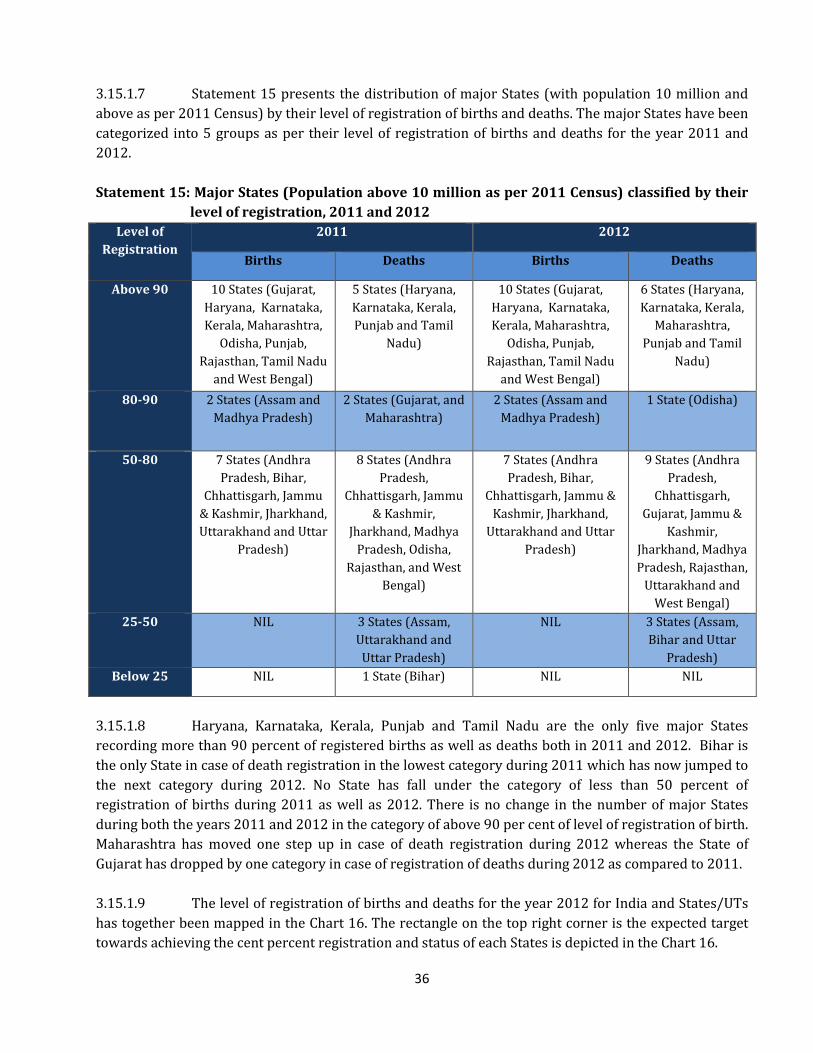
36
3.15.1.7 Statement 15 presents the distribution of major States (with population 10 million and
above as per 2011 Census) by their level of registration of births and deaths. The major States have been
categorized into 5 groups as per their level of registration of births and deaths for the year 2011 and
2012.
Statement 15: Major States (Population above 10 million as per 2011 Census) classified by their
level of registration, 2011 and 2012
Level of
Registration
2011 2012
Births Deaths Births Deaths
Above 90 10 States (Gujarat,
Haryana, Karnataka,
Kerala, Maharashtra,
Odisha, Punjab,
Rajasthan, Tamil Nadu
and West Bengal)
5 States (Haryana,
Karnataka, Kerala,
Punjab and Tamil
Nadu)
10 States (Gujarat,
Haryana, Karnataka,
Kerala, Maharashtra,
Odisha, Punjab,
Rajasthan, Tamil Nadu
and West Bengal)
6 States (Haryana,
Karnataka, Kerala,
Maharashtra,
Punjab and Tamil
Nadu)
80-90 2 States (Assam and
Madhya Pradesh)
2 States (Gujarat, and
Maharashtra)
2 States (Assam and
Madhya Pradesh)
1 State (Odisha)
50-80 7 States (Andhra
Pradesh, Bihar,
Chhattisgarh, Jammu
& Kashmir, Jharkhand,
Uttarakhand and Uttar
Pradesh)
8 States (Andhra
Pradesh,
Chhattisgarh, Jammu
& Kashmir,
Jharkhand, Madhya
Pradesh, Odisha,
Rajasthan, and West
Bengal)
7 States (Andhra
Pradesh, Bihar,
Chhattisgarh, Jammu &
Kashmir, Jharkhand,
Uttarakhand and Uttar
Pradesh)
9 States (Andhra
Pradesh,
Chhattisgarh,
Gujarat, Jammu &
Kashmir,
Jharkhand, Madhya
Pradesh, Rajasthan,
Uttarakhand and
West Bengal)
25-50 NIL 3 States (Assam,
Uttarakhand and
Uttar Pradesh)
NIL 3 States (Assam,
Bihar and Uttar
Pradesh)
Below 25 NIL 1 State (Bihar) NIL NIL
3.15.1.8 Haryana, Karnataka, Kerala, Punjab and Tamil Nadu are the only five major States
recording more than 90 percent of registered births as well as deaths both in 2011 and 2012. Bihar is
the only State in case of death registration in the lowest category during 2011 which has now jumped to
the next category during 2012. No State has fall under the category of less than 50 percent of
registration of births during 2011 as well as 2012. There is no change in the number of major States
during both the years 2011 and 2012 in the category of above 90 per cent of level of registration of birth.
Maharashtra has moved one step up in case of death registration during 2012 whereas the State of
Gujarat has dropped by one category in case of registration of deaths during 2012 as compared to 2011.
3.15.1.9 The level of registration of births and deaths for the year 2012 for India and States/UTs
has together been mapped in the Chart 16. The rectangle on the top right corner is the expected target
towards achieving the cent percent registration and status of each States is depicted in the Chart 16.
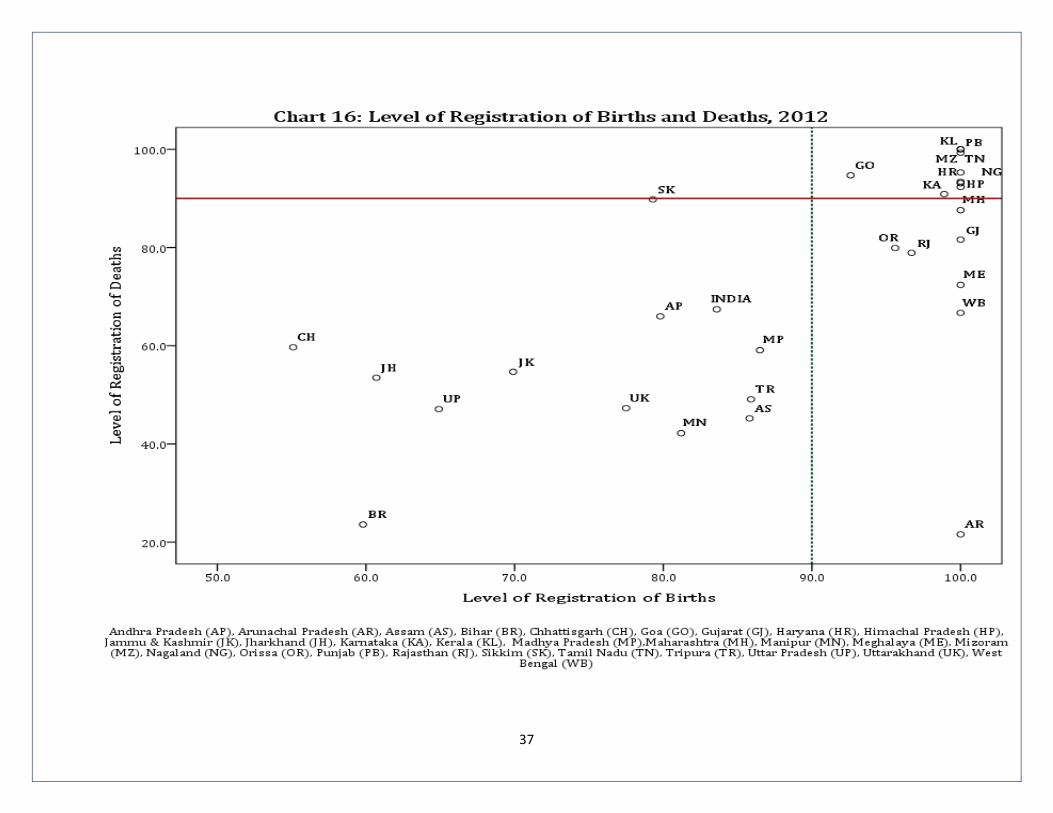
37

38
3.16 Level of Registration after excluding Uttar Pradesh and Bihar
3.16.1 In order to quantify the impact of Bihar and Uttar Pradesh, which are most populous and
performing abysmally poor for last so many years, the level registration for the country excluding
these two States have been worked out and mapped in Chart 17 from 2003 onwards. These two
States even after showing marginal improvement in functioning of Civil Registration during last
several years still suppresses the national figure for registration of both births and deaths by around
10 per cent.
3.17 Comparison of level of registration of births and deaths in EAG & Assam, Southern
States and Other States/UTs
3.17.1 In order to highlight the gap in the demographic profile of i) Empowered Action Group (EAG)
States & Assam, ii) Southern States and iii) other States/UTs, the level of registration for births and
deaths (two important indicators describing the registration efficiency) have been worked out and
shown in the charts 18 and 19 respectively.
3.17.2 The compositions of these three groups in terms of States/UTs are as under:
a) EAG States: Bihar, Jharkhand, Madhya Pradesh, Chhattisgarh, Odisha, Rajasthan, Uttar
Pradesh and Uttarakhand. Assam has also been added to this group.
b) Southern States: Andhra Pradesh, Karnataka, Kerala and Tamil Nadu.
c) Other States/UTs: This category covers all the remaining States and UTs.
3.17.3 It can be seen that the level of registration of births for other States/UTs is higher than that
of Southern as well as EAG States& Assam persistently over the period. This perhaps is due to low
level of registration of births in Andhra Pradesh. In case of performance of case of death registration
these group differs where the Southern States are better that the other 2 groups.
72.8
77.678.3
84.3
86.3
89.289.6
91.693.7
94.8
67.4
69.869.0
72.773.7 73.2
75.476.8 76.8
79.3
60.0
65.0
70.0
75.0
80.0
85.0
90.0
95.0
20
03
20
04
20
05
20
06
20
07
20
08
20
09
20
10
20
11
20
12
Le
ve
l o
f R
eg
istr
ati
on
(in
%)
Chart 17: Level of Registration excluding Uttar Pradesh and Bihar, 2003-2012
LOR(Births) LOR(Deaths)
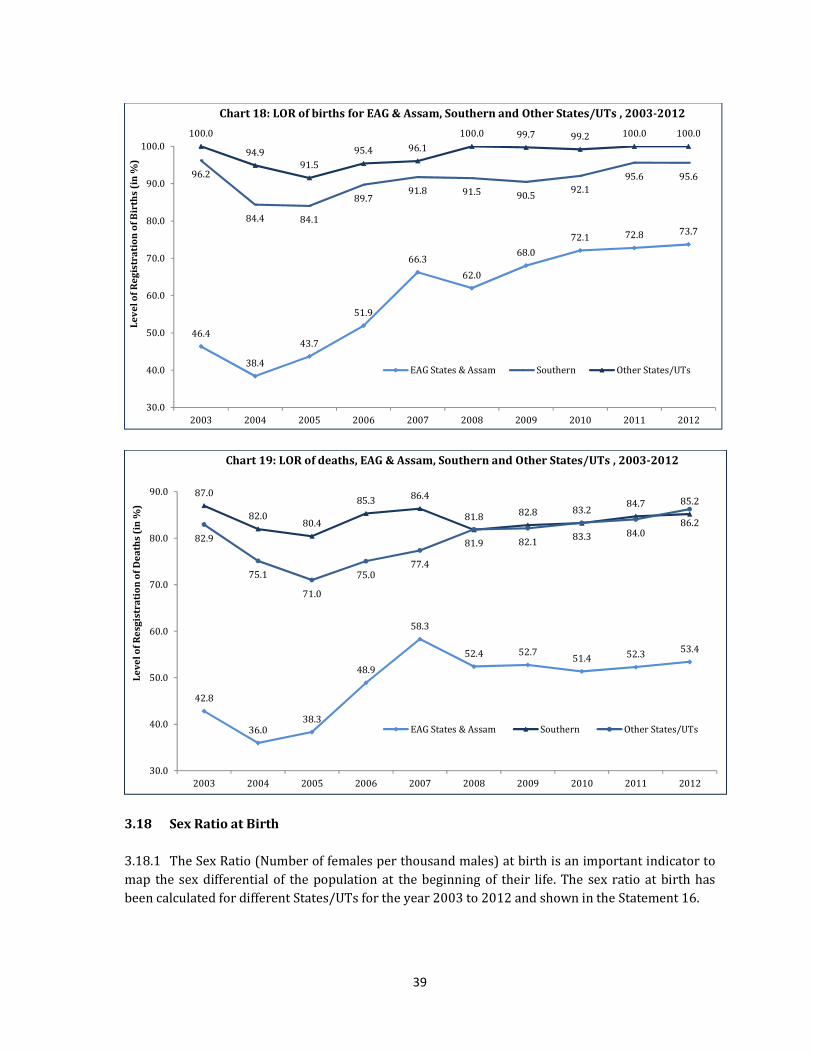
39
3.18 Sex Ratio at Birth
3.18.1 The Sex Ratio (Number of females per thousand males) at birth is an important indicator to
map the sex differential of the population at the beginning of their life. The sex ratio at birth has
been calculated for different States/UTs for the year 2003 to 2012 and shown in the Statement 16.
46.4
38.4
43.7
51.9
66.3
62.0
68.0
72.1 72.8 73.7
96.2
84.4 84.1
89.791.8 91.5 90.5
92.1
95.6 95.6
100.0
94.9
91.5
95.4 96.1
100.0 99.7 99.2 100.0 100.0
30.0
40.0
50.0
60.0
70.0
80.0
90.0
100.0
2003 2004 2005 2006 2007 2008 2009 2010 2011 2012
Le
ve
l o
f R
eg
istr
ati
on
of
Bir
ths
(in
%)
Chart 18: LOR of births for EAG & Assam, Southern and Other States/UTs , 2003-2012
EAG States & Assam Southern Other States/UTs
42.8
36.038.3
48.9
58.3
52.4 52.751.4 52.3
53.4
87.0
82.080.4
85.386.4
81.8 82.8 83.284.7 85.2
82.9
75.1
71.0
75.077.4
81.9 82.183.3 84.0
86.2
30.0
40.0
50.0
60.0
70.0
80.0
90.0
2003 2004 2005 2006 2007 2008 2009 2010 2011 2012
Le
ve
l o
f R
esg
istr
ati
on
of
De
ath
s (i
n %
)
Chart 19: LOR of deaths, EAG & Assam, Southern and Other States/UTs , 2003-2012
EAG States & Assam Southern Other States/UTs

40
Statement 16: Sex Ratio at Birth based on registered events, 2003-2012
Sl. No. India/ State/
UTs 2003 2004 2005 2006 2007 2008 2009 2010 2011 2012
India 868 872 876 891 903 904 898 857 909 908
States
1. Andhra Pradesh 973 972 987 973 974 986 985 983 983 985
2. Arunachal Pradesh 812 864 799 792 854 875 806 792 897 819
3. Assam 750 n.a. 732 876 834 853 931 1244 920 872
4. Bihar 826 801 793 n.a. n.a. n.a. 715 323 n.a. n.a.
5. Chhattisgarh 926 919 939 919 919 886 924 906 915 895
6. Goa 931 931 931 963 947 931 921 908 934 929
7. Gujarat 835 824 846 972 879 883 905 902 901 902
8. Haryana 814 796 827 857 860 854 853 838 833 832
9. Himachal Pradesh 877 872 866 885 903 904 922 911 918 916
10. Jammu & Kashmir 925 934 923 906 922 906 918 917 913 n.a.
11. Jharkhand n.a. 840 830 835 865 878 864 865 n.a. 847
12. Karnataka 924 858 943 952 1004 1047 1011 1025 983 971
13. Kerala 951 946 949 955 944 952 942 939 939 955
14. Madhya Pradesh 841 864 855 855 905 913 938 922 897 912
15. Maharashtra 808 811 n.a. n.a. n.a. 870 868 854 861 894
16. Manipur 923 1004 1011 963 913 950 934 770 816 797
17. Meghalaya 875 1011 918 965 864 959 948 912 942 947
18. Mizoram 926 945 940 952 938 942 949 948 972 968
19. Nagaland 971 977 980 804 823 802 883 871 873 873
20. Odisha 950 927 934 927 919 935 925 911 902 896
21. Punjab 789 794 790 813 820 820 822 824 852 844
22. Rajasthan 833 820 805 828 832 785 861 839 911 861
23. Sikkim 935 956 954 941 981 951 955 961 947 974
24. Tamil Nadu 920 936 935 939 935 928 933 935 905 904
25. Tripura 1202 n.r. n.a. n.a. n.a. n.a. n.a. 996 982 980
26. Uttar Pradesh n.a. n.a. n.a. n.a. n.a. n.a. n.a. n.a. n.a. 930
27. Uttarakhand n.a. 845 864 873 869 860 855 858 869 847
28. West Bengal 889 903 906 890 918 914 929 931 924 926
Union Territories
1. A & N Islands 1003 935 967 933 949 961 973 934 954 934
2. Chandigarh 807 786 826 860 860 872 867 878 835 887
3. D & N Haveli 932 879 918 895 917 946 928 905 960 954
4. Daman & Diu 915 906 869 847 908 916 934 912 857 886
5. Delhi 823 823 822 831 848 1004 915 901 893 886
6. Lakshadweep 991 843 869 899 911 934 866 1015 897 n.a.
7. Puducherry 942 936 950 955 950 923 927 917 912 909
Note: n.a. – not available; n.r. – not reported.
3.18.2 It can be seen from the Chart 28 that the Sex Ratio at Birth based on registered events of
Andhra Pradesh and Tripura have shown the highest sex ratio which is due to better netting of
female birth during 2012 and Manipur has shown the lowest sex ratio at birth for the same year. The
sex ratio at birth at national level is 908 during 2012. The Sex Ratio at birth for the country ranges
from 857 to 909 over the years 2003-2012. In 2011 and 2012, the sex ratio at birth has shown

41
improvements due to better netting of female births. The sex ratio at birth has shown noticeable
improvements in the States of Maharashtra and Sikkim in 2012 as compared to 2011. Karnataka and
Andhra Pradesh have the distinction of being the only major states reporting favorable sex ratio at
birth in last so many years.
3.18.3 The sex ratio at birth could not be worked out for Bihar, Jammu & Kashmir and Lakshadweep
for want of sex-wise disaggregated data on registered births for the year 2012. The sex ratio at birth
for India is exclusive of returns from these 3 States. Non-reporting of gender-wise break up of
registered events is another area where urgent attention is required.
3.18.4 In order to evaluate the performance of Civil Registration System on this front also, a
comparison of sex ratio at birth based on registered births with that of from SRS by taking three
years simple moving average for the years 2002-2011 has been done and the same is shown in Chart
29.
3.18.5 It can be seen from the above graph that the gap at the national level was narrowing down
till 2008 but due to poor registration of females in majority of the bigger States, this has gone down
during 2009 and 2010. However, it may take few more years under the Civil Registration System to
bridge the gap in Sex Ratio arrived from CRS and SRS.
79
7 81
9
83
2
84
4
84
7
84
7
86
1
87
2
87
3
88
6
88
6
88
7
89
4
89
5
89
6
90
2
90
4
90
8
90
9
91
2
91
6
92
6
92
9
93
0
93
4
94
7
95
4
95
5
96
8
97
1
97
4
98
0
98
5
700
800
900
1000
Ma
nip
ur
Aru
na
cha
l P
rad
esh
Ha
rya
na
Pu
nja
b
Utt
ara
kh
an
d
Jha
rkh
an
d
Ra
jast
ha
n
Ass
am
Na
ga
lan
d
Da
ma
n &
Diu
De
lhi
Ch
an
dig
arh
Ma
ha
rash
tra
Ch
ha
ttis
ga
rh
Od
ish
a
Gu
jara
t
Ta
mil
Na
du
Ind
ia
Pu
du
che
rry
Ma
dh
ya
Pra
de
sh
Him
ach
al
Pra
de
sh
We
st B
en
ga
l
Go
a
Utt
ar
Pra
de
sh
A &
N I
sla
nd
s
Me
gh
ala
ya
D &
N H
av
eli
Ke
rala
Miz
ora
m
Ka
rna
tak
a
Sik
kim
Tri
pu
ra
An
dh
ra P
rad
esh
Chart 28: Sex Ratio based on Registered Births, 2012
87
4
87
4
87
5 88
2 89
1 89
9
90
2
88
6
88
8
89
2
88
3
88
2
88
0 89
2 90
1
90
4
90
6
90
5
90
6
90
8
850
860
870
880
890
900
910
2002 2003 2004 2005 2006 2007 2008 2009 2010 2011
Chart 29: Sex Ratio at Birth based on CRS and SRS, 2002-2011
CRS SRS
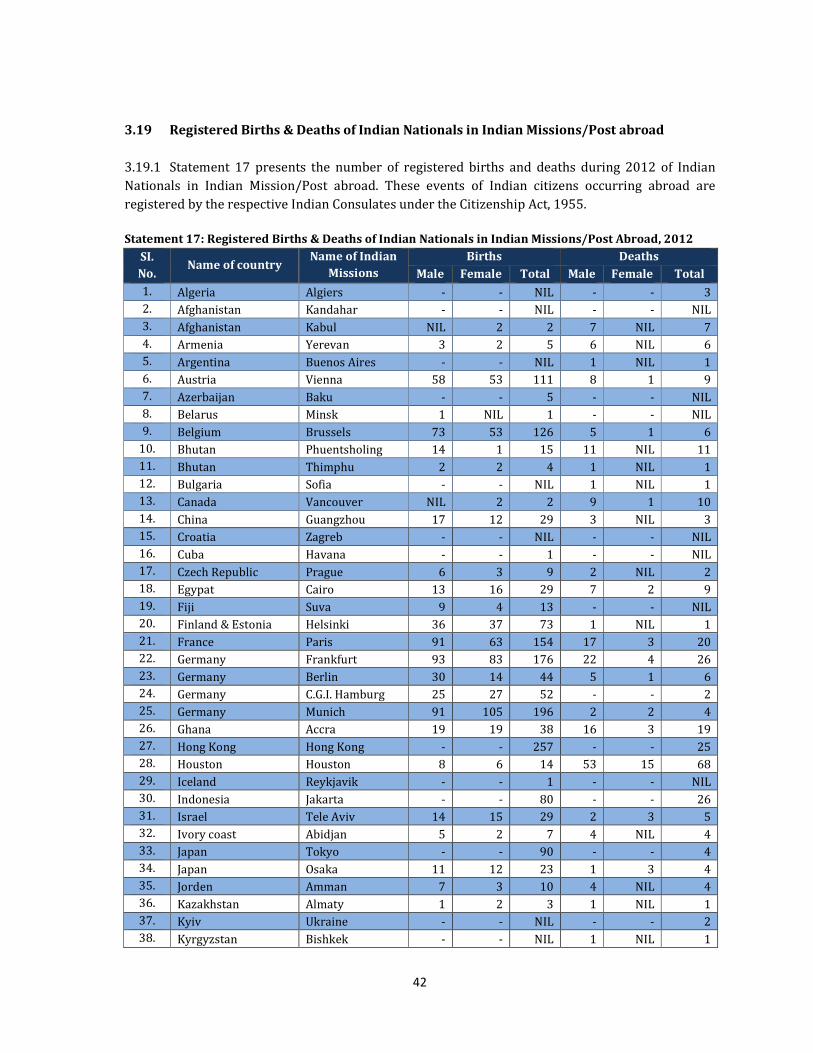
42
3.19 Registered Births & Deaths of Indian Nationals in Indian Missions/Post abroad
3.19.1 Statement 17 presents the number of registered births and deaths during 2012 of Indian
Nationals in Indian Mission/Post abroad. These events of Indian citizens occurring abroad are
registered by the respective Indian Consulates under the Citizenship Act, 1955.
Statement 17: Registered Births & Deaths of Indian Nationals in Indian Missions/Post Abroad, 2012
SI.
No. Name of country
Name of Indian
Missions
Births Deaths
Male Female Total Male Female Total
1. Algeria Algiers - - NIL - - 3
2. Afghanistan Kandahar - - NIL - - NIL
3. Afghanistan Kabul NIL 2 2 7 NIL 7
4. Armenia Yerevan 3 2 5 6 NIL 6
5. Argentina Buenos Aires - - NIL 1 NIL 1
6. Austria Vienna 58 53 111 8 1 9
7. Azerbaijan Baku - - 5 - - NIL
8. Belarus Minsk 1 NIL 1 - - NIL
9. Belgium Brussels 73 53 126 5 1 6
10. Bhutan Phuentsholing 14 1 15 11 NIL 11
11. Bhutan Thimphu 2 2 4 1 NIL 1
12. Bulgaria Sofia - - NIL 1 NIL 1
13. Canada Vancouver NIL 2 2 9 1 10
14. China Guangzhou 17 12 29 3 NIL 3
15. Croatia Zagreb - - NIL - - NIL
16. Cuba Havana - - 1 - - NIL
17. Czech Republic Prague 6 3 9 2 NIL 2
18. Egypat Cairo 13 16 29 7 2 9
19. Fiji Suva 9 4 13 - - NIL
20. Finland & Estonia Helsinki 36 37 73 1 NIL 1
21. France Paris 91 63 154 17 3 20
22. Germany Frankfurt 93 83 176 22 4 26
23. Germany Berlin 30 14 44 5 1 6
24. Germany C.G.I. Hamburg 25 27 52 - - 2
25. Germany Munich 91 105 196 2 2 4
26. Ghana Accra 19 19 38 16 3 19
27. Hong Kong Hong Kong - - 257 - - 25
28. Houston Houston 8 6 14 53 15 68
29. Iceland Reykjavik - - 1 - - NIL
30. Indonesia Jakarta - - 80 - - 26
31. Israel Tele Aviv 14 15 29 2 3 5
32. Ivory coast Abidjan 5 2 7 4 NIL 4
33. Japan Tokyo - - 90 - - 4
34. Japan Osaka 11 12 23 1 3 4
35. Jorden Amman 7 3 10 4 NIL 4
36. Kazakhstan Almaty 1 2 3 1 NIL 1
37. Kyiv Ukraine - - NIL - - 2
38. Kyrgyzstan Bishkek - - NIL 1 NIL 1

43
39. Korea Seoul - - 73 - - 5
40. Kuwait Kuwait 2228 2246 4474 420 81 501
41. LAOPDR Vientiane NIL 1 1 1 NIL 1
42. Malaysia Kuala Lumpur 128 119 247 168 18 186
43. Mauritius Port Louis - - 33 - - 4
44. Mongolia Ulaanbaatar 1 NIL 1 - - NIL
45. Nepal Birgunj 1 NIL 1 4 NIL 4
46. New Zealand Wellington 86 66 152 15 4 19
47. Netherlands Hague 96 90 186 7 NIL 7
48. Oman Muscat 867 935 1802 - - -
49. Papua New Guinea Port Moresby - - NIL - - NIL
50. Peru Lima - - NIL 1 NIL 1
51. Poland Warsaw - - 12 - - 2
52. Portugal Lisbon 27 25 52 3 1 4
53. Russia St. Petersburg 2 NIL 2 - - NIL
54. Seychelles Maha 4 2 6 4 1 5
55. South Africa Durban 30 26 56 4 NIL 4
56. Spain Madrid 260 254 514 20 9 29
57. Sri Lanka Colombo 18 17 35 8 NIL 8
58. Sri Lanka Kandy 1 2 3 1 NIL 1
59. Sudan Khartoum 11 12 23 15 1 16
60. Suriname Paramaribo 1 NIL 1 - - NIL
61. Switzerland Berne 87 77 164 3 2 5
62. Switzerland Geneva 29 21 50 - - 2
63. Tajikistan Dushanbe NIL 2 2 2 NIL 2
64. Tanzania Daressalaam 40 41 81 11 1 12
65. Thailand Chiangmai NIL 2 2 - - NIL
66. Thailand Bangkok 55 51 106 38 8 46
67. Tunisia Tunis 1 NIL 1 - - NIL
68. Turkey Istanbul 2 1 3 1 NIL 1
69. Turkey Ankara NIL 1 1 NIL NIL NIL
70. Turkmenistan Ashgabat - - NIL 5 NIL 5
71. UAE Abu dhabi - - 2829 - - 358
72. USA New York - - 18 85 37 122
73. USA San Francisco - - 9 - - 103
74. Uzbekistan Tashkent 3 1 4 - - -
75. Vietnam Hanoi 1 1 2 1 NIL 1
76. Yangon Myanmar 5 2 7 NIL 1 1
77. Yeman Sanaa - - 32 - - 8
78. Zimbabwe Harare 10 7 17 - - NIL
Total events registered in abroad 4621 4540 12601 1007 203 1754
Note: Due to non-availability of sex wise information from all Missions, total is not tallied with
Male/Female breakup.

PART-II
DETAILED TABLES

Male Female Person Male Female Person Male Female Person
India 4263526 3924319 9599280 6162226 5539209 12352239 10425752 9463528 21951519
States
Andhra Pradesh 207121 205659 412780 358465 351634 710099 565586 557293 1122879
Arunachal Pradesh 9793 8095 17888 13090 10641 23731 22883 18736 41619
Assam 270563 234721 505284 56714 50578 107292 327277 285299 612576
Bihar n.a. n.a. 1409729 n.a. n.a. 648908 n.a. n.a. 2058637
Chhattisgarh 135108 122815 259605 100222 87712 189070 235330 210527 448675
Goa 4224 3779 8003 7357 6979 14336 11581 10758 22339
Gujarat 234676 210224 444900 436304 395126 831430 670980 605350 1276330
Haryana 113638 96174 209812 194427 160041 354468 308065 256215 564280
Himachal Pradesh 43540 40018 83558 23066 20987 44053 66606 61005 127611
Jammu & Kashmir
Jharkhand 163347 143782 307129 101898 80926 182824 265245 224708 489953
Karnataka 161352 157921 319273 409029 396188 805217 570381 554109 1124490
Kerala 105304 98078 203394 173162 167816 340994 278466 265894 544388
Madhya Pradesh 326268 298298 624566 568402 517540 1085942 894670 815838 1710508
Maharashtra 364253 317294 681547 668663 606076 1274739 1032916 923370 1956286
Manipur 4135 3463 7598 12656 9918 22574 16791 13381 30172
Meghalaya 42679 40657 83336 9711 8965 18676 52390 49622 102012
Mizoram 5586 5356 10942 7647 7453 15100 13233 12809 26042
Nagaland 13585 12097 25682 10822 9205 20027 24407 21302 45709
Odisha 218880 196962 415842 198064 176742 374806 416944 373704 790648
Punjab 81508 68356 149864 177818 150494 328312 259326 218850 478176
Rajasthan 400066 326890 726956 544335 486402 1030737 944401 813292 1757693
Sikkim 1083 1110 2206 3258 3118 6385 4341 4228 8591
Tamil Nadu 198317 177212 375529 434709 394854 829563 633026 572066 1205092
Tripura 14999 16706 31705 8460 6284 14744 23459 22990 46449
Uttar Pradesh 636354 668436 1304789 1041307 891249 1932557 1677661 1559685 3237346
Uttarakhand 28980 25497 54477 51202 42399 93601 80182 67896 148078
West Bengal 460353 428971 889324 334357 306651 641008 794710 735622 1530332
Union Territories
A & N Islands 1198 1135 2333 1619 1496 3115 2817 2631 5448
Chandigarh 74 65 139 14209 12599 26808 14283 12664 26947
D & N Haveli 1528 1543 3071 1890 1717 3607 3418 3260 6678
Daman & Diu 518 450 968 1723 1535 3258 2241 1985 4226
Delhi 12932 11127 24059 178197 158217 336414 191129 169344 360473
Lakshadweep n.a. n.a. n.a. n.a. n.a. 734 n.a. n.a. 734
Puducherry 1564 1428 2992 19443 17667 37110 21007 19095 40102
*: Kerala & Chhattisgarh includes cases of sex not reported in person so does not match with the addition of male and female.
……………………………………..……….. Not Available……………………………………………...
TABLE -1 : NUMBER OF LIVE BIRTHS REGISTERED BY SEX AND RESIDENCE, 2012
India/ States/
Union Territories
Rural Urban Total
48

Male Female Person Male Female Person Male Female Person
India 1790214 1322179 3273688 1495520 997902 2576780 3285733 2320081 5850176
States
Andhra Pradesh 133831 108490 242321 95329 68259 163588 229160 176749 405909
Arunachal Pradesh 562 134 696 771 244 1015 1333 378 1711
Assam 36630 31807 68437 22971 20268 43239 59601 52075 111676
Bihar n.a. n.a. 160547 n.a. n.a. 82919 n.a. n.a. 243466
Chhattisgarh 57348 39802 97582 27376 17034 44541 84724 56836 142123
Goa 4896 3326 8222 2366 1479 3845 7262 4805 12067
Gujarat 97119 57156 154275 98069 62892 160961 195188 120048 315236
Haryana 59638 37375 97013 41886 21734 63620 101524 59109 160633
Himachal Pradesh 21907 15517 37424 4312 2535 6847 26219 18052 44271
Jammu & Kashmir
Jharkhand 46293 32721 79014 22969 10831 33800 69262 43552 112814
Karnataka 133119 89233 222352 114642 70021 184663 247761 159254 407015
Kerala 85505 71454 156966 43292 37353 80649 128797 108807 237615
Madhya Pradesh 103984 86549 190533 96972 71837 168809 200956 158386 359342
Maharashtra 174988 130563 305551 206773 139407 346180 381761 269970 651731
Manipur 1269 459 1728 1790 940 2730 3059 1399 4458
Meghalaya 7227 4275 11502 1718 1090 2808 8945 5365 14310
Mizoram 1394 976 2370 2741 1392 4133 4135 2368 6503
Nagaland 2140 1708 3848 1702 1446 3148 3842 3154 6996
Odisha 122793 99175 221968 40850 28209 69059 163643 127384 291027
Punjab 64740 43884 108624 52495 32763 85258 117235 76647 193882
Rajasthan 125203 89447 214650 88262 54034 142296 213465 143481 356946
Sikkim 848 600 1465 1240 792 2045 2088 1392 3510
Tamil Nadu 129892 106991 236883 159760 100233 259993 289652 207224 496876
Tripura 2944 1355 4299 3368 1860 5228 6312 3215 9527
Uttar Pradesh 217220 157297 374517 170673 123591 294263 387892 280888 668780
Uttarakhand 10635 8195 18830 9447 5377 14824 20082 13572 33654
West Bengal 140331 99223 239554 105882 74578 180460 246213 173801 420014
Union Territories
A & N Islands 823 517 1340 558 281 839 1381 798 2179
Chandigarh 103 58 161 10460 5582 16042 10563 5640 16203
D & N Haveli 399 337 736 288 177 465 687 514 1201
Daman & Diu 274 150 424 411 233 644 685 383 1068
Delhi 4583 2450 7033 60025 37558 97583 64608 40008 104616
Lakshadweep n.a. n.a. 292 n.a. n.a. 292 n.a. n.a. 292
Puducherry 1576 955 2531 6122 3872 9994 7698 4827 12525
*: Kerala & Chhattisgarh includes cases of sex not reported in person so does not match with the addition of male and female.
……………………………………..……….. Not Available……………………………………………...
TABLE -2 : NUMBER OF DEATHS REGISTERED BY SEX AND RESIDENCE, 2012
India/ States/ Union
Territories
Rural Urban Total
49

Male Female Person Male Female Person Male Female Person
India 24473 21129 45636 65756 47665 113424 90229 68794 159060
States
Andhra Pradesh 528 499 1027 3914 2620 6534 4442 3119 7561
Arunachal Pradesh 1 0 1 2 3 5 3 3 6
Assam 317 131 448 106 66 172 423 197 620
Bihar
Chhattisgarh
Goa 103 74 177 17 21 38 120 95 215
Gujarat 779 629 1408 4208 2607 6815 4987 3236 8223
Haryana 1812 2330 4142 1618 932 2550 3430 3262 6692
Himachal Pradesh 297 240 537 273 224 497 570 464 1034
Jammu & Kashmir
Jharkhand
Karnataka 1156 1022 2178 6765 4492 11257 7921 5514 13435
Kerala 710 625 1339 1499 1511 3013 2209 2136 4352
Madhya Pradesh 1335 1237 2572 5543 4543 10086 6878 5780 12658
Maharashtra 1535 1251 2786 10522 8426 18948 12057 9677 21734
Manipur 123 13 166 140 86 226 263 99 392
Meghalaya 903 741 1644 293 236 529 1196 977 2173
Mizoram 140 131 271 361 301 662 501 432 933
Nagaland 39 35 74 26 16 42 65 51 116
Odisha 5807 5058 10865 4373 2763 7136 10180 7821 18001
Punjab 778 670 1448 1017 751 1768 1795 1421 3216
Rajasthan 1653 1562 3215 6582 5527 12109 8235 7089 15324
Sikkim 15 15 30 59 45 104 74 60 134
Tamil Nadu 1251 1163 2414 4561 3346 7907 5812 4509 10321
Tripura 223 152 375 305 204 509 528 356 884
Uttar Pradesh
Uttarakhand 141 125 266 114 81 195 255 206 461
West Bengal 4513 3256 7769 6335 4565 10900 10848 7821 18669
Union Territories
A & N Islands 46 37 83 33 20 53 79 57 136
Chandigarh - - - 1443 697 2140 1443 697 2140
D & N Haveli 10 7 17 0 4 4 10 11 21
Daman & Diu 1 1 2 5 2 7 6 3 9
Delhi 247 115 362 5087 3179 8266 5334 3294 8628
Lakshadweep 7 2 9 - - - 7 2 9
Puducherry 3 8 11 555 397 952 558 405 963
*: Kerala includes cases of sex not reported in person so does not match with the addition of male and female.
……………………………………..……….. Not Available……………………………………………...
……………………………………..……….. Not Available……………………………………………...
……………………………………..……….. Not Available……………………………………………...
……………………………………..……….. Not Available……………………………………………...
……………………………………..……….. Not Available……………………………………………...
TABLE -3 : NUMBER OF INFANT DEATHS REGISTERED BY SEX AND RESIDENCE, 2012
India/ States/ Union
Territories
Rural Urban Total
50

Male Female Person Male Female Person Male Female Person
India 12361 10478 27472 27070 24074 70700 39431 34552 98172
States
Andhra Pradesh 166 202 368 1475 1176 2651 1641 1378 3019
Arunachal Pradesh
Assam 531 564 1095 147 135 282 678 699 1377
Bihar
Chhattisgarh 321 238 565 388 321 715 709 559 1280
Goa 76 72 148 31 27 58 107 99 206
Gujarat 639 502 1141 4231 3687 7918 4870 4189 9059
Haryana n.a. n.a. 923 n.a. n.a. 1234 n.a. n.a. 2157
Himachal Pradesh 51 44 95 9 8 17 60 52 112
Jammu & Kashmir
Jharkhand
Karnataka 270 234 504 3005 3015 6020 3275 3249 6524
Kerala 462 401 867 772 823 1605 1234 1224 2472
Madhya Pradesh 1787 1483 3270 6225 5262 11487 8012 6745 14757
Maharashtra n.a. n.a. 1235 n.a. n.a. 12140 n.a. n.a. 13375
Manipur
Meghalaya 462 405 867 223 253 476 685 658 1343
Mizoram 15 12 27 31 29 60 46 41 87
Nagaland 4 6 10 4 5 9 8 11 19
Odisha 3715 3087 6802 2320 2089 4409 6035 5176 11211
Punjab 338 240 578 1176 931 2107 1514 1171 2685
Rajasthan 269 254 523 3647 3147 6794 3916 3401 7317
Sikkim 11 7 19 23 33 56 34 40 75
Tamil Nadu n.a. n.a. 2391 n.a. n.a. 5331 n.a. n.a. 7722
Tripura 39 33 72 174 153 327 213 186 399
Uttar Pradesh
Uttarakhand 292 234 526 245 169 414 537 403 940
West Bengal 2902 2446 5348 2810 2690 5500 5712 5136 10848
Union Territories
A & N Islands 11 13 24 28 28 56 39 41 80
Chandigarh - - - 106 92 198 106 92 198
D & N Haveli
Daman & Diu - 1 1 - 1 1 - 2 2
Delhi
Lakshadweep
Puducherry n.a. n.a. 73 n.a. n.a. 835 n.a. n.a. 908
*: Kerala & Chhattisgarh includes cases of sex not reported in person so does not match with the addition of male and
female.
……………………………………..……….. Not Available……………………………………………...
……………………………………..……….. Not Available……………………………………………...
……………………………………..……….. Not Available……………………………………………...
……………………………………..……….. Not Available……………………………………………...
……………………………………..……….. Not Available……………………………………………...
……………………………………..……….. Not Available……………………………………………...
……………………………………..……….. Not Available……………………………………………...
……………………………………..……….. Not Available……………………………………………...
……………………………………..……….. Not Available……………………………………………...
TABLE -4 : NUMBER OF STILL BIRTHS REGISTERED BY SEX AND RESIDENCE, 2012
India/ States/ Union
Territories
Rural Urban Total
51

India/ States/ Union Territories Births Deaths
India 84.4 69.3
States
Andhra Pradesh 74.8 64.0
Arunachal Pradesh 100.0 23.4
Assam 87.6 45.5
Bihar 74.7 37.1
Chhattisgarh 74.2 72.8
Goa 100.0 100.0
Gujarat 100.0 79.5
Haryana 100.0 96.6
Himachal Pradesh 100.0 96.1
Jammu & Kashmir 69.8 55.1
Jharkhand 61.9 51.8
Karnataka 100.0 95.2
Kerala 100.0 98.7
Madhya Pradesh 87.2 60.2
Maharashtra 100.0 90.2
Manipur 83.1 44.2
Meghalaya 100.0 70.7
Mizoram 100.0 100.0
Nagaland 100.0 95.7
Odisha 96.4 83.1
Punjab 100.0 100.0
Rajasthan 98.0 78.1
Sikkim 80.3 100.0
Tamil Nadu 100.0 98.7
Tripura 91.0 54.1
Uttar Pradesh 57.5 42.3
Uttarakhand 79.0 54.5
West Bengal 100.0 73.6
Union Territories
A & N Islands 95.3 100.0
Chandigarh 100.0 100.0
D & N Haveli 71.9 73.5
Daman & Diu 96.1 91.6
Delhi 100.0 100.0
Lakshadweep 75.1 69.1
Puducherry 100.0 100.0
TABLE -5 : LEVEL OF REGISTRATION OF BIRTHS & DEATHS, 2012
52

Male Female Person Male Female Person Male Female Person
1 2 3 4 5 6 7 8 9 10
……………...…….…
. Not A
vailable …
……...………………...
TABLE -6: DEATH BY AGE AND SEX OF THE DECEASED, 2012
Age- GroupRural Urban Total
Andhra Pradesh 229160 176749 405909
Less than 1 Year 4442 3119 7561
1 Year - 4 Year 3597 2594 6191
5 Year - 14 Year 4357 3169 7526
15 Year - 24 Year 7006 5098 12104
25 Year - 34 Year 11529 7998 19527
35 Year - 44 Year 16696 11873 28569
45 Year - 54 Year 28927 20664 49591
55 Year - 64 Year 51783 40751 92534
65 Year - 69 Year 44472 34914 79386
70 Year & above 50957 42403 93360
Age Not Stated 5394 4166 9560……………...…
….…. N
ot Availa
ble ………...…
……………...
……
…...
……
. No
t A
va
ila
ble
……
…...
……
…
……
…...
……
. No
t A
va
ila
ble
……
…...
……
…
……
…...
……
. No
t A
va
ila
ble
……
…...
……
…
Arunachal Pradesh 699 1012 1711
Less than 1 Year 1 5 6
1 Year - 4 Year 2 2 4
5 Year - 14 Year 9 18 27
15 Year - 24 Year 35 56 91
25 Year - 34 Year 74 96 170
35 Year - 44 Year 146 185 331
45 Year - 54 Year 170 243 413
55 Year - 64 Year 115 204 319
65 Year - 69 Year 52 78 130
70 Year & above 95 125 220
Age not Stated 0 0 0
Goa 4896 3326 8222 2366 1479 3845 7262 4805 12067
Less than 1 Year 103 74 177 17 21 38 120 95 215
1 Year - 4 Year 12 4 16 4 9 13 16 13 29
5 Year - 14 Year 13 12 25 20 14 34 33 26 59
15 Year - 24 Year 114 71 185 78 29 107 192 100 292
25 Year - 34 Year 252 82 334 112 48 160 364 130 494
35 Year - 44 Year 453 130 583 243 56 299 696 186 882
45 Year - 54 Year 608 185 793 317 91 408 925 276 1201
55 Year - 64 Year 823 367 1190 331 184 515 1154 551 1705
65 Year - 69 Year 377 287 664 282 134 416 659 421 1080
70 Year & above 1504 1620 3124 683 721 1404 2187 2341 4528
Age not Stated 637 494 1131 279 172 451 916 666 1582
Gujarat 97119 57156 154275 98069 62892 160961 195188 120048 315236
Less than 1 Year 779 629 1408 4208 2607 6815 4987 3236 8223
1 Year - 4 Year 301 228 529 690 516 1206 991 744 1735
5 Year - 14 Year 881 653 1534 1559 1054 2613 2440 1707 4147
15 Year - 24 Year 2397 1411 3808 4171 2984 7155 6568 4395 10963
25 Year - 34 Year 4223 1722 5945 6170 3162 9332 10393 4884 15277
35 Year - 44 Year 7077 2573 9650 9429 3768 13197 16506 6341 22847
45 Year - 54 Year 12199 5192 17391 14514 5965 20479 26713 11157 37870
55 Year - 64 Year 16243 7718 23961 17230 8438 25668 33473 16156 49629
65 Year - 69 Year 11418 6222 17640 9656 5707 15363 21074 11929 33003
70 Year & above 41601 30808 72409 30442 28691 59133 72043 59499 131542
Age not Stated 0 0 0 0 0 0 0 0 0
Himachal Pradesh 21907 15517 37424 4312 2535 6847 26219 18052 44271
Less than 1 Year 297 240 537 273 224 497 570 464 1034
1 Year - 4 Year 179 171 350 34 27 61 213 198 411
5 Year - 14 Year 233 191 424 49 41 90 282 232 514
15 Year - 24 Year 556 381 937 165 123 288 721 504 1225
……
…...
……
. No
t A
va
ila
ble
……
…...
……
…
……
…...
……
. No
t A
va
ila
ble
……
…...
……
…
……
…...
……
. No
t A
va
ila
ble
……
…...
……
…
53

Male Female Person Male Female Person Male Female Person
1 2 3 4 5 6 7 8 9 10
TABLE -6: DEATH BY AGE AND SEX OF THE DECEASED, 2012
Age- GroupRural Urban Total
25 Year - 34 Year 860 465 1325 259 126 385 1119 591 1710
35 Year - 44 Year 1296 596 1892 417 196 613 1713 792 2505
45 Year - 54 Year 2300 1194 3494 617 282 899 2917 1476 4393
55 Year - 64 Year 3652 1934 5586 787 400 1187 4439 2334 6773
65 Year - 69 Year 2311 1527 3838 394 211 605 2705 1738 4443
70 Year & above 9482 8219 17701 1163 812 1975 10645 9031 19676
Age not Stated 741 599 1340 154 93 247 895 692 1587
Karnataka 133119 89233 222352 114642 70021 184663 247761 159254 407015
Less than 1 Year 1156 1022 2178 6765 4492 11257 7921 5514 13435
1 Year - 4 Year 2268 1583 3851 2210 1351 3561 4478 2934 7412
5 Year - 14 Year 3806 2744 6550 2317 1380 3697 6123 4124 10247
15 Year - 24 Year 3038 2489 5527 3976 3831 7807 7014 6320 13334
25 Year - 34 Year 6244 3930 10174 7367 4804 12171 13611 8734 22345
35 Year - 44 Year 11823 5259 17082 12684 5847 18531 24507 11106 35613
45 Year - 54 Year 17561 7999 25560 16370 7122 23492 33931 15121 49052
55 Year - 64 Year 24215 12994 37209 22063 11385 33448 46278 24379 70657
65 Year - 69 Year 15399 9456 24855 12469 7146 19615 27868 16602 44470
70 Year & above 47609 41757 89366 28421 22663 51084 76030 64420 140450
Age Not Stated 0 0 0 0 0 0 0 0 0
Kerala 85505 71454 156966 43292 37353 80649 128797 108807 237615
Less than 1 Year 710 625 1339 1499 1511 3013 2209 2136 4352
1 Year - 4 Year 162 126 288 246 173 419 408 299 707
5 Year - 14 Year 393 296 689 274 260 534 667 556 1223
15 Year - 24 Year 1324 769 2093 810 587 1397 2134 1356 3490
25 Year - 34 Year 2334 1095 3429 1305 933 2238 3639 2028 5667
35 Year - 44 Year 4076 1944 6020 2350 1695 4045 6426 3639 10065
45 Year - 54 Year 8908 4376 13284 5055 3455 8510 13963 7831 21794
55 Year - 64 Year 15359 7887 23246 8496 6212 14708 23855 14099 37954
65 Year - 69 Year 9054 5990 15044 4941 4051 8992 13995 10041 24036
70 Year & above 42942 48136 91080 18265 18433 36699 61207 66569 127779
Age Not Stated 243 210 454 51 43 94 294 253 548
Madhya Pradesh 103984 86549 190533 96972 71837 168809 200956 158386 359342
Less than 1 Year 1335 1237 2572 5543 4543 10086 6878 5780 12658
1 Year - 4 Year 2796 2562 5358 3114 2507 5621 5910 5069 10979
5 Year - 14 Year 3306 2737 6043 3813 2475 6288 7119 5212 12331
15 Year - 24 Year 5156 3982 9138 5018 3786 8804 10174 7768 17942
25 Year - 34 Year 7783 6286 14069 6177 4889 11066 13960 11175 25135
35 Year - 44 Year 9511 7681 17192 7507 5443 12950 17018 13124 30142
45 Year - 54 Year 11799 9483 21282 9616 6428 16044 21415 15911 37326
55 Year - 64 Year 16083 12833 28916 13470 9512 22982 29553 22345 51898
65 Year - 69 Year 20376 16529 36905 18316 11723 30039 38692 28252 66944
70 Year & above 22679 20422 43101 21930 18768 40698 44609 39190 83799
Age Not Stated 3160 2797 5957 2468 1763 4231 5628 4560 10188
Maharashtra 381761 269970 651731
……………...…….…
. Not A
vailable …
……...………………...
Less than 1 Year 13193 8541 21734
1 Year - 4 Year 2820 2402 5222
5 Year - 14 Year 4633 3643 8276
15 Year - 24 Year 11603 9202 20805
25 Year - 34 Year 20779 11171 31950
35 Year - 44 Year 32140 14746 46886
45 Year - 54 Year 44094 21377 65471
55 Year - 64 Year 52352 31262 83614
65 Year - 69 Year 36978 26963 63941……………...…….…
. Not A
vailable …
……...………………...
54

Male Female Person Male Female Person Male Female Person
1 2 3 4 5 6 7 8 9 10
TABLE -6: DEATH BY AGE AND SEX OF THE DECEASED, 2012
Age- GroupRural Urban Total
70 Year & above 135468 129710 265178
Age Not Stated 27701 10953 38654………...…….…. Not Available ………...……………
Manipur 1269 459 1728 1850 880 2730 3119 1339 4458
Less than 1 Year 123 43 166 140 86 226 263 129 392
1 Year - 4 Year 23 6 29 21 11 32 44 17 61
5 Year - 14 Year 37 8 45 93 47 140 130 55 185
15 Year - 24 Year 28 15 43 91 52 143 119 67 186
25 Year - 34 Year 80 49 129 172 100 272 252 149 401
35 Year - 44 Year 207 74 281 205 128 333 412 202 614
45 Year - 54 Year 142 78 220 238 126 364 380 204 584
55 Year - 64 Year 130 66 196 204 85 289 334 151 485
65 Year - 69 Year 76 26 102 116 53 169 192 79 271
70 Year & above 206 41 247 340 83 423 546 124 670
Age not Stated 217 53 270 230 109 339 447 162 609
……………...…….…
. Not A
vailable …
……...………………...
Meghalaya 8612 5698 14310
Less than 1 Year 1196 977 2173
1 Year - 4 Year 538 470 1008
5 Year - 14 Year 529 346 875
15 Year - 24 Year 631 493 1124
25 Year - 34 Year 741 486 1227
35 Year - 44 Year 609 507 1116
45 Year - 54 Year 867 516 1383
55 Year - 64 Year 984 497 1481
65 Year - 69 Year 679 390 1069
70 Year & above 1338 808 2146
Age not Stated 500 208 708
Mizoram 1975 1301 3276 2159 1068 3227 4134 2369 6503
Less than 1 Year 279 241 520 222 191 413 501 432 933
1 Year - 4 Year 82 58 140 29 29 58 111 87 198
5 Year - 14 Year 58 57 115 42 27 69 100 84 184
15 Year - 24 Year 127 72 199 98 35 133 225 107 332
25 Year - 34 Year 207 97 304 312 83 395 519 180 699
35 Year - 44 Year 233 80 313 366 93 459 599 173 772
45 Year - 54 Year 244 116 360 329 104 433 573 220 793
55 Year - 64 Year 179 136 315 238 126 364 417 262 679
65 Year - 69 Year 107 77 184 86 60 146 193 137 330
70 Year & above 459 367 826 437 320 757 896 687 1583
Nagaland 2140 1708 3848 1702 1446 3148 3842 3154 6996
Less than 1 Year 39 35 74 26 16 42 65 51 116
1 Year - 4 Year 62 103 165 72 49 121 134 152 286
5 Year - 14 Year 184 97 281 109 91 200 293 188 481
15 Year - 24 Year 233 115 348 148 143 291 381 258 639
25 Year - 34 Year 179 134 313 265 108 373 444 242 686
35 Year - 44 Year 183 163 346 133 165 298 316 328 644
45 Year - 54 Year 188 225 413 181 137 318 369 362 731
55 Year - 64 Year 325 193 518 288 173 461 613 366 979
65 Year - 69 Year 449 285 734 251 298 549 700 583 1283
70 Year & above 239 274 513 174 215 389 413 489 902
Not Stated 59 84 143 55 51 106 114 135 249
Odisha 122793 99175 221968 40850 28209 69059 163643 127384 291027
Less than 1 Year 5807 5058 10865 4373 2763 7136 10180 7821 18001
1 Year - 4 Year 2085 2085 4170 966 815 1781 3051 2900 5951
……………...…….…
. Not A
vailable …
……...………………...
55

Male Female Person Male Female Person Male Female Person
1 2 3 4 5 6 7 8 9 10
TABLE -6: DEATH BY AGE AND SEX OF THE DECEASED, 2012
Age- GroupRural Urban Total
5 Year - 14 Year 2379 1621 4000 1023 769 1792 3402 2390 5792
15 Year - 24 Year 3648 2370 6018 1827 1525 3352 5475 3895 9370
25 Year - 34 Year 4752 3114 7866 2742 2076 4818 7494 5190 12684
35 Year - 44 Year 7591 4857 12448 3521 2459 5980 11112 7316 18428
45 Year - 54 Year 12253 8655 20908 4700 3072 7772 16953 11727 28680
55 Year - 64 Year 18829 14803 33632 5737 3985 9722 24566 18788 43354
65 Year - 69 Year 25743 19590 45333 5664 4261 9925 31407 23851 55258
70 Year & above 39540 36881 76421 10290 6472 16762 49830 43353 93183
Not Stated 166 141 307 7 12 19 173 153 326
Punjab 64740 43884 108624 52495 32763 85258 117235 76647 193882
Less than 1 Year 778 670 1448 1017 751 1768 1795 1421 3216
1 Year - 4 Year 674 442 1116 517 376 893 1191 818 2009
5 Year - 14 Year 958 508 1466 444 298 742 1402 806 2208
15 Year - 24 Year 2041 1025 3066 1530 871 2401 3571 1896 5467
25 Year - 34 Year 2991 1605 4596 2676 1476 4152 5667 3081 8748
35 Year - 44 Year 5187 3067 8254 4573 2685 7258 9760 5752 15512
45 Year - 54 Year 8065 5292 13357 7331 4421 11752 15396 9713 25109
55 Year - 64 Year 8788 5999 14787 7549 4533 12082 16337 10532 26869
65 Year - 69 Year 9388 6535 15923 8423 4638 13061 17811 11173 28984
70 Year & above 25870 18741 44611 18435 12714 31149 44305 31455 75760
Rajasthan 125239 89411 214650 88262 54034 142296 213501 143445 356946
Less than 1 Year 1653 1562 3215 6582 5527 12109 8235 7089 15324
1 Year - 4 Year 1175 789 1964 1415 846 2261 2590 1635 4225
5 Year - 14 Year 1875 1401 3276 1713 1177 2890 3588 2578 6166
15 Year - 24 Year 3508 2382 5890 3091 2066 5157 6599 4448 11047
25 Year - 34 Year 5778 3892 9670 4234 2637 6871 10012 6529 16541
35 Year - 44 Year 9094 5853 14947 6136 3489 9625 15230 9342 24572
45 Year - 54 Year 13324 8774 22098 9764 5311 15075 23088 14085 37173
55 Year - 64 Year 19425 13256 32681 11786 6655 18441 31211 19911 51122
65 Year - 69 Year 27426 19830 47256 14581 8553 23134 42007 28383 70390
70 Year & above 41981 31672 73653 28960 17773 46733 70941 49445 120386
Sikkim 848 600 1465 1240 792 2128 2088 1392 3593
Less than 1 Year 15 15 30 59 45 104 74 60 134
1 Year - 4 Year 17 9 32 8 0 18 25 9 50
5 Year - 14 Year 18 17 35 23 32 68 41 49 103
15 Year - 24 Year 51 44 98 42 52 119 93 96 217
25 Year - 34 Year 86 58 144 52 17 85 138 75 229
35 Year - 44 Year 89 55 152 101 31 155 190 86 307
45 Year - 54 Year 124 87 211 118 73 198 242 160 409
55 Year - 64 Year 115 81 196 54 21 77 169 102 273
65 Year - 69 Year 69 51 119 163 125 288 231 176 407
70 Year & above 265 184 448 620 396 1016 885 580 1464
Tamil Nadu 289652 207224 496876
……………...…….…
. Not A
vailable …
……...………………...Less than 1 Year 5812 4509 10321
1 Year - 4 Year 2119 1888 4007
5 Year - 14 Year 3010 2273 5283
15 Year - 24 Year 9511 8961 18472
25 Year - 34 Year 19778 11712 31490
35 Year - 44 Year 29613 11076 40688
45 Year - 54 Year 45902 18890 64792
55 Year - 64 Year 55805 38169 93973
65 Year - 69 Year 26766 26255 53021
70 Year & above 91336 83492 174828……………...…
….…. N
ot Availa
ble ………...…
……………...
56

Male Female Person Male Female Person Male Female Person
1 2 3 4 5 6 7 8 9 10
TABLE -6: DEATH BY AGE AND SEX OF THE DECEASED, 2012
Age- GroupRural Urban Total
Tripura 5816 2984 8800 496 231 727 6312 3215 9527
Less than 1 Year 513 344 857 15 12 27 528 356 884
1 Year - 4 Year 71 85 156 1 0 1 72 85 157
5 Year - 14 Year 52 47 99 2 1 3 54 48 102
15 Year - 24 Year 148 224 372 7 12 19 155 236 391
25 Year - 34 Year 199 205 404 6 13 19 205 218 423
35 Year - 44 Year 435 226 661 33 7 40 468 233 701
45 Year - 54 Year 622 258 880 47 18 65 669 276 945
55 Year - 64 Year 1197 471 1668 118 34 152 1315 505 1820
65 Year - 69 Year 998 405 1403 97 30 127 1095 435 1530
70 Year & above 1581 719 2300 170 104 274 1751 823 2574
Not Stated 0 0 0 0 0 0 0 0 0
………...…….…
. Not A
vailable …
……...……………
A. & N. Islands 1381 798 2179
Less than 1 Year 79 57 136
1 Year - 4 Year 15 6 21
5 Year - 14 Year 19 20 39
15 Year - 24 Year 48 52 100
25 Year - 34 Year 102 50 152
35 Year - 44 Year 150 52 202
45 Year - 54 Year 215 81 296
55 Year - 64 Year 249 120 369
65 Year - 69 Year 108 91 199
70 Year & above 386 267 653
Age Not Stated 10 2 12
…………………...…….…. N
ot Available ………...…
……………...…………….
………...…….…
. Not A
vailable …
……...……………
Chandigarh 10563 5640 16203
Less than 1 Year 1443 697 2140
1 Year - 4 Year 190 148 338
5 Year - 14 Year 294 224 518
15 Year - 24 Year 706 425 1131
25 Year - 34 Year 962 501 1463
35 Year - 44 Year 1305 466 1771
45 Year - 54 Year 1577 651 2228
55 Year - 64 Year 1613 786 2399
65 Year - 69 Year 611 357 968
70 Year & above 1494 1201 2695
Age Not Stated 368 184 552
Dadra & Nagar Haveli 399 337 736 288 177 465 687 514 1201
Less than 1 Year 10 7 17 0 4 4 10 11 21
1 Year - 4 Year 6 6 12 7 5 12 13 11 24
5 Year - 14 Year 12 7 19 10 7 17 22 14 36
15 Year - 24 Year 21 13 34 26 19 45 47 32 79
25 Year - 34 Year 25 20 45 29 20 49 54 40 94
35 Year - 44 Year 37 21 58 42 16 58 79 37 116
45 Year - 54 Year 44 33 77 43 25 68 87 58 145
55 Year - 64 Year 62 39 101 42 19 61 104 58 162
65 Year - 69 Year 35 33 68 32 20 52 67 53 120
70 Year & above 147 158 305 57 42 99 204 200 404
Age Not Stated 0 0 0 0 0 0 0 0 0
Daman & Diu 273 150 424 408 231 644 681 381 1068
Less than 1 Year 1 1 2 5 2 7 6 3 9
1 Year - 4 Year 1 2 3 3 2 5 4 4 8
5 Year - 14 Year 5 3 8 6 1 7 11 4 15
15 Year - 24 Year 12 7 19 21 8 29 33 15 48
…………………...…….…. N
ot Available ………...…
……………...…………….
57
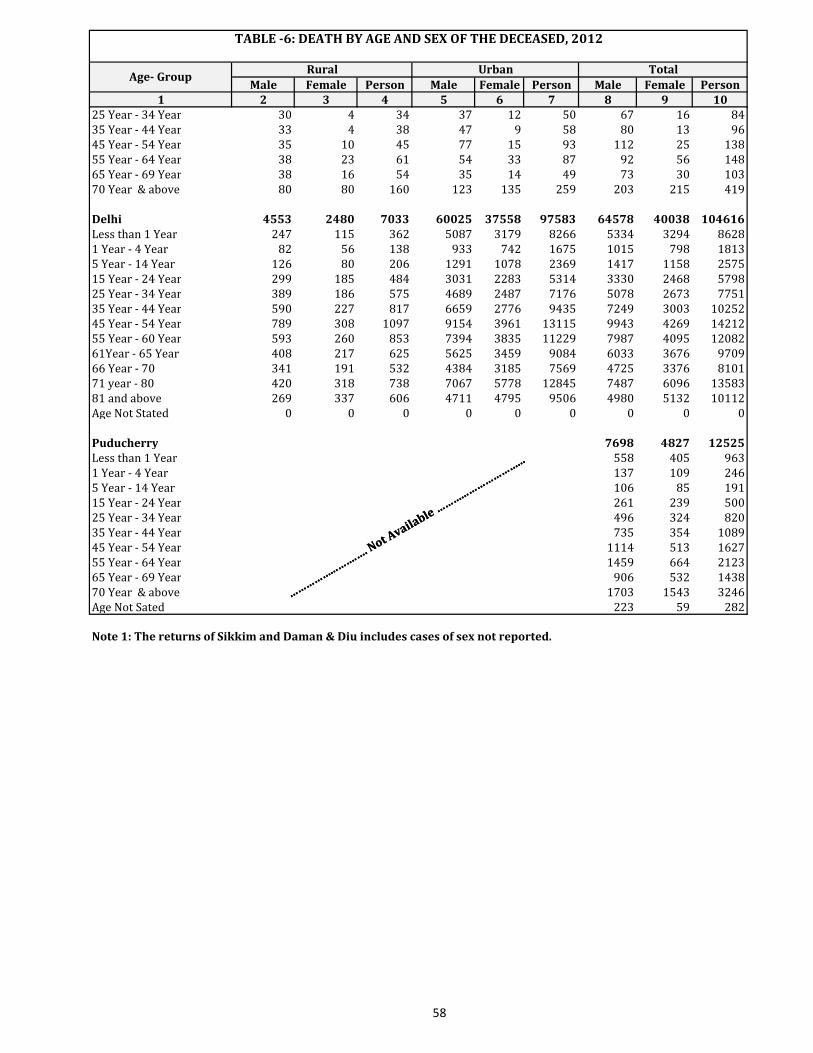
Male Female Person Male Female Person Male Female Person
1 2 3 4 5 6 7 8 9 10
TABLE -6: DEATH BY AGE AND SEX OF THE DECEASED, 2012
Age- GroupRural Urban Total
25 Year - 34 Year 30 4 34 37 12 50 67 16 84
35 Year - 44 Year 33 4 38 47 9 58 80 13 96
45 Year - 54 Year 35 10 45 77 15 93 112 25 138
55 Year - 64 Year 38 23 61 54 33 87 92 56 148
65 Year - 69 Year 38 16 54 35 14 49 73 30 103
70 Year & above 80 80 160 123 135 259 203 215 419
Delhi 4553 2480 7033 60025 37558 97583 64578 40038 104616
Less than 1 Year 247 115 362 5087 3179 8266 5334 3294 8628
1 Year - 4 Year 82 56 138 933 742 1675 1015 798 1813
5 Year - 14 Year 126 80 206 1291 1078 2369 1417 1158 2575
15 Year - 24 Year 299 185 484 3031 2283 5314 3330 2468 5798
25 Year - 34 Year 389 186 575 4689 2487 7176 5078 2673 7751
35 Year - 44 Year 590 227 817 6659 2776 9435 7249 3003 10252
45 Year - 54 Year 789 308 1097 9154 3961 13115 9943 4269 14212
55 Year - 60 Year 593 260 853 7394 3835 11229 7987 4095 12082
61Year - 65 Year 408 217 625 5625 3459 9084 6033 3676 9709
66 Year - 70 341 191 532 4384 3185 7569 4725 3376 8101
71 year - 80 420 318 738 7067 5778 12845 7487 6096 13583
81 and above 269 337 606 4711 4795 9506 4980 5132 10112
Age Not Stated 0 0 0 0 0 0 0 0 0
……………...…….…
. Not A
vailable …
……...………………...
Puducherry 7698 4827 12525
Less than 1 Year 558 405 963
1 Year - 4 Year 137 109 246
5 Year - 14 Year 106 85 191
15 Year - 24 Year 261 239 500
25 Year - 34 Year 496 324 820
35 Year - 44 Year 735 354 1089
45 Year - 54 Year 1114 513 1627
55 Year - 64 Year 1459 664 2123
65 Year - 69 Year 906 532 1438
70 Year & above 1703 1543 3246
Age Not Sated 223 59 282……………...…
….…. N
ot Availa
ble ………...…
……………...
Note 1: The returns of Sikkim and Daman & Diu includes cases of sex not reported.
58
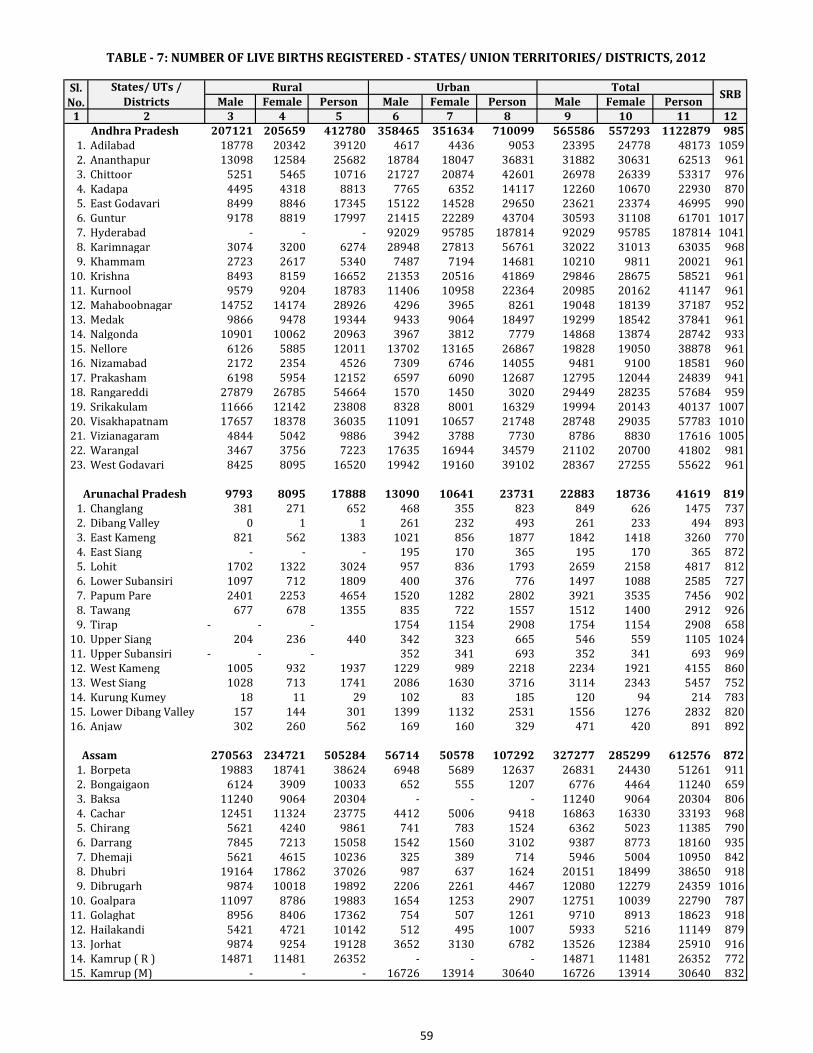
Male Female Person Male Female Person Male Female Person
1 2 3 4 5 6 7 8 9 10 11 12
207121 205659 412780 358465 351634 710099 565586 557293 1122879 985
1. Adilabad 18778 20342 39120 4617 4436 9053 23395 24778 48173 1059
2. Ananthapur 13098 12584 25682 18784 18047 36831 31882 30631 62513 961
3. Chittoor 5251 5465 10716 21727 20874 42601 26978 26339 53317 976
4. Kadapa 4495 4318 8813 7765 6352 14117 12260 10670 22930 870
5. East Godavari 8499 8846 17345 15122 14528 29650 23621 23374 46995 990
6. Guntur 9178 8819 17997 21415 22289 43704 30593 31108 61701 1017
7. Hyderabad - - - 92029 95785 187814 92029 95785 187814 1041
8. Karimnagar 3074 3200 6274 28948 27813 56761 32022 31013 63035 968
9. Khammam 2723 2617 5340 7487 7194 14681 10210 9811 20021 961
10. Krishna 8493 8159 16652 21353 20516 41869 29846 28675 58521 961
11. Kurnool 9579 9204 18783 11406 10958 22364 20985 20162 41147 961
12. Mahaboobnagar 14752 14174 28926 4296 3965 8261 19048 18139 37187 952
13. Medak 9866 9478 19344 9433 9064 18497 19299 18542 37841 961
14. Nalgonda 10901 10062 20963 3967 3812 7779 14868 13874 28742 933
15. Nellore 6126 5885 12011 13702 13165 26867 19828 19050 38878 961
16. Nizamabad 2172 2354 4526 7309 6746 14055 9481 9100 18581 960
17. Prakasham 6198 5954 12152 6597 6090 12687 12795 12044 24839 941
18. Rangareddi 27879 26785 54664 1570 1450 3020 29449 28235 57684 959
19. Srikakulam 11666 12142 23808 8328 8001 16329 19994 20143 40137 1007
20. Visakhapatnam 17657 18378 36035 11091 10657 21748 28748 29035 57783 1010
21. Vizianagaram 4844 5042 9886 3942 3788 7730 8786 8830 17616 1005
22. Warangal 3467 3756 7223 17635 16944 34579 21102 20700 41802 981
23. West Godavari 8425 8095 16520 19942 19160 39102 28367 27255 55622 961
9793 8095 17888 13090 10641 23731 22883 18736 41619 819
1. Changlang 381 271 652 468 355 823 849 626 1475 737
2. Dibang Valley 0 1 1 261 232 493 261 233 494 893
3. East Kameng 821 562 1383 1021 856 1877 1842 1418 3260 770
4. East Siang - - - 195 170 365 195 170 365 872
5. Lohit 1702 1322 3024 957 836 1793 2659 2158 4817 812
6. Lower Subansiri 1097 712 1809 400 376 776 1497 1088 2585 727
7. Papum Pare 2401 2253 4654 1520 1282 2802 3921 3535 7456 902
8. Tawang 677 678 1355 835 722 1557 1512 1400 2912 926
9. Tirap - - - 1754 1154 2908 1754 1154 2908 658
10. Upper Siang 204 236 440 342 323 665 546 559 1105 1024
11. Upper Subansiri - - - 352 341 693 352 341 693 969
12. West Kameng 1005 932 1937 1229 989 2218 2234 1921 4155 860
13. West Siang 1028 713 1741 2086 1630 3716 3114 2343 5457 752
14. Kurung Kumey 18 11 29 102 83 185 120 94 214 783
15. Lower Dibang Valley 157 144 301 1399 1132 2531 1556 1276 2832 820
16. Anjaw 302 260 562 169 160 329 471 420 891 892
270563 234721 505284 56714 50578 107292 327277 285299 612576 872
1. Borpeta 19883 18741 38624 6948 5689 12637 26831 24430 51261 911
2. Bongaigaon 6124 3909 10033 652 555 1207 6776 4464 11240 659
3. Baksa 11240 9064 20304 - - - 11240 9064 20304 806
4. Cachar 12451 11324 23775 4412 5006 9418 16863 16330 33193 968
5. Chirang 5621 4240 9861 741 783 1524 6362 5023 11385 790
6. Darrang 7845 7213 15058 1542 1560 3102 9387 8773 18160 935
7. Dhemaji 5621 4615 10236 325 389 714 5946 5004 10950 842
8. Dhubri 19164 17862 37026 987 637 1624 20151 18499 38650 918
9. Dibrugarh 9874 10018 19892 2206 2261 4467 12080 12279 24359 1016
10. Goalpara 11097 8786 19883 1654 1253 2907 12751 10039 22790 787
11. Golaghat 8956 8406 17362 754 507 1261 9710 8913 18623 918
12. Hailakandi 5421 4721 10142 512 495 1007 5933 5216 11149 879
13. Jorhat 9874 9254 19128 3652 3130 6782 13526 12384 25910 916
14. Kamrup ( R ) 14871 11481 26352 - - - 14871 11481 26352 772
15. Kamrup (M) - - - 16726 13914 30640 16726 13914 30640 832
Andhra Pradesh
Arunachal Pradesh
Assam
TABLE - 7: NUMBER OF LIVE BIRTHS REGISTERED - STATES/ UNION TERRITORIES/ DISTRICTS, 2012
Sl.
No.
States/ UTs /
Districts
Rural Urban TotalSRB
59

Male Female Person Male Female Person Male Female Person
1 2 3 4 5 6 7 8 9 10 11 12
TABLE - 7: NUMBER OF LIVE BIRTHS REGISTERED - STATES/ UNION TERRITORIES/ DISTRICTS, 2012
Sl.
No.
States/ UTs /
Districts
Rural Urban TotalSRB
16. Karbi Anglong 7410 5657 13067 642 625 1267 8052 6282 14334 780
17. Karimganj 12012 10248 22260 1845 1585 3430 13857 11833 25690 854
18. Kokrajhar 7412 5041 12453 3102 2460 5562 10514 7501 18015 713
19. Lakhimpur 8102 6424 14526 741 700 1441 8843 7124 15967 806
20. Morigaon 11421 9141 20562 1212 1112 2324 12633 10253 22886 812
21. Nagaon 26521 24347 50868 3258 2766 6024 29779 27113 56892 910
22. Nalbari 7120 5554 12674 1623 1739 3362 8743 7293 16036 834
23. N C Hills (Dima Hasao) 1842 1713 3555 121 165 286 1963 1878 3841 957
24. Sibsagar 6985 6601 13586 1652 1650 3302 8637 8251 16888 955
25. Sonitpur 16521 14162 30683 548 644 1192 17069 14806 31875 867
26. Tinsukia 8954 8360 17314 236 340 576 9190 8700 17890 947
27. Udalguri 8221 7839 16060 623 613 1236 8844 8452 17296 956
Bihar 1409729 648908 2058637
1. Patna 48599 83698 132297
2. Nalanda 59299 6919 66218
3. Bhojpur 26531 20404 46935
4. Buxar 35273 7984 43257
5. Rohtas 34148 9546 43694
6. Kaimur (Bhabua) 26694 8420 35114
7. Gaya 37513 34745 72258
8. Jehanabad 12518 12823 25341
9. Arwal 10358 1482 11840
10. Nawada 35951 12784 48735
11. Aurangabad 31099 11642 42741
12. Saran 52850 19273 72123
13. Siwan 32412 16197 48609
14. Gopalganj 28196 15746 43942
15. Muzaffarpur 51424 52455 103879
16. Champaran 'East' 47637 18341 65978
17. Champaran 'West' 71896 40395 112291
18. Sitamarhi 48523 9249 57772
19. Sheohar 8558 6012 14570
20. Vaishali 47961 18056 66017
21. Darbhanga 79815 30816 110631
22. Madhubani 68081 8633 76714
23. Samastipur 88197 33330 121527
24. Munger 21404 12990 34394
25. Lakhisarai 8128 7017 15145
26. Sheikhpura 13059 5181 18240
27. Jamui 18970 14703 33673
28. Begusarai 44810 10322 55132
29. Khagaria 30862 14798 45660
30. Bhagalpur 43889 22839 66728
31. Banka 30261 11823 42084
32. Saharsa 22144 7372 29516
33. Supaul 31403 14300 45703
34. Madhepura 28309 5546 33855
35. Purnia 51171 13080 64251
36. Kishanganj 23868 9184 33052
37. Araria 8577 14924 23501
38. Katihar 49341 5879 55220
Chhattisgarh 135108 122815 259605 100222 87712 189070 235330 210527 448675 895
1. Bastar 3352 3051 6403 1875 1777 3652 5227 4828 10055 924
2. Bilaspur 13419 12499 26188 7929 7298 15657 21348 19797 41845 927
3. Bijapur 1550 1056 2870 124 112 241 1674 1168 3111 698
4. Balodabazar 7879 7087 15309 2921 2831 6021 10800 9918 21330 918
5. Balod 3514 3162 6686 3062 2864 5930 6576 6026 12616 916
……
……
……
……
……
……
……
....
… N
ot
Av
ail
ab
le…
……
……
……
……
……
...…
…..
……
.
……
……
……
……
……
……
……
....
… N
ot
Av
ail
ab
le…
……
……
……
……
……
...…
…..
……
.
……
……
……
……
……
……
……
....
… N
ot
Av
ail
ab
le…
……
……
……
……
……
...…
…..
……
.
……
……
……
……
……
……
……
....
… N
ot
Av
ail
ab
le…
……
……
……
……
……
...…
…..
……
.
60

Male Female Person Male Female Person Male Female Person
1 2 3 4 5 6 7 8 9 10 11 12
TABLE - 7: NUMBER OF LIVE BIRTHS REGISTERED - STATES/ UNION TERRITORIES/ DISTRICTS, 2012
Sl.
No.
States/ UTs /
Districts
Rural Urban TotalSRB
6. Bemetara 6114 4656 10781 1158 1037 2209 7272 5693 12990 783
7. Balrampur 7384 6959 14343 158 107 265 7542 7066 14608 937
8. Dantewada 1105 1085 2212 933 780 1713 2038 1865 3925 915
9. Dhamtari 3444 3266 6710 5034 4578 9620 8478 7844 16330 925
10. Durg 3399 3071 6519 15036 13087 28145 18435 16158 34664 876
11. Gariyaband 4277 3623 7902 1275 1102 2377 5552 4725 10279 851
12. Janjgir-Champa 9390 8243 17642 4537 3983 8521 13927 12226 26163 878
13. Jashpur 6572 6188 12793 1359 1125 2558 7931 7313 15351 922
14. Kanker 3766 3376 7142 904 933 1837 4670 4309 8979 923
15. Kabeerdham(Kawardha) 6877 6292 13231 1903 1661 3572 8780 7953 16803 906
16. Korba 4154 4008 8168 9415 7749 17169 13569 11757 25337 866
17. Koriya 1575 1377 2953 1638 1282 2920 3213 2659 5873 828
18. Kondagaon 3163 2960 6125 754 715 1470 3917 3675 7595 938
19. Mahasamund 6059 5511 11576 2462 2133 4596 8521 7644 16172 897
20. Mungeli 5382 4868 10250 499 408 907 5881 5276 11157 897
21. Naraynapur 349 364 713 421 439 862 770 803 1575 1043
22. Raigarh 7396 6920 14510 6833 5690 12555 14229 12610 27065 886
23. Raipur 6483 6214 13036 19190 16918 36233 25673 23132 49269 901
24. Rajnandgaon 9012 8629 17653 5617 4812 10563 14629 13441 28216 919
25. Surguja 4788 4183 9017 4601 3842 8444 9389 8025 17461 855
26. Sukma 263 222 485 115 95 210 378 317 695 839
27. Surajpur 4442 3945 8388 469 354 823 4911 4299 9211 875
Goa 4224 3779 8003 7357 6979 14336 11581 10758 22339 929
1. North Goa 3691 3310 7001 3525 3365 6890 7216 6675 13891 925
2. South Goa 533 469 1002 3832 3614 7446 4365 4083 8448 935
Gujarat 234676 210224 444900 436304 395126 831430 670980 605350 1276330 902
1. Ahmadabad 10331 8972 19303 65574 58459 124033 75905 67431 143336 888
2. Amreli 8979 8183 17162 7553 7648 15201 16532 15831 32363 958
3. Anand 8269 7760 16029 15126 13333 28459 23395 21093 44488 902
4. Banas Kantha 11971 10855 22826 27075 24777 51852 39046 35632 74678 913
5. Bharuch 7683 7193 14876 7697 7116 14813 15380 14309 29689 930
6. Bhavnagar 12343 10285 22628 23953 22993 46946 36296 33278 69574 917
7. Dohad 19366 17435 36801 14031 13341 27372 33397 30776 64173 922
8. Gandhinagar 4476 3943 8419 10775 9672 20447 15251 13615 28866 893
9. Jamnagar 3912 3651 7563 16829 15418 32247 20741 19069 39810 919
10. Junagadh 9756 8564 18320 19446 17783 37229 29202 26347 55549 902
11. Kachchh 10502 9584 20086 15247 14517 29764 25749 24101 49850 936
12. Kheda 15937 14474 30411 8634 7776 16410 24571 22250 46821 906
13. Mahesana 7148 6175 13323 15827 14522 30349 22975 20697 43672 901
14. Narmada 3791 3533 7324 1834 1744 3578 5625 5277 10902 938
15. Navsari 5493 5279 10772 5003 4737 9740 10496 10016 20512 954
16. Panch Mahals 11188 10181 21369 20678 18732 39410 31866 28913 60779 907
17. Patan 4926 4433 9359 12174 10979 23153 17100 15412 32512 901
18. Porbandar 1435 1199 2634 4487 4415 8902 5922 5614 11536 948
19. Rajkot 9928 8853 18781 36012 32102 68114 45940 40955 86895 891
20. Sabar Kantha 17110 14401 31511 16733 16188 32921 33843 30589 64432 904
21. Surat 8548 7941 16489 45214 36901 82115 53762 44842 98604 834
22. Surendranagar 9733 8745 18478 9964 9405 19369 19697 18150 37847 921
23. Tapi 2692 2595 5287 2965 2810 5775 5657 5405 11062 955
24. The Dangs 2735 2849 5584 - - - 2735 2849 5584 1042
25. Vadodara 20358 17651 38009 23176 20083 43259 43534 37734 81268 867
26. Valsad 6066 5490 11556 10297 9675 19972 16363 15165 31528 927
Haryana 113638 96174 209812 194427 160041 354468 308065 256215 564280 832
1. Ambala 2876 2500 5376 8460 6891 15351 11336 9391 20727 828
2. Bhiwani 8744 7480 16224 7441 6207 13648 16185 13687 29872 846
3. Faridabad 4758 4379 9137 18832 16354 35186 23590 20733 44323 879
61

Male Female Person Male Female Person Male Female Person
1 2 3 4 5 6 7 8 9 10 11 12
TABLE - 7: NUMBER OF LIVE BIRTHS REGISTERED - STATES/ UNION TERRITORIES/ DISTRICTS, 2012
Sl.
No.
States/ UTs /
Districts
Rural Urban TotalSRB
4. Fatehabad 5657 4804 10461 6805 5663 12468 12462 10467 22929 840
5. Gurgaon 2599 2182 4781 17577 14773 32350 20176 16955 37131 840
6. Hisar 9107 7296 16403 12726 10626 23352 21833 17922 39755 821
7. Jhajjar 4220 3341 7561 4675 3605 8280 8895 6946 15841 781
8. Jind 5687 4743 10430 8506 6965 15471 14193 11708 25901 825
9. Kaithal 5071 4044 9115 7847 6400 14247 12918 10444 23362 808
10. Karnal 5806 4364 10170 12196 9984 22180 18002 14348 32350 797
11. Kurukshetra 3587 2724 6311 8405 6192 14597 11992 8916 20908 743
12. Mewat 15641 14347 29988 4892 4458 9350 20533 18805 39338 916
13. Narnaul (M.Garh) 3188 2398 5586 6348 4940 11288 9536 7338 16874 770
14. Palwal 8290 7494 15784 7463 6184 13647 15753 13678 29431 868
15. Panchkula 1236 1136 2372 5848 5189 11037 7084 6325 13409 893
16. Panipat 5267 4651 9918 9541 7695 17236 14808 12346 27154 834
17. Rewari 3398 2671 6069 7290 5665 12955 10688 8336 19024 780
18. Rohtak 2380 1916 4296 12305 10121 22426 14685 12037 26722 820
19. Sirsa 5787 5049 10836 8388 6842 15230 14175 11891 26066 839
20. Sonipat 5933 4929 10862 10130 8047 18177 16063 12976 29039 808
21. Yamunanagar 4406 3726 8132 8752 7240 15992 13158 10966 24124 833
Himachal Pradesh 43540 40018 83558 23066 20987 44053 66606 61005 127611 916
1. Bilaspur 2921 2577 5498 1275 1150 2425 4196 3727 7923 888
2. Chamba 4355 4251 8606 1054 1008 2062 5409 5259 10668 972
3. Hamirpur 2042 1775 3817 2736 2471 5207 4778 4246 9024 889
4. Kangra 11221 9939 21160 2822 2521 5343 14043 12460 26503 887
5. Kinnaur 464 429 893 - - - 464 429 893 925
6. Kullu 2001 2055 4056 2053 1971 4024 4054 4026 8080 993
7. Lahul & Spiti 112 110 222 - - - 112 110 222 982
8. Mandi 5610 5077 10687 3157 2871 6028 8767 7948 16715 907
9. Shimla 3434 3393 6827 4800 4427 9227 8234 7820 16054 950
10. Sirmaur 3795 3507 7302 1818 1568 3386 5613 5075 10688 904
11. Solan 2930 2682 5612 2830 2590 5420 5760 5272 11032 915
12. Una 4655 4223 8878 521 410 931 5176 4633 9809 895
Jharkhand 163347 143782 307129 101898 80926 182824 265245 224708 489953 847
1. Bokaro 9579 8181 17760 8803 7439 16242 18382 15620 34002 850
2. Chatra 8711 7774 16485 1712 1581 3293 10423 9355 19778 898
3. Deoghar 614 657 1271 1901 2716 4617 2515 3373 5888 1341
4. Dhanbad 9651 8949 18600 12311 11152 23463 21962 20101 42063 915
5. Dumka 8559 7192 15751 1926 1857 3783 10485 9049 19534 863
6. E. Singhbhum 8336 7843 16179 20155 4789 24944 28491 12632 41123 443
7. Garhwa 3467 2827 6294 2983 2688 5671 6450 5515 11965 855
8. Giridih 19754 13103 32857 1284 846 2130 21038 13949 34987 663
9. Godda 9584 8146 17730 2195 2095 4290 11779 10241 22020 869
10. Gumla 10883 10577 21460 1767 1691 3458 12650 12268 24918 970
11. Hazaribagh 13134 11736 24870 5265 4986 10251 18399 16722 35121 909
12. Jamtara 4392 4124 8516 2116 2076 4192 6508 6200 12708 953
13. Kodarma 5894 6054 11948 1409 1277 2686 7303 7331 14634 1004
14. Khunti 957 1081 2038 1118 1090 2208 2075 2171 4246 1046
15. Latehar 1251 1183 2434 173 218 391 1424 1401 2825 984
16. Lohardaga 3889 3888 7777 2334 2144 4478 6223 6032 12255 969
17. Pakur
18. Palamu 12707 11346 24053 4754 4350 9104 17461 15696 33157 899
19. Ranchi 1954 1986 3940 16669 15248 31917 18623 17234 35857 925
20. Ramgarh 5134 4500 9634 1830 1745 3575 6964 6245 13209 897
21. Sahebganj 9822 8977 18799 7313 7132 14445 17135 16109 33244 940
22. Saraikela-Kharsawan 2705 2734 5439 870 947 1817 3575 3681 7256 1030
23. Simdega 6734 6275 13009 892 812 1704 7626 7087 14713 929
24. W. Singhbhum 5636 4649 10285 2118 2047 4165 7754 6696 14450 864
………………………………….……………… Not Available……………………………………………………….
62

Male Female Person Male Female Person Male Female Person
1 2 3 4 5 6 7 8 9 10 11 12
TABLE - 7: NUMBER OF LIVE BIRTHS REGISTERED - STATES/ UNION TERRITORIES/ DISTRICTS, 2012
Sl.
No.
States/ UTs /
Districts
Rural Urban TotalSRB
Karnataka 161352 157921 319273 409029 396188 805217 570381 554109 1124490 971
1. Bagalkote 4935 5153 10088 20591 18628 39219 25526 23781 49307 932
2. Bangalore Urban 3201 2675 5876 73381 69922 143303 76582 72597 149179 948
3. Bangalore Rural 1040 949 1989 4120 4209 8329 5160 5158 10318 1000
4. Belgaum 18702 18058 36760 28817 29482 58299 47519 47540 95059 1000
5. Bellary 12065 12634 24699 17645 17686 35331 29710 30320 60030 1021
6. Bidar 6832 6772 13604 13118 12237 25355 19950 19009 38959 953
7. Bijapur 13061 14050 27111 15848 15669 31517 28909 29719 58628 1028
8. Chamarajanagar 3363 3238 6601 3439 3347 6786 6802 6585 13387 968
9. Chikmagalur 1897 1750 3647 6956 6755 13711 8853 8505 17358 961
10. Chitradurga 4415 4413 8828 9301 9269 18570 13716 13682 27398 998
11. Chikballapur 1414 1379 2793 6651 6175 12826 8065 7554 15619 937
12. Dakshina Kannada 4750 3468 8218 16459 15546 32005 21209 19014 40223 897
13. Davanagere 3726 3719 7445 14770 14702 29472 18496 18421 36917 996
14. Dharwad 2514 1959 4473 17206 16647 33853 19720 18606 38326 944
15. Gadag 3490 2829 6319 8671 7967 16638 12161 10796 22957 888
16. Gulbarga 14253 15339 29592 13056 14477 27533 27309 29816 57125 1092
17. Hassan 2750 2249 4999 11865 10036 21901 14615 12285 26900 841
18. Haveri 5822 5553 11375 11399 10277 21676 17221 15830 33051 919
19. Kodagu 1204 1014 2218 2969 2925 5894 4173 3939 8112 944
20. Kolar 2373 2448 4821 9119 8555 17674 11492 11003 22495 957
21. Koppal 8903 9310 18213 4989 5061 10050 13892 14371 28263 1034
22. Mandya 2231 2111 4342 9047 8532 17579 11278 10643 21921 944
23. Mysore 2491 2201 4692 22486 21198 43684 24977 23399 48376 937
24. Raichur 6237 6099 12336 8696 8469 17165 14933 14568 29501 976
25. Ramanagar 2054 1836 3890 5173 4956 10129 7227 6792 14019 940
26. Shimoga 2268 2089 4357 14314 14314 28628 16582 16403 32985 989
27. Tumkur 6255 6121 12376 17068 15346 32414 23323 21467 44790 920
28. Udupi 2131 1739 3870 7810 7581 15391 9941 9320 19261 938
29. Uttara Kannada 2227 1881 4108 9772 11156 20928 11999 13037 25036 1087
30. Yadgir 14748 14885 29633 4293 5064 9357 19041 19949 38990 1048
Kerala 105304 98078 203394 173162 167816 340994 278466 265894 544388 955
1. Alappuzha 4690 4123 8814 6459 6326 12785 11149 10449 21599 937
2. Ernakulam 3839 3634 7475 19906 19799 39708 23745 23433 47183 987
3. Idukki 5030 4893 9923 2591 2493 5084 7621 7386 15007 969
4. Kannoor 4585 4310 8897 21473 20539 42015 26058 24849 50912 954
5. Kasaragod 3914 3423 7337 7805 7332 15137 11719 10755 22474 918
6. Kollam 9159 8675 17834 8750 8669 17419 17909 17344 35253 968
7. Kottayam 9840 9384 19227 4328 4186 8514 14168 13570 27741 958
8. Kozhikode 8359 7840 16200 20637 21591 42233 28996 29431 58433 1015
9. Malappuram 21596 20109 41706 26671 25248 51922 48267 45357 93628 940
10. Palakkad 9951 8919 18870 11705 10936 22641 21656 19855 41511 917
11. Pathanamthitta 4484 4543 9027 4238 3982 8220 8722 8525 17247 977
12. Thiruvananthapuram 6040 5013 11054 20863 19829 40694 26903 24842 51748 923
13. Thrissur 8428 7948 16377 15655 14866 30521 24083 22814 46898 947
14. Wayanad 5389 5264 10653 2081 2020 4101 7470 7284 14754 975
Madhya Pradesh 326268 298298 624566 568402 517540 1085942 894670 815838 1710508 912
1. Ashoknagar 3028 2816 5844 8246 7992 16238 11274 10808 22082 959
2. Annuppur 2056 1861 3917 2790 2645 5435 4846 4506 9352 930
3. Alirajpuir 5378 5693 11071 4259 4136 8395 9637 9829 19466 1020
4. Balaghat 43528 41473 85001 21285 20380 41665 64813 61853 126666 954
5. Barwani 3846 3841 7687 16464 15526 31990 20310 19367 39677 954
6. Betul 5249 4888 10137 8126 7623 15749 13375 12511 25886 935
7. Bhind 6773 5107 11880 11427 9831 21258 18200 14938 33138 821
8. Bhopal 2096 1866 3962 37602 34174 71776 39698 36040 75738 908
9. Burhanpur 2861 2540 5401 5891 5620 11511 8752 8160 16912 932
10. Chhatarpur 6918 6169 13087 19005 17839 36844 25923 24008 49931 926
63

Male Female Person Male Female Person Male Female Person
1 2 3 4 5 6 7 8 9 10 11 12
TABLE - 7: NUMBER OF LIVE BIRTHS REGISTERED - STATES/ UNION TERRITORIES/ DISTRICTS, 2012
Sl.
No.
States/ UTs /
Districts
Rural Urban TotalSRB
11. Chhindwara 8803 8001 16804 14216 12611 26827 23019 20612 43631 895
12. Damoh 14116 13670 27786 8187 7702 15889 22303 21372 43675 958
13. Datia 2809 2562 5371 4488 4115 8603 7297 6677 13974 915
14. Dewas 2901 2670 5571 16124 14420 30544 19025 17090 36115 898
15. Dhar 7757 7350 15107 12992 11976 24968 20749 19326 40075 931
16. Dindori 4550 4614 9164 1505 1339 2844 6055 5953 12008 983
17. Guna 4613 4308 8921 10331 9411 19742 14944 13719 28663 918
18. Gwalior 4721 4400 9121 23496 21315 44811 28217 25715 53932 911
19. Harda 1104 1093 2197 3409 3125 6534 4513 4218 8731 935
20. Hoshangabad 3274 2985 6259 8105 6954 15059 11379 9939 21318 873
21. Indore 8188 6665 14853 29881 27068 56949 38069 33733 71802 886
22. Jabalpur 13716 12063 25779 22166 21991 44157 35882 34054 69936 949
23. Jhabua 6720 6214 12934 7917 7171 15088 14637 13385 28022 914
24. Katni 15890 13794 29684 5524 4868 10392 21414 18662 40076 871
25. Khandwa (East Nimar) 6213 4943 11156 7312 5846 13158 13525 10789 24314 798
26. Khargone (West Nimar) 6425 6073 12498 11758 10815 22573 18183 16888 35071 929
27. Mandla 3372 3347 6719 3508 3317 6825 6880 6664 13544 969
28. Mandsaur 4862 4282 9144 8095 7192 15287 12957 11474 24431 886
29. Morena 7391 5811 13202 18064 14900 32964 25455 20711 46166 814
30. Narsimhapur 5555 4500 10055 8400 7150 15550 13955 11650 25605 835
31. Neemuch 1065 956 2021 5929 5140 11069 6994 6096 13090 872
32. Panna 7138 6974 14112 4706 4450 9156 11844 11424 23268 965
33. Raisen 6542 6340 12882 10225 8089 18314 16767 14429 31196 861
34. Rajgarh 3057 2845 5902 11741 11266 23007 14798 14111 28909 954
35. Ratlam 4017 3485 7502 12027 10751 22778 16044 14236 30280 887
36. Rewa 6145 5744 11889 17579 15664 33243 23724 21408 45132 902
37. Sagar 14422 13560 27982 18587 17482 36069 33009 31042 64051 940
38. Satna 9623 9215 18838 13481 12955 26436 23104 22170 45274 960
39. Sehore 3667 3391 7058 11551 10825 22376 15218 14216 29434 934
40. Seoni 6394 5888 12282 6038 5344 11382 12432 11232 23664 903
41. Shahdol 5322 4892 10214 10064 9226 19290 15386 14118 29504 918
42. Shajapur 2761 2622 5383 13168 11974 25142 15929 14596 30525 916
43. Sheopur 4806 4367 9173 3069 2660 5729 7875 7027 14902 892
44. Shivpuri 6361 5984 12345 11015 10051 21066 17376 16035 33411 923
45. Sidhi 9677 7426 17103 6152 5008 11160 15829 12434 28263 786
46. Singroli 1348 1358 2706 4374 3547 7921 5722 4905 10627 857
47. Tikamgarh 3318 2845 6163 11128 9883 21011 14446 12728 27174 881
48. Ujjain 4304 4061 8365 20161 18415 38576 24465 22476 46941 919
49. Umaria 5542 5244 10786 2404 2254 4658 7946 7498 15444 944
50. Vidisha 6046 5502 11548 14430 13504 27934 20476 19006 39482 928
Maharashtra 364253 317294 681547 668663 606076 1274739 1032916 923370 1956286 894
1. Ahmadnagar 30021 26286 56307 20645 18394 39039 50666 44680 95346 882
2. Akola 4960 4611 9571 10914 10403 21317 15874 15014 30888 946
3. Amrawati 7773 7317 15090 16993 16388 33381 24766 23705 48471 957
4. Aurangabad 9741 8184 17925 32119 28630 60749 41860 36814 78674 879
5. Bhandara 4663 4340 9003 6228 6313 12541 10891 10653 21544 978
6. Beed 13987 11386 25373 18522 16399 34921 32509 27785 60294 855
7. Buldhana 13040 11220 24260 16320 14456 30776 29360 25676 55036 875
8. Chandrapur 8219 7343 15562 11301 10237 21538 19520 17580 37100 901
9. Dhule 6147 5593 11740 12418 11329 23747 18565 16922 35487 912
10. Gadchiroli 8224 6771 14995 849 746 1595 9073 7517 16590 829
11. Gondia 7111 6397 13508 3848 3444 7292 10959 9841 20800 898
12. Hingoli 6185 5322 11507 5882 5129 11011 12067 10451 22518 866
13. Jalgaon 17402 14983 32385 29906 25945 55851 47308 40928 88236 865
14. Jalana 8799 7368 16167 7744 6764 14508 16543 14132 30675 854
15. Kolhapur 9433 8485 17918 22553 19973 42526 31986 28458 60444 890
16. Latur 10085 9091 19176 18577 16575 35152 28662 25666 54328 895
17. Mumbai - - - 92960 85728 178688 92960 85728 178688 922
64

Male Female Person Male Female Person Male Female Person
1 2 3 4 5 6 7 8 9 10 11 12
TABLE - 7: NUMBER OF LIVE BIRTHS REGISTERED - STATES/ UNION TERRITORIES/ DISTRICTS, 2012
Sl.
No.
States/ UTs /
Districts
Rural Urban TotalSRB
18. Nagpur 6409 5565 11974 24840 22953 47793 31249 28518 59767 913
19. Nanded 14494 12842 27336 18446 16276 34722 32940 29118 62058 884
20. Nandurbar 13088 12038 25126 5821 5023 10844 18909 17061 35970 902
21. Nashik 26144 21768 47912 37229 32826 70055 63373 54594 117967 861
22. Osmanabad 6475 5621 12096 9653 8792 18445 16128 14413 30541 894
23. Parbhani 7235 6503 13738 10970 9828 20798 18205 16331 34536 897
24. Pune 18764 15990 34754 58510 53314 111824 77274 69304 146578 897
25. Raigad 10024 8968 18992 10677 9911 20588 20701 18879 39580 912
26. Ratnagiri 5560 5155 10715 5703 5497 11200 11263 10652 21915 946
27. Sangli 11322 9781 21103 15917 13994 29911 27239 23775 51014 873
28. Satara 13349 12192 25541 13032 12055 25087 26381 24247 50628 919
29. Sindhudurg 2319 2242 4561 3344 3349 6693 5663 5591 11254 987
30. Solapur 24399 20569 44968 28019 25335 53354 52418 45904 98322 876
31. Thane 16397 14341 30738 72677 66336 139013 89074 80677 169751 906
32. Wardha 5197 4888 10085 3313 3105 6418 8510 7993 16503 939
33. Washim 4673 3918 8591 5112 4667 9779 9785 8585 18370 877
34. Yavatmal 12614 10216 22830 17621 15962 33583 30235 26178 56413 866
Manipur 4135 3463 7598 12656 9918 22574 16791 13381 30172 797
1. Bishnupur 1 1 2 9 5 14 10 6 16 600
2. Chandel 51 52 103 - - - 51 52 103 1020
3. Churachandpur 4 6 10 - - - 4 6 10 1500
4. Imphal(East) 1892 1846 3738 2015 1928 3943 3907 3774 7681 966
5. Imphal(West) 509 355 864 9553 7343 16896 10062 7698 17760 765
6. Senapati
7. Tamenglong 989 614 1603 - - - 989 614 1603 621
8. Thoubal 100 74 174 1079 642 1721 1179 716 1895 607
9. Ukhrul 589 515 1104 - - - 589 515 1104 874
Meghalaya 42679 40657 83336 9711 8965 18676 52390 49622 102012 947
1. East Garo Hills 4809 4657 9466 1042 833 1875 5851 5490 11341 938
2. East Khasi Hills 10348 10456 20804 4646 4298 8944 14994 14754 29748 984
3. Jaintia Hills 4298 4083 8381 1797 1703 3500 6095 5786 11881 949
4. Ri Bhoi 4545 4025 8570 - - - 4545 4025 8570 886
5. South Garo Hills 1610 1457 3067 286 280 566 1896 1737 3633 916
6. West Garo Hills 12303 11312 23615 1940 1851 3791 14243 13163 27406 924
7. West Khasi Hills 4766 4667 9433 - - - 4766 4667 9433 979
Mizoram 5586 5356 10942 7647 7453 15100 13233 12809 26042 968
1. Aizawl 556 560 1116 4745 4626 9371 5301 5186 10487 978
2. Champhai 712 695 1407 533 512 1045 1245 1207 2452 969
3. Chhimtuipui (Saiha) 330 335 665 357 351 708 687 686 1373 999
4. Kolasib 373 405 778 546 532 1078 919 937 1856 1020
5. Lawngtlai 1559 1465 3024 - - - 1559 1465 3024 940
6. Lunglei 873 777 1650 993 1002 1995 1866 1779 3645 953
7. Mamit 966 912 1878 140 129 269 1106 1041 2147 941
8. Serchhip 217 207 424 333 301 634 550 508 1058 924
Nagaland 13585 12097 25682 10822 9205 20027 24407 21302 45709 873
1. Dimapur 2630 2423 5053 2328 1940 4268 4958 4363 9321 880
2. Kohima 2639 2367 5006 2132 1927 4059 4771 4294 9065 900
3. Mokokchung 1814 1734 3548 1608 1359 2967 3422 3093 6515 904
4. Mon 1023 999 2022 886 744 1630 1909 1743 3652 913
5. Phek 804 752 1556 734 691 1425 1538 1443 2981 938
6. Tuensang 944 877 1821 685 686 1371 1629 1563 3192 959
7. Wokha 994 905 1899 720 598 1318 1714 1503 3217 877
8. Zunheboto 983 970 1953 659 454 1113 1642 1424 3066 867
9. Peren 543 384 927 338 295 633 881 679 1560 771
10. Longleng 562 409 971 383 310 693 945 719 1664 761
………………………………….……………… Not Available……………………………………………………….
65

Male Female Person Male Female Person Male Female Person
1 2 3 4 5 6 7 8 9 10 11 12
TABLE - 7: NUMBER OF LIVE BIRTHS REGISTERED - STATES/ UNION TERRITORIES/ DISTRICTS, 2012
Sl.
No.
States/ UTs /
Districts
Rural Urban TotalSRB
11. Kiphire 649 277 926 349 201 550 998 478 1476 479
Odisha 218880 196962 415842 198064 176742 374806 416944 373704 790648 896
1. Angul 7650 6651 14301 7089 6302 13391 14739 12953 27692 879
2. Bolangir 7154 6772 13926 11537 10674 22211 18691 17446 36137 933
3. Balasore 12302 10958 23260 10041 9416 19457 22343 20374 42717 912
4. Bargarh 3711 3537 7248 5181 4577 9758 8892 8114 17006 913
5. Bhadrak 7513 6534 14047 6531 5765 12296 14044 12299 26343 876
6. Boudh 3343 3110 6453 641 618 1259 3984 3728 7712 936
7. Cuttack 12004 9865 21869 17844 15798 33642 29848 25663 55511 860
8. Deogarh 1614 1538 3152 649 630 1279 2263 2168 4431 958
9. Dhenkanal 6181 5436 11617 4707 3823 8530 10888 9259 20147 850
10. Gajapati 3945 3734 7679 2028 1805 3833 5973 5539 11512 927
11. Ganjam 13375 10513 23888 23418 21375 44793 36793 31888 68681 867
12. Jagatsinghpur 5144 4252 9396 3909 3368 7277 9053 7620 16673 842
13. Jajpur 12038 10101 22139 7429 6009 13438 19467 16110 35577 828
14. Jharsuguda 1322 1219 2541 4723 4114 8837 6045 5333 11378 882
15. Kalahandi 9565 9272 18837 4405 4247 8652 13970 13519 27489 968
16. Kandhamal 6615 6437 13052 1542 1316 2858 8157 7753 15910 950
17. Kendrapara 8501 6488 14989 5662 5243 10905 14163 11731 25894 828
18. Keonjhar 11761 11229 22990 5926 5570 11496 17687 16799 34486 950
19. Khurda 4411 3726 8137 21242 18961 40203 25653 22687 48340 884
20. Koraput 10628 10418 21046 4687 4278 8965 15315 14696 30011 960
21. Malkangiri 6061 6124 12185 1289 1176 2465 7350 7300 14650 993
22. Mayurbhanj 14431 13857 28288 7320 6507 13827 21751 20364 42115 936
23. Nabarangpur 10896 10227 21123 3098 2866 5964 13994 13093 27087 936
24. Nayagarh 4786 3651 8437 3926 3096 7022 8712 6747 15459 774
25. Nuapada 5639 5475 11114 2174 1988 4162 7813 7463 15276 955
26. Puri 5313 4405 9718 5682 5208 10890 10995 9613 20608 874
27. Rayagada 8364 7996 16360 2292 2006 4298 10656 10002 20658 939
28. Sambalpur 2683 2516 5199 7921 7108 15029 10604 9624 20228 908
29. Subarnapur 2998 2865 5863 1685 1567 3252 4683 4432 9115 946
30. Sundargarh 8932 8056 16988 13486 11331 24817 22418 19387 41805 865
Punjab 81508 68356 149864 177818 150494 328312 259326 218850 478176 844
1. Amritsar 8828 7735 16563 13970 9947 23917 22798 17682 40480 776
2. Bathinda 3285 2971 6256 9295 7855 17150 12580 10826 23406 861
3. Barnala 927 848 1775 3847 3356 7203 4774 4204 8978 881
4. Faridkot 1416 1385 2801 4907 4363 9270 6323 5748 12071 909
5. Fatehgarh Sahib 1271 1083 2354 2892 2414 5306 4163 3497 7660 840
6. Firozepur 5909 5387 11296 10548 8763 19311 16457 14150 30607 860
7. Gurdaspur 8969 7914 16883 12531 10393 22924 21500 18307 39807 851
8. Hoshiarpur 4084 3607 7691 9044 7845 16889 13128 11452 24580 872
9. Jalandhar 5912 5307 11219 16927 14520 31447 22839 19827 42666 868
10. Kapurthala 1634 1129 2763 5075 4915 9990 6709 6044 12753 901
11. Ludhiana 10634 7776 18410 31435 27032 58467 42069 34808 76877 827
12. Mansa 1796 1595 3391 4684 4069 8753 6480 5664 12144 874
13. Mohali 787 563 1350 4818 4487 9305 5605 5050 10655 901
14. Moga 2157 2007 4164 5690 4951 10641 7847 6958 14805 887
15. Muktsar 2591 2568 5159 5108 4455 9563 7699 7023 14722 912
16. Nawanshahr 2464 1919 4383 3606 3265 6871 6070 5184 11254 854
17. Patiala 3565 2647 6212 14268 11984 26252 17833 14631 32464 820
18. Ropar (Rup Nagar) 2509 1548 4057 5054 4263 9317 7563 5811 13374 768
19. Sangrur 3043 2655 5698 10060 8680 18740 13103 11335 24438 865
20. Taran Taran 9727 7712 17439 4059 2937 6996 13786 10649 24435 772
Rajasthan 400066 326890 726956 544335 486402 1030737 944401 813292 1757693 861
1. Ajmer 8646 7606 16252 30312 25607 55919 38958 33213 72171 853
66

Male Female Person Male Female Person Male Female Person
1 2 3 4 5 6 7 8 9 10 11 12
TABLE - 7: NUMBER OF LIVE BIRTHS REGISTERED - STATES/ UNION TERRITORIES/ DISTRICTS, 2012
Sl.
No.
States/ UTs /
Districts
Rural Urban TotalSRB
2. Alwar 24810 20301 45111 20468 17763 38231 45278 38064 83342 841
3. Banswara 14313 11483 25796 8649 8020 16669 22962 19503 42465 849
4. Baran 8642 8046 16688 7017 6183 13200 15659 14229 29888 909
5. Barmer 20910 18477 39387 9178 8546 17724 30088 27023 57111 898
6. Bharatpur 12294 10823 23117 21067 19591 40658 33361 30414 63775 912
7. Bhilwara 14989 14835 29824 18524 16947 35471 33513 31782 65295 948
8. Bikaner 13940 11945 25885 18990 17189 36179 32930 29134 62064 885
9. Bundi 6334 5620 11954 7035 6004 13039 13369 11624 24993 869
10. Chittaurgarh 7563 6049 13612 12011 9588 21599 19574 15637 35211 799
11. Churu 10364 7922 18286 20303 17674 37977 30667 25596 56263 835
12. Dausa 10097 9943 20040 9708 8888 18596 19805 18831 38636 951
13. Dhaulpur 4958 3630 8588 10090 8805 18895 15048 12435 27483 826
14. Dungarpur 9983 8988 18971 6828 5768 12596 16811 14756 31567 878
15. Ganganagar 10057 8633 18690 14417 12817 27234 24474 21450 45924 876
16. Hanumangarh 10716 8969 19685 12308 11204 23512 23024 20173 43197 876
17. Jaipur 21080 14984 36064 78439 71971 150410 99519 86955 186474 874
18. Jaisalmer 6796 5598 12394 4478 3646 8124 11274 9244 20518 820
19. Jalor 13940 11983 25923 7773 7597 15370 21713 19580 41293 902
20. Jhalawar 8254 6688 14942 9361 9018 18379 17615 15706 33321 892
21. Jhunjhunun 11103 7821 18924 16833 14297 31130 27936 22118 50054 792
22. Jodhpur 21459 16515 37974 37369 33618 70987 58828 50133 108961 852
23. Karauli 6061 4166 10227 12769 11383 24152 18830 15549 34379 826
24. Kota 8064 4950 13014 22088 21105 43193 30152 26055 56207 864
25. Nagaur 22384 16643 39027 20917 19522 40439 43301 36165 79466 835
26. Pali 15960 14758 30718 16665 14838 31503 32625 29596 62221 907
27. Partapgarh 7823 6057 13880 5312 4648 9960 13135 10705 23840 815
28. Rajsamand 8655 7386 16041 5466 4934 10400 14121 12320 26441 872
29. Sawai Madhopur 8449 6833 15282 12011 10700 22711 20460 17533 37993 857
30. Sikar 16027 10586 26613 26528 21492 48020 42555 32078 74633 754
31. Sirohi 8585 7235 15820 7757 7102 14859 16342 14337 30679 877
32. Tonk 6014 5208 11222 12839 11520 24359 18853 16728 35581 887
33. Udaipur 20796 16209 37005 20825 18417 39242 41621 34626 76247 832
Sikkim 1083 1110 2206 3258 3118 6385 4341 4228 8591 974
1. East 296 284 589 2198 2080 4284 2494 2364 4873 948
2. North 74 83 157 111 120 232 185 203 389 1097
3. South 280 256 539 662 654 1317 942 910 1856 966
4. West 433 487 921 287 264 552 720 751 1473 1043
Tamil Nadu 198317 177212 375529 434709 394854 829563 633026 572066 1205092 904
1. Krishnagiri 7571 6910 14481 9208 8302 17510 16779 15212 31991 907
2. Chennai - - - 60543 57036 117579 60543 57036 117579 942
3. Coimbatore 3671 3493 7164 25904 24030 49934 29575 27523 57098 931
4. Cuddalore 5480 4263 9743 17264 13280 30544 22744 17543 40287 771
5. Dharmapuri 7321 6844 14165 6679 5613 12292 14000 12457 26457 890
6. Dindigul 7782 7608 15390 9971 9118 19089 17753 16726 34479 942
7. Erode 4636 4497 9133 13626 12395 26021 18262 16892 35154 925
8. Kancheepuram 5694 5495 11189 12834 12046 24880 18528 17541 36069 947
9. Kanyakumari 3038 1958 4996 16467 14197 30664 19505 16155 35660 828
10. Karur 2026 1705 3731 5650 4926 10576 7676 6631 14307 864
11. Madurai 5493 5277 10770 24316 23828 48144 29809 29105 58914 976
12. Nagapattinam 9468 9103 18571 9085 8191 17276 18553 17294 35847 932
13. Namakkal 4055 3123 7178 8957 7707 16664 13012 10830 23842 832
14. Perambalur 8155 4351 12506 8231 6685 14916 16386 11036 27422 674
15. Pudukottai 6719 6637 13356 7989 7476 15465 14708 14113 28821 960
16. Ramanathapuram 7102 3573 10675 8454 7530 15984 15556 11103 26659 714
17. Salem 11421 10973 22394 21466 19049 40515 32887 30022 62909 913
18. Sivaganga 3502 3136 6638 7239 6054 13293 10741 9190 19931 856
19. Thanjavur 6932 4833 11765 21814 19388 41202 28746 24221 52967 843
67

Male Female Person Male Female Person Male Female Person
1 2 3 4 5 6 7 8 9 10 11 12
TABLE - 7: NUMBER OF LIVE BIRTHS REGISTERED - STATES/ UNION TERRITORIES/ DISTRICTS, 2012
Sl.
No.
States/ UTs /
Districts
Rural Urban TotalSRB
20. The Nilgiris 1997 1872 3869 2921 2716 5637 4918 4588 9506 933
21. Theni 4075 3879 7954 7293 6442 13735 11368 10321 21689 908
22. Thiruvallur 6459 6259 12718 6051 5608 11659 12510 11867 24377 949
23. Thiruvarur 3092 3072 6164 6309 5469 11778 9401 8541 17942 909
24. Tiruchirappalli 2571 2420 4991 19647 17780 37427 22218 20200 42418 909
25. Tirunelveli 15335 13249 28584 22714 21371 44085 38049 34620 72669 910
26. Tiruvanamalai 10473 9680 20153 6979 6035 13014 17452 15715 33167 900
27. Thiruppur 3000 2765 5765 7759 7385 15144 10759 10150 20909 943
28. Thoothukudi 1023 1442 2465 12176 11079 23255 13199 12521 25720 949
29. Vellore 12393 11440 23833 26105 24358 50463 38498 35798 74296 930
30. Viluppuram 20374 19901 40275 7377 7153 14530 27751 27054 54805 975
31. Virudhunagar 7459 7454 14913 13681 12607 26288 21140 20061 41201 949
Tripura 14999 16706 31705 8460 6284 14744 23459 22990 46449 980
1. Dhalai 1025 1600 2625 - - - 1025 1600 2625 1561
2. Gomati 1636 1685 3321 - - - 1636 1685 3321 1030
3. Khowai 1325 1545 2870 - - - 1325 1545 2870 1166
4. North Tripura 1773 2275 4048 - - - 1773 2275 4048 1283
5. Shipahijala 1507 1708 3215 - - - 1507 1708 3215 1133
6. South Tripura 2697 2877 5574 - - - 2697 2877 5574 1067
7. Unokuti 686 1052 1738 - - - 686 1052 1738 1534
8. West Tripura 4350 3964 8314 8460 6284 14744 12810 10248 23058 800
Uttarakhand 28980 25497 54477 51202 42399 93601 80182 67896 148078 847
1. Pauri 3844 3234 7078 1938 1704 3642 5782 4938 10720 854
2. Tehri 3754 3554 7308 935 787 1722 4689 4341 9030 926
3. Chamoli 4149 3513 7662 1453 1287 2740 5602 4800 10402 857
4. Uttarkashi 522 511 1033 927 809 1736 1449 1320 2769 911
5. Rudraprayag 1251 1202 2453 495 427 922 1746 1629 3375 933
6. Pithoragarh 1443 1250 2693 1468 1314 2782 2911 2564 5475 881
7. Almora 2897 2771 5668 1787 1453 3240 4684 4224 8908 902
8. Champawat - - - 930 789 1719 930 789 1719 848
9. Bageswar 1109 1012 2121 402 378 780 1511 1390 2901 920
10. Nainital 1174 1074 2248 9200 7735 16935 10374 8809 19183 849
11. U.S. Nagar 2345 2177 4522 8841 7237 16078 11186 9414 20600 842
12. Haridwar 3505 2407 5912 9245 7145 16390 12750 9552 22302 749
13. Dehradun 2987 2792 5779 13581 11334 24915 16568 14126 30694 853
Uttar Pradesh 3237346
1 Saharanpur 78427
2 Muzaffarnagar 58500
3 Bijnor 59114
4 Moradabad 55337
5 Rampur 26798
6 Jyotibaphulenagar 29280
7 Meerut 114008
8 Bagpat 36064
9 Ghaziabad 26090
10 Gautambudhnagar 47585
11 Bulandshahr 90290
12 Aligarh 18488
13 Kashi ram nagar 12008
14 Hathras 21879
15 Mathura 18978
16 Agra 35835
17 Firozabad 80239
18 Etah 40453
19 Mainpuri 26617
…..
.… N
ot
Av
ail
ab
le…
……
…..
.… N
ot
Av
ail
ab
le…
……
…..
.… N
ot
Av
ail
ab
le…
……
…..
.… N
ot
Av
ail
ab
le…
……
68

Male Female Person Male Female Person Male Female Person
1 2 3 4 5 6 7 8 9 10 11 12
TABLE - 7: NUMBER OF LIVE BIRTHS REGISTERED - STATES/ UNION TERRITORIES/ DISTRICTS, 2012
Sl.
No.
States/ UTs /
Districts
Rural Urban TotalSRB
20 Badaun 89721
21 Bareilly 102625
22 Pilibhit 37935
23 Shajhanpur 59846
24 Lakhmipur-Keri 10364
25 Sitapur 23137
26 Hardoi 39312
27 Unnao 45649
28 Lucknow 123077
29 Raibareilly 41634
30 Farrukhabad 34411
31 Kannauj 14773
32 Etawah 9422
33 Auraiya 14556
34 Kanpur (Dehat) 40409
35 Kanpur (Nagar) 62145
36 Jalaun 27757
37 Jhansi 27680
38 Lalitpur 22118
39 Hamirpur 22381
40 Mahoba 6305
41 Banda 36567
42 Chitrakoot 8401
43 Fatehpur 6161
44 Pratapgarh 65235
45 Kaushambi 24297
46 Allahabad 100719
47 Barabanki 10658
48 Faizabad 51575
49 Ambedkarnagar 50027
50 Sultanpur 43892
51 Bahraich 35615
52 Shirawasti 10400
53 Balrampur 50628
54 Gonda 73676
55 Sidharth Nagar 55818
56 Basti 46969
57 Sant Kabir Nagar 31004
58 Maharajganj 44648
59 Gorakhpur 82503
60 Kushinagar 72252
61 Deoria 54652
62 Azamgarh 51329
63 Mau 40999
64 Ballia 85604
65 Jaunpur 96318
66 Ghazipur 68920
67 Chandauli 30019
68 Varanasi 62316
69 Sant Ravida Nagar 24229
70 Mirzapur 56388
71 Sonbhadra 34280
West Bengal 460353 428971 889324 334357 306651 641008 794710 735622 1530332 926
1. Bankura 22135 20728 42863 14537 13582 28119 36672 34310 70982 936
2. Barddhaman 13133 11606 24739 12656 11467 24123 25789 23073 48862 895
3. Birbhum 21158 20169 41327 8159 7196 15355 29317 27365 56682 933
4. Dakshin Dinajpur 10421 9428 19849 178 140 318 10599 9568 20167 903
……
……
……
……
……
……
……
……
……
……
……
...…
No
t A
va
ila
ble
……
……
……
……
……
……
……
……
……
……
……
…..
…
……
……
……
……
……
……
……
……
……
……
……
...…
No
t A
va
ila
ble
……
……
……
……
……
……
……
……
……
……
……
…..
…
……
……
……
……
……
……
……
……
……
……
……
...…
No
t A
va
ila
ble
……
……
……
……
……
……
……
……
……
……
……
…..
…
……
……
……
……
……
……
……
……
……
……
……
...…
No
t A
va
ila
ble
……
……
……
……
……
……
……
……
……
……
……
…..
…
69

Male Female Person Male Female Person Male Female Person
1 2 3 4 5 6 7 8 9 10 11 12
TABLE - 7: NUMBER OF LIVE BIRTHS REGISTERED - STATES/ UNION TERRITORIES/ DISTRICTS, 2012
Sl.
No.
States/ UTs /
Districts
Rural Urban TotalSRB
5. Darjiling 11278 10607 21885 11934 7625 19559 23212 18232 41444 785
6. Haora 12657 12019 24676 13971 12453 26424 26628 24472 51100 919
7. Hugli 17847 17113 34960 21608 20493 42101 39455 37606 77061 953
8. Jalpaiguri 17711 17322 35033 10070 9655 19725 27781 26977 54758 971
9. Koch Bihar 13775 12846 26621 15449 12753 28202 29224 25599 54823 876
10. Kolkata - - - 66347 58910 125257 66347 58910 125257 888
11. Maldah 49852 46143 95995 10827 9773 20600 60679 55916 116595 922
12. P.S Medinipur 32993 30325 63318 21151 19949 41100 54144 50274 104418 929
13. P.U Medinipur 39734 36467 76201 12132 9835 21967 51866 46302 98168 893
14. Murshidabad 58182 53407 111589 31789 31614 63403 89971 85021 174992 945
15. Nadia 15567 14634 30201 28041 25779 53820 43608 40413 84021 927
16. North 24 Parganas 32527 31242 63769 30926 29045 59971 63453 60287 123740 950
17. Puruliya 23730 21870 45600 5489 5911 11400 29219 27781 57000 951
18. South 24 Parganas 49757 46677 96434 11813 12623 24436 61570 59300 120870 963
19. Uttar Dinajpur 17896 16368 34264 7280 7848 15128 25176 24216 49392 962
A. & N. Islands 1198 1135 2333 1619 1496 3115 2817 2631 5448 934
1. South Andaman 317 333 650 1619 1496 3115 1936 1829 3765 945
2. Nicobar 295 278 573 - - - 295 278 573 942
3. North & Middle Andaman 586 524 1110 - - - 586 524 1110 894
Chandigarh 74 65 139 14209 12599 26808 14283 12664 26947 887
1. Chandigarh 74 65 139 14209 12599 26808 14283 12664 26947 887
D & N Haveli 1528 1543 3071 1890 1717 3607 3418 3260 6678 954
1. D & N Haveli 1528 1543 3071 1890 1717 3607 3418 3260 6678 954
Daman & Diu 518 450 968 1723 1535 3258 2241 1985 4226 886
1. Daman 199 200 399 1503 1355 2858 1702 1555 3257 914
2. Diu 319 250 569 220 180 400 539 430 969 798
Delhi 12932 11127 24059 178197 158217 336414 191129 169344 360473 886
1. Delhi 12932 11127 24059 178197 158217 336414 191129 169344 360473 886
Puducherry 1564 1428 2992 19443 17667 37110 21007 19095 40102 909
1. Karaikal 21 24 45 2500 2357 4857 2521 2381 4902 944
2. Mahe - - - 198 233 431 198 233 431 1177
3. Puducherry 1543 1404 2947 16373 14732 31105 17916 16136 34052 901
4. Yanam - - - 372 345 717 372 345 717 927
*: Kerala & Chhattisgarh includes cases of sex not reported in person so does not match with the addition of male and female.
70

Male Female Person Male Female Person Male Female Person
1 2 3 4 5 6 7 8 9 10 11
133831 108490 242321 95329 68259 163588 229160 176749 405909
1. Adilabad 6498 5317 11815 1734 1204 2938 8232 6521 14753
2. Ananthapur 6381 4814 11195 3599 2715 6314 9980 7529 17509
3. Chittoor 7548 5930 13478 5017 4105 9122 12565 10035 22600
4. Kadapa 5236 3792 9028 3416 2373 5789 8652 6165 14817
5. East Godavari 7026 5985 13011 6513 5329 11842 13539 11314 24853
6. Guntur 10828 8507 19335 3182 2305 5487 14010 10812 24822
7. Hyderabad - - - 27454 16826 44280 27454 16826 44280
8. Karimnagar 8306 7667 15973 3405 2568 5973 11711 10235 21946
9. Khammam 5563 4739 10302 2483 1726 4209 8046 6465 14511
10. Krishna 5095 4169 9264 7318 5749 13067 12413 9918 22331
11. Kurnool 6461 5077 11538 4940 3882 8822 11401 8959 20360
12. Mahaboobnagar 10825 9221 20046 1071 714 1785 11896 9935 21831
13. Medak 7445 5849 13294 835 684 1519 8280 6533 14813
14. Nalgonda 5671 4639 10310 1554 1037 2591 7225 5676 12901
15. Nellore 2371 1789 4160 2223 1545 3768 4594 3334 7928
16. Nizamabad 1565 1333 2898 813 614 1427 2378 1947 4325
17. Prakasham 7236 5686 12922 1586 1149 2735 8822 6835 15657
18. Rangareddi 3116 2994 6110 113 76 189 3229 3070 6299
19. Srikakulam 5352 4206 9558 1531 1064 2595 6883 5270 12153
20. Visakhapatnam 5315 4349 9664 7188 6123 13311 12503 10472 22975
21. Vizianagaram 2807 1950 4757 1686 1034 2720 4493 2984 7477
22. Warangal 4872 3675 8547 4679 2992 7671 9551 6667 16218
23. West Godavari 8314 6802 15116 2989 2445 5434 11303 9247 20550
562 134 696 771 244 1015 1333 378 1711
1. Changlang 17 3 20 55 15 70 72 18 90
2. Dibang Valley 0 0 0 14 5 19 14 5 19
3. East Kameng 18 6 24 49 17 66 67 23 90
4. East Siang - - - 41 6 47 41 6 47
5. Lohit 148 19 167 95 15 110 243 34 277
6. Lower Subansiri 149 21 170 107 23 130 256 44 300
7. Papum Pare 111 34 145 55 23 78 166 57 223
8. Tawang 18 14 32 66 31 97 84 45 129
9. Tirap 0 0 0 44 12 56 44 12 56
10. Upper Siang 9 7 16 19 5 24 28 12 40
11. Upper Subansiri 0 0 0 37 10 47 37 10 47
12. West Kameng 68 25 93 74 28 102 142 53 195
13. West Siang 9 2 11 43 21 64 52 23 75
14. Kurung Kumey 0 0 0 4 1 5 4 1 5
15. Lower Dibang Valley 1 1 2 65 31 96 66 32 98
16. Anjaw 14 2 16 3 1 4 17 3 20
36630 31807 68437 22971 20268 43239 59601 52075 111676
1. Borpeta 2334 2251 4585 987 832 1819 3321 3083 6404
2. Bongaigaon 1017 986 2003 521 468 989 1538 1454 2992
3. Baksa 1541 1328 2869 0 0 0 1541 1328 2869
4. Cachar 1874 1607 3481 1652 1444 3096 3526 3051 6577
5. Chirang 598 482 1080 238 201 439 836 683 1519
6. Darrang 879 852 1731 952 757 1709 1831 1609 3440
7. Dhemaji 1125 975 2100 621 499 1120 1746 1474 3220
8. Dhubri 2336 1744 4080 1589 903 2492 3925 2647 6572
9. Dibrugarh 1125 1031 2156 1258 1302 2560 2383 2333 4716
10. Goalpara 1122 942 2064 619 568 1187 1741 1510 3251
11. Golaghat 895 651 1546 652 683 1335 1547 1334 2881
12. Hailakandi 852 504 1356 563 361 924 1415 865 2280
TABLE - 8: NUMBER OF DEATHS REGISTERED - STATES/ UNION TERRITORIES/ DISTRICTS, 2012
Sl.
No.
States/Union Territories
/ Districts
Rural Urban Total
Andhra Pradesh
Arunachal Pradesh
Assam
71
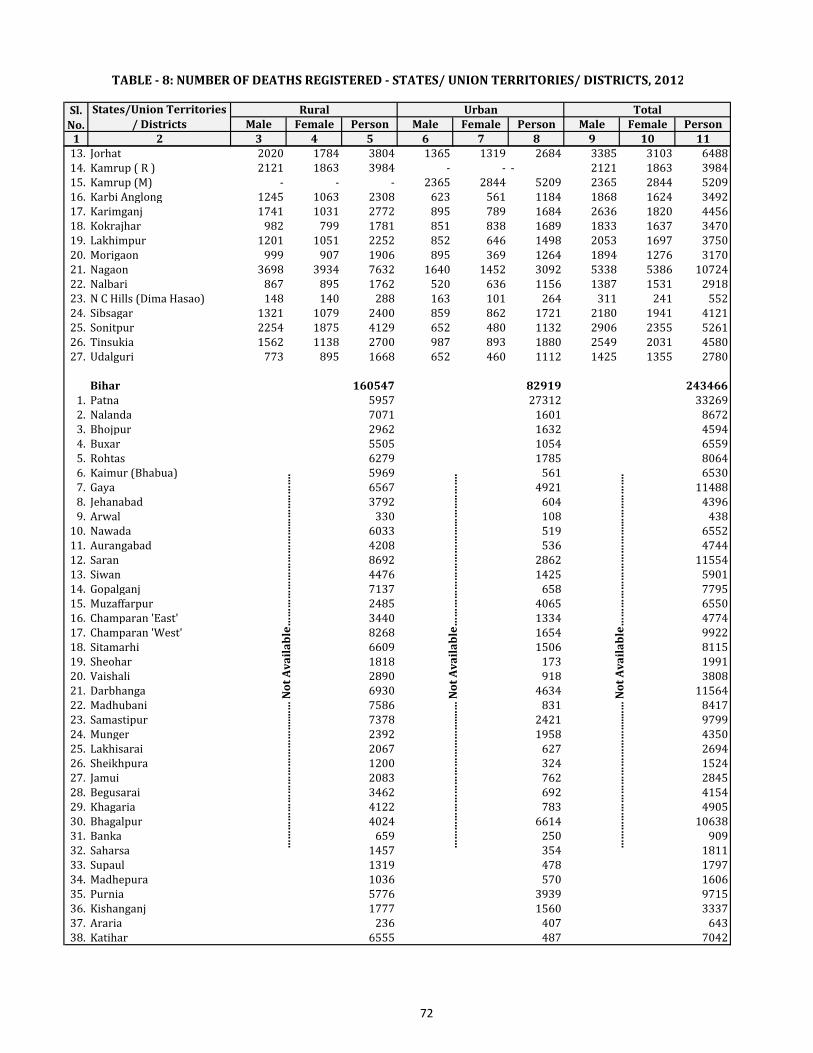
Male Female Person Male Female Person Male Female Person
1 2 3 4 5 6 7 8 9 10 11
TABLE - 8: NUMBER OF DEATHS REGISTERED - STATES/ UNION TERRITORIES/ DISTRICTS, 2012
Sl.
No.
States/Union Territories
/ Districts
Rural Urban Total
13. Jorhat 2020 1784 3804 1365 1319 2684 3385 3103 6488
14. Kamrup ( R ) 2121 1863 3984 - - - 2121 1863 3984
15. Kamrup (M) - - - 2365 2844 5209 2365 2844 5209
16. Karbi Anglong 1245 1063 2308 623 561 1184 1868 1624 3492
17. Karimganj 1741 1031 2772 895 789 1684 2636 1820 4456
18. Kokrajhar 982 799 1781 851 838 1689 1833 1637 3470
19. Lakhimpur 1201 1051 2252 852 646 1498 2053 1697 3750
20. Morigaon 999 907 1906 895 369 1264 1894 1276 3170
21. Nagaon 3698 3934 7632 1640 1452 3092 5338 5386 10724
22. Nalbari 867 895 1762 520 636 1156 1387 1531 2918
23. N C Hills (Dima Hasao) 148 140 288 163 101 264 311 241 552
24. Sibsagar 1321 1079 2400 859 862 1721 2180 1941 4121
25. Sonitpur 2254 1875 4129 652 480 1132 2906 2355 5261
26. Tinsukia 1562 1138 2700 987 893 1880 2549 2031 4580
27. Udalguri 773 895 1668 652 460 1112 1425 1355 2780
Bihar 160547 82919 243466
1. Patna 5957 27312 33269
2. Nalanda 7071 1601 8672
3. Bhojpur 2962 1632 4594
4. Buxar 5505 1054 6559
5. Rohtas 6279 1785 8064
6. Kaimur (Bhabua) 5969 561 6530
7. Gaya 6567 4921 11488
8. Jehanabad 3792 604 4396
9. Arwal 330 108 438
10. Nawada 6033 519 6552
11. Aurangabad 4208 536 4744
12. Saran 8692 2862 11554
13. Siwan 4476 1425 5901
14. Gopalganj 7137 658 7795
15. Muzaffarpur 2485 4065 6550
16. Champaran 'East' 3440 1334 4774
17. Champaran 'West' 8268 1654 9922
18. Sitamarhi 6609 1506 8115
19. Sheohar 1818 173 1991
20. Vaishali 2890 918 3808
21. Darbhanga 6930 4634 11564
22. Madhubani 7586 831 8417
23. Samastipur 7378 2421 9799
24. Munger 2392 1958 4350
25. Lakhisarai 2067 627 2694
26. Sheikhpura 1200 324 1524
27. Jamui 2083 762 2845
28. Begusarai 3462 692 4154
29. Khagaria 4122 783 4905
30. Bhagalpur 4024 6614 10638
31. Banka 659 250 909
32. Saharsa 1457 354 1811
33. Supaul 1319 478 1797
34. Madhepura 1036 570 1606
35. Purnia 5776 3939 9715
36. Kishanganj 1777 1560 3337
37. Araria 236 407 643
38. Katihar 6555 487 7042
……
……
……
……
……
……
……
....
… N
ot
Av
ail
ab
le…
……
……
……
……
……
...…
…..
……
.
……
……
……
……
……
……
……
....
… N
ot
Av
ail
ab
le…
……
……
……
……
……
...…
…..
……
.
……
……
……
……
……
……
……
....
… N
ot
Av
ail
ab
le…
……
……
……
……
……
...…
…..
……
.
72

Male Female Person Male Female Person Male Female Person
1 2 3 4 5 6 7 8 9 10 11
TABLE - 8: NUMBER OF DEATHS REGISTERED - STATES/ UNION TERRITORIES/ DISTRICTS, 2012
Sl.
No.
States/Union Territories
/ Districts
Rural Urban Total
Chhatisgarh 57348 39802 97582 27376 17034 44541 84724 56836 142123
1. Bastar 2168 1411 3579 682 762 1444 2850 2173 5023
2. Bilaspur 4366 2997 7388 2117 1362 3496 6483 4359 10884
3. Bijapur 480 322 802 96 31 127 576 353 929
4. Balodabazar 2357 1628 4132 655 417 1082 3012 2045 5214
5. Balod 2309 1679 3990 539 351 890 2848 2030 4880
6. Bemetara 1555 1162 2722 189 121 311 1744 1283 3033
7. Balrampur 1914 1270 3184 101 48 149 2015 1318 3333
8. Dantewada 891 652 1560 237 149 386 1128 801 1946
9. Dhamtari 2068 1191 3260 1100 692 1793 3168 1883 5053
10. Durg 1539 1043 2592 5109 3104 8217 6648 4147 10809
11. Gariyaband 1870 1177 3047 129 69 198 1999 1246 3245
12. Janjgir-Champa 4439 2769 7212 1149 636 1785 5588 3405 8997
13. Jashpur 2427 1661 4096 353 166 534 2780 1827 4630
14. Kanker 2460 1645 4105 370 221 591 2830 1866 4696
15. Kabeerdham(Kawardha) 1620 1353 2976 393 205 605 2013 1558 3581
16. Korba 2421 1631 4076 1289 715 2007 3710 2346 6083
17. Koriya 1116 692 1808 525 300 825 1641 992 2633
18. Kondagaon 1366 856 2222 277 150 427 1643 1006 2649
19. Mahasamund 2877 2253 5130 579 350 929 3456 2603 6059
20. Mungeli 1465 1097 2562 196 115 311 1661 1212 2873
21. Naraynapur 354 204 558 141 95 236 495 299 794
22. Raigarh 4406 3325 7791 2214 1408 3627 6620 4733 11418
23. Raipur 2485 1764 4317 6050 3556 9640 8535 5320 13957
24. Rajnandgaon 3818 2794 6618 1665 1183 2882 5483 3977 9500
25. Surguja 2166 1459 3677 943 687 1630 3109 2146 5307
26. Sukma 213 146 359 104 34 138 317 180 497
27. Surajpur 2198 1621 3819 174 107 281 2372 1728 4100
Goa 4896 3326 8222 2366 1479 3845 7262 4805 12067
1. North Goa 3714 2401 6115 1002 621 1623 4716 3022 7738
2. South Goa 1182 925 2107 1364 858 2222 2546 1783 4329
Gujarat 97119 57156 154275 98069 62892 160961 195188 120048 315236
1. Ahmadabad 4206 2506 6712 26838 16789 43627 31044 19295 50339
2. Amreli 3150 2096 5246 1654 918 2572 4804 3014 7818
3. Anand 5426 3440 8866 2909 1899 4808 8335 5339 13674
4. Banas Kantha 2975 1609 4584 1174 666 1840 4149 2275 6424
5. Bharuch 4700 2875 7575 2019 1284 3303 6719 4159 10878
6. Bhavnagar 3667 2201 5868 4415 2838 7253 8082 5039 13121
7. Dohad 2930 997 3927 915 609 1524 3845 1606 5451
8. Gandhinagar 3563 2425 5988 1324 874 2198 4887 3299 8186
9. Jamnagar 1256 787 2043 3854 2712 6566 5110 3499 8609
10. Junagadh 5089 3299 8388 3508 2222 5730 8597 5521 14118
11. Kachchh 2720 1747 4467 2487 1322 3809 5207 3069 8276
12. Kheda 6501 3394 9895 2185 1235 3420 8686 4629 13315
13. Mahesana 4847 3211 8058 2597 1600 4197 7444 4811 12255
14. Narmada 1479 936 2415 340 215 555 1819 1151 2970
15. Navsari 3738 2530 6268 1659 1063 2722 5397 3593 8990
16. Panch Mahals 3700 1864 5564 1319 857 2176 5019 2721 7740
17. Patan 2950 1714 4664 1206 816 2022 4156 2530 6686
18. Porbandar 1000 622 1622 1159 830 1989 2159 1452 3611
19. Rajkot 4624 3248 7872 9754 6855 16609 14378 10103 24481
20. Sabar Kantha 6465 1687 8152 1384 946 2330 7849 2633 10482
21. Surat 5059 3258 8317 12012 8038 20050 17071 11296 28367
22. Surendranagar 3183 1882 5065 1866 1123 2989 5049 3005 8054
73

Male Female Person Male Female Person Male Female Person
1 2 3 4 5 6 7 8 9 10 11
TABLE - 8: NUMBER OF DEATHS REGISTERED - STATES/ UNION TERRITORIES/ DISTRICTS, 2012
Sl.
No.
States/Union Territories
/ Districts
Rural Urban Total
23. Tapi 1927 1235 3162 522 298 820 2449 1533 3982
24. The Dangs 729 519 1248 - - - 729 519 1248
25. Vadodara 7738 4582 12320 8822 5444 14266 16560 10026 26586
26. Valsad 3497 2492 5989 2147 1439 3586 5644 3931 9575
Haryana 59638 37375 97013 41886 21734 63620 101524 59109 160633
1. Ambala 2786 1965 4751 2262 1326 3588 5048 3291 8339
2. Bhiwani 4693 2824 7517 1418 691 2109 6111 3515 9626
3. Faridabad 1228 787 2015 4344 2379 6723 5572 3166 8738
4. Fatehabad 2601 1690 4291 885 452 1337 3486 2142 5628
5. Gurgaon 1476 833 2309 4325 2225 6550 5801 3058 8859
6. Hisar 4680 2842 7522 3731 1813 5544 8411 4655 13066
7. Jhajjar 2640 1539 4179 964 454 1418 3604 1993 5597
8. Jind 3959 2360 6319 1418 654 2072 5377 3014 8391
9. Kaithal 3279 2003 5282 1301 732 2033 4580 2735 7315
10. Karnal 3685 2391 6076 2504 1322 3826 6189 3713 9902
11. Kurukshetra 2261 1585 3846 1403 814 2217 3664 2399 6063
12. Mewat 2630 1576 4206 245 99 344 2875 1675 4550
13. Narnaul (M.Garh) 2720 1813 4533 723 316 1039 3443 2129 5572
14. Palwal 2501 1682 4183 913 431 1344 3414 2113 5527
15. Panchkula 940 572 1512 1101 681 1782 2041 1253 3294
16. Panipat 2641 1492 4133 1524 847 2371 4165 2339 6504
17. Rewari 2463 1585 4048 1088 485 1573 3551 2070 5621
18. Rohtak 2342 1376 3718 6076 2972 9048 8418 4348 12766
19. Sirsa 3289 2079 5368 1642 850 2492 4931 2929 7860
20. Sonipat 3927 2341 6268 2139 991 3130 6066 3332 9398
21. Yamunanagar 2897 2040 4937 1880 1200 3080 4777 3240 8017
Himachal Pradesh 21907 15517 37424 4312 2535 6847 26219 18052 44271
1. Bilaspur 1119 773 1892 230 135 365 1349 908 2257
2. Chamba 1507 1048 2555 306 194 500 1813 1242 3055
3. Hamirpur 1719 1249 2968 324 213 537 2043 1462 3505
4. Kangra 5915 4208 10123 441 214 655 6356 4422 10778
5. Kinnaur 293 155 448 - - - 293 155 448
6. Kullu 1173 831 2004 340 199 539 1513 1030 2543
7. Lahul & Spiti 94 72 166 - - - 94 72 166
8. Mandi 2977 2137 5114 494 332 826 3471 2469 5940
9. Shimla 1912 1349 3261 1293 733 2026 3205 2082 5287
10. Sirmaur 1542 998 2540 343 164 507 1885 1162 3047
11. Solan 1552 1142 2694 379 234 613 1931 1376 3307
12. Una 2104 1555 3659 162 117 279 2266 1672 3938
Jharkhand 46293 32721 79014 22969 10831 33800 69262 43552 112814
1. Bokaro 3621 2845 6466 1540 805 2345 5161 3650 8811
2. Chatra 66 37 103 73 43 116 139 80 219
3. Deoghar 471 188 659 417 139 556 888 327 1215
4. Dhanbad 2769 1730 4499 3575 2288 5863 6344 4018 10362
5. Dumka 3756 2682 6438 217 94 311 3973 2776 6749
6. E. Singhbhum 2580 1760 4340 6399 869 7268 8979 2629 11608
7. Garhwa 1558 924 2482 256 312 568 1814 1236 3050
8. Giridih 5850 3855 9705 584 390 974 6434 4245 10679
9. Godda 3486 2880 6366 141 120 261 3627 3000 6627
10. Gumla 1199 960 2159 119 156 275 1318 1116 2434
11. Hazaribagh 1732 1511 3243 607 481 1088 2339 1992 4331
12. Jamtara 1193 569 1762 137 95 232 1330 664 1994
13. Kodarma 593 367 960 192 124 316 785 491 1276
14. Khunti 831 420 1251 105 43 148 936 463 1399
74

Male Female Person Male Female Person Male Female Person
1 2 3 4 5 6 7 8 9 10 11
TABLE - 8: NUMBER OF DEATHS REGISTERED - STATES/ UNION TERRITORIES/ DISTRICTS, 2012
Sl.
No.
States/Union Territories
/ Districts
Rural Urban Total
15. Latehar 535 273 808 40 14 54 575 287 862
16. Lohardaga 729 655 1384 171 132 303 900 787 1687
17. Pakur
18. Palamu 5309 4298 9607 495 321 816 5804 4619 10423
19. Ranchi 519 263 782 6572 3690 10262 7091 3953 11044
20. Ramgarh 1293 703 1996 193 81 274 1486 784 2270
21. Sahebganj 2059 1437 3496 340 231 571 2399 1668 4067
22. Saraikela-Kharsawan 2103 1268 3371 224 108 332 2327 1376 3703
23. Simdega 1454 1052 2506 86 50 136 1540 1102 2642
24. W. Singhbhum 2587 2044 4631 486 245 731 3073 2289 5362
Karnataka 133119 89233 222352 114642 70021 184663 247761 159254 407015
1. Bagalkote 4368 3311 7679 3239 2189 5428 7607 5500 13107
2. Bangalore Urban 2153 1310 3463 30994 17997 48991 33147 19307 52454
3. Bangalore Rural 2632 1496 4128 1144 539 1683 3776 2035 5811
4. Belgaum 12547 8374 20921 7570 4454 12024 20117 12828 32945
5. Bellary 5868 4196 10064 5132 2948 8080 11000 7144 18144
6. Bidar 4135 2354 6489 1945 1221 3166 6080 3575 9655
7. Bijapur 6467 4589 11056 2724 1618 4342 9191 6207 15398
8. Chamarajanagar 3598 2418 6016 1313 656 1969 4911 3074 7985
9. Chikmagalur 2432 1369 3801 1242 730 1972 3674 2099 5773
10. Chitradurga 6208 3973 10181 2057 1172 3229 8265 5145 13410
11. Chikballapur 2533 1721 4254 1101 682 1783 3634 2403 6037
12. Dakshina Kannada 4920 3263 8183 6703 4542 11245 11623 7805 19428
13. Davanagere 4887 3348 8235 4541 2792 7333 9428 6140 15568
14. Dharwad 2904 2127 5031 6018 3882 9900 8922 6009 14931
15. Gadag 3003 2253 5256 2664 2040 4704 5667 4293 9960
16. Gulbarga 5594 3702 9296 2972 1614 4586 8566 5316 13882
17. Hassan 5809 3568 9377 2397 1268 3665 8206 4836 13042
18. Haveri 4829 3333 8162 1734 1056 2790 6563 4389 10952
19. Kodagu 2025 895 2920 610 383 993 2635 1278 3913
20. Kolar 1598 914 2512 2086 1356 3442 3684 2270 5954
21. Koppal 3760 2759 6519 1157 668 1825 4917 3427 8344
22. Mandya 4474 2718 7192 2018 1036 3054 6492 3754 10246
23. Mysore 5049 3352 8401 6744 4430 11174 11793 7782 19575
24. Raichur 2911 1762 4673 2547 1419 3966 5458 3181 8639
25. Ramnagar 4255 2646 6901 1230 721 1951 5485 3367 8852
26. Shimoga 4155 2993 7148 3721 2361 6082 7876 5354 13230
27. Tumkur 8890 6282 15172 3156 2717 5873 12046 8999 21045
28. Udupi 4170 3125 7295 2497 1530 4027 6667 4655 11322
29. Uttara Kannada 3605 2719 6324 2059 1311 3370 5664 4030 9694
30. Yadgir 3340 2363 5703 1327 689 2016 4667 3052 7719
Kerala 85505 71454 156966 43292 37353 80649 128797 108807 237615
1. Alappuzha 6746 5680 12427 1725 1320 3045 8471 7000 15472
2. Ernakulam 6949 5741 12692 7013 8293 15306 13962 14034 27998
3. Idukki 3254 2384 5638 518 332 850 3772 2716 6488
4. Kannoor 6499 5403 11902 2631 2071 4702 9130 7474 16604
5. Kasaragod 2936 2124 5060 1005 745 1750 3941 2869 6810
6. Kollam 7761 6172 13933 2903 1872 4775 10664 8044 18708
7. Kottayam 7451 7638 15089 1454 985 2439 8905 8623 17528
8. Kozhikode 5469 4853 10323 5806 7819 13627 11275 12672 23950
9. Malappuram 7382 6392 13774 2997 2128 5126 10379 8520 18900
10. Palakkad 7352 6218 13570 1952 1376 3328 9304 7594 16898
11. Pathanamthitta 4524 3926 8452 1543 946 2489 6067 4872 10941
12. Thiruvananthapuram 6617 5429 12046 9811 6724 16536 16428 12153 28582
…………………………………….…………. Not Available…………………………………………………….
75
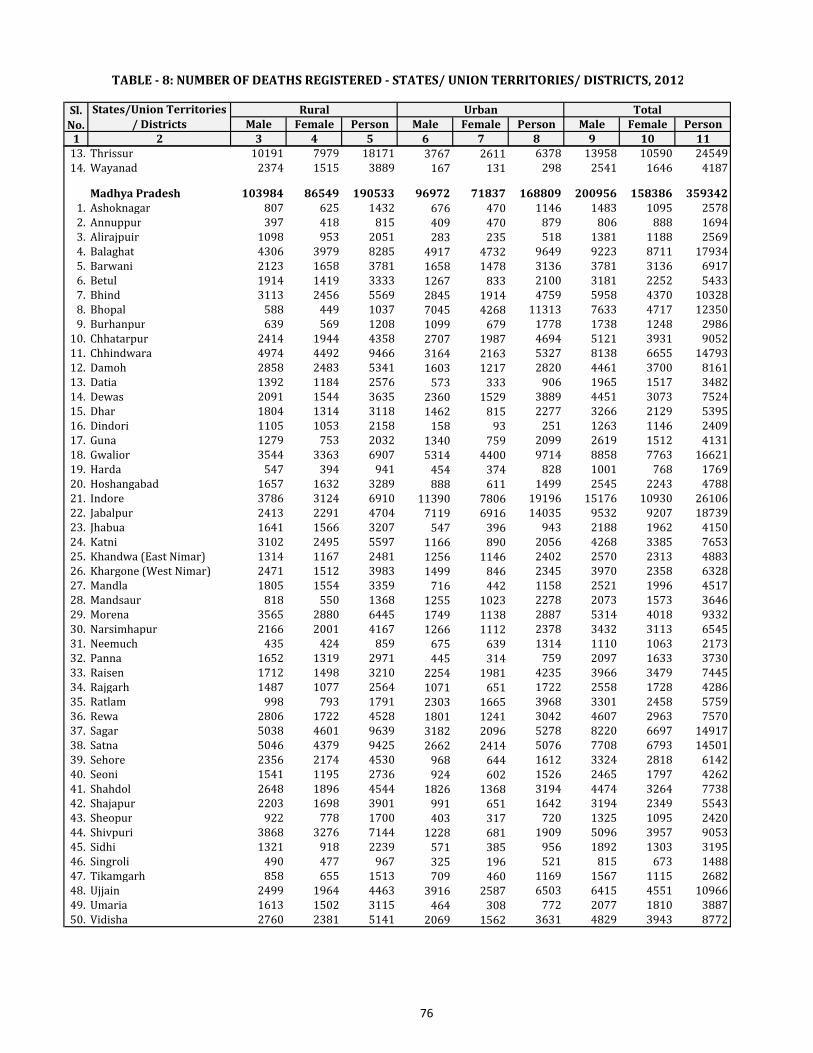
Male Female Person Male Female Person Male Female Person
1 2 3 4 5 6 7 8 9 10 11
TABLE - 8: NUMBER OF DEATHS REGISTERED - STATES/ UNION TERRITORIES/ DISTRICTS, 2012
Sl.
No.
States/Union Territories
/ Districts
Rural Urban Total
13. Thrissur 10191 7979 18171 3767 2611 6378 13958 10590 24549
14. Wayanad 2374 1515 3889 167 131 298 2541 1646 4187
Madhya Pradesh 103984 86549 190533 96972 71837 168809 200956 158386 359342
1. Ashoknagar 807 625 1432 676 470 1146 1483 1095 2578
2. Annuppur 397 418 815 409 470 879 806 888 1694
3. Alirajpuir 1098 953 2051 283 235 518 1381 1188 2569
4. Balaghat 4306 3979 8285 4917 4732 9649 9223 8711 17934
5. Barwani 2123 1658 3781 1658 1478 3136 3781 3136 6917
6. Betul 1914 1419 3333 1267 833 2100 3181 2252 5433
7. Bhind 3113 2456 5569 2845 1914 4759 5958 4370 10328
8. Bhopal 588 449 1037 7045 4268 11313 7633 4717 12350
9. Burhanpur 639 569 1208 1099 679 1778 1738 1248 2986
10. Chhatarpur 2414 1944 4358 2707 1987 4694 5121 3931 9052
11. Chhindwara 4974 4492 9466 3164 2163 5327 8138 6655 14793
12. Damoh 2858 2483 5341 1603 1217 2820 4461 3700 8161
13. Datia 1392 1184 2576 573 333 906 1965 1517 3482
14. Dewas 2091 1544 3635 2360 1529 3889 4451 3073 7524
15. Dhar 1804 1314 3118 1462 815 2277 3266 2129 5395
16. Dindori 1105 1053 2158 158 93 251 1263 1146 2409
17. Guna 1279 753 2032 1340 759 2099 2619 1512 4131
18. Gwalior 3544 3363 6907 5314 4400 9714 8858 7763 16621
19. Harda 547 394 941 454 374 828 1001 768 1769
20. Hoshangabad 1657 1632 3289 888 611 1499 2545 2243 4788
21. Indore 3786 3124 6910 11390 7806 19196 15176 10930 26106
22. Jabalpur 2413 2291 4704 7119 6916 14035 9532 9207 18739
23. Jhabua 1641 1566 3207 547 396 943 2188 1962 4150
24. Katni 3102 2495 5597 1166 890 2056 4268 3385 7653
25. Khandwa (East Nimar) 1314 1167 2481 1256 1146 2402 2570 2313 4883
26. Khargone (West Nimar) 2471 1512 3983 1499 846 2345 3970 2358 6328
27. Mandla 1805 1554 3359 716 442 1158 2521 1996 4517
28. Mandsaur 818 550 1368 1255 1023 2278 2073 1573 3646
29. Morena 3565 2880 6445 1749 1138 2887 5314 4018 9332
30. Narsimhapur 2166 2001 4167 1266 1112 2378 3432 3113 6545
31. Neemuch 435 424 859 675 639 1314 1110 1063 2173
32. Panna 1652 1319 2971 445 314 759 2097 1633 3730
33. Raisen 1712 1498 3210 2254 1981 4235 3966 3479 7445
34. Rajgarh 1487 1077 2564 1071 651 1722 2558 1728 4286
35. Ratlam 998 793 1791 2303 1665 3968 3301 2458 5759
36. Rewa 2806 1722 4528 1801 1241 3042 4607 2963 7570
37. Sagar 5038 4601 9639 3182 2096 5278 8220 6697 14917
38. Satna 5046 4379 9425 2662 2414 5076 7708 6793 14501
39. Sehore 2356 2174 4530 968 644 1612 3324 2818 6142
40. Seoni 1541 1195 2736 924 602 1526 2465 1797 4262
41. Shahdol 2648 1896 4544 1826 1368 3194 4474 3264 7738
42. Shajapur 2203 1698 3901 991 651 1642 3194 2349 5543
43. Sheopur 922 778 1700 403 317 720 1325 1095 2420
44. Shivpuri 3868 3276 7144 1228 681 1909 5096 3957 9053
45. Sidhi 1321 918 2239 571 385 956 1892 1303 3195
46. Singroli 490 477 967 325 196 521 815 673 1488
47. Tikamgarh 858 655 1513 709 460 1169 1567 1115 2682
48. Ujjain 2499 1964 4463 3916 2587 6503 6415 4551 10966
49. Umaria 1613 1502 3115 464 308 772 2077 1810 3887
50. Vidisha 2760 2381 5141 2069 1562 3631 4829 3943 8772
76

Male Female Person Male Female Person Male Female Person
1 2 3 4 5 6 7 8 9 10 11
TABLE - 8: NUMBER OF DEATHS REGISTERED - STATES/ UNION TERRITORIES/ DISTRICTS, 2012
Sl.
No.
States/Union Territories
/ Districts
Rural Urban Total
Maharashtra 174988 130563 305551 206773 139407 346180 381761 269970 651731
1. Ahmadnagar 10983 7553 18536 3979 3182 7161 14962 10735 25697
2. Akola 3194 2277 5471 3858 2374 6232 7052 4651 11703
3. Amravati 5746 4088 9834 5449 3895 9344 11195 7983 19178
4. Aurangabad 2975 2080 5055 6026 3611 9637 9001 5691 14692
5. Bhandara 3638 3229 6867 1404 876 2280 5042 4105 9147
6. Beed 4971 3230 8201 2722 1536 4258 7693 4766 12459
7. Buldhana 6456 4542 10998 2417 1543 3960 8873 6085 14958
8. Chandrapur 5294 4250 9544 3938 2486 6424 9232 6736 15968
9. Dhule 2946 2351 5297 2646 1954 4600 5592 4305 9897
10. Gadchiroli 3140 2264 5404 595 316 911 3735 2580 6315
11. Gondia 4303 3427 7730 1066 763 1829 5369 4190 9559
12. Hingoli 2056 1414 3470 651 358 1009 2707 1772 4479
13. Jalgaon 9135 6700 15835 5251 3323 8574 14386 10023 24409
14. Jalana 3164 2145 5309 907 461 1368 4071 2606 6677
15. Kolhapur 8094 6395 14489 6764 4389 11153 14858 10784 25642
16. Latur 3634 2661 6295 2386 1491 3877 6020 4152 10172
17. Mumbai 0 0 0 51934 36559 88493 51934 36559 88493
18. Nagpur 5185 3683 8868 16408 11063 27471 21593 14746 36339
19. Nanded 5111 3853 8964 3495 1928 5423 8606 5781 14387
20. Nandurbar 4859 3874 8733 1396 872 2268 6255 4746 11001
21. Nashik 7947 5944 13891 9914 6954 16868 17861 12898 30759
22. Osmanabad 3049 2455 5504 1284 890 2174 4333 3345 7678
23. Parbhani 2516 1779 4295 1881 1234 3115 4397 3013 7410
24. Pune 8510 6320 14830 20920 14039 34959 29430 20359 49789
25. Raigad 6221 4430 10651 1959 1351 3310 8180 5781 13961
26. Ratnagiri 5863 5089 10952 1173 744 1917 7036 5833 12869
27. Sangli 6967 5432 12399 5328 3506 8834 12295 8938 21233
28. Satara 7845 6557 14402 3494 2553 6047 11339 9110 20449
29. Sindhudurg 3372 3030 6402 631 437 1068 4003 3467 7470
30. Solapur 9243 6446 15689 8024 5223 13247 17267 11669 28936
31. Thane 6977 4964 11941 23188 15800 38988 30165 20764 50929
32. Wardha 3811 2871 6682 1784 1044 2828 5595 3915 9510
33. Washim 1995 1347 3342 803 490 1293 2798 1837 4635
34. Yavatmal 5788 3883 9671 3098 2162 5260 8886 6045 14931
Manipur 1269 459 1728 1790 940 2730 3059 1399 4458
1. Bishnupur 59 26 85 117 65 182 176 91 267
2. Chandel 5 4 9 - - - 5 4 9
3. Churachandpur 149 95 244 - - - 149 95 244
4. Imphal(East) 675 207 882 284 102 386 959 309 1268
5. Imphal(West) 34 3 37 1168 607 1775 1202 610 1812
6. Senapati 128 43 171 - - - 128 43 171
7. Tamenglong 48 21 69 - - - 48 21 69
8. Thoubal 98 43 141 221 166 387 319 209 528
9. Ukhrul 73 17 90 - - - 73 17 90
Meghalaya 7227 4275 11502 1718 1090 2808 8945 5365 14310
1. East Garo Hills 804 465 1269 163 70 233 967 535 1502
2. East Khasi Hills 2062 1457 3519 804 549 1353 2866 2006 4872
3. Jaintia Hills 955 545 1500 251 187 438 1206 732 1938
4. Ri Bhoi 646 324 970 - - - 646 324 970
5. South Garo Hills 445 212 657 82 57 139 527 269 796
6. West Garo Hills 2315 1272 3587 418 227 645 2733 1499 4232
7. West Khasi Hills …………………………………………. Not Available ………………………………………….
77

Male Female Person Male Female Person Male Female Person
1 2 3 4 5 6 7 8 9 10 11
TABLE - 8: NUMBER OF DEATHS REGISTERED - STATES/ UNION TERRITORIES/ DISTRICTS, 2012
Sl.
No.
States/Union Territories
/ Districts
Rural Urban Total
Mizoram 1394 976 2370 2741 1392 4133 4135 2368 6503
1. Aizawl 228 174 402 1840 861 2701 2068 1035 3103
2. Champhai 203 173 376 194 113 307 397 286 683
3. Chhimtuipui (Saiha) 110 76 186 138 71 209 248 147 395
4. Kolasib 112 60 172 105 60 165 217 120 337
5. Lawngtlai 316 204 520 - - - 316 204 520
6. Lunglei 192 133 325 327 214 541 519 347 866
7. Mamit 167 92 259 25 6 31 192 98 290
8. Serchhip 66 64 130 112 67 179 178 131 309
Nagaland 2140 1708 3848 1702 1446 3148 3842 3154 6996
1. Dimapur 479 373 852 359 335 694 838 708 1546
2. Kohima 389 248 637 309 242 551 698 490 1188
3. Mokokchung 288 269 557 247 239 486 535 508 1043
4. Mon 164 94 258 156 67 223 320 161 481
5. Phek 185 199 384 162 111 273 347 310 657
6. Tuensang 141 126 267 129 114 243 270 240 510
7. Wokha 207 155 362 117 140 257 324 295 619
8. Zunheboto 124 99 223 87 94 181 211 193 404
9. Peren 54 49 103 49 34 83 103 83 186
10. Longleng 58 45 103 38 32 70 96 77 173
11. Kiphire 51 51 102 49 38 87 100 89 189
Odisha 122793 99175 221968 40850 28209 69059 163643 127384 291027
1. Angul 4465 3253 7718 924 695 1619 5389 3948 9337
2. Bolangir 5143 4872 10015 1306 996 2302 6449 5868 12317
3. Balasore 5389 4100 9489 1272 880 2152 6661 4980 11641
4. Bargarh 3807 3402 7209 465 280 745 4272 3682 7954
5. Bhadrak 3260 2717 5977 793 585 1378 4053 3302 7355
6. Boudh 1259 1102 2361 83 64 147 1342 1166 2508
7. Cuttack 6542 5486 12028 8446 5187 13633 14988 10673 25661
8. Deogarh 1011 883 1894 210 149 359 1221 1032 2253
9. Dhenkanal 3854 3135 6989 629 296 925 4483 3431 7914
10. Gajapati 1742 1260 3002 309 192 501 2051 1452 3503
11. Ganjam 10285 7275 17560 3884 2374 6258 14169 9649 23818
12. Jagatsinghpur 3161 2784 5945 301 150 451 3462 2934 6396
13. Jajpur 5022 4150 9172 366 223 589 5388 4373 9761
14. Jharsuguda 1324 1054 2378 1099 560 1659 2423 1614 4037
15. Kalahandi 4859 4002 8861 708 392 1100 5567 4394 9961
16. Kandhamal 2574 1857 4431 281 197 478 2855 2054 4909
17. Kendrapara 4266 3630 7896 408 266 674 4674 3896 8570
18. Keonjhar 5669 4709 10378 1323 741 2064 6992 5450 12442
19. Khurda 3775 3136 6911 4358 2346 6704 8133 5482 13615
20. Koraput 5345 4157 9502 1185 670 1855 6530 4827 11357
21. Malkangiri 4431 2261 6692 391 205 596 4822 2466 7288
22. Mayurbhanj 7643 6668 14311 1533 999 2532 9176 7667 16843
23. Nabarangpur 4899 4093 8992 716 589 1305 5615 4682 10297
24. Nayagarh 3083 2668 5751 274 201 475 3357 2869 6226
25. Nuapada 2487 2264 4751 192 147 339 2679 2411 5090
26. Puri 3831 3188 7019 1152 857 2009 4983 4045 9028
27. Rayagada 4438 3391 7829 474 327 801 4912 3718 8630
28. Sambalpur 2888 2453 5341 3597 2538 6135 6485 4991 11476
29. Subarnapur 1704 1596 3300 330 227 557 2034 1823 3857
30. Sundargarh 4637 3629 8266 3841 4876 8717 8478 8505 16983
78

Male Female Person Male Female Person Male Female Person
1 2 3 4 5 6 7 8 9 10 11
TABLE - 8: NUMBER OF DEATHS REGISTERED - STATES/ UNION TERRITORIES/ DISTRICTS, 2012
Sl.
No.
States/Union Territories
/ Districts
Rural Urban Total
Punjab 64740 43884 108624 52495 32763 85258 117235 76647 193882
1. Amritsar 4762 3080 7842 8420 5211 13631 13182 8291 21473
2. Bathinda 3318 2201 5519 2147 1102 3249 5465 3303 8768
3. Barnala 1576 1011 2587 804 471 1275 2380 1482 3862
4. Faridkot 1327 973 2300 1855 1096 2951 3182 2069 5251
5. Fatehgarh Sahib 1479 1002 2481 551 346 897 2030 1348 3378
6. Firozpur 2784 2035 4819 2135 1392 3527 4919 3427 8346
7. Gurdaspur 6090 4303 10393 2504 1632 4136 8594 5935 14529
8. Hoshiarpur 4977 3476 8453 2043 1340 3383 7020 4816 11836
9. Jalandhar 4836 3198 8034 6839 4483 11322 11675 7681 19356
10. Kapurthala 1712 1150 2862 1189 846 2035 2901 1996 4897
11. Ludhiana 5918 4054 9972 10302 6264 16566 16220 10318 26538
12. Mansa 2414 1446 3860 692 408 1100 3106 1854 4960
13. Mohali 1144 836 1980 2475 1415 3890 3619 2251 5870
14. Moga 3009 2279 5288 1055 685 1740 4064 2964 7028
15. Muktsar 2258 1551 3809 1061 565 1626 3319 2116 5435
16. Nawanshahr 2508 1612 4120 723 438 1161 3231 2050 5281
17. Patiala 3852 2370 6222 4290 2868 7158 8142 5238 13380
18. Ropar (Rup Nagar) 2008 1334 3342 758 497 1255 2766 1831 4597
19. Sangrur 4616 3121 7737 2011 1321 3332 6627 4442 11069
20. Tarn Taran 4152 2852 7004 641 383 1024 4793 3235 8028
Rajasthan 125203 89447 214650 88262 54034 142296 213465 143481 356946
1. Ajmer 5181 4649 9830 7236 4478 11714 12417 9127 21544
2. Alwar 6906 6078 12984 2549 2354 4903 9455 8432 17887
3. Banswara 1905 1149 3054 1001 806 1807 2906 1955 4861
4. Baran 1906 1296 3202 874 757 1631 2780 2053 4833
5. Barmer 3724 3453 7177 840 762 1602 4564 4215 8779
6. Bharatpur 4724 2424 7148 2339 1448 3787 7063 3872 10935
7. Bhilwara 7055 4878 11933 2712 1620 4332 9767 6498 16265
8. Bikaner 3142 1960 5102 4702 3023 7725 7844 4983 12827
9. Bundi 2586 2096 4682 812 520 1332 3398 2616 6014
10. Chittaurgarh 4216 3930 8146 1169 948 2117 5385 4878 10263
11. Churu 3497 2317 5814 2743 1683 4426 6240 4000 10240
12. Dausa 2990 1923 4913 586 389 975 3576 2312 5888
13. Dhaulpur 1911 1414 3325 1055 698 1753 2966 2112 5078
14. Dungarpur 1882 1169 3051 879 564 1443 2761 1733 4494
15. Ganganagar 3722 2702 6424 2482 1512 3994 6204 4214 10418
16. Hanumangarh 4603 3035 7638 1722 1052 2774 6325 4087 10412
17. Jaipur 5008 2967 7975 19666 10600 30266 24674 13567 38241
18. Jaisalmer 1043 706 1749 299 205 504 1342 911 2253
19. Jalor 3240 2759 5999 489 346 835 3729 3105 6834
20. Jhalawar 2540 2171 4711 1545 1119 2664 4085 3290 7375
21. Jhunjhunun 4415 3474 7889 1969 1200 3169 6384 4674 11058
22. Jodhpur 4449 3009 7458 7912 4775 12687 12361 7784 20145
23. Karauli 2503 2061 4564 939 571 1510 3442 2632 6074
24. Kota 2649 1663 4312 5820 3423 9243 8469 5086 13555
25. Nagaur 7346 4295 11641 1998 1106 3104 9344 5401 14745
26. Pali 4958 3495 8453 1926 1110 3036 6884 4605 11489
27. Partapgarh 1708 1285 2993 466 336 802 2174 1621 3795
28. Rajsamand 3830 3091 6921 732 537 1269 4562 3628 8190
29. Sawai Madhopur 2360 1912 4272 1076 540 1616 3436 2452 5888
30. Sikar 6408 4057 10465 3164 1564 4728 9572 5621 15193
31. Sirohi 2362 1872 4234 832 424 1256 3194 2296 5490
32. Tonk 3626 2394 6020 1288 788 2076 4914 3182 8096
33. Udaipur 6808 3763 10571 4440 2776 7216 11248 6539 17787
79
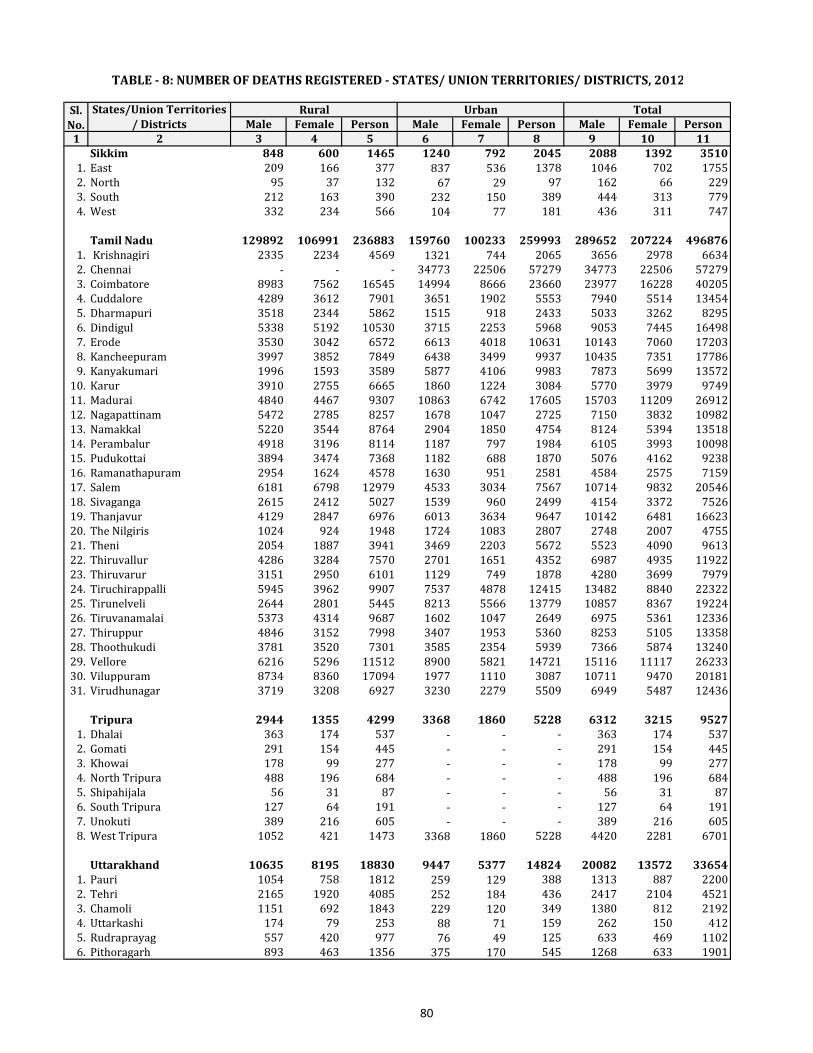
Male Female Person Male Female Person Male Female Person
1 2 3 4 5 6 7 8 9 10 11
TABLE - 8: NUMBER OF DEATHS REGISTERED - STATES/ UNION TERRITORIES/ DISTRICTS, 2012
Sl.
No.
States/Union Territories
/ Districts
Rural Urban Total
Sikkim 848 600 1465 1240 792 2045 2088 1392 3510
1. East 209 166 377 837 536 1378 1046 702 1755
2. North 95 37 132 67 29 97 162 66 229
3. South 212 163 390 232 150 389 444 313 779
4. West 332 234 566 104 77 181 436 311 747
Tamil Nadu 129892 106991 236883 159760 100233 259993 289652 207224 496876
1. Krishnagiri 2335 2234 4569 1321 744 2065 3656 2978 6634
2. Chennai - - - 34773 22506 57279 34773 22506 57279
3. Coimbatore 8983 7562 16545 14994 8666 23660 23977 16228 40205
4. Cuddalore 4289 3612 7901 3651 1902 5553 7940 5514 13454
5. Dharmapuri 3518 2344 5862 1515 918 2433 5033 3262 8295
6. Dindigul 5338 5192 10530 3715 2253 5968 9053 7445 16498
7. Erode 3530 3042 6572 6613 4018 10631 10143 7060 17203
8. Kancheepuram 3997 3852 7849 6438 3499 9937 10435 7351 17786
9. Kanyakumari 1996 1593 3589 5877 4106 9983 7873 5699 13572
10. Karur 3910 2755 6665 1860 1224 3084 5770 3979 9749
11. Madurai 4840 4467 9307 10863 6742 17605 15703 11209 26912
12. Nagapattinam 5472 2785 8257 1678 1047 2725 7150 3832 10982
13. Namakkal 5220 3544 8764 2904 1850 4754 8124 5394 13518
14. Perambalur 4918 3196 8114 1187 797 1984 6105 3993 10098
15. Pudukottai 3894 3474 7368 1182 688 1870 5076 4162 9238
16. Ramanathapuram 2954 1624 4578 1630 951 2581 4584 2575 7159
17. Salem 6181 6798 12979 4533 3034 7567 10714 9832 20546
18. Sivaganga 2615 2412 5027 1539 960 2499 4154 3372 7526
19. Thanjavur 4129 2847 6976 6013 3634 9647 10142 6481 16623
20. The Nilgiris 1024 924 1948 1724 1083 2807 2748 2007 4755
21. Theni 2054 1887 3941 3469 2203 5672 5523 4090 9613
22. Thiruvallur 4286 3284 7570 2701 1651 4352 6987 4935 11922
23. Thiruvarur 3151 2950 6101 1129 749 1878 4280 3699 7979
24. Tiruchirappalli 5945 3962 9907 7537 4878 12415 13482 8840 22322
25. Tirunelveli 2644 2801 5445 8213 5566 13779 10857 8367 19224
26. Tiruvanamalai 5373 4314 9687 1602 1047 2649 6975 5361 12336
27. Thiruppur 4846 3152 7998 3407 1953 5360 8253 5105 13358
28. Thoothukudi 3781 3520 7301 3585 2354 5939 7366 5874 13240
29. Vellore 6216 5296 11512 8900 5821 14721 15116 11117 26233
30. Viluppuram 8734 8360 17094 1977 1110 3087 10711 9470 20181
31. Virudhunagar 3719 3208 6927 3230 2279 5509 6949 5487 12436
Tripura 2944 1355 4299 3368 1860 5228 6312 3215 9527
1. Dhalai 363 174 537 - - - 363 174 537
2. Gomati 291 154 445 - - - 291 154 445
3. Khowai 178 99 277 - - - 178 99 277
4. North Tripura 488 196 684 - - - 488 196 684
5. Shipahijala 56 31 87 - - - 56 31 87
6. South Tripura 127 64 191 - - - 127 64 191
7. Unokuti 389 216 605 - - - 389 216 605
8. West Tripura 1052 421 1473 3368 1860 5228 4420 2281 6701
Uttarakhand 10635 8195 18830 9447 5377 14824 20082 13572 33654
1. Pauri 1054 758 1812 259 129 388 1313 887 2200
2. Tehri 2165 1920 4085 252 184 436 2417 2104 4521
3. Chamoli 1151 692 1843 229 120 349 1380 812 2192
4. Uttarkashi 174 79 253 88 71 159 262 150 412
5. Rudraprayag 557 420 977 76 49 125 633 469 1102
6. Pithoragarh 893 463 1356 375 170 545 1268 633 1901
80

Male Female Person Male Female Person Male Female Person
1 2 3 4 5 6 7 8 9 10 11
TABLE - 8: NUMBER OF DEATHS REGISTERED - STATES/ UNION TERRITORIES/ DISTRICTS, 2012
Sl.
No.
States/Union Territories
/ Districts
Rural Urban Total
7. Almora 886 693 1579 374 235 609 1260 928 2188
8. Champawat 0 0 0 129 73 202 129 73 202
9. Bageswar 801 534 1335 51 34 85 852 568 1420
10. Nainital 224 498 722 1372 700 2072 1596 1198 2794
11. U.S. Nagar 1123 823 1946 1822 1093 2915 2945 1916 4861
12. Haridwar 812 816 1628 1586 843 2429 2398 1659 4057
13. Dehradun 795 499 1294 2834 1676 4510 3629 2175 5804
Uttar Pradesh 668780
1 Saharanpur 23336
2 Muzaffarnagar 14040
3 Bijnor 6765
4 Moradabad 17566
5 Rampur 4066
6 Jyotibaphulenagar 4862
7 Meerut 25792
8 Bagpat 6749
9 Ghaziabad 6502
10 Gautambudhnagar 10174
11 Bulandshahr 27370
12 Aligarh 5466
13 Kashi ram nagar 204
14 Hathras 1525
15 Mathura 4421
16 Agra 23087
17 Firozabad 20015
18 Etah 4673
19 Mainpuri 7935
20 Badaun 15880
21 Bareilly 30871
22 Pilibhit 9503
23 Shajhanpur 18460
24 Lakhmipur-Keri 2529
25 Sitapur 10628
26 Hardoi 12248
27 Unnao 11984
28 Lucknow 31954
29 Raibareilly 8678
30 Farrukhabad 7247
31 Kannauj 3623
32 Etawah 2020
33 Auraiya 2567
34 Kanpur (Dehat) 5876
35 Kanpur (Nagar) 27293
36 Jalaun 3801
37 Jhansi 4662
38 Lalitpur 3333
39 Hamirpur 2490
40 Mahoba 90
41 Banda 4817
42 Chitrakoot 716
43 Fatehpur 4543
44 Pratapgarh 1525
45 Kaushambi 1509
46 Allahabad 9538
……
……
……
……
……
……
……
....
… N
ot
Av
ail
ab
le…
……
……
……
……
……
...…
…..
……
.
81

Male Female Person Male Female Person Male Female Person
1 2 3 4 5 6 7 8 9 10 11
TABLE - 8: NUMBER OF DEATHS REGISTERED - STATES/ UNION TERRITORIES/ DISTRICTS, 2012
Sl.
No.
States/Union Territories
/ Districts
Rural Urban Total
47 Barabanki 9955
48 Faizabad 9190
49 Ambedkarnagar 5944
50 Sultanpur 4939
51 Bahraich 2088
52 Shirawasti 656
53 Balrampur 10534
54 Gonda 21703
55 Sidharth Nagar 3937
56 Basti 5934
57 Sant Kabir Nagar 464
58 Maharajganj 1090
59 Gorakhpur 14746
60 Kushinagar 6781
61 Deoria 4260
62 Azamgarh 23640
63 Mau 510
64 Ballia 27714
65 Jaunpur 25635
66 Ghazipur 5444
67 Chandauli 5549
68 Varanasi 10811
69 Sant Ravida Nagar 1682
70 Mirzapur 10463
71 Sonbhadra 2178
West Bengal 140331 99223 239554 105882 74578 180460 246213 173801 420014
1. Bankura 4572 4433 9005 3109 3036 6145 7681 7469 15150
2. Barddhaman 6495 4190 10685 8164 4998 13162 14659 9188 23847
3. Birbhum 4584 4314 8898 1962 1463 3425 6546 5777 12323
4. Dakshin Dinajpur 2681 1743 4424 155 120 275 2836 1863 4699
5. Darjiling 6295 3848 10143 3332 1815 5147 9627 5663 15290
6. Haora 4561 2671 7232 5889 2977 8866 10450 5648 16098
7. Hugli 8425 5747 14172 7217 5694 12911 15642 11441 27083
8. Jalpaiguri 12967 5583 18550 2261 1655 3916 15228 7238 22466
9. Koch Bihar 4068 2415 6483 2327 1346 3673 6395 3761 10156
10. Kolkata 0 32554 22916 55470 32554 22916 55470
11. Maldah 11869 6789 18658 2999 1785 4784 14868 8574 23442
12. P.S Medinipur 8617 6054 14671 4604 5425 10029 13221 11479 24700
13. P.U Medinipur 16227 14551 30778 2076 554 2630 18303 15105 33408
14. Murshidabad 11493 8508 20001 5474 4240 9714 16967 12748 29715
15. Nadia 7740 5654 13394 8868 6394 15262 16608 12048 28656
16. North 24 Parganas 14919 10842 25761 9702 7161 16863 24621 18003 42624
17. Puruliya 3170 3064 6234 1342 217 1559 4512 3281 7793
18. South 24 Parganas 9236 7166 16402 2609 1931 4540 11845 9097 20942
19. Uttar Dinajpur 2412 1651 4063 1238 851 2089 3650 2502 6152
A. & N. Islands 823 517 1340 558 281 839 1381 798 2179
1. South Andaman 269 157 426 558 281 839 827 438 1265
2. Nicobar 199 141 340 - - - 199 141 340
3. North & Middle Andaman 355 219 574 - - - 355 219 574
Chandigarh 103 58 161 10460 5582 16042 10563 5640 16203
1. Chandigarh 103 58 161 10460 5582 16042 10563 5640 16203
……
……
……
……
……
……
……
....
… N
ot
Av
ail
ab
le…
……
……
……
……
……
...…
…..
……
.
82

Male Female Person Male Female Person Male Female Person
1 2 3 4 5 6 7 8 9 10 11
TABLE - 8: NUMBER OF DEATHS REGISTERED - STATES/ UNION TERRITORIES/ DISTRICTS, 2012
Sl.
No.
States/Union Territories
/ Districts
Rural Urban Total
D & N Haveli 399 337 736 288 177 465 687 514 1201
1. D & N Haveli 399 337 736 288 177 465 687 514 1201
Daman & Diu 274 150 424 411 233 644 685 383 1068
1. Daman 195 94 289 311 140 451 506 234 740
2. Diu 79 56 135 100 93 193 179 149 328
Delhi 4583 2450 7033 60025 37558 97583 64608 40008 104616
1. Delhi 4583 2450 7033 60025 37558 97583 64608 40008 104616
Lakshadweep 0 0 0 0 0 0 0 0 0
1. Lakshadweep 0 0 0 0 0
Puducherry 1576 955 2531 6122 3872 9994 7698 4827 12525
1. Karaikal 332 237 569 710 394 1104 1042 631 1673
2. Mahe - - - 169 136 305 169 136 305
3. Puducherry 1244 718 1962 5096 3235 8331 6340 3953 10293
4. Yanam - - - 147 107 254 147 107 254
*: Kerala & Chhattisgarh includes cases of sex not reported in person so does not match with the addition of male and female.
83

Male Female Person Male Female Person Male Female Person
1 2 3 4 5 6 7 8 9 10 11
528 499 1027 3914 2620 6534 4442 3119 7561
1. Adilabad 16 19 35 44 43 87 60 62 122
2. Ananthapur 12 13 25 20 25 45 32 38 70
3. Chittoor 25 24 49 65 47 112 90 71 161
4. Kadapa 15 15 30 22 18 40 37 33 70
5. East Godavari 45 36 81 106 94 200 151 130 281
6. Guntur 55 48 103 207 215 422 262 263 525
7. Hyderabad - - - 2509 1318 3827 2509 1318 3827
8. Karimnagar 26 24 50 49 43 92 75 67 142
9. Khammam 20 22 42 61 56 117 81 78 159
10. Krishna 15 12 27 84 70 154 99 82 181
11. Kurnool 29 30 59 56 67 123 85 97 182
12. Mahaboobnagar 30 35 65 84 88 172 114 123 237
13. Medak 16 15 31 60 55 115 76 70 146
14. Nalgonda 14 15 29 36 31 67 50 46 96
15. Nellore 18 17 35 47 36 83 65 53 118
16. Nizamabad 24 17 41 50 40 90 74 57 131
17. Prakasham 19 18 37 40 44 84 59 62 121
18. Rangareddi 7 5 12 10 11 21 17 16 33
19. Srikakulam 27 26 53 57 45 102 84 71 155
20. Visakhapatnam 55 43 98 126 101 227 181 144 325
21. Vizianagaram 20 22 42 74 80 154 94 102 196
22. Warangal 24 28 52 59 56 115 83 84 167
23. West Godavari 16 15 31 48 37 85 64 52 116
1 0 1 2 3 5 3 3 6
1. Changlang
2. Dibang Valley
3. East Kameng - - - 0 0 0 0
4. East Siang
5. Lohit
6. Lower Subansiri - - - 1 3 4 1 3 4
7. Papum Pare - - - 1 0 1 1 0 1
8. Tawang 1 0 1 - - - 1 0 1
9. Tirap
10. Upper Siang
11. Upper Subansiri
12. West Kameng
13. West Siang
14. Kurung Kumey
15. Lower Dibang Valley
16. Anjaw
317 131 448 106 66 172 423 197 620
1. Borpeta 14 9 23 3 4 7 17 13 30
2. Bongaigaon 18 7 25 0 4 4 18 11 29
3. Baksa 0 0 0 0 0 0 0 0 0
4. Cachar 6 2 8 3 1 4 9 3 12
5. Chirang 7 3 10 4 1 5 11 4 15
6. Darrang 17 5 22 3 2 5 20 7 27
7. Dhemaji 4 2 6 2 1 3 6 3 9
8. Dhubri 20 27 47 13 14 27 33 41 74
9. Dibrugarh 5 2 7 1 0 1 6 2 8
10. Goalpara 6 13 19 5 9 14 11 22 33
Assam
…………………………...…… Not Available………………………………….
TABLE - 9: NUMBER OF INFANT DEATHS REGISTERED - STATES/ UNION TERRITORIES/ DISTRICTS, 2012
Sl.
No.
States/ Union
Territories/ Districts
Rural Urban Total
Andhra Pradesh
Arunachal Pradesh
…………………………...…… Not Available………………………………….
…………………………...…… Not Available………………………………….
84

Male Female Person Male Female Person Male Female Person
1 2 3 4 5 6 7 8 9 10 11
TABLE - 9: NUMBER OF INFANT DEATHS REGISTERED - STATES/ UNION TERRITORIES/ DISTRICTS, 2012
Sl.
No.
States/ Union
Territories/ Districts
Rural Urban Total
11. Golaghat 6 5 11 1 2 3 7 7 14
12. Hailakandi 38 4 42 9 1 10 47 5 52
13. Jorhat 45 7 52 15 5 20 60 12 72
14. Kamrup ( R ) 0 0 0 0 0 0 0 0 0
15. Kamrup (M) 35 6 41 6 3 9 41 9 50
16. Karbi Anglong 4 2 6 1 1 2 5 3 8
17. Karimganj 2 3 5 1 1 2 3 4 7
18. Kokrajhar 11 4 15 2 2 4 13 6 19
19. Lakhimpur 7 2 9 3 2 5 10 4 14
20. Morigaon 29 7 36 10 4 14 39 11 50
21. Nagaon 7 6 13 5 3 8 12 9 21
22. Nalbari 6 6 12 3 2 5 9 8 17
23. N C Hills (Dima Hasao) 6 1 7 1 1 2 7 2 9
24. Sibsagar 4 1 5 2 0 2 6 1 7
25. Sonitpur 4 4 8 2 1 3 6 5 11
26. Tinsukia 8 1 9 7 1 8 15 2 17
27. Udalguri 8 2 10 4 1 5 12 3 15
Goa 103 74 177 17 21 38 120 95 215
1. North Goa 103 74 177 12 13 25 115 87 202
2. South Goa - - - 5 8 13 5 8 13
Gujarat 779 629 1408 4208 2607 6815 4987 3236 8223
1. Ahmadabad 47 29 76 1405 781 2186 1452 810 2262
2. Amreli 7 8 15 6 4 10 13 12 25
3. Anand 43 45 88 67 40 107 110 85 195
4. Banas Kantha 26 21 47 32 20 52 58 41 99
5. Bharuch 89 75 164 34 19 53 123 94 217
6. Bhavnagar 38 37 75 191 104 295 229 141 370
7. Dohad 21 13 34 57 52 109 78 65 143
8. Gandhinagar 31 24 55 50 52 102 81 76 157
9. Jamnagar 10 10 20 145 78 223 155 88 243
10. Junagadh 3 1 4 62 36 98 65 37 102
11. Kachchh 46 44 90 117 55 172 163 99 262
12. Kheda 23 16 39 33 8 41 56 24 80
13. Mahesana 21 12 33 58 29 87 79 41 120
14. Narmada 40 30 70 4 3 7 44 33 77
15. Navsari 33 16 49 21 10 31 54 26 80
16. Panch Mahals 29 21 50 57 28 85 86 49 135
17. Patan 32 20 52 10 9 19 42 29 71
18. Porbandar 3 4 7 5 8 13 8 12 20
19. Rajkot 27 25 52 557 390 947 584 415 999
20. Sabar Kantha 2 1 3 0 0 0 2 1 3
21. Surat 41 39 80 712 496 1208 753 535 1288
22. Surendranagar 38 28 66 26 9 35 64 37 101
23. Tapi 13 8 21 38 29 67 51 37 88
24. The Dangs 19 18 37 0 0 0 19 18 37
25. Vadodara 68 57 125 423 272 695 491 329 820
26. Valsad 29 27 56 98 75 173 127 102 229
Haryana 1812 2330 4142 1618 932 2550 3430 3262 6692
1. Ambala 60 82 142 24 23 47 84 105 189
2. Bhiwani 121 172 293 32 11 43 153 183 336
3. Faridabad 75 92 167 219 139 358 294 231 525
85

Male Female Person Male Female Person Male Female Person
1 2 3 4 5 6 7 8 9 10 11
TABLE - 9: NUMBER OF INFANT DEATHS REGISTERED - STATES/ UNION TERRITORIES/ DISTRICTS, 2012
Sl.
No.
States/ Union
Territories/ Districts
Rural Urban Total
4. Fatehabad 87 117 204 9 8 17 96 125 221
5. Gurgaon 32 35 67 126 66 192 158 101 259
6. Hisar 105 134 239 217 96 313 322 230 552
7. Jhajjar 29 51 80 16 8 24 45 59 104
8. Jind 113 169 282 17 3 20 130 172 302
9. Kaithal 93 122 215 39 49 88 132 171 303
10. Karnal 117 145 262 65 33 98 182 178 360
11. Kurukshetra 45 78 123 24 25 49 69 103 172
12. Mewat 355 335 690 0 1 1 355 336 691
13. Narnaul (M.Garh) 63 70 133 1 6 7 64 76 140
14. Palwal 139 198 337 14 8 22 153 206 359
15. Panchkula 23 25 48 28 13 41 51 38 89
16. Panipat 62 82 144 25 10 35 87 92 179
17. Rewari 40 66 106 43 25 68 83 91 174
18. Rohtak 41 61 102 550 309 859 591 370 961
19. Sirsa 80 87 167 69 49 118 149 136 285
20. Sonipat 71 105 176 26 10 36 97 115 212
21. Yamunanagar 61 104 165 74 40 114 135 144 279
Himachal Pradesh 297 240 537 273 224 497 570 464 1034
1. Bilaspur 11 3 14 25 14 39 36 17 53
2. Chamba 17 19 36 21 23 44 38 42 80
3. Hamirpur 7 9 16 18 17 35 25 26 51
4. Kangra 126 96 222 12 5 17 138 101 239
5. Kinnaur 3 2 5 0 0 0 3 2 5
6. Kullu 10 16 26 22 14 36 32 30 62
7. Lahul & Spiti 2 0 2 0 0 0 2 0 2
8. Mandi 32 23 55 39 32 71 71 55 126
9. Shimla 34 27 61 98 86 184 132 113 245
10. Sirmaur 22 16 38 28 19 47 50 35 85
11. Solan 18 18 36 10 13 23 28 31 59
12. Una 15 11 26 0 1 1 15 12 27
Karnataka 1156 1022 2178 6765 4492 11257 7921 5514 13435
1. Bagalkote 58 35 93 306 210 516 364 245 609
2. Bangalore Urban 95 80 175 1045 667 1712 1140 747 1887
3. Bangalore Rural 19 17 36 19 11 30 38 28 66
4. Belgaum 64 56 120 602 312 914 666 368 1034
5. Bellary 36 40 76 379 160 539 415 200 615
6. Bidar 46 42 88 185 118 303 231 160 391
7. Bijapur 50 43 93 294 129 423 344 172 516
8. Chamarajanagar 51 31 82 19 10 29 70 41 111
9. Chikmagalur 22 12 34 33 21 54 55 33 88
10. Chitradurga 36 36 72 111 93 204 147 129 276
11. Chikballapur 9 7 16 7 3 10 16 10 26
12. Dakshina Kannada 28 22 50 364 269 633 392 291 683
13. Davanagere 43 47 90 308 246 554 351 293 644
14. Dharwad 34 24 58 833 611 1444 867 635 1502
15. Gadag 12 26 38 156 99 255 168 125 293
16. Gulbarga 76 39 115 294 240 534 370 279 649
17. Hassan 13 18 31 119 88 207 132 106 238
18. Haveri 16 20 36 93 58 151 109 78 187
19. Kodagu 8 10 18 36 34 70 44 44 88
20. Kolar 23 23 46 86 55 141 109 78 187
86

Male Female Person Male Female Person Male Female Person
1 2 3 4 5 6 7 8 9 10 11
TABLE - 9: NUMBER OF INFANT DEATHS REGISTERED - STATES/ UNION TERRITORIES/ DISTRICTS, 2012
Sl.
No.
States/ Union
Territories/ Districts
Rural Urban Total
21. Koppal 19 22 41 18 28 46 37 50 87
22. Mandya 31 59 90 122 75 197 153 134 287
23. Mysore 125 111 236 597 351 948 722 462 1184
24. Raichur 52 44 96 155 136 291 207 180 387
25. Ramanagar 15 11 26 4 3 7 19 14 33
26. Shimoga 63 48 111 304 257 561 367 305 672
27. Tumkur 43 30 73 83 78 161 126 108 234
28. Udupi 14 20 34 58 50 108 72 70 142
29. Uttara Kannada 31 34 65 71 35 106 102 69 171
30. Yadgir 24 15 39 64 45 109 88 60 148
Kerala 710 625 1339 1499 1511 3013 2209 2136 4352
1. Alappuzha 48 41 90 7 5 12 55 46 102
2. Ernakulam 50 36 88 153 182 335 203 218 423
3. Idukki 27 28 55 4 7 11 31 35 66
4. Kannoor 92 88 180 77 70 147 169 158 327
5. Kasaragod 11 10 21 26 24 50 37 34 71
6. Kollam 22 12 34 36 18 54 58 30 88
7. Kottayam 131 126 257 9 8 17 140 134 274
8. Kozhikode 19 8 27 492 667 1161 511 675 1188
9. Malappuram 102 80 182 148 99 248 250 179 430
10. Palakkad 35 39 74 36 27 63 71 66 137
11. Pathanamthitta 14 27 41 24 19 43 38 46 84
12. Thiruvananthapuram 13 18 31 378 303 681 391 321 712
13. Thrissur 111 91 203 100 77 177 211 168 380
14. Wayanad 35 21 56 9 5 14 44 26 70
Madhya Pradesh 1335 1237 2572 5543 4543 10086 6878 5780 12658
1. Ashoknagar 5 1 6 7 8 15 12 9 21
2. Annuppur 16 6 22 9 6 15 25 12 37
3. Alirajpuir 11 8 19 9 6 15 20 14 34
4. Balaghat 176 200 376 673 653 1326 849 853 1702
5. Barwani 0 2 2 346 325 671 346 327 673
6. Betul 22 16 38 112 65 177 134 81 215
7. Bhind 0 0 0 36 34 70 36 34 70
8. Bhopal 17 5 22 366 277 643 383 282 665
9. Burhanpur 37 21 58 0 0 0 37 21 58
10. Chhatarpur 116 101 217 300 224 524 416 325 741
11. Chhindwara 0 0 0 138 111 249 138 111 249
12. Damoh 101 99 200 126 119 245 227 218 445
13. Datia 14 19 33 60 52 112 74 71 145
14. Dewas 0 0 0 40 36 76 40 36 76
15. Dhar 20 22 42 80 25 105 100 47 147
16. Dindori 2 2 4 34 37 71 36 39 75
17. Guna 4 6 10 42 43 85 46 49 95
18. Gwalior 23 20 43 138 134 272 161 154 315
19. Harda 0 0 0 16 25 41 16 25 41
20. Hoshangabad 9 18 27 56 54 110 65 72 137
21. Indore 9 9 18 317 278 595 326 287 613
22. Jabalpur 81 63 144 91 83 174 172 146 318
23. Jhabua 19 16 35 103 108 211 122 124 246
24. Katni 32 20 52 85 55 140 117 75 192
25. Khandwa (East Nimar) 0 0 0 0 0 0 0 0 0
26. Khargone (West Nimar) 6 11 17 293 211 504 299 222 521
87

Male Female Person Male Female Person Male Female Person
1 2 3 4 5 6 7 8 9 10 11
TABLE - 9: NUMBER OF INFANT DEATHS REGISTERED - STATES/ UNION TERRITORIES/ DISTRICTS, 2012
Sl.
No.
States/ Union
Territories/ Districts
Rural Urban Total
27. Mandla 28 22 50 28 18 46 56 40 96
28. Mandsaur 60 36 96 168 131 299 228 167 395
29. Morena 62 66 128 42 52 94 104 118 222
30. Narsimhapur 67 81 148 87 75 162 154 156 310
31. Neemuch 16 11 27 19 14 33 35 25 60
32. Panna 37 38 75 55 50 105 92 88 180
33. Raisen 12 8 20 8 6 14 20 14 34
34. Rajgarh 0 1 1 147 39 186 147 40 187
35. Ratlam 22 14 36 24 18 42 46 32 78
36. Rewa 28 25 53 50 33 83 78 58 136
37. Sagar 12 10 22 124 107 231 136 117 253
38. Satna 5 3 8 86 185 271 91 188 279
39. Sehore 50 48 98 6 7 13 56 55 111
40. Seoni 5 7 12 14 6 20 19 13 32
41. Shahdol 7 0 7 410 292 702 417 292 709
42. Shajapur 14 13 27 25 22 47 39 35 74
43. Sheopur 10 20 30 10 13 23 20 33 53
44. Shivpuri 4 0 4 107 67 174 111 67 178
45. Sidhi 113 78 191 118 70 188 231 148 379
46. Singroli 0 0 0 21 11 32 21 11 32
47. Tikamgarh 5 6 11 100 63 163 105 69 174
48. Ujjain 35 34 69 331 244 575 366 278 644
49. Umaria 1 0 1 6 3 9 7 3 10
50. Vidisha 22 51 73 80 48 128 102 99 201
Maharashtra 1535 1251 2786 10522 8426 18948 12057 9677 21734
1. Ahmadnagar 243 172 415 87 68 155 330 240 570
2. Akola 76 4 80 101 74 175 177 78 255
3. Amravati 61 61 122 213 204 417 274 265 539
4. Aurangabad 38 28 66 813 585 1398 851 613 1464
5. Bhandara 20 17 37 158 156 314 178 173 351
6. Beed 5 20 25 107 119 226 112 139 251
7. Buldhana 106 85 191 177 163 340 283 248 531
8. Chandrapur 47 41 88 268 205 473 315 246 561
9. Dhule 25 27 52 265 201 466 290 228 518
10. Gadchiroli 42 37 79 64 1 65 106 38 144
11. Gondia 23 16 39 55 51 106 78 67 145
12. Hingoli 16 17 33 14 5 19 30 22 52
13. Jalgaon 35 31 66 50 24 74 85 55 140
14. Jalana 56 52 108 145 106 251 201 158 359
15. Kolhapur 11 9 20 411 241 652 422 250 672
16. Latur 24 25 49 252 205 457 276 230 506
17. Mumbai 0 0 0 2724 2321 5045 2724 2321 5045
18. Nagpur 7 6 13 851 829 1680 858 835 1693
19. Nanded 51 52 103 222 172 394 273 224 497
20. Nandurbar 144 118 262 88 62 150 232 180 412
21. Nashik 92 71 163 877 712 1589 969 783 1752
22. Osmanabad 6 0 6 40 39 79 46 39 85
23. Parbhani 81 74 155 28 20 48 109 94 203
24. Pune 13 10 23 366 280 646 379 290 669
25. Raigad 11 11 22 88 70 158 99 81 180
26. Ratnagiri 16 13 29 52 39 91 68 52 120
27. Sangli 49 46 95 79 40 119 128 86 214
28. Satara 12 2 14 162 125 287 174 127 301
88

Male Female Person Male Female Person Male Female Person
1 2 3 4 5 6 7 8 9 10 11
TABLE - 9: NUMBER OF INFANT DEATHS REGISTERED - STATES/ UNION TERRITORIES/ DISTRICTS, 2012
Sl.
No.
States/ Union
Territories/ Districts
Rural Urban Total
29. Sindhudurg 16 12 28 19 15 34 35 27 62
30. Solapur 16 14 30 379 258 637 395 272 667
31. Thane 44 41 85 1071 812 1883 1115 853 1968
32. Wardha 119 99 218 71 70 141 190 169 359
33. Washim 3 3 6 15 13 28 18 16 34
34. Yavatmal 27 37 64 210 141 351 237 178 415
Manipur 123 13 166 140 86 226 263 99 392
1. Bishnupur
2. Chandel
3. Churachandpur
4. Imphal(East) 0 0 0 34 21 55 34 21 55
5. Imphal(West) 0 0 0 70 37 107 70 37 107
6. Senapati
7. Tamenglong
8. Thoubal
9. Ukhrul
Meghalaya 903 741 1644 293 236 529 1196 977 2173
1. East Garo Hills 107 100 207 35 9 44 142 109 251
2. East Khasi Hills 185 194 379 94 95 189 279 289 568
3. Jaintia Hills 157 112 269 99 72 171 256 184 440
4. Ri Bhoi 74 58 132 0 0 0 74 58 132
5. South Garo Hills 57 40 97 13 18 31 70 58 128
6. West Garo Hills 323 237 560 52 42 94 375 279 654
7. West Khasi Hills
Mizoram 140 131 271 361 301 662 501 432 933
1. Aizawl 14 18 32 229 174 403 243 192 435
2. Champhai 12 24 36 21 21 42 33 45 78
3. Chhimtuipui (Saiha) 29 18 47 40 26 66 69 44 113
4. Kolasib 9 8 17 8 18 26 17 26 43
5. Lawngtlai 40 41 81 0 0 0 40 41 81
6. Lunglei 8 8 16 57 57 114 65 65 130
7. Mamit 24 9 33 0 1 1 24 10 34
8. Serchhip 4 5 9 6 4 10 10 9 19
Nagaland 39 35 74 26 16 42 65 51 116
1. Dimapur 5 6 11 2 3 5 7 9 16
2. Kohima 6 8 14 3 2 5 9 10 19
3. Mokokchung 3 2 5 2 1 3 5 3 8
4. Mon 3 2 5 4 2 6 7 4 11
5. Phek 5 3 8 3 1 4 8 4 12
6. Tuensang 6 2 8 2 2 4 8 4 12
7. Wokha 3 2 5 3 1 4 6 3 9
8. Zunheboto 2 3 5 1 1 2 3 4 7
9. Peren 2 2 4 3 1 4 5 3 8
10. Longleng 3 3 6 2 1 3 5 4 9
11. Kiphire 1 2 3 1 1 2 2 3 5
Odisha 5807 5058 10865 4373 2763 7136 10180 7821 18001
1. Angul 82 75 157 18 17 35 100 92 192
2. Bolangir 253 261 514 248 171 419 501 432 933
3. Balasore 118 132 250 150 118 268 268 250 518
………………..Not available………………….
………………..Not available………………….
…………………………………………. Not Available ………………………………………….
89

Male Female Person Male Female Person Male Female Person
1 2 3 4 5 6 7 8 9 10 11
TABLE - 9: NUMBER OF INFANT DEATHS REGISTERED - STATES/ UNION TERRITORIES/ DISTRICTS, 2012
Sl.
No.
States/ Union
Territories/ Districts
Rural Urban Total
4. Bargarh 59 42 101 24 12 36 83 54 137
5. Bhadrak 62 66 128 61 62 123 123 128 251
6. Boudh 75 65 140 1 2 3 76 67 143
7. Cuttack 111 130 241 1142 574 1716 1253 704 1957
8. Deogarh 36 48 84 10 13 23 46 61 107
9. Dhenkanal 114 118 232 37 26 63 151 144 295
10. Gajapati 109 94 203 0 2 2 109 96 205
11. Ganjam 218 240 458 498 245 743 716 485 1201
12. Jagatsinghpur 48 39 87 4 8 12 52 47 99
13. Jajpur 119 106 225 43 24 67 162 130 292
14. Jharsuguda 29 14 43 31 14 45 60 28 88
15. Kalahandi 435 300 735 42 23 65 477 323 800
16. Kandhamal 267 200 467 59 59 118 326 259 585
17. Kendrapara 126 40 166 30 8 38 156 48 204
18. Keonjhar 253 248 501 164 132 296 417 380 797
19. Khurda 62 80 142 196 133 329 258 213 471
20. Koraput 585 492 1077 134 96 230 719 588 1307
21. Malkangiri 419 352 771 49 23 72 468 375 843
22. Mayurbhanj 318 300 618 284 179 463 602 479 1081
23. Nabarangpur 696 548 1244 143 108 251 839 656 1495
24. Nayagarh 75 71 146 40 40 80 115 111 226
25. Nuapada 264 234 498 27 16 43 291 250 541
26. Puri 44 65 109 37 45 82 81 110 191
27. Rayagada 507 431 938 66 42 108 573 473 1046
28. Sambalpur 53 47 100 503 335 838 556 382 938
29. Subarnapur 29 27 56 79 59 138 108 86 194
30. Sundargarh 241 193 434 253 177 430 494 370 864
Punjab 778 670 1448 1017 751 1768 1795 1421 3216
1. Amritsar 116 89 205 180 211 391 296 300 596
2. Bathinda 33 20 53 6 12 18 39 32 71
3. Barmala 21 18 39 12 8 20 33 26 59
4. Faridkot 26 20 46 161 104 265 187 124 311
5. Fatehgarh Sahib 14 26 40 4 5 9 18 31 49
6. Firozpur 35 24 59 3 5 8 38 29 67
7. Gurdaspur 94 70 164 59 32 91 153 102 255
8. Hoshiarpur 52 42 94 25 35 60 77 77 154
9. Jalandhar 55 60 115 255 146 401 310 206 516
10. Kapurthala 6 4 10 5 3 8 11 7 18
11. Ludhiana 49 36 85 197 98 295 246 134 380
12. Mansa 35 28 63 2 2 4 37 30 67
13. Mohali 5 3 8 22 18 40 27 21 48
14. Moga 36 31 67 3 1 4 39 32 71
15. Muktsar 47 44 91 6 4 10 53 48 101
16. Nawanshahr 23 27 50 13 12 25 36 39 75
17. Patiala 29 17 46 37 30 67 66 47 113
18. Ropar (Rup Nagar) 19 13 32 15 13 28 34 26 60
19. Sangrur 46 62 108 9 7 16 55 69 124
20. Tarn Taran 37 36 73 3 5 8 40 41 81
Rajasthan 1653 1562 3215 6582 5527 12109 8235 7089 15324
1. Ajmer 0 0 0 773 517 1290 773 517 1290
2. Alwar 62 60 122 359 306 665 421 366 787
3. Banswara 28 26 54 53 52 105 81 78 159
90

Male Female Person Male Female Person Male Female Person
1 2 3 4 5 6 7 8 9 10 11
TABLE - 9: NUMBER OF INFANT DEATHS REGISTERED - STATES/ UNION TERRITORIES/ DISTRICTS, 2012
Sl.
No.
States/ Union
Territories/ Districts
Rural Urban Total
4. Baran 56 54 110 133 126 259 189 180 369
5. Barmer 128 122 250 51 52 103 179 174 353
6. Bharatpur 182 160 342 139 126 265 321 286 607
7. Bhilwara 90 88 178 114 102 216 204 190 394
8. Bikaner 12 13 25 402 394 796 414 407 821
9. Bundi 25 22 47 128 119 247 153 141 294
10. Chittaurgarh 42 49 91 71 74 145 113 123 236
11. Churu 14 12 26 51 54 105 65 66 131
12. Dausa 29 33 62 84 90 174 113 123 236
13. Dhaulpur 6 5 11 137 133 270 143 138 281
14. Dungarpur 77 75 152 63 65 128 140 140 280
15. Ganganagar 115 118 233 66 62 128 181 180 361
16. Hanumangarh 165 146 311 124 102 226 289 248 537
17. Jaipur 41 40 81 1405 1305 2710 1446 1345 2791
18. Jaisalmer 40 43 83 66 72 138 106 115 221
19. Jalor 62 69 131 35 36 71 97 105 202
20. Jhalawar 27 26 53 194 189 383 221 215 436
21. Jhunjhunun 43 38 81 25 27 52 68 65 133
22. Jodhpur 94 65 159 579 246 825 673 311 984
23. Karauli 14 15 29 88 85 173 102 100 202
24. Kota 15 14 29 102 81 183 117 95 212
25. Nagaur 51 32 83 156 128 284 207 160 367
26. Pali 31 19 50 177 144 321 208 163 371
27. Partapgarh 27 26 53 87 89 176 114 115 229
28. Rajsamand 21 27 48 50 57 107 71 84 155
29. Sawai Madhopur 12 5 17 33 20 53 45 25 70
30. Sikar 3 2 5 117 50 167 120 52 172
31. Sirohi 14 17 31 92 85 177 106 102 208
32. Tonk 75 84 159 168 146 314 243 230 473
33. Udaipur 52 57 109 460 393 853 512 450 962
Sikkim 15 15 30 59 45 104 74 60 134
1. East 2 2 4 23 21 44 25 23 48
2. North 2 1 3 5 3 8 7 4 11
3. South 4 5 9 17 5 22 21 10 31
4. West 7 7 14 14 16 30 21 23 44
Tamil Nadu 1251 1163 2414 4561 3346 7907 5812 4509 10321
1. Krishnagiri - - - 43 44 87 43 44 87
2. Chennai - - - 91 104 195 91 104 195
3. Coimbatore - - - 337 231 568 337 231 568
4. Cuddalore 49 43 92 69 63 132 118 106 224
5. Dharmapuri 133 168 301 247 172 419 380 340 720
6. Dindigul - - - 86 65 151 86 65 151
7. Erode 7 8 15 151 117 268 158 125 283
8. Kancheepuram 1 1 2 37 25 62 38 26 64
9. Kanyakumari 1 2 3 102 61 163 103 63 166
10. Karur 9 4 13 40 31 71 49 35 84
11. Madurai 7 6 13 577 422 999 584 428 1012
12. Nagapattinam 0 0 0 36 31 67 36 31 67
13. Namakkal 2 1 3 56 44 100 58 45 103
14. Perambalur - - - 59 62 121 59 62 121
15. Pudukottai - - - 72 43 115 72 43 115
16. Ramanathapuram - - - 95 52 147 95 52 147
91

Male Female Person Male Female Person Male Female Person
1 2 3 4 5 6 7 8 9 10 11
TABLE - 9: NUMBER OF INFANT DEATHS REGISTERED - STATES/ UNION TERRITORIES/ DISTRICTS, 2012
Sl.
No.
States/ Union
Territories/ Districts
Rural Urban Total
17. Salem - - - 65 61 126 65 61 126
18. Sivaganga 3 2 5 12 7 19 15 9 24
19. Thanjavur - - - 510 337 847 510 337 847
20. The Nilgiris 7 4 11 21 23 44 28 27 55
21. Theni 80 62 142 31 38 69 111 100 211
22. Thiruvallur 18 10 28 22 16 38 40 26 66
23. Thiruvarur 1 0 1 42 23 65 43 23 66
24. Tiruchirappalli - - - 406 285 691 406 285 691
25. Tirunelveli 266 224 490 353 238 591 619 462 1081
26. Tiruvanamalai 1 1 2 39 36 75 40 37 77
27. Thiruppur 8 6 14 52 52 104 60 58 118
28. Thoothukudi 64 42 106 168 140 308 232 182 414
29. Vellore 57 55 112 616 419 1035 673 474 1147
30. Viluppuram 536 523 1059 8 7 15 544 530 1074
31. Virudhunagar 1 1 2 118 97 215 119 98 217
Tripura 223 152 375 305 204 509 528 356 884
1. Dhalai 56 21 77 - - - 56 21 77
2. Gomati 34 28 62 - - - 34 28 62
3. Khowai 7 10 17 - - - 7 10 17
4. North Tripura 19 13 32 - - - 19 13 32
5. Shipahijala 4 6 10 - - - 4 6 10
6. South Tripura 12 8 20 - - - 12 8 20
7. Unokuti 56 38 94 - - - 56 38 94
8. West Tripura 35 28 63 305 204 509 340 232 572
Uttarakhand 141 125 266 114 81 195 255 206 461
1. Pauri 21 12 33 0 0 0 21 12 33
2. Tehri 8 6 14 2 2 4 10 8 18
3. Chamoli 29 30 59 7 7 14 36 37 73
4. Uttarkashi 5 3 8 5 5 10 10 8 18
5. Rudraprayag 13 21 34 3 4 7 16 25 41
6. Pithoragarh 2 4 6 2 1 3 4 5 9
7. Almora 27 20 47 20 14 34 47 34 81
8. Champawat 0 0 0 0 0 0 0 0 0
9. Bageswar 0 0 0 2 4 6 2 4 6
10. Nainital 0 0 0 0 0 0 0 0 0
11. U.S. Nagar 0 0 0 0 0 0 0 0 0
12. Haridwar 0 0 0 0 0 0 0 0 0
13. Dehradun 36 29 65 73 44 117 109 73 182
West Bengal 4513 3256 7769 6335 4565 10900 10848 7821 18669
1. Bankura 234 228 462 494 349 843 728 577 1305
2. Barddhaman 151 110 261 1012 609 1621 1163 719 1882
3. Birbhum 103 92 195 6 7 13 109 99 208
4. Dakshin Dinajpur 242 153 395 2 0 2 244 153 397
5. Darjiling 372 219 591 98 86 184 470 305 775
6. Haora 103 60 163 29 31 60 132 91 223
7. Hugli 102 83 185 144 124 268 246 207 453
8. Jalpaiguri 45 35 80 210 149 359 255 184 439
9. Koch Bihar 24 27 51 325 248 573 349 275 624
10. Kolkata - - - 874 592 1466 874 592 1466
11. Maldah 781 364 1145 624 396 1020 1405 760 2165
12. P.S Medinipur 132 133 265 236 178 414 368 311 679
92

Male Female Person Male Female Person Male Female Person
1 2 3 4 5 6 7 8 9 10 11
TABLE - 9: NUMBER OF INFANT DEATHS REGISTERED - STATES/ UNION TERRITORIES/ DISTRICTS, 2012
Sl.
No.
States/ Union
Territories/ Districts
Rural Urban Total
13. P.U Medinipur 307 238 545 25 24 49 332 262 594
14. Murshidabad 264 245 509 1351 834 2185 1615 1079 2694
15. Nadia 313 232 545 345 242 587 658 474 1132
16. North 24 Parganas 299 238 537 180 138 318 479 376 855
17. Puruliya 265 86 351 245 438 683 510 524 1034
18. South 24 Parganas 686 606 1292 11 10 21 697 616 1313
19. Uttar Dinajpur 90 107 197 124 110 234 214 217 431
A. & N. Islands 46 37 83 33 20 53 79 57 136
1. South Andaman 7 3 10 33 20 53 40 23 63
2. Nicobar 20 21 41 - - - 20 21 41
3. North & Middle Andaman 19 13 32 - - - 19 13 32
Chandigarh - - - 1443 697 2140 1443 697 2140
1. Chandigarh - - - 1443 697 2140 1443 697 2140
D & N Haveli 10 7 17 0 4 4 10 11 21
1. D & N Haveli 10 7 17 0 4 4 10 11 21
Daman & Diu 1 1 2 5 2 7 6 3 9
1. Daman - - - 5 1 6 5 1 6
2. Diu 1 1 2 - 1 1 1 2 3
Delhi 247 115 362 5087 3179 8266 5334 3294 8628
1. Delhi 247 115 362 5087 3179 8266 5334 3294 8628
Lakshadweep 7 2 9 - - - 7 2 9
1. Lakshadweep 7 2 9 - - - 7 2 9
Puducherry 3 8 11 555 397 952 558 405 963
1. Karaikal 2 0 2 21 15 36 23 15 38
2. Mahe 0 0 0 0 0 0 0 0 0
3. Puducherry 1 8 9 534 382 916 535 390 925
4. Yanam 0 0 0 0 0 0 0 0 0
Note: 1: In case of Kerala & Chhattisgarh, total person also includes the cases of sex not reported.
2: The figures on infant death registration is not available for the States of Bihar, Jharkhand and Tripura.
3: The total of manipur does not match with distirct-wise total because other the Imphal east & Imphal west, details
for other district not available
93

Male Female Person Male Female Person Male Female Person
1 2 3 4 5 6 7 8 9 10 11
Andhra Pradesh 166 202 368 1475 1176 2651 1641 1378 3019
1. Adilabad 9 14 23 43 18 61 52 32 84
2. Ananthapur 4 3 7 25 22 47 29 25 54
3. Chittoor 3 4 7 56 35 91 59 39 98
4. Kadapa 6 4 10 18 15 33 24 19 43
5. East Godavari 4 5 9 90 73 163 94 78 172
6. Guntur 9 11 20 114 95 209 123 106 229
7. Hyderabad 0 0 0 479 415 894 479 415 894
8. Karimnagar 21 18 39 34 24 58 55 42 97
9. Khammam 11 13 24 46 47 93 57 60 117
10. Krishna 8 9 17 49 33 82 57 42 99
11. Kurnool 9 8 17 59 47 106 68 55 123
12. Mahaboobnagar 12 16 28 41 32 73 53 48 101
13. Medak 7 11 18 34 24 58 41 35 76
14. Nalgonda 7 9 16 26 24 50 33 33 66
15. Nellore 4 6 10 28 22 50 32 28 60
16. Nizamabad 9 12 21 27 19 46 36 31 67
17. Prakasham 3 6 9 36 23 59 39 29 68
18. Rangareddi 3 4 7 19 11 30 22 15 37
19. Srikakulam 6 9 15 21 28 49 27 37 64
20. Visakhapatnam 9 11 20 82 52 134 91 63 154
21. Vizianagaram 6 11 17 28 25 53 34 36 70
22. Warangal 9 12 21 29 18 47 38 30 68
23. West Godavari 7 6 13 91 74 165 98 80 178
Assam 531 564 1095 147 135 282 678 699 1377
1. Barpeta 35 39 74 6 4 10 41 43 84
2. Bongaigaon 53 60 113 18 13 31 71 73 144
3. Baksa 0 0 0 0 0 0 0 0 0
4. Cachar 29 26 55 7 4 11 36 30 66
5. Chirang 14 7 21 5 1 6 19 8 27
6. Darrang 8 7 15 5 1 6 13 8 21
7. Dhemaji 2 4 6 0 2 2 2 6 8
8. Dhubri 88 108 196 29 30 59 117 138 255
9. Dibrugarh 3 6 9 0 1 1 3 7 10
10. Goalpara 31 18 49 7 5 12 38 23 61
11. Golaghat 9 19 28 0 2 2 9 21 30
12. Hailakandi 9 13 22 4 1 5 13 14 27
13. Jorhat 19 53 72 7 5 12 26 58 84
14. Kamrup ( R ) 0 0 0 0 0 0 0 0 0
15. Kamrup (M) 59 44 103 8 7 15 67 51 118
16. Karbi Anglong 15 18 33 6 20 26 21 38 59
17. Karimganj 19 16 35 5 3 8 24 19 43
18. Kokrajhar 15 6 21 5 3 8 20 9 29
19. Lakhimpur 1 6 7 0 3 3 1 9 10
20. Morigaon 19 12 31 3 2 5 22 14 36
21. Nagaon 11 18 29 7 2 9 18 20 38
22. Nalbari 7 14 21 5 4 9 12 18 30
23. N C Hills (Dima Hasao) 6 11 17 2 5 7 8 16 24
24. Sibsagar 8 18 26 3 1 4 11 19 30
25. Sonitpur 19 3 22 3 5 8 22 8 30
26. Tinsukia 29 19 48 4 5 9 33 24 57
27. Udalguri 23 19 42 8 6 14 31 25 56
Table-10: NUMBER OF STILL BIRTHS REGISTERED - STATES/ UNION TERRITORIES/ DISTRICTS, 2012
Sl.
No.
States/ Union
Territories/ Districts
Rural Urban Total
96

Male Female Person Male Female Person Male Female Person
1 2 3 4 5 6 7 8 9 10 11
Table-10: NUMBER OF STILL BIRTHS REGISTERED - STATES/ UNION TERRITORIES/ DISTRICTS, 2012
Sl.
No.
States/ Union
Territories/ Districts
Rural Urban Total
Chhattisgarh 321 238 565 388 321 715 709 559 1280
1. Bastar 12 6 18 0 1 1 12 7 19
2. Bilaspur 38 22 65 45 32 82 83 54 147
3. Bijapur 4 2 6 0 0 0 4 2 6
4. Balodabazar 16 16 32 8 7 15 24 23 47
5. Balod 6 3 9 3 9 12 9 12 21
6. Bemetara 1 2 3 0 0 0 1 2 3
7. Balrampur 7 8 15 0 0 0 7 8 15
8. Dantewada 4 2 6 1 1 2 5 3 8
9. Dhamtari 10 8 18 78 59 137 88 67 155
10. Durg 15 9 24 2 7 9 17 16 33
11. Gariyaband 7 5 12 11 6 17 18 11 29
12. Janjgir-Champa 21 9 30 14 14 28 35 23 58
13. Jashpur 36 37 73 10 16 27 46 53 100
14. Kanker 7 6 13 0 0 0 7 6 13
15. Kabeerdham(Kawardha) 39 26 65 100 81 181 139 107 246
16. Korba 5 5 10 6 2 8 11 7 18
17. Koriya 1 1 2 0 2 2 1 3 4
18. Kondagaon 12 18 30 0 0 0 12 18 30
19. Mahasamund 29 17 46 47 35 82 76 52 128
20. Mungeli 2 1 3 0 0 0 2 1 3
21. Naraynapur 12 10 22 16 19 35 28 29 57
22. Raigarh 9 7 16 7 5 12 16 12 28
23. Raipur 12 6 19 3 1 4 15 7 23
24. Rajnandgaon 2 2 4 21 17 38 23 19 42
25. Surguja 6 6 12 16 7 23 22 13 35
26. Sukma 3 1 4 0 0 0 3 1 4
27. Surajpur 5 3 8 0 0 0 5 3 8
Goa 76 72 148 31 27 58 107 99 206
1. North Goa 75 70 145 19 19 38 94 89 183
2. South Goa 1 2 3 12 8 20 13 10 23
Gujarat 639 502 1141 4231 3687 7918 4870 4189 9059
1. Ahmadabad 7 8 15 266 198 464 273 206 479
2. Amreli 14 11 25 123 88 211 137 99 236
3. Anand 12 16 28 140 146 286 152 162 314
4. Banas Kantha 118 87 205 530 431 961 648 518 1166
5. Bharuch 49 45 94 63 63 126 112 108 220
6. Bhavnagar 0 1 1 5 6 11 5 7 12
7. Dohad - - - 334 300 634 334 300 634
8. Gandhinagar 5 6 11 31 33 64 36 39 75
9. Jamnagar 1 3 4 0 1 1 1 4 5
10. Junagadh 7 9 16 36 23 59 43 32 75
11. Kachchh 23 19 42 213 204 417 236 223 459
12. Kheda 56 47 103 94 106 200 150 153 303
13. Mahesana 10 9 19 173 147 320 183 156 339
14. Narmada 42 35 77 45 34 79 87 69 156
15. Navsari 1 0 1 6 4 10 7 4 11
16. Panch Mahals 40 33 73 376 346 722 416 379 795
17. Patan 18 17 35 496 366 862 514 383 897
18. Porbandar 0 0 0 60 44 104 60 44 104
19. Rajkot 3 0 3 408 328 736 411 328 739
20. Sabar Kantha 54 55 109 186 204 390 240 259 499
97

Male Female Person Male Female Person Male Female Person
1 2 3 4 5 6 7 8 9 10 11
Table-10: NUMBER OF STILL BIRTHS REGISTERED - STATES/ UNION TERRITORIES/ DISTRICTS, 2012
Sl.
No.
States/ Union
Territories/ Districts
Rural Urban Total
21. Surat 23 29 52 148 114 262 171 143 314
22. Surendranagar 24 13 37 106 105 211 130 118 248
23. Tapi 0 0 0 22 14 36 22 14 36
24. The Dangs 0 0 0 0 0 0 0 0 0
25. Vadodara 29 22 51 309 337 646 338 359 697
26. Valsad 103 37 140 61 45 106 164 82 246
Haryana 923 1234 2157
1. Ambala 40 6 46
2. Bhiwani 104 117 221
3. Faridabad 121 33 154
4. Fatehabad 72 8 80
5. Gurgaon 12 49 61
6. Hisar 59 109 168
7. Jhajjar 29 2 31
8. Jind 49 14 63
9. Kaithal 40 4 44
10. Karnal 67 183 250
11. Kurukshetra 19 45 64
12. Mewat 50 1 51
13. Narnaul (M.Garh) 15 63 78
14. Palwal 70 49 119
15. Panchkula 5 58 63
16. Panipat 26 4 30
17. Rewari 8 140 148
18. Rohtak 14 271 285
19. Sirsa 47 52 99
20. Sonipat 38 7 45
21. Yamunanagar 38 19 57
Himachal Pradesh 51 44 95 9 8 17 60 52 112
1. Bilaspur
2. Chamba - - - 1 0 1 1 0 1
3. Hamirpur - - - 2 0 2 2 0 2
4. Kangra 3 2 5 - - - 3 2 5
5. Kinnaur
6. Kullu - - - 6 8 14 6 8 14
7. Lahul & Spiti
8. Mandi
9. Shimla
10. Sirmaur
11. Solan
12. Una 48 42 90 - - - 48 42 90
Karnataka 270 234 504 3005 3015 6020 3275 3249 6524
1. Bagalkote 23 13 36 244 285 529 267 298 565
2. Bangalore Urban 1 2 3 139 137 276 140 139 279
3. Bangalore Rural 2 5 7 - - - 2 5 7
4. Belgaum 52 40 92 386 615 1001 438 655 1093
5. Bellary 26 24 50 352 249 601 378 273 651
6. Bidar 7 0 7 180 130 310 187 130 317
7. Bijapur 19 36 55 94 102 196 113 138 251
8. Chamarajanagar 47 32 79 21 6 27 68 38 106
9. Chickballapur 3 2 5 20 18 38 23 20 43
…………………………...…… Not Available………………………………….
……
……
……
……
…..
……
… N
ot
Av
ail
ab
le…
……
……
……
……
..…
……
....
……
……
……
……
…..
……
… N
ot
Av
ail
ab
le…
……
……
……
……
..…
……
....
……
……
……
……
…..
……
… N
ot
Av
ail
ab
le…
……
……
……
……
..…
……
....
…………………………...…… Not Available………………………………….
………………………..……… Not Available………………………..………....
…………………………...…… Not Available………………………………….
98

Male Female Person Male Female Person Male Female Person
1 2 3 4 5 6 7 8 9 10 11
Table-10: NUMBER OF STILL BIRTHS REGISTERED - STATES/ UNION TERRITORIES/ DISTRICTS, 2012
Sl.
No.
States/ Union
Territories/ Districts
Rural Urban Total
10. Chikmagalur 0 0 0 8 9 17 8 9 17
11. Chitradurga 0 1 1 155 106 261 155 107 262
12. Dakshina Kannada 17 15 32 147 70 217 164 85 249
13. Davanagere 2 3 5 49 51 100 51 54 105
14. Dharwad 1 8 9 165 308 473 166 316 482
15. Gadag 1 7 8 104 187 291 105 194 299
16. Gulbarga 0 0 0 46 11 57 46 11 57
17. Hassan 3 0 3 22 4 26 25 4 29
18. Haveri 12 6 18 222 185 407 234 191 425
19. Kodagu 2 0 2 14 0 14 16 0 16
20. Kolar 0 2 2 85 78 163 85 80 165
21. Koppal 6 4 10 18 12 30 24 16 40
22. Mandya 0 0 0 2 8 10 2 8 10
23. Mysore 24 10 34 124 102 226 148 112 260
24. Raichur 9 4 13 129 117 246 138 121 259
25. Ramanagar 0 1 1 3 2 5 3 3 6
26. Shimoga 6 6 12 100 101 201 106 107 213
27. Tumkur 4 9 13 14 22 36 18 31 49
28. Udupi 0 1 1 83 37 120 83 38 121
29. Uttara Kannada 3 3 6 79 63 142 82 66 148
30. Yadgir
Kerala 462 401 867 772 823 1605 1234 1224 2472
1. Alappuzha 6 2 8 7 7 14 13 9 22
2. Ernakulam 29 26 56 84 82 166 113 108 222
3. Idukki 19 19 39 5 4 9 24 23 48
4. Kannoor 56 47 103 77 75 152 133 122 255
5. Kasaragod 6 5 11 24 20 44 30 25 55
6. Kollam 29 12 41 17 12 29 46 24 70
7. Kottayam 83 82 166 3 7 11 86 89 177
8. Kozhikode 10 19 29 206 225 436 216 244 465
9. Malappuram 83 66 149 53 60 113 136 126 262
10. Palakkad 16 10 26 42 42 84 58 52 110
11. Pathanamthitta 7 1 8 15 13 28 22 14 36
11. Thiruvananthapuram 8 6 14 192 234 430 200 240 444
13. Thrissur 74 78 152 35 33 68 109 111 220
14. Wayanad 36 28 65 12 9 21 48 37 86
Madhya Pradesh 1787 1483 3270 6225 5262 11487 8012 6745 14757
1. Ashoknagar 21 25 46 164 146 310 185 171 356
2. Annuppur 12 8 20 7 4 11 19 12 31
3. Alirajpuir 16 17 33 49 35 84 65 52 117
4. Balaghat
5. Barwani 2 1 3 182 173 355 184 174 358
6. Betul 44 32 76 166 144 310 210 176 386
7. Bhind 2 1 3 89 67 156 91 68 159
8. Bhopal 38 18 56 289 262 551 327 280 607
9. Burhanpur
10. Chhatarpur 179 170 349 403 343 746 582 513 1095
11. Chhindwara 25 24 49 271 258 529 296 282 578
12. Damoh 7 7 14 119 104 223 126 111 237
13. Datia 13 18 31 56 49 105 69 67 136
14. Dewas 4 2 6 168 97 265 172 99 271
15. Dhar 147 73 220 208 135 343 355 208 563
………………………..……… Not Available………………………..………....
………………………..……… Not Available………………………..………....
………………………..……… Not Available………………………..………....
99
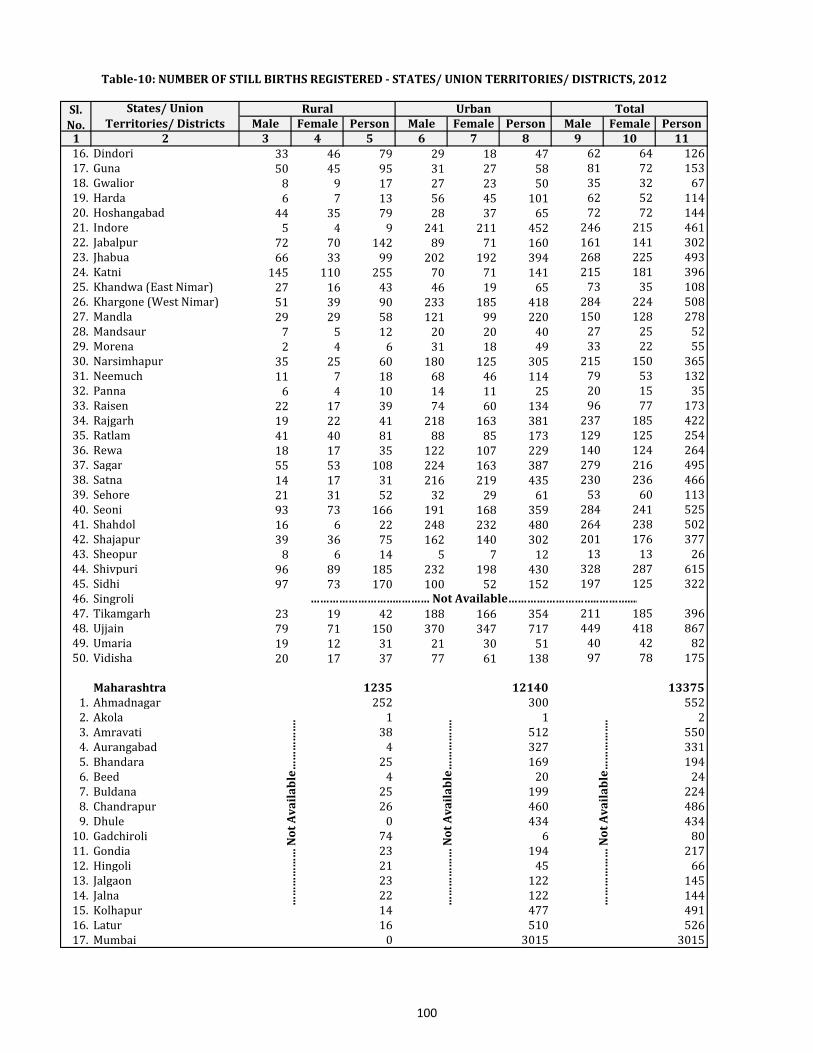
Male Female Person Male Female Person Male Female Person
1 2 3 4 5 6 7 8 9 10 11
Table-10: NUMBER OF STILL BIRTHS REGISTERED - STATES/ UNION TERRITORIES/ DISTRICTS, 2012
Sl.
No.
States/ Union
Territories/ Districts
Rural Urban Total
16. Dindori 33 46 79 29 18 47 62 64 126
17. Guna 50 45 95 31 27 58 81 72 153
18. Gwalior 8 9 17 27 23 50 35 32 67
19. Harda 6 7 13 56 45 101 62 52 114
20. Hoshangabad 44 35 79 28 37 65 72 72 144
21. Indore 5 4 9 241 211 452 246 215 461
22. Jabalpur 72 70 142 89 71 160 161 141 302
23. Jhabua 66 33 99 202 192 394 268 225 493
24. Katni 145 110 255 70 71 141 215 181 396
25. Khandwa (East Nimar) 27 16 43 46 19 65 73 35 108
26. Khargone (West Nimar) 51 39 90 233 185 418 284 224 508
27. Mandla 29 29 58 121 99 220 150 128 278
28. Mandsaur 7 5 12 20 20 40 27 25 52
29. Morena 2 4 6 31 18 49 33 22 55
30. Narsimhapur 35 25 60 180 125 305 215 150 365
31. Neemuch 11 7 18 68 46 114 79 53 132
32. Panna 6 4 10 14 11 25 20 15 35
33. Raisen 22 17 39 74 60 134 96 77 173
34. Rajgarh 19 22 41 218 163 381 237 185 422
35. Ratlam 41 40 81 88 85 173 129 125 254
36. Rewa 18 17 35 122 107 229 140 124 264
37. Sagar 55 53 108 224 163 387 279 216 495
38. Satna 14 17 31 216 219 435 230 236 466
39. Sehore 21 31 52 32 29 61 53 60 113
40. Seoni 93 73 166 191 168 359 284 241 525
41. Shahdol 16 6 22 248 232 480 264 238 502
42. Shajapur 39 36 75 162 140 302 201 176 377
43. Sheopur 8 6 14 5 7 12 13 13 26
44. Shivpuri 96 89 185 232 198 430 328 287 615
45. Sidhi 97 73 170 100 52 152 197 125 322
46. Singroli
47. Tikamgarh 23 19 42 188 166 354 211 185 396
48. Ujjain 79 71 150 370 347 717 449 418 867
49. Umaria 19 12 31 21 30 51 40 42 82
50. Vidisha 20 17 37 77 61 138 97 78 175
Maharashtra 1235 12140 13375
1. Ahmadnagar 252 300 552
2. Akola 1 1 2
3. Amravati 38 512 550
4. Aurangabad 4 327 331
5. Bhandara 25 169 194
6. Beed 4 20 24
7. Buldana 25 199 224
8. Chandrapur 26 460 486
9. Dhule 0 434 434
10. Gadchiroli 74 6 80
11. Gondia 23 194 217
12. Hingoli 21 45 66
13. Jalgaon 23 122 145
14. Jalna 22 122 144
15. Kolhapur 14 477 491
16. Latur 16 510 526
17. Mumbai 0 3015 3015
……
……
……
No
t A
va
ila
ble
……
……
….
……
……
……
No
t A
va
ila
ble
……
……
….
……
……
……
No
t A
va
ila
ble
……
……
….
………………………..……… Not Available………………………..………....
100

Male Female Person Male Female Person Male Female Person
1 2 3 4 5 6 7 8 9 10 11
Table-10: NUMBER OF STILL BIRTHS REGISTERED - STATES/ UNION TERRITORIES/ DISTRICTS, 2012
Sl.
No.
States/ Union
Territories/ Districts
Rural Urban Total
18. Nagpur 16 294 310
19. Nanded 56 66 122
20. Nandurbar 5 116 121
21. Nashik 100 815 915
22. Osmanabad 5 87 92
23. Parbhani 40 28 68
24. Pune 53 932 985
25. Raigarh 18 0 18
26. Ratnagiri 16 145 161
27. Sangli 45 355 400
28. Satara 102 266 368
29. Sindhudurg 6 12 18
30. Solapur 71 477 548
31. Thane 62 1250 1312
32. Wardha 64 20 84
33. Washim 7 46 53
34. Yavatmal 1 318 319
...…
Not A
vailable
…..
...…
Not A
vailable
…..
...…
Not A
vailable
…..
Meghalaya 462 405 867 223 253 476 685 658 1343
1. East Garo Hills 31 23 54 7 12 19 38 35 73
2. East Khasi Hills 93 89 182 98 111 209 191 200 391
3. Jaintia Hills 71 75 146 94 104 198 165 179 344
4. Ri Bhoi 45 30 75 0 0 0 45 30 75
5. South Garo Hills 10 7 17 4 2 6 14 9 23
6. West Garo Hills 145 94 239 20 24 44 165 118 283
7. West Khasi Hills 67 87 154 - - - 67 87 154
Mizoram 15 12 27 31 29 60 46 41 87
1. Aizawl 2 3 5 19 18 37 21 21 42
2. Champhai 5 2 7 1 1 2 6 3 9
3. Chhimtuipui (Saiha) 2 1 3 - - - 2 1 3
4. Kolasib 0 0 0 4 2 6 4 2 6
5. Lawngtlai 5 3 8 0 0 0 5 3 8
6. Lunglei - - - 7 8 15 7 8 15
7. Mamit 1 3 4 0 0 0 1 3 4
8. Serchhip
Nagaland 4 6 10 4 5 9 8 11 19
1. Dimapur
2. Kohima
3. Mokokchung 1 4 5 1 3 4 2 7 9
4. Mon
5. Phek
6. Tuensang 1 1 2 1 1 2 2 2 4
7. Wokha
8. Zunheboto 2 1 3 2 1 3 4 2 6
9. Peren
10. Longleng
11. Kiphire
Odisha 3715 3087 6802 2320 2089 4409 6035 5176 11211
1. Angul 74 62 136 15 13 28 89 75 164
2. Bolangir 163 129 292 128 117 245 291 246 537
3. Balasore 141 119 260 41 34 75 182 153 335
…………………………...…… Not Available………………………………….
…………………………...…… Not Available………………………………….
…………………………...…… Not Available………………………………….
…………………………...…… Not Available………………………………….
…………………………...…… Not Available………………………………….
101

Male Female Person Male Female Person Male Female Person
1 2 3 4 5 6 7 8 9 10 11
Table-10: NUMBER OF STILL BIRTHS REGISTERED - STATES/ UNION TERRITORIES/ DISTRICTS, 2012
Sl.
No.
States/ Union
Territories/ Districts
Rural Urban Total
4. Bargarh 61 49 110 21 12 33 82 61 143
5. Bhadrak 54 39 93 25 10 35 79 49 128
6. Boudh 62 70 132 16 19 35 78 89 167
7. Cuttack 129 124 253 81 58 139 210 182 392
8. Deogarh 40 32 72 24 15 39 64 47 111
9. Dhenkanal 61 57 118 82 83 165 143 140 283
10. Gajapati 75 63 138 4 1 5 79 64 143
11. Ganjam 135 114 249 218 169 387 353 283 636
12. Jagatsinghpur 38 22 60 3 0 3 41 22 63
13. Jajpur 125 106 231 106 85 191 231 191 422
14. Jharsuguda 19 25 44 10 15 25 29 40 69
15. Kalahandi 177 139 316 92 90 182 269 229 498
16. Kandhamal 214 162 376 122 104 226 336 266 602
17. Kendrapara 123 38 161 120 37 157 243 75 318
18. Keonjhar 172 134 306 105 126 231 277 260 537
19. Khurda 48 38 86 76 88 164 124 126 250
20. Koraput 296 241 537 173 138 311 469 379 848
21. Malkangiri 250 224 474 89 52 141 339 276 615
22. Mayurbhanj 251 227 478 219 234 453 470 461 931
23. Nabarangpur 439 338 777 17 16 33 456 354 810
24. Nayagarh 59 49 108 73 52 125 132 101 233
25. Nuapada 17 100 117 21 154 175 38 254 292
26. Puri 35 22 57 - - - 35 22 57
27. Rayagada 244 169 413 94 71 165 338 240 578
28. Sambalpur 31 29 60 268 223 491 299 252 551
29. Subarnapur 52 58 110 1 1 2 53 59 112
30. Sundargarh 130 108 238 76 72 148 206 180 386
Punjab 338 240 578 1176 931 2107 1514 1171 2685
1. Amritsar - - - 30 17 47 30 17 47
2. Bathinda 27 24 51 89 51 140 116 75 191
3. Barnala - - - 43 27 70 43 27 70
4. Faridkot 4 9 13 131 98 229 135 107 242
5. Fatehgarh Sahib 12 9 21 11 9 20 23 18 41
6. Firozpur 1 1 2 19 14 33 20 15 35
7. Gurdaspur 46 26 72 - - - 46 26 72
8. Hoshiarpur 41 36 77 53 51 104 94 87 181
9. Jalandhar 37 20 57 99 95 194 136 115 251
10. Kapurthala 28 13 41 50 53 103 78 66 144
11. Ludhiana 28 23 51 125 106 231 153 129 282
12. Mansa 22 12 34 66 55 121 88 67 155
13. Mohali - - - 23 20 43 23 20 43
14. Moga 48 38 86 43 37 80 91 75 166
15. Muktsar - - - 25 20 45 25 20 45
16. Nawanshahr - - - 60 57 117 60 57 117
17. Patiala 17 12 29 121 106 227 138 118 256
18. Ropar (Rup Nagar) 16 9 25 78 54 132 94 63 157
19. Sangrur 11 8 19 110 61 171 121 69 190
20. Tarn Taran
Rajasthan 269 254 523 3647 3147 6794 3916 3401 7317
1. Ajmer 2 2 4 291 220 511 293 222 515
2. Alwar 3 2 5 17 12 29 20 14 34
3. Banswara - - - 5 6 11 5 6 11
…………………………...…… Not Available………………………………….
102

Male Female Person Male Female Person Male Female Person
1 2 3 4 5 6 7 8 9 10 11
Table-10: NUMBER OF STILL BIRTHS REGISTERED - STATES/ UNION TERRITORIES/ DISTRICTS, 2012
Sl.
No.
States/ Union
Territories/ Districts
Rural Urban Total
4. Baran - - - 4 2 6 4 2 6
5. Barmer - - - 13 10 23 13 10 23
6. Bharatpur 11 4 15 349 289 638 360 293 653
7. Bhilwara 20 15 35 256 205 461 276 220 496
8. Bikaner 6 11 17 362 256 618 368 267 635
9. Bundi 20 32 52 56 42 98 76 74 150
10. Chittaurgarh 1 1 2 26 28 54 27 29 56
11. Churu - - - 23 17 40 23 17 40
12. Dausa 14 18 32 144 172 316 158 190 348
13. Dhaulpur - - - 5 3 8 5 3 8
14. Dungarpur 56 52 108 153 158 311 209 210 419
15. Ganganagar 6 5 11 56 65 121 62 70 132
16. Hanumangarh 16 14 30 123 126 249 139 140 279
17. Jaipur 21 17 38 62 61 123 83 78 161
18. Jaisalmer 25 21 46 96 88 184 121 109 230
19. Jalor
20. Jhalawar - - - 25 26 51 25 26 51
21. Jhunjhunun 1 1 2 22 18 40 23 19 42
22. Jodhpur 3 2 5 425 311 736 428 313 741
23. Karauli
24. Kota 2 1 3 35 44 79 37 45 82
25. Nagaur 3 2 5 197 182 379 200 184 384
26. Pali 4 3 7 156 198 354 160 201 361
27. Partapgarh 7 4 11 186 133 319 193 137 330
28. Rajsamand - - - 15 13 28 15 13 28
29. Sawai Madhopur - - - 4 2 6 4 2 6
30. Sikar 13 12 25 176 161 337 189 173 362
31. Sirohi 12 15 27 273 194 467 285 209 494
32. Tonk 21 18 39 65 84 149 86 102 188
33. Udaipur 2 2 4 27 21 48 29 23 52
Sikkim 11 7 19 23 33 56 34 40 75
1. East 2 3 5 12 12 24 14 15 29
2. North 2 0 2 0 3 3 2 3 5
3. South 4 4 9 7 14 21 11 18 30
4. West 3 0 3 4 4 8 7 4 11
Tamil Nadu 2391 5331 7722
1. Krishnagiri 58 250 308
2. Chennai - 750 750
3. Coimbatore - 216 216
4. Cuddalore 135 128 263
5. Dharmapuri 54 54
6. Dindigul 108 221 329
7. Erode 22 164 186
8. Kancheepuram 109 47 156
9. Kanyakumari 91 134 225
10. Karur 19 76 95
11. Madurai 644 106 750
12. Nagapattinam 11 69 80
13. Namakkal 58 72 130
14. Perambalur - 85 85
15. Pudukkottai - 90 90
16. Ramanathapuram 172 6 178
…………………………...…… Not Available………………………………….
…………………………...…… Not Available………………………………….
……
……
. No
t A
va
ila
ble
……
……
……
……
. No
t A
va
ila
ble
……
……
……
……
. No
t A
va
ila
ble
……
……
103

Male Female Person Male Female Person Male Female Person
1 2 3 4 5 6 7 8 9 10 11
Table-10: NUMBER OF STILL BIRTHS REGISTERED - STATES/ UNION TERRITORIES/ DISTRICTS, 2012
Sl.
No.
States/ Union
Territories/ Districts
Rural Urban Total
17. Salem - 446 446
18. Sivaganga 4 37 41
19. Thanjavur - 421 421
20. The Nilgiris 14 28 42
21. Theni 208 34 242
22. Thiruvallur 111 57 168
23. Thiruvarur 13 67 80
24. Tiruchirappalli 22 402 424
25. Tirunelveli 313 412 725
26. Tiruvanamalai 2 1 3
27. Thiruppur 39 146 185
28. Thoothukudi 1 83 84
29. Vellore 135 393 528
30. Viluppuram 78 70 148
31. Virudhunagar 24 266 290
Tripura 39 33 72 174 153 327 213 186 399
1. Dhalai 9 5 14 - - - 9 5 14
2. Gomati 2 3 5 - - - 2 3 5
3. Khowai 1 7 8 - - - 1 7 8
4. North Tripura 2 1 3 - - - 2 1 3
5. Shipahijala 12 9 21 - - - 12 9 21
6. South Tripura 6 5 11 - - - 6 5 11
7. Unokuti 2 3 5 - - - 2 3 5
8. West Tripura 5 0 5 174 153 327 179 153 332
Uttarakhand 292 234 526 245 169 414 537 403 940
1. Pauri 16 8 24 - - - 16 8 24
2. Tehri 10 7 17 2 2 4 12 9 21
3. Chamoli 14 11 25 2 6 8 16 17 33
4. Uttarkashi 15 10 25 53 37 90 68 47 115
5. Rudraprayag 13 23 36 1 1 2 14 24 38
6. Pithoragarh
7. Almora 55 47 102 1 0 1 56 47 103
8. Champawat
9. Bageswar - - - 7 5 12 7 5 12
10. Nainital
11. U.S. Nagar 105 77 182 8 2 10 113 79 192
12. Haridwar - - - 95 56 151 95 56 151
13. Dehradun 64 51 115 76 60 136 140 111 251
West Bengal 2902 2446 5348 2810 2690 5500 5712 5136 10848
1. Bankura 205 213 418 461 435 896 666 648 1314
2. Barddhaman 98 87 185 5 4 9 103 91 194
3. Birbhum 60 67 127 2 3 5 62 70 132
4. Dakshin Dinajpur 168 144 312 - - - 168 144 312
5. Darjiling 294 251 545 48 53 101 342 304 646
6. Haora 17 16 33 96 69 165 113 85 198
7. Hugli 42 36 78 413 313 726 455 349 804
8. Jalpaiguri 42 24 66 264 249 513 306 273 579
9. Koch Bihar 46 34 80 260 222 482 306 256 562
10. Kolkata
11. Maldah 161 129 290 353 315 668 514 444 958
12. P.S Medinipur 99 85 184 194 237 431 293 322 615
...…
No
t A
va
ila
ble
…..
...…
No
t A
va
ila
ble
…..
…………………………...…… Not Available………………………………….
…………………………...…… Not Available………………………………….
…………………………...…… Not Available………………………………….
…………………………...…… Not Available………………………………….
...…
No
t A
va
ila
ble
…..
104

Male Female Person Male Female Person Male Female Person
1 2 3 4 5 6 7 8 9 10 11
Table-10: NUMBER OF STILL BIRTHS REGISTERED - STATES/ UNION TERRITORIES/ DISTRICTS, 2012
Sl.
No.
States/ Union
Territories/ Districts
Rural Urban Total
13. P.U Medinipur 271 202 473 65 23 88 336 225 561
14. Murshidabad 232 151 383 231 213 444 463 364 827
15. Nadia 143 124 267 196 144 340 339 268 607
16. North Twenty Four Parganas 276 335 611 115 183 298 391 518 909
17. Puruliya 104 29 133 90 220 310 194 249 443
18. South Twenty Four Parganas 508 405 913 12 0 12 520 405 925
19. Uttar Dinajpur 136 114 250 5 7 12 141 121 262
A. & N. Islands 11 13 24 28 28 56 39 41 80
1. South Andaman 4 4 8 28 28 56 32 32 64
2. Nicobar 1 2 3 - - - 1 2 3
3. North & Middle Andaman 6 7 13 - - - 6 7 13
Chandigarh - - - 106 92 198 106 92 198
1. Chandigarh - - - 106 92 198 106 92 198
Daman & Diu - 1 1 - 1 1 - 2 2
1. Daman
2. Diu - 1 1 - 1 1 - 2 2
Lakshadweep 0 - - - 0
1. Lakshadweep - - -
Puducherry 73 835 908
1. Karaikal 50 50
2. Mahe
3. Puducherry 73 785 858
4. Yanam
Note: In case of Kerala & Chhattisgarh, total person also includes the cases of sex not reported.
…………………………...…… Not Available………………………………….
… Not Available… … Not Available… … Not Available…
………………………………………. Not Available……………………………………………..
… Not Available… … Not Available…
… Not Available… … Not Available…
… Not Available…… Not Available… … Not Available…
… Not Available…
…………………………...…… Not Available………………………………….
105

1 2 3 4
Andhra Pradesh 13.1 4.7
1. Adilabad 17.0 5.0
2. Ananthapur 15.0 4.0
3. Chittoor 13.0 5.0
4. Kadapa 8.0 5.0
5. East Godavari 9.0 5.0
6. Guntur 12.0 5.0
7. Hyderabad 47.0 11.0
8. Karimnagar 16.0 6.0
9. Khammam 7.0 5.0
10. Krishna 13.0 5.0
11. Kurnool 10.0 5.0
12. Mahaboobnagar 9.0 5.0
13. Medak 12.0 5.0
14. Nalgonda 8.0 4.0
15. Nellore 13.0 3.0
16. Nizamabad 7.0 2.0
17. Prakasham 7.0 5.0
18. Rangareddi 11.0 1.0
19. Srikakulam 15.0 4.0
20. Visakhapatnam 13.0 5.0
21. Vizianagaram 7.0 3.0
22. Warangal 12.0 5.0
23. West Godavari 14.0 5.0
Arunachal Pradesh 33.0 1.4
1. Changlang 9.7 0.6
2. Dibang Valley 60.2 2.3
3. East Kameng 40.3 1.1
4. East Siang 3.6 0.5
5. Lohit 32.1 1.8
6. Lower Subansiri 30.2 3.5
7. Papum Pare 41.0 1.2
8. Tawang 56.5 2.5
9. Tirap 25.2 0.5
10. Upper Siang 30.3 1.1
11. Upper Subansiri 8.1 0.5
12. West Kameng 46.3 2.2
13. West Siang 47.1 0.6
14. Kurung Kumey 2.3 0.1
15. Lower Dibang Valley 50.8 1.8
16. Anjaw 40.9 0.9
Goa 15.2 8.2
1. North 16.8 9.4
2. South 13.0 6.7
Gujarat 21.3 5.2
1. Ahmadabad 24.6 8.7
2. Amreli 23.2 5.6
3. Anand 24.0 7.4
4. Banas Kantha 29.8 2.6
5. Bharuch 21.7 7.9
6. Bhavnagar 28.2 5.3
Table-11: District-wise birth and death rates, 2012
Sl. No.State/ Union Territory/
DistrictCBR CDR
106

1 2 3 4
Table-11: District-wise birth and death rates, 2012
Sl. No.State/ Union Territory/
DistrictCBR CDR
7. Dohad 39.2 3.3
8. Gandhinagar 21.6 6.1
9. Jamnagar 20.9 4.5
10. Junagadh 22.7 5.8
11. Kachchh 31.5 5.2
12. Kheda 23.1 6.6
13. Mahesana 23.8 6.7
14. Narmada 21.2 5.8
15. Navsari 16.7 7.3
16. Panch Mahals 30.0 3.8
17. Patan 27.5 5.7
18. Porbandar 21.5 6.7
19. Rajkot 27.4 7.7
20. Sabar Kantha 30.9 5.0
21. Surat 19.7 5.7
22. Surendranagar 25.0 5.3
23. Tapi 13.8 5.0
24. The Dangs 29.9 6.7
25. Vadodara 22.3 7.3
26. Valsad 22.4 6.8
Haryana 21.7 6.2
1. Ambala 17.8 7.2
2. Bhiwani 17.7 5.7
3. Faridabad 23.7 4.7
4. Fatehabad 23.6 5.8
5. Gurgaon 23.7 5.7
6. Hisar 22.1 7.2
7. Jhajjar 16.0 5.7
8. Jind 18.8 6.1
9. Kaithal 21.0 6.6
10. Karnal 20.8 6.4
11. Kurukshetra 21.0 6.1
12. Mewat 41.3 4.8
13. Narnaul (M.Garh) 7.4 2.4
14. Pawal 27.3 5.1
15. Panchkula 23.1 5.7
16. Panipat 21.8 5.2
17. Rewari 20.4 6.0
18. Rohtak 24.4 11.6
19. Sirsa 19.5 5.9
20. Sonipat 19.4 6.3
21. Yamunanagar 19.2 6.4
Himachal Pradesh 18.6 6.4
1. Bilaspur 20.4 5.8
2. Chamba 20.2 5.8
3. Hamirpur 19.6 7.6
4. Kangra 17.3 7.0
5. Kinnaur 10.5 5.3
6. Kullu 18.1 5.7
7. Lahul & Spiti 7.0 5.3
8. Mandi 16.5 5.9
9. Shimla 19.4 6.4
107

1 2 3 4
Table-11: District-wise birth and death rates, 2012
Sl. No.State/ Union Territory/
DistrictCBR CDR
10. Sirmaur 19.8 5.6
11. Solan 18.6 5.6
12. Una 18.4 7.4
Karnataka 18.7 6.8
1. Bagalkote 23.5 6.9
2. Bangalore Urban 15.1 5.2
3. Bangalore Rural 12.3 6.7
4. Belgaum 19.3 6.8
5. Bellary 24.3 7.2
6. Bidar 24.1 6.0
7. Bijapur 25.9 6.9
8. Chamarajanagar 13.3 7.8
9. Chikballapur 12.1 5.0
10. Chikmagalur 14.3 5.1
11. Chitradurga 16.3 8.1
12. Dakshina Kannada 18.5 9.0
13. Davanagere 16.2 7.7
14. Dharwad 22.1 7.9
15. Gadag 22.0 9.3
16. Gulbarga 28.1 7.1
17. Hassan 14.5 7.3
18. Haveri 19.6 7.0
19. Kodagu 15.6 7.0
20. Kolar 14.5 3.9
21. Koppal 21.9 6.1
22. Mandya 12.5 5.7
23. Mysore 15.3 6.4
24. Raichur 18.2 5.2
25. Ramnagar 13.3 8.1
26. Shimoga 19.2 7.4
27. Tumkur 17.9 8.9
28. Udupi 15.4 9.5
29. Uttara Kannada 17.7 7.1
30. Yadgir 32.6 6.4
Kerala 15.6 6.8
1. Alappuzha 10.1 7.3
2. Ernakulam 14.3 8.5
3. Idukki 13.6 5.9
4. Kannur 20.1 6.5
5. Kasaragod 17.0 5.2
6. Kollam 13.4 7.1
7. Kottayam 14.0 8.9
8. Kozhikode 18.8 7.7
9. Malappuram 22.4 4.5
10. Palakkad 14.6 6.0
11. Pathanamthitta 14.5 9.2
11. Thiruvananthapuram 15.6 8.6
13. Thrissur 14.9 7.8
14. Wayanad 17.9 5.1
Madhya Pradesh 23.2 4.9
1. Ashoknagar 25.5 3.0
108

1 2 3 4
Table-11: District-wise birth and death rates, 2012
Sl. No.State/ Union Territory/
DistrictCBR CDR
2. Anooppur 12.2 2.2
3. Alirajpuir 26.1 3.4
4. Balaghat 72.6 10.3
5. Barwani 28.0 4.9
6. Betul 16.1 3.4
7. Bhind 18.9 5.9
8. Bhopal 31.2 5.1
9. Burhanpur 21.8 3.8
10. Chhatarpur 27.6 5.0
11. Chhindwara 20.4 6.9
12. Damoh 33.7 6.3
13. Datia 17.0 4.2
14. Dewas 22.5 4.7
15. Dhar 17.9 2.4
16. Dindori 16.6 3.3
17. Guna 22.5 3.2
18. Gwalior 25.8 8.0
19. Harda 15.0 3.0
20. Hoshangabad 16.7 3.8
21. Indore 21.4 7.8
22. Jabalpur 27.7 7.4
23. Jhabua 26.5 3.9
24. Katni 30.4 5.8
25. Khandwa (East Nimar) 18.1 3.6
26. Khargone (West Nimar) 18.1 3.3
27. Mandla 12.5 4.2
28. Mandsaur 17.7 2.6
29. Morena 22.8 4.6
30. Narsimhapur 22.9 5.8
31. Neemuch 15.4 2.6
32. Panna 22.3 3.6
33. Raisen 22.9 5.5
34. Rajgarh 18.2 2.7
35. Ratlam 20.3 3.9
36. Rewa 18.6 3.1
37. Sagar 26.2 6.1
38. Satna 19.8 6.4
39. Sehore 21.9 5.8
40. Seoni 16.8 3.0
41. Shahdol 26.4 6.9
42. Shajapur 19.7 3.6
43. Sheopur 21.0 3.4
44. Shivpuri 18.7 5.1
45. Sidhi 23.7 2.7
46. Singroli 9.0 1.3
47. Tikamgarh 18.2 1.8
48. Ujjain 23.1 5.4
49. Umaria 23.5 5.9
50. Vidisha 26.5 5.9
Maharashtra 17.1 5.7
1. Ahmadnagar 20.7 5.6
2. Akola 16.8 6.4
3. Amravati 16.6 6.6
109

1 2 3 4
Table-11: District-wise birth and death rates, 2012
Sl. No.State/ Union Territory/
DistrictCBR CDR
4. Aurangabad 20.7 3.9
5. Bhandara 17.9 7.6
6. Beed 22.8 4.7
7. Buldana 20.9 5.7
8. Chandrapur 16.8 7.2
9. Dhule 17.0 4.7
10. Gadchiroli 15.3 5.8
11. Gondia 15.5 7.1
12. Hingoli 18.7 3.7
13. Jalgaon 20.5 5.7
14. Jalna 15.3 3.3
15. Kolhapur 15.4 6.5
16. Latur 21.7 4.1
17. Mumbai 14.2 7.1
18. Nagpur 12.6 7.7
19. Nanded 18.1 4.2
20. Nandurbar 21.3 6.5
21. Nashik 18.9 4.9
22. Osmanabad 18.1 4.6
23. Parbhani 18.4 3.9
24. Pune 15.1 5.1
25. Raigarh 14.7 5.2
26. Ratnagiri 13.7 8.0
27. Sangli 17.9 7.4
28. Satara 16.7 6.8
29. Sindhudurg 13.3 8.8
30. Solapur 22.5 6.6
31. Thane 14.8 4.5
32. Wardha 12.7 7.3
33. Washim 15.1 3.8
34. Yavatmal 20.0 5.3
Meghalaya 38.3 5.4
1. East Garo Hills 34.1 4.5
2. East Khasi Hills 30.0 4.9
3. Jaintia Hills 28.6 4.7
4. Ri Bhoi 31.6 3.6
5. South Garo Hills 24.2 5.3
6. West Garo Hills 40.6 6.3
7. West Khasi Hills 23.2 0.0
Mizoram 25.5 6.4
1. Aizawl 21.6 6.5
2. Champhai 24.1 6.2
3. Chhimtuipui (Saiha) 24.3 7.4
4. Kolasib 26.6 5.6
5. Lawngtlai 27.5 4.7
6. Lunglei 22.4 5.7
7. Mamit 30.1 4.4
8. Serchhip 20.3 5.6
Nagaland 20.0 3.1
1. Dimapur 10.4 1.7
2. Kohima 14.5 1.9
110

1 2 3 4
Table-11: District-wise birth and death rates, 2012
Sl. No.State/ Union Territory/
DistrictCBR CDR
3. Mokokchung 17.9 2.9
4. Mon 11.3 1.5
5. Phek 11.5 2.5
6. Tuensang 12.2 2.0
7. Wokha 13.6 2.6
8. Zunheboto 13.9 2.2
9. Peren 14.1 1.7
10. Longleng 27.3 2.8
11. Kiphire 14.8 1.9
Punjab 17.0 6.9
1. Amritsar 16.1 8.5
2. Bathinda 16.7 6.2
3. Barnala 14.8 6.4
4. Faridkot 19.2 8.4
5. Fatehgarh Sahib 12.6 5.6
6. Firozpur 14.8 4.0
7. Gurdaspur 17.2 6.3
8. Hoshiarpur 15.4 7.4
9. Jalandhar 19.5 8.8
10. Kapurthala 15.5 5.9
11. Ludhiana 21.9 7.5
12. Mansa 15.5 6.3
13. Mohali 10.7 5.9
14. Moga 14.7 7.0
15. Muktsar 16.0 5.9
16. Nawanshahr 18.4 8.6
17. Patiala 16.9 7.0
18. Ropar (Rup Nagar) 19.4 6.7
19. Sangrur 14.6 6.6
20. Tarn Taran 21.2 7.0
Rajasthan 25.4 5.2
1. Ajmer 27.3 8.1
2. Alwar 22.2 4.8
3. Banswara 23.1 2.6
4. Baran 23.8 3.9
5. Barmer 21.4 3.3
6. Bharatpur 24.4 4.2
7. Bhilwara 26.4 6.6
8. Bikaner 25.6 5.3
9. Bundi 21.9 5.3
10. Chittaurgarh 22.3 6.5
11. Churu 26.9 4.9
12. Dausa 23.0 3.5
13. Dhaulpur 22.2 4.1
14. Dungarpur 22.2 3.2
15. Ganganagar 22.8 5.2
16. Hanumangarh 23.7 5.7
17. Jaipur 27.3 5.6
18. Jaisalmer 29.8 3.3
19. Jalor 22.0 3.6
20. Jhalawar 23.0 5.1
21. Jhunjhunun 22.8 5.1
111

1 2 3 4
Table-11: District-wise birth and death rates, 2012
Sl. No.State/ Union Territory/
DistrictCBR CDR
22. Jodhpur 28.9 5.3
23. Karauli 23.0 4.1
24. Kota 28.1 6.8
25. Nagaur 23.4 4.4
26. Pali 29.8 5.5
27. Partapgarh 26.8 4.3
28. Rajsamand 22.3 6.9
29. Sawai Madhopur 27.7 4.3
30. Sikar 27.2 5.5
31. Sirohi 28.9 5.2
32. Tonk 24.4 5.6
33. Udaipur 24.3 5.7
Sikkim 13.8 5.6
1. East 17.1 6.2
2. North 8.9 5.2
3. South 12.5 5.2
4. West 10.7 5.4
Tamil Nadu 17.7 7.3
1. Krishnagiri 16.5 3.4
2. Chennai 18.1 8.8
3. Coimbatore 16.0 11.3
4. Cuddalore 15.2 5.1
5. Dharmapuri 17.2 5.4
6. Dindigul 15.7 7.5
7. Erode 15.3 7.5
8. Kancheepuram 9.5 4.7
9. Kanyakumari 18.9 7.2
10. Karur 13.0 8.9
11. Madurai 18.9 8.6
12. Nagapattinam 22.0 6.7
13. Namakkal 13.6 7.7
14. Perambalur 20.5 7.6
15. Pudukkottai 17.5 5.6
16. Ramanathapuram 19.6 5.3
17. Salem 17.7 5.8
18. Sivaganga 14.5 5.5
19. Thanjavur 21.8 6.8
20. The Nilgiris 13.0 6.5
21. Theni 17.1 7.6
22. Thiruvallur 9.8 4.8
23. Thiruvarur 14.0 6.2
24. Tiruchirappalli 15.4 8.1
25. Tirunelveli 23.2 6.1
26. Tiruvanamalai 13.2 4.9
27. Thoothukudi 14.6 7.5
28. Vellore 18.6 6.6
29. Viluppuram 15.5 5.7
30. Virudhunagar 20.9 6.3
31. Tiruppur 8.1 5.2
Tripura 12.6 2.6
1. Dhalai 8.0 1.6
112

1 2 3 4
Table-11: District-wise birth and death rates, 2012
Sl. No.State/ Union Territory/
DistrictCBR CDR
2. Gomati 11.9 1.6
3. Khowai 10.7 1.0
4. North Tripura 8.8 1.5
5. Shipahijala 10.1 0.3
6. South Tripura 17.2 0.6
7. Unokuti 7.9 2.7
8. West Tripura 26.7 7.7
West Bengal 16.9 4.6
1. Bankura 19.4 4.1
2. Barddhaman 9.5 4.6
3. Birbhum 15.8 3.4
4. Dakshin Dinajpur 13.8 3.2
5. Darjiling 22.1 8.1
6. Haora 10.3 3.3
7. Hugli 13.8 4.8
8. Jalpaiguri 13.9 5.7
9. Koch Bihar 19.1 3.5
10. Kolkata 28.0 12.4
11. Malda 28.3 5.7
12. P.S Medinipur 17.3 4.1
13. P.U Medinipur 18.9 6.4
14. Murshidabad 23.9 4.1
15. Nadia 16.0 5.4
16. North 24 Parganas 19.0 6.5
17. Puruliya 13.0 1.8
18. South 24 Parganas 16.5 2.9
19. Uttar Dinajpur 23.0 2.9
113

ANNEXURE- A

- 116 -
Civil Registration hierarchy in States and Union Territories
Sl.
No
State level District level / Below
district level
Local area level (rural)
1 2 3 4 5
1. Andhra Pradesh
Chief Registrar
Director of Health
Addl. Chief Registrar
Addl. Director of
Medical & Health Services
(CD)
Commissioner & Director
Municipal Administration
Dy. Commissioner
Panchayat Raj
Dy. Chief Registrar: Dy.
Director of Medical &
Health Services (Stat.)
District Registrar: District
Medical and Health Officer
Addl. Distt. Registrar: Dy.
Distt. Medical & Health Officer
in-charge of Medical & Health
Work other than Family
Welfare
District Revenue Officer &
Diistrict Panchayat Officer
Addl. Distt. Medical & Health
Officer (FW)
Registrar: Panchayat Secretary
2. Arunachal Pradesh
Chief Registrar
Director of
Economics &
Statistics
District Registrar: Dy.
Commissioner
Addl. Distt. Registrar:
District Statistical Officer
Registrar: Extra-Assistant
Commissioner/Circle Officer
Sub-Registrar: Teacher/Village
level worker
3. Assam
Chief Registrar
Director of Health
Services
Addl. Chief Registrar
Director, Rural
Development
Director Municipal
Administration
District Registrar:
Distt. Magistrates
Addl. Distt. Registrar:
Joint Director of Health
Services
CEO of Zila Parishads
Registrar: Medical Officer
Incharge of CHC / PHC / MPHC/
SHC / State Dispensary, etc.
4. Chhatisgarh
Chief Registrar
Commissioner-cum-
Director of
Economics &
Statistics
Addl. Chief Registrar:
District Collectors
Dy.Chief Registrar:
Dy.Director (VS)
Economics & Statistics
District Registrar:
District Planning & Statistics
Officer
Registrar:
Chief Executive Officer, Janpad
Panchayat
Sub Registrar :
Panchayat Secretary / Karmi
5. Bihar
Chief Registrar
Director of Statistics
& Evaluation
Joint Chief Registrar:
Joint Director (VS)
Dy. Chief Registrar:
Dy. Director (VS)
District Registrar:
District Magistrate
Addl. Distt. Registrar:
Distt. Statistical Officer
Addl. Distt. Registrar: Block
Development Officer
Registrar: Panchayat Sevak
MO Incharge of /Civil and District
Hospitals
Sub -Registrar
Aaganwadi Sewika
6.
Goa
Chief Registrar
Director of Planning,
Statistics &
Evaluation
Addl.Chief Registrar:
Joint Director, Planning,
Statistics & Evaluation
District Registrar: Additional
Collector
Addl. Distt. Registrar: Block
Development Officer
Registrar: Secretary of Village
Panchayat

- 117 -
Civil Registration hierarchy in states and union territories
Sl.
No
State Level District level / Below District
Level
Local Area Level (Rural)
1 2 3 4 5
7. Gujarat
Chief Registrar
Commissioner of
Health, Medical
Services & Medical
Education
Dy. Chief Registrar:
Addl. Director (Stats.)
Addl.Dy.Chief Registrar:
Dy. Director (Stats.)
District Registrar:
District Health Officer/Chief
District Health Officer
Taluka Registrar: Taluka
Development Officer
Registrar:
Talati-cum-Mantri/Mantri
Sub-Registrar: Clerk of
Village Panchayat
8. Haryana
Chief Registrar
Director General of
Health Services
Addl.Chief Registrar:
Dy. Director Health Services
(ME)
Asstt. Director, Urban
Development Deptt.
District Registrar: Civil
Surgeon
Addl.Distt.Registrar:
Distt. Health Officer
Registrar:
Incharge Medical Officer
P.H.C
9. Himachal Pradesh
Chief Registrar
Director of Health
Services
Dy. Chief Registrar:
Dy. Director (CR)
District Registrar:
Chief Medical Officer
Specified Officer
Block Development Officer
Registrar: Panchayat
Secretary and Panchayat
Sahayak of Gram Panchayat
10. Jammu & Kashmir
Chief Registrar
Director of Health
and Family Welfare
Addl. Chief Registrar:
Director of Economics &
Statistics
District Registrar: Chief
Medical Officer
Addl. Distt. Registrar: Distt.
Statistics & Evaluation Officer
Registrar:
In-charge of Police Station
11.
Jharkhand
Chief Registrar
Principal Secretary,
Statistics &
Evaluation
Joint Chief Registrar: Joint
Director (VS)
Dy. Chief Registrar:
Dy. Director (VS)
District Registrar:
Dy. Commissioner / Collector
Addl. Distt. Registrar:
Distt. Statistical Officer
Addl. Distt. Registrar: Block
Development Officer
Registrar: Panchayat Sevak
Mo In-charge of Referral
Hospitals, Medical Supd. Of
Sadar Hospitals/Sub-
divisional hospitals
12.
Karnataka
Chief Registrar
Director, Bureau of
Economics &
Statistics
Joint Chief Registrar: Joint
Director, Economics &
Statistics
Dy. Chief Registrar:
Dy. Director Economics &
Statistics
District Registrar: Dy.
Commissioner
Addl.Distt.Registrar: District
Statistical Officer
Registrar:
Village Accountant

- 118 -
Civil Registration hierarchy in states and union territories
Sl.
No
State Level District Level /Below District
Level
Local Area Level (Rural)
1 2 3 4 5
13. Kerala
Chief Registrar
Director of
Panchayats
Dy. Chief Registrar:
Dy. Director of
Panchayats
Addl. Chief Registrar:
Addl. Director of
Economics & Statistics
Dy. Chief Registrar:
Dy. Director of Economics
& Statistics
District Registrar: Deputy.
Director of Panchayats
Addl. Distt. Registrar: Deputy
Director of District Statistical
Office
Registrar:
Secretary of Gram Panchayat
14. Madhya Pradesh
Chief Registrar
Commissioner,
Economics &
Statistics
Dy. Chief Registrar:
Dy. Director (VS)
Asstt. Chief Registrar:
Assistant Director (VS)
Addl. Chief Registrar
District Collectors
District Registrar:
District Planning Officer
Registrar:
Chief Executive Officer,
Janpad Panchayat
MO Incharge of
PHC/CHC/Civil and District
Hospitals
Sub Registrar
Panchayat Secretary / Karmi
15. Maharashtra
Chief Registrar
Director Health
Services
Dy. Chief Registrar: Dy.
Director of Health Services
(SBHI & VS)
District Registrar: District
Health Officer
Addl. Distt. Registrar:
Dy. Chief Executive Officer
(Village Panchayat) of Zila
Panchayat
BDO (Panchayat Samiti)
Registrar: Gram
Sevak/Asstt. Gram Sevak
16. Manipur
Chief Registrar
Director of Medical &
Health Services
Addl. Chief Registrar:
Director Economics &
Statistics
Addl. Director Health
Services
Dy. Chief Registrar:
Dy. Director (VS)
District Registrar: Chief
Medical Officer
Registrar:
Block Development Officer
for CD Block areas
Sub Divisional
Officers/Medical Officer in-
charge of PHCs of hilly areas
Sub-Registrar:
Panchayat Secretary CD
Block areas
17. Meghalaya
Chief Registrar
Director of Health
Services
Dy. Chief Registrar: Joint
Director of Health Services
District Registrar:
Distt. Medical & Health officer
Registrar:
Medical and Health Officer
in-charge of PHC
18.
Mizoram
Chief Registrar
Principal Secretary
Planning &
Programme
Implementation
Addl. Chief Registrar:
Director of Economics &
Statistics
Dy. Chief Registrar:
Research Officer
Economics & Statistics
District Registrar:
Deputy Commissioner
Addl. Distt. Registrar: District
Education Officer
Asstt. Distt. Registrar:
District Research Officer
Economics & Statistics
Registrar:
Primary School Teacher

- 119 -
Civil Registration hierarchy in states and union territories
Sl.
No
State Level District Level / Below District
Level
Local Area Level (Rural)
1 2 3 4 5
19. Nagaland
Chief Registrar
Development
Commissioner
Joint Chief Registrar:
Director of Economics &
Statistics
Dy. Chief Registrar
Dy. Director Economics
Statistics
District Registrar:
Dy. Commissioner
District Statistical Officer
Circle Registrar:
Block Development Officer
Registrar:
Head Teacher
Govt. Primary School
20. Orissa
Chief Registrar
Director of Health
Services
Addl. Chief Registrar:
Joint Director of Health
Services (Public Health)
Dy. Chief Registrar:
Dy. Director (VS)
Asstt. Chief Registrar:
Asstt. Director (VS)
District Registrar:
Chief District Medical Officer
Addl. Distt. Registrar:
Addl. District Medical Officer
Registrar:
Medical Officer in-charge of
PHC
21. Punjab
Chief Registrar
Director of Health &
Family Welfare
Dy. Chief Registrar:
Sr. Research Officer
District Registrar:
Civil Surgeon
Addl. Distt. Registrar: District
Health Officer
Assistant Civil Surgeon
Registrar:
Multi purpose Health
Workers (Female) Sub-
Center, ANM’s
Sub-Registrar
MO, District Hospitals/Sub
Divisional Hospitals/
Community Centers/PHC
22. Rajasthan
Chief Registrar
Director of
Economics &
Statistics
Addl. Chief Registrar:
District Collectors
Dy. Chief Registrar:
Dy. Director (VS)
CEO of Zila Prishand
District Registrar:
District Statistical Officer
Addl. Distt. Registrar:
Development Officer of
Panchayat Samiti
Registrar:
Gram Sevak
Group Sachiv
Head Master of Primary,
Middle School
23. Sikkim
Chief Registrar
Principal Director of
Health & Family
Welfare
Joint Chief Registrar:
Director, Bureau of
Economics & Statistics
District Registrar:
Chief Medical Officer
Registrar:
Medical Officer in-charge of
PHC
24.
Tamil Nadu
Chief Registrar
Director of Public
Health & Preventive
Medicine
Dy. Chief Registrar:
Jt. Director, SBHI
District Registrar:
Collector/District Revenue
Officer/Additional Collector
Addl. Distt. Registrar: Dy.
Director Health Services
Health Officer Corporation
Registrar:
Village Administrative
Officer

- 120 -
Civil Registration hierarchy in states and union territories
Sl.
No
State Level District Level / Below District
Level
Local Area Level (Rural)
1 3 4 5 6
25. Tripura
Chief Registrar
Director of Health
Services
District Registrar:
District. Magistrate/Collector
Addl. Distt. Registrar:
Sub-Zonal Officers (under
Tripura Tribal Area
Autonomous District Council
(TTAADC) rural area)
Block Development Officer (in
Non TTAADC rural area)
Registrar:
Rural Programme Secretaries/
Village Secretaries
(in TTAADC rural area) from 01-
01-2012)
Panchayat Secretary (in Non
TTAADC rural area)
26. Uttar Pradesh
Chief Registrar
Director General
Medical & Health
Director Local
Administration (Urban
area)
Director Panchayat Raj
(Rural area)
Dy. Chief Registrar:
Assistant Director /
Statistical Officer, Medical
and Health
District Registrar:
District Collector
Addl. Distt. Registrar:
Chief Medical Officer
Dy. Distt. Registrar
Dy. Chief Medical Officer
(urban area)
Addl. Distt. Registrar
District Panchayat Raj Officer
(Rural area)
Registrar:
Gram Panchayat Vikas Adhikari
ANM’s for Sub Center
M.O In-charge of PHC/CHC
Medical Superintendent of
Government Hospitals.
27. Uttarakhand
Chief Registrar
Principal Secretary/
Secretary, Medical,
Health and Family
Welfare
Addl. Chief Registrar:
Director General of Medical,
Health and Family Welfare
Director Local
Administration (Urban
area)
Director Panchayat Raj
(Rural area)
Dy. Chief Registrar:
Addl. Director,
Medical, Health and Family
Welfare
District Registrar:
District Collector
Addl. Distt. Registrar:
Chief Medical Officer
Addl. Distt. Registrar
Dy. Chief Medical Officer
(urban area)
Addl. Distt. Registrar
District Panchayat Raj Officer
(Rural area)
Registrar:
Gram Vikas Adhikari
Sub Registrar:
Chief medical Superintendent./
Medical Superintendent. Of
District Hospitals/ Base
Hospitals and Ladies Hospitals
( wef. 08-11-2011)
28. West Bengal
Chief Registrar
Director of Health
Services
Dy. Chief Registrar:
Director (SBHI)
Asstt. Chief Registrar:
Asstt. Director Health
Services (VS)
District Registrar: District
Magistrate/Dy. Commissioner
Addl. Distt. Registrar:
CMO of Health
Addl. District Magistrate.
(Gen.Admn.)
Dy. CMOH – II
Registrar:
Block Sanitary Inspector
Sub Registrar:
Pradhan, Gram Panchayat

- 121 -
Civil Registration hierarchy in states and union territories
Sl.
No
State Level District Level / Below District
Level
Local Area Level (Rural)
1 3 4 5 6
Union territories
1. A&N Islands
Chief Registrar
Director
Health Services
District Registrar:
Medical Supdt. of G.B. Pant
Hospital for Andaman and M.O.
in-charge of Nicobar for
Nicobar District
Registrar:
Medical Officer-in-Charge
of Community Health
Centres and Primary Health
Centre
2. Chandigarh
Chief Registrar
Director of Health
Services
District Registrar:
Medical Officer of Health
Addl. Distt. Registrar:
Nosologist
Registrar:
Thana Officer
3.
Dadra & Nagar
Haveli
Chief Registrar
Secretary to
Administration
District Registrar: Mamlatdar-
cum-Survey & Settlement
Officer
Registrar:
Patel, Talati
4. Daman & Diu
Chief Registrar
Development
Commissioner /
Secretary Planning
Addl. Chief Registrar: Dy.
Director, Planning &
Statistics
District Registrar: Collector
Addl. Distt. Registrar:
Block Development Officer
Registrar:
Panchayat Secretary
5. Delhi
Chief Registrar:
Director Bureau of
Economics &
Statistics
Addl. Chief Registrar:
Municipal H.O. of MCD
Municipal H.O. of NDMC
Executive Officer
Cantonment Area
District Registrar:
Asstt. Director (VS)
Dte. Of Economics & Statistics
Registrar:
Municipal Health Officer
Officer Incharge (Vital Stat.)
Dy. Health Officer
6. Lakshadweep
Chief Registrar
Secretary
Health
Addl. Chief Registrar
Director of Medical &
Health Services
Addl. District Registrar:
Medical Officer in-Charge
Registrar:
Health Inspector
7. Puducherry
Chief Registrar
Director of Local
Administration
District Registrar:
Dy. Director (Municipal
Administration/Local Admn.)
Addl. Distt. Registrar:
Dy. Director (Statistics)
Local Admn. Deptt
Registrar:
Commissioner of Commune
Panchayat
� In urban areas, the Health Officer of Municipal Corporation / Municipalities etc.
or in absence of such a post the Executive Officer of the town administration
functions as the Registrar of Births and Deaths.

OFFICERS AND STAFFS ASSOCIATED WITH THIS REPORT
DEEPAK RASTOGI
Addl. Registrar General
P.A. MINI
R.K. GAUTAM
Deputy Registrar Generals
AJAY KHANNA
Deputy Director
SANDEEP RAI
Assistant Director
R. D. SHARMA
U. C. NIGAM
TARUNA RANI DHAWAN
S. I. Gr. I
VIMAL KAUL
Senior Compiler
SITA AMUKTHA
SUJATA SHARMA
Consultants