vizicities - lessons learnt visualising real-world cities in 3d
TRANSCRIPT

Lessons learnt visualising real-world cities In 3D
Hi, I’m Robin. I’m the creator of ViziCities.
Over the next half an hour I’m going to give you a run-down on what ViziCities actually is and an overview of some of the key lessons I’ve learnt while building it.
Comments and questions
@robhawkes
If you have any burning questions or comments during the talk, please direct them to my Twitter account – @robhawkes
Otherwise, we’ll hopefully have a short Q&A at the end and I’ll be around today and tomorrow too so feel free to grab me here or on Slack.

As a little background, my history is in programming and graphic design and combining the the two to solve interesting problems.
I’ve previously worked at both Mozilla and Pusher as developer relations, travelling all over the world speaking about exciting new Web technologies.
Today, my days are spent running ViziCities as a business, as well as doing consultancy work on geospatial data-visualisation projects.
I do happen to find some spare time I like to relax with nerdy games like World of Tanks and Hearthstone.
However, you’re not here to hear about all that…
So taking a step back…
Cities require things on a vast scale; like food distribution systems, reliable energy, transport networks, health and civil protection, water systems, waste systems, and all sorts of other things.
All of these parts work independently and if one of them failed then the whole system could collapse.

Cities are chaotic, complex and awesome
In short, cities are chaotic, complex and awe-inspiring. They shouldn't work but they do.
You can’t fully control them, which makes it even more important to be able to understand them. Not only so we can make them work more efficiently, but also so we can better comprehend their complexity as citizens.
There is a huge amount of powerful data locked away within cities. It's tucked away in places like Data.gov.uk as well as a large number of other open and closed repositories.
What if you could create a tool that allowed people to see real world cities and then overlay data onto them? A tool to help them unlock some of this data and combine it to better understand cities and their place within them.

It turned out a tool like this already exists – the game SimCity!
In SimCity you create your own, fictional city from scratch and manage every aspect of it.
It gives you a data view that allows you to peel back your city to get a better idea of how it's working and, more importantly, why it's not working so you can fix it.
It's just a shame SimCity is only for fictional cities.
ViziCities aim is to do the same for real-world cities, keeping a SimCity-like balance between beautiful, practical data visualisation and a great user experience.
The ViziCities 3D platform takes data like this, for example raw OpenStreetMap data…

…and uses it to generate and visualise real-world cities in the browser in 3D.
But you can do more!
ViziCities was the first in the world to publicly visualise the London Underground network in 3D.
Actually, not only visualising it in 3D but also visualising live trains on the tracks in the positions they're in right now.
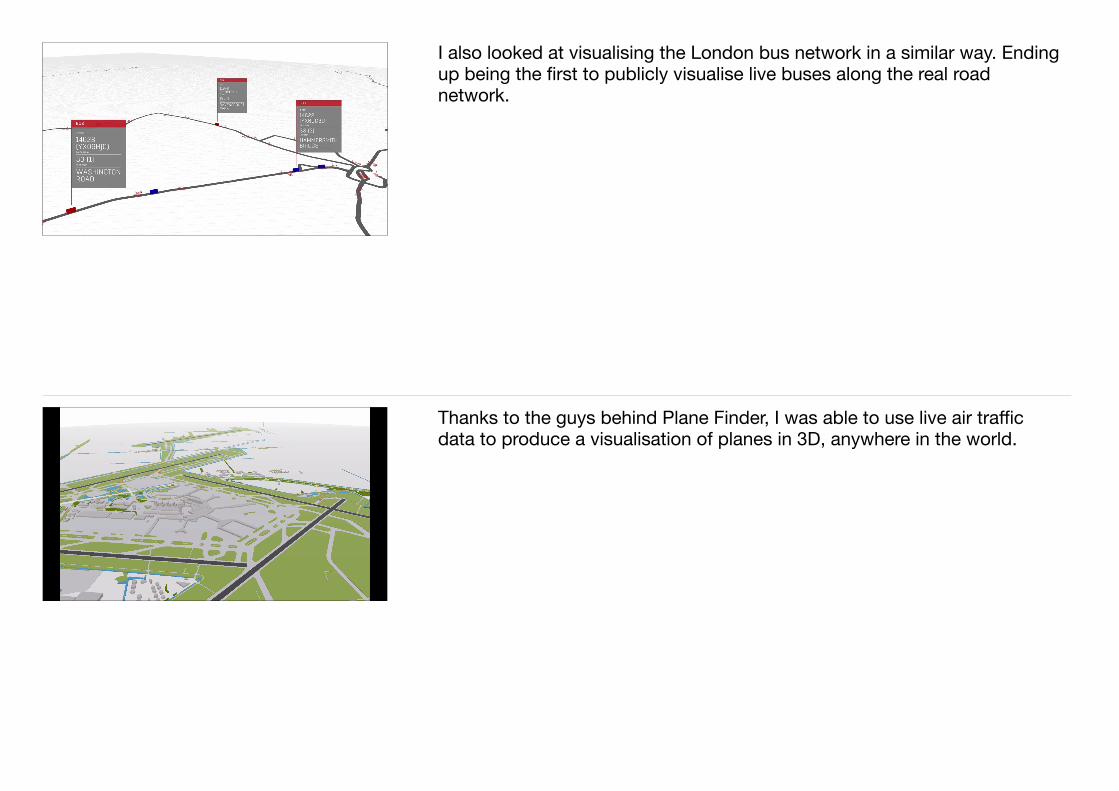
I also looked at visualising the London bus network in a similar way. Ending up being the first to publicly visualise live buses along the real road network.
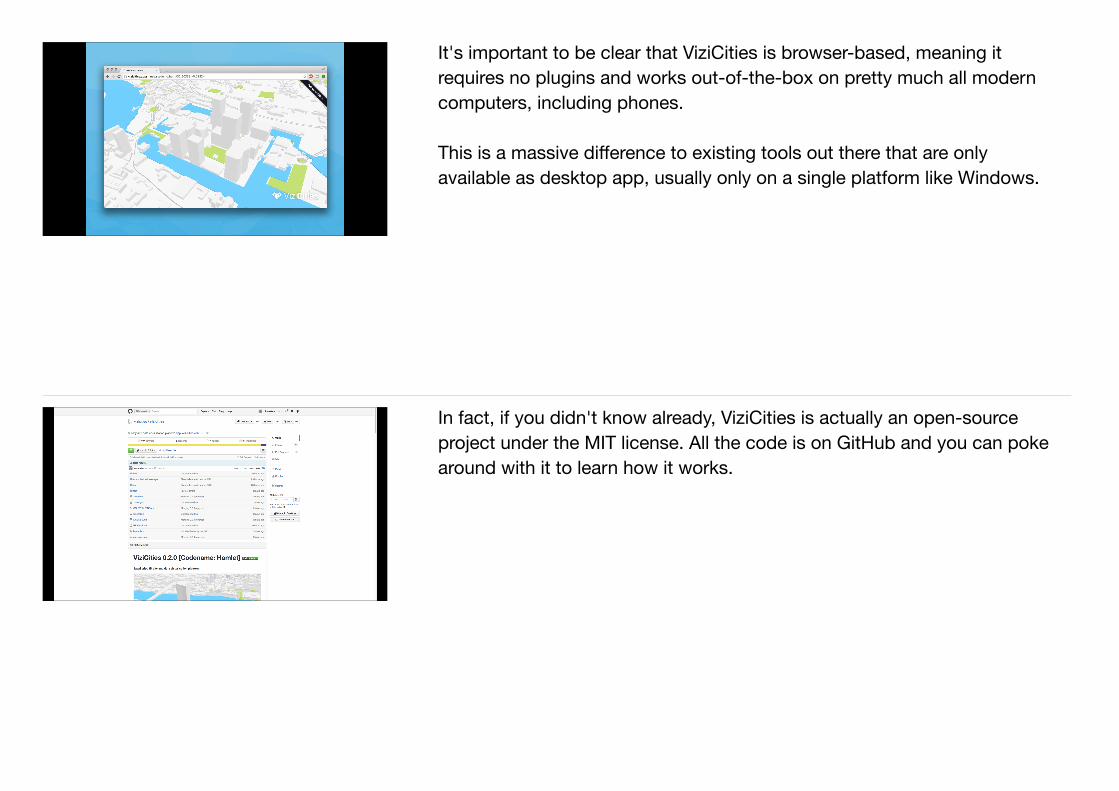
Thanks to the guys behind Plane Finder, I was able to use live air traffic data to produce a visualisation of planes in 3D, anywhere in the world.

You can also do things like using LIDAR height data to produce a 3D terrain map.
For example, you could overlay water levels and allow people to see how much of an area would be flooded should the levels rise 10cm, 2 metres, or 5 metres.
I’ve also looked at heatmaps and other more traditional visualisation techniques to better understand crime or noise pollution in an area.
Or even use it to compare data points like education levels and crime.
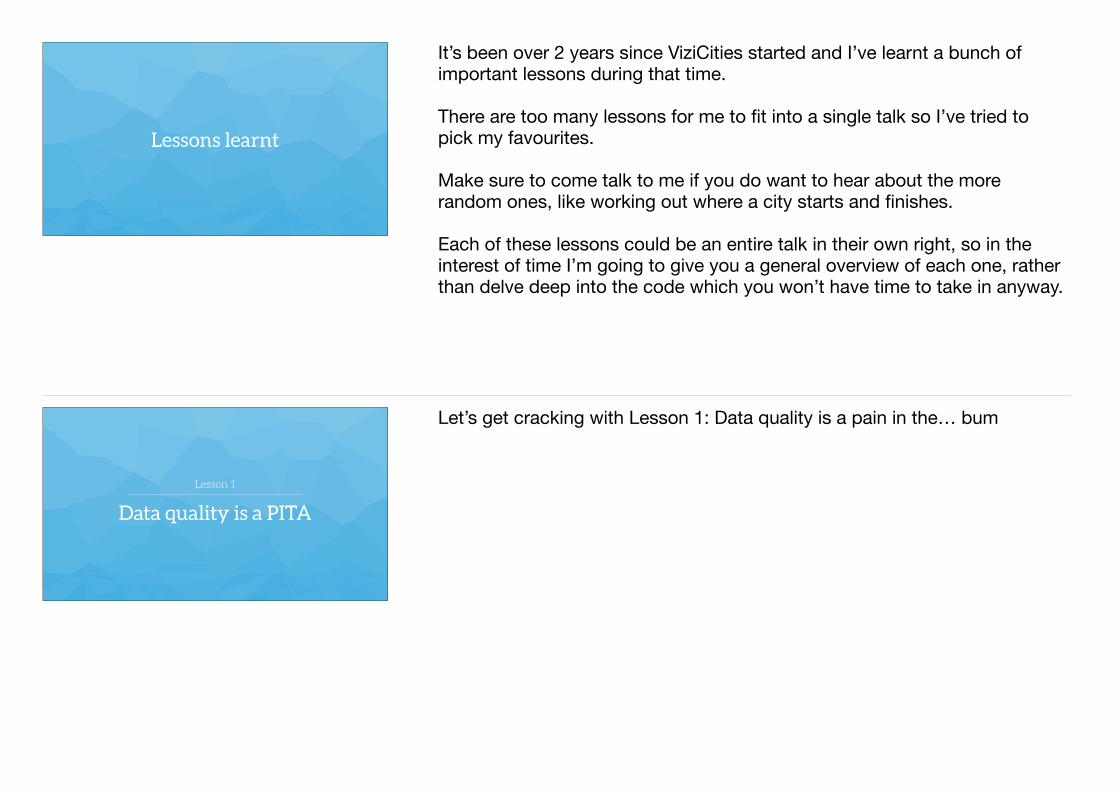
It's important to be clear that ViziCities is browser-based, meaning it requires no plugins and works out-of-the-box on pretty much all modern computers, including phones.
This is a massive difference to existing tools out there that are only available as desktop app, usually only on a single platform like Windows.
In fact, if you didn't know already, ViziCities is actually an open-source project under the MIT license. All the code is on GitHub and you can poke around with it to learn how it works.
Lessons learnt
It’s been over 2 years since ViziCities started and I’ve learnt a bunch of important lessons during that time.
There are too many lessons for me to fit into a single talk so I’ve tried to pick my favourites.
Make sure to come talk to me if you do want to hear about the more random ones, like working out where a city starts and finishes.
Each of these lessons could be an entire talk in their own right, so in the interest of time I’m going to give you a general overview of each one, rather than delve deep into the code which you won’t have time to take in anyway.
Data quality is a PITA
Lesson 1
Let’s get cracking with Lesson 1: Data quality is a pain in the… bum

Buildings were the first challenge regarding data quality.
In fact, they’re still a challenge today.
Ordnance Survey
• Free• Simplified – inaccurate• Can slice up buildings into multiple pieces• No heights (for free)• Good performance due to low detail
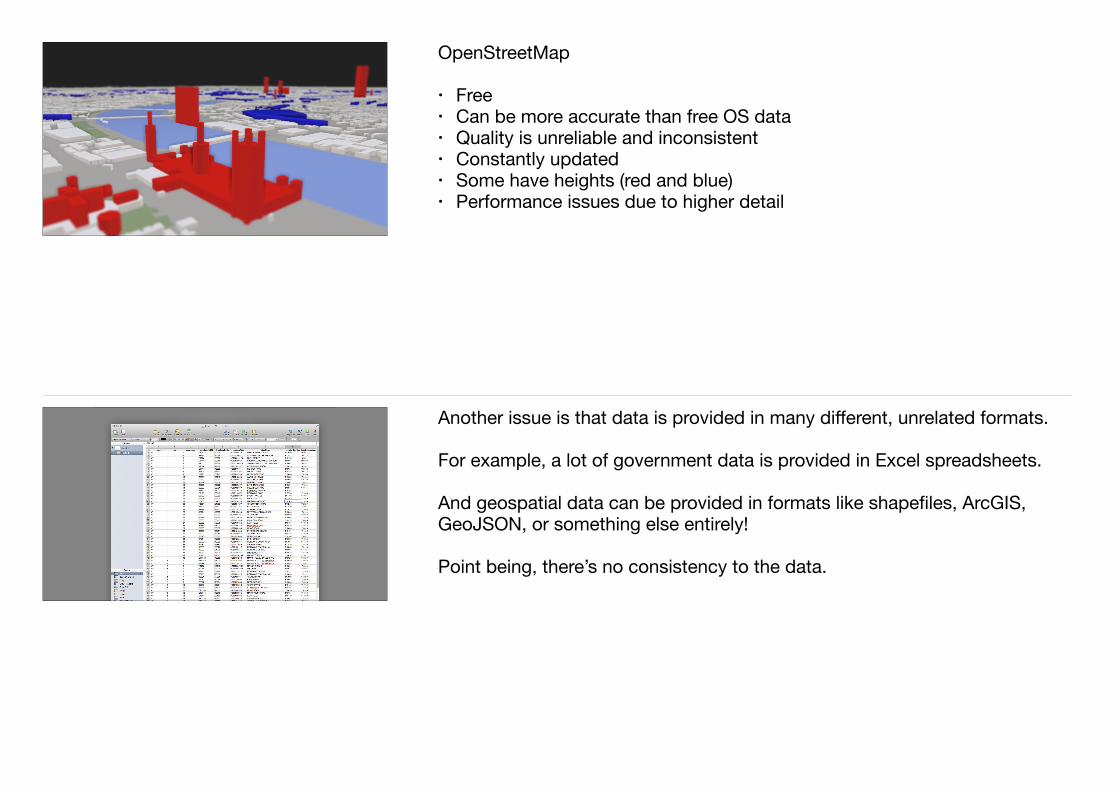
OpenStreetMap
• Free• Can be more accurate than free OS data• Quality is unreliable and inconsistent• Constantly updated• Some have heights (red and blue)• Performance issues due to higher detail
Another issue is that data is provided in many different, unrelated formats.
For example, a lot of government data is provided in Excel spreadsheets.
And geospatial data can be provided in formats like shapefiles, ArcGIS, GeoJSON, or something else entirely!
Point being, there’s no consistency to the data.

And combining all this data can be a long and arduous process.
When making the live 3D underground demo I had to deal with a bunch of problems…
• All the data I needed was hidden away• The data was provided in different formats• I had to manually merge data because identification conventions were
different or unreliable – literally spending many evenings hand-converting and combing Excel spreadsheets into a useable format for the Web
• The TfL API for train data is unreliable, slightly broken, and in XML – verbose, complex, and generally not good for real-time data
Combined, this made what should have been a relatively simple task quickly turn into many weeks of unnecessary hair-pulling.
Cities are huge
Lesson 2
Lesson 2: Cities are huge
It turns out cities are far bigger than I expected…
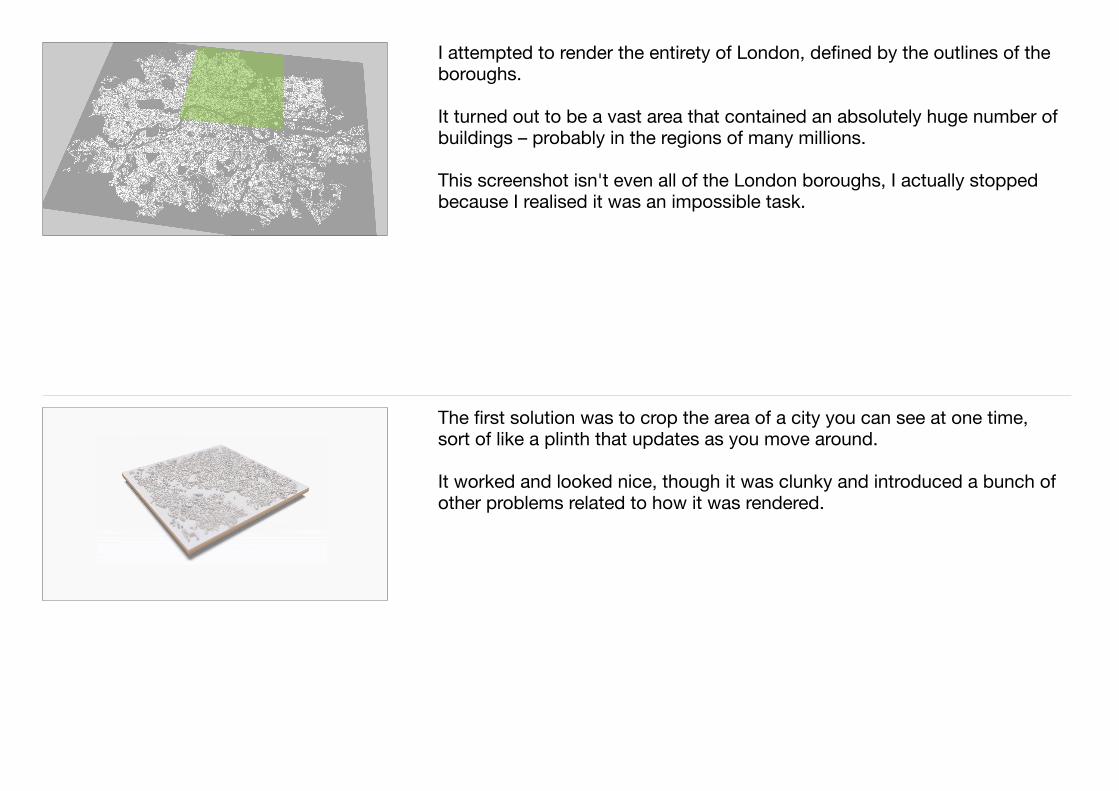
I attempted to render the entirety of London, defined by the outlines of the boroughs.
It turned out to be a vast area that contained an absolutely huge number of buildings – probably in the regions of many millions.
This screenshot isn't even all of the London boroughs, I actually stopped because I realised it was an impossible task.
The first solution was to crop the area of a city you can see at one time, sort of like a plinth that updates as you move around.
It worked and looked nice, though it was clunky and introduced a bunch of other problems related to how it was rendered.

The second solution was to implement a method of scrolling around just like you do on a Google Map.
This was the method I settled on at the end and although not as visually impressive, it solved all the problems and meant I could have a rough idea of how many buildings could possibly be rendered at any time.
Use third-party data APIs where possible
Lesson 3
Lesson 3: Use third-party data APIs where possible
Whilst using OpenStreetMap is great, the data for the entire planet tops 300GB so it's not ideal for hosting and serving yourself.
So is it possible to get this kind of data dynamically without hosting it yourself?

The original solution came in the shape of the Overpass API, an external JSON and XML endpoint to OpenStreetMap data.
Overpass allows you to send a request for specific OpenStreetMap tags within a bounding box (in our case, a map tile) and get back a lovely JSON response.
The by-product of this was that you get worldwide support out of the box and benefit from minutely OpenStreetMap updates.
Seriously, if you edit or add something to OpenStreetMap (please do) it can show up in ViziCities within minutes.
A sub-lesson I learnt was that spamming the Overpass API endpoint with a tonne of XHR requests at the same time wasn’t particularly good for ViziCities nor for Overpass.
It generally caused delays as Overpass rate-limits request to one per second per user – so data took a long time to make its way back to the browser.
The great thing was that by already using promises to manage the XHR requests I was half-way ready to solve the problem.
The final piece of the puzzle is to use throat.js to limit the number of concurrent XHR requests so you can take control and load resources without abusing external APIs. It’s beautifully simple and worked perfectly. No more loading delays!

Since then, I’ve moved onto more robust APIs for OpenStreetMap data such as the Mapzen Vector Tile Service.
If you need something to store and serve your own custom data then you should definitely look into services like CartoDB and Mapbox.

Accurate height data is rarer than rocking-horse poo
Lesson 4
Lesson 4: Accurate height data is rarer than rocking-horse poo
If I lived in New York City there I wouldn’t have a problem.
NYC's data portal has accurate building heights included in a free dataset – it’s great!
https://data.cityofnewyork.us/Housing-Development/Building-Footprints/tb92-6tj8
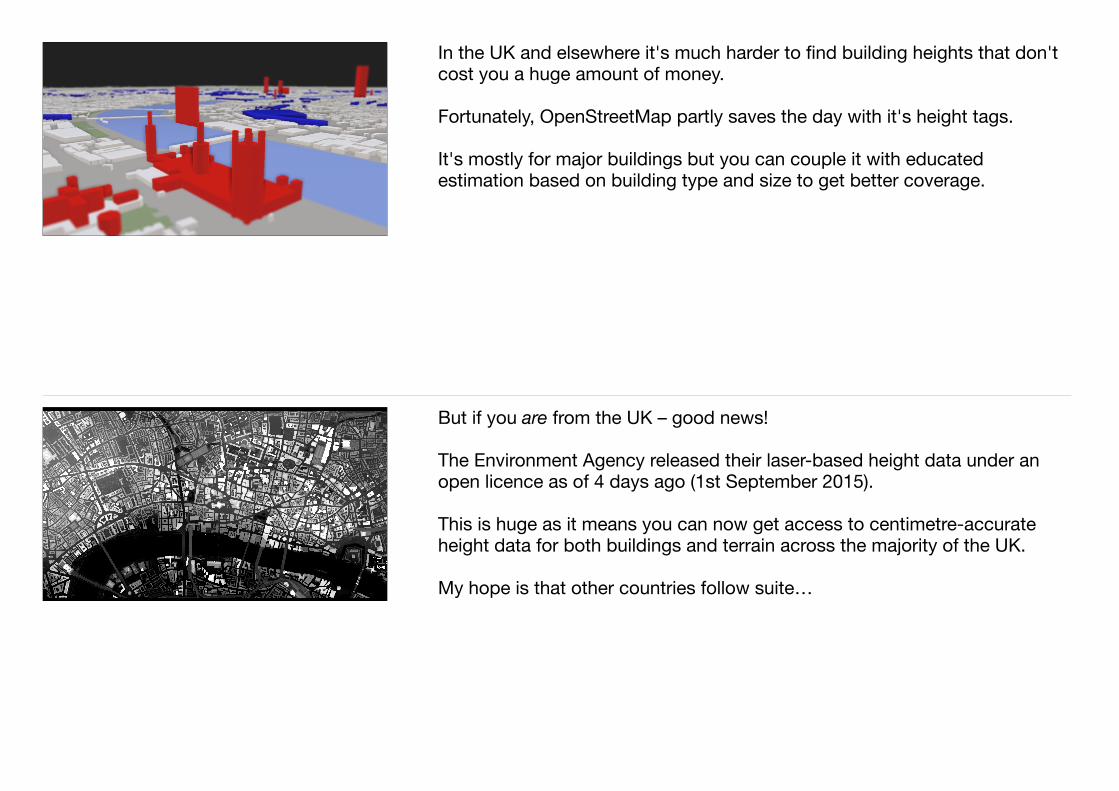
In the UK and elsewhere it's much harder to find building heights that don't cost you a huge amount of money.
Fortunately, OpenStreetMap partly saves the day with it's height tags.
It's mostly for major buildings but you can couple it with educated estimation based on building type and size to get better coverage.
But if you are from the UK – good news!
The Environment Agency released their laser-based height data under an open licence as of 4 days ago (1st September 2015).
This is huge as it means you can now get access to centimetre-accurate height data for both buildings and terrain across the majority of the UK.
My hope is that other countries follow suite…

Converting geo data into 3D isn’t that tricky
Lesson 5
Lesson 5: Converting geo data into 3D objects isn’t that tricky
One of the very first problems I encountered was how to turn geographic coordinates (latitude and longitude) into pixel-based coordinates.
The math involved to achieve this isn’t simple and it gets even more complicated if you want to consider different geographic projections (trust me, it gets confusing fast).
Fortunately, the proj4js library is here for your coordinate conversion needs.
It’s a fantastic little library that allows you to convert to and from practically any geographic projection and 2D screen space.

The second part of the puzzle is something to visualise the 3D objects in.
I chose Three.js, which is a popular and easy-to-use 3D WebGL library.
By combining proj4js and Three.js you can quite quickly convert geographic coordinates into 2D shapes in a 3D world.
It’s cool, but not what we want…

The final step is to use a feature in Three.js called ExtrudeGeometry that lets you stretch 2D shapes into fully-fledged 3D objects.
It’s quite amazing how adding that third dimension suddenly makes a city come to life in front of your eyes.
Quantity and performance are mortal enemies
Lesson 6
Lesson 6: Quantity and performance are mortal enemies
One area that has proven to be a pain time and time again is working out how to visualise as many buildings as possible without causing performance issues.
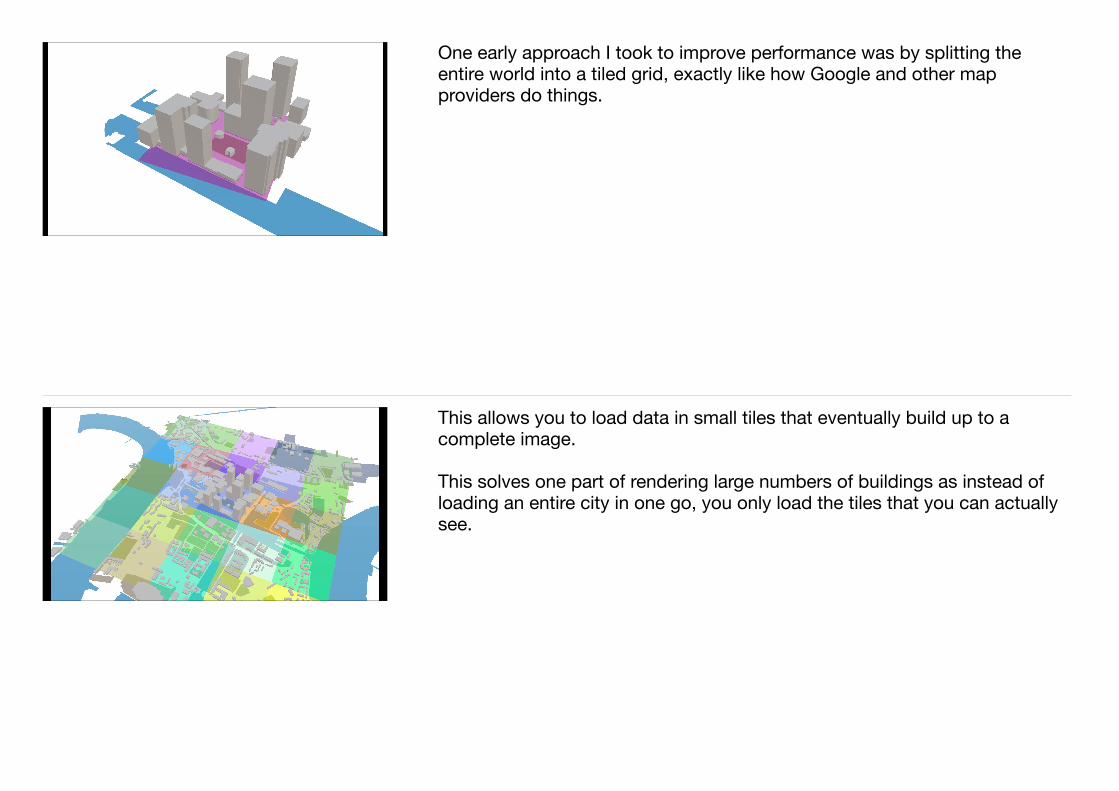
One early approach I took to improve performance was by splitting the entire world into a tiled grid, exactly like how Google and other map providers do things.
This allows you to load data in small tiles that eventually build up to a complete image.
This solves one part of rendering large numbers of buildings as instead of loading an entire city in one go, you only load the tiles that you can actually see.
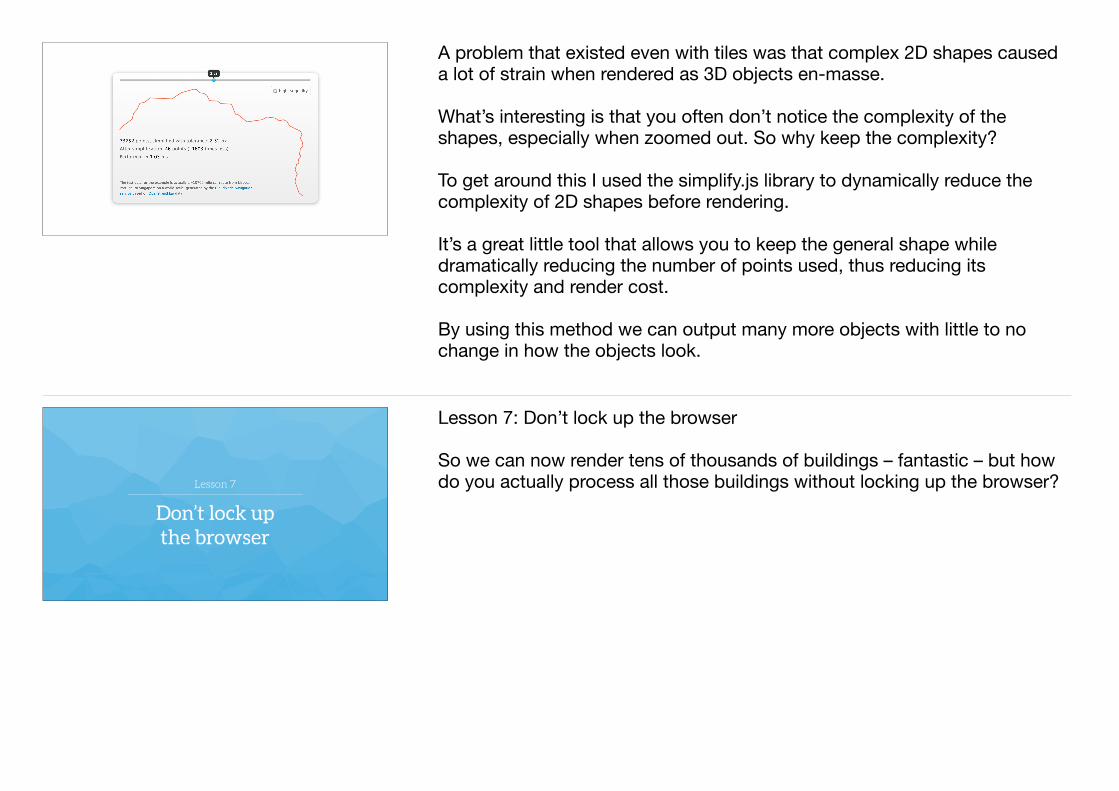
A problem that existed even with tiles was that complex 2D shapes caused a lot of strain when rendered as 3D objects en-masse.
What’s interesting is that you often don’t notice the complexity of the shapes, especially when zoomed out. So why keep the complexity?
To get around this I used the simplify.js library to dynamically reduce the complexity of 2D shapes before rendering.
It’s a great little tool that allows you to keep the general shape while dramatically reducing the number of points used, thus reducing its complexity and render cost.
By using this method we can output many more objects with little to no change in how the objects look.
Don’t lock up the browser
Lesson 7
Lesson 7: Don’t lock up the browser
So we can now render tens of thousands of buildings – fantastic – but how do you actually process all those buildings without locking up the browser?

The solution is to use Web Workers – offloading complex processing to a separate browser thread.
What this means is that you can lock up a Web Worker as much as you want and yet the main browser process – your app UI – will stay silky smooth and responsive while that’s going on.
Instead of getting dirty with raw Web Workers, which actually aren’t that complicated, I went with the Operative library so I could get some extra functionality and helpers for handling common situations.
In ViziCities, each tile is handled by its own worker thread.
What this means is that the entire processing pipeline of converting geo coordinates into 2D and constructing 3D objects is handled within a Web Worker.
Instead of having a noticeable and frustrating delay in browser responsiveness during processing, you now have a smooth experience where the user can continue doing things within ViziCities while the buildings are loading.

If you don’t know what you’re doing with Web Workers, as I didn’t when I started, it’s easy to introduce a new browser lock-up when a large quantity of data is handed back to the browser from the Web Worker (eg. loads of 3D building models).
To get around this you can use a nifty little feature called Transferable Objects.
This allows you to effectively hand the keys to the data from the Web Worker to the main browser thread, instead of copying it.
It’s an instantaneous process and means that you can completely remove another annoying lock-up during complex data processing.
Request data once, and only once
Lesson 8
Lesson 8: Request data once, and only once
This lesson was a simple one, but still one that proved quite troublesome to solve correctly.
It originates from data being requested multiple times within ViziCities as you move around or refresh the page.
It’s a waste of bandwidth and also a waste of the user’s time.
How do you know what you’ve already requested? And how can you make sure you don’t request it again?

The approach I currently use is far too simple, and effectively involves a basic in-memory cache that stores buildings as you move around.
If you go back to a tile you’ve already downloaded data for then the buildings are pulled from the cache and not re-requested.
What I plan to implement is a more robust cache that utilises local storage functionality that now comes with browsers, such as IndexedDB and WebSQL.
What this allows you to do is place data in the local storage and then re-request that same data even after a full page refresh.
It also means you can effectively run your Web app offline by storing data locally and then syncing it when reconnected to the Internet.
De-couple the architecture
Lesson 9
Lesson 9: De-couple the architecture
How do you create a large application that’s extensible and easy to maintain?

Two aspects that really help with de-coupling for me are the Mediator programming pattern and modular architecture.
Modular architecture, such as CommonJS, is really useful for breaking apart your application into small components that you can then require in as necessary. It’s exactly how Node packages work.
The Mediator pattern is pretty much a pub/sub API and is great for managing communication between modules, though you need to be careful as you can’t guarantee when or in what order messages will be received by other modules.
Make sure to check out Addy Osmani’s excellent book on how to implement all the common patterns using JavaScript: http://addyosmani.com/resources/essentialjsdesignpatterns/book/
Promises are another technique that have proven incredibly valuable within the ViziCities architecture, particularly via the Q library.
They allow you to defer the handling of processing until a later time by accepting a promise that a predictable action will be taken at some point in the future, encouraging an asynchronous approach.
What I’ve found most useful is that they let you avoid messy nested callbacks and vastly simplify the flow and readability of the application code.
Large projects can be a nightmare to manage
Lesson 10
Lesson 10: Large projects can be a nightmare to manage
I’ve never been one to care too much about process, code quality, testing, or even making sure things are Done Right™.
I’m a tinkerer and I much prefer learning and seeing results than spending what feels like wasted time on building a solid process.
It turns out my tinkering approach doesn’t work too well for a large Web application which requires consistency and robustness. Who knew?
It didn’t take long for it to be a faff to use a manual process for creating new builds (generating a single JavaScript file with all the modules and external dependencies) and to serve the examples.
The break-through was adopting a proper build system like Grunt or Gulp.
Grunt allows you to run a simple command in the terminal to do things like automatically test, concatenate and minify files ready for release. I also use it to serve the local build and auto-refresh examples if they’re open in a browser.
You can look at the ViziCities Grunt file on GitHub to see how everything is set up.

For automated testing I use Mocha, Chai, Sinon.js and SlimerJS. Each of which serves a slightly different purpose in the testing process.
Mocha is used for the overall testing framework.
http://visionmedia.github.io/mocha
Chai is used as an assertion library to allows you to write readable tests.
http://chaijs.com/
Sinon.js is used to fake application logic and track behaviour through the testing process.
http://sinonjs.org
SlimerJS is used to run client-side tests in a headless browser from the terminal.
https://github.com/metaskills/mocha-phantomjs

Travis CI is used to make sure I don’t break anything when pushing changes to GitHub.
It automatically performs linting and runs tests via Grunt when changes are pushed, including pull requests from other contributors (a life saver).
What's even better it that it integrates into GitHub and automatically performs a build on Pull Requests so you can be confident that they'll merge without breaking everything.

Make sure you actually improve things
Lesson 11
Lesson 11: Make sure you actually improve things
So you’ve made a fix or added a new feature. How do you know if you've made things better or worse?
The simplest approach is to monitor performance in frames-per-second.
One way to do this is with FPSMeter, which is good for an overview but not super-reliable.
The best way to track frame-rate is to use the built-in frame timers in the browser development tools.
These timers are useful for getting a general indication that parts of the application are locking up the browser or preventing the rendering loop from running at a fast pace.
http://darsa.in/fpsmeter/

For more in-depth analysis you’ll want to dig further into the developer tools.
In my case I’ve been having a lot of success using the Timeline and Profiles functionality in Chrome.
The timelines is particularly useful as it gives me a detailed overview of everything that happens in a single browser frame, allowing me to see what is taking the most time and causing frames to slow below 60fps.
I most recently used this to debug and confirm a fix for an issue where an event emitter library was causing dramatic slow-downs but only when there were lots of objects in view.
I switched out the library and re-checked everything in the Timeline – each frame now took around 17ms rather than 160!
Don’t sacrifice enjoyment in pursuit of perfection
Overall
Overall lesson: Don’t sacrifice your enjoyment in pursuit of perfection
This is more of a general life rule, but I found that about a year into the project I started to take it too seriously and forgot about why I was actually doing it.
I lost track of what I enjoyed about it and ultimately felt like it was a chore to continue working on it.
Make sure to take the time to do what needs to be done while also ensuring that you continue working on the things you want to work on – the things that you enjoy most.
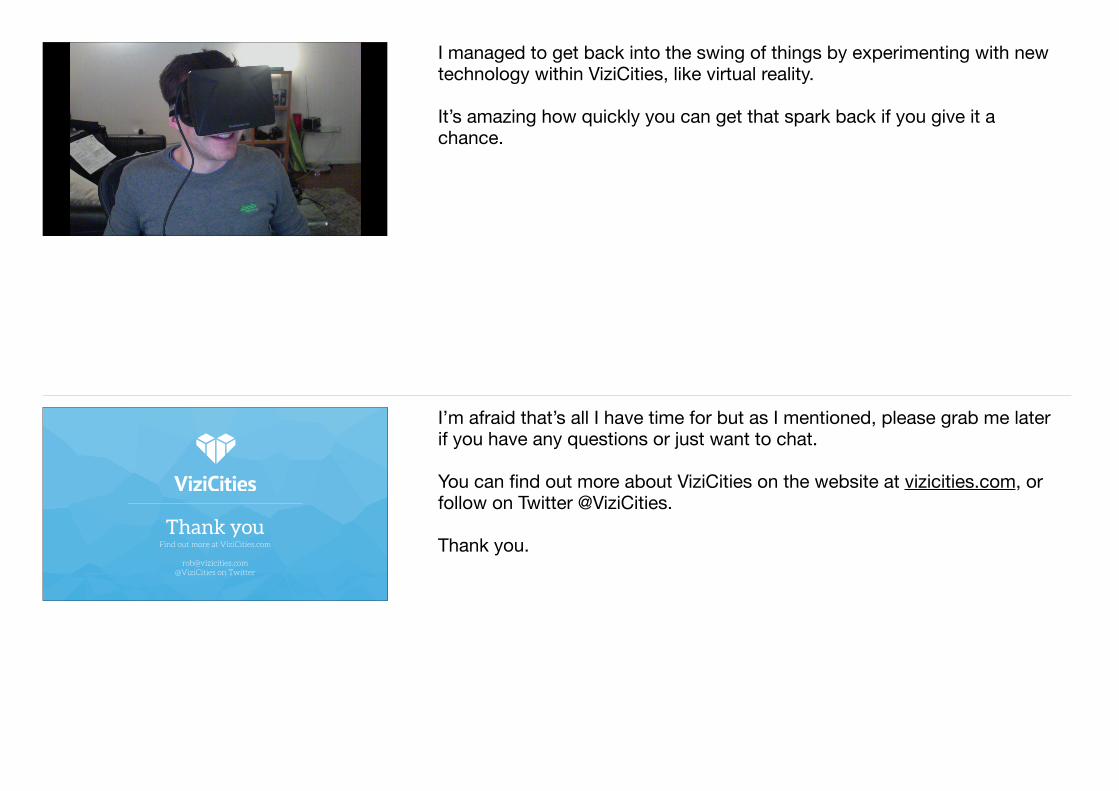
I managed to get back into the swing of things by experimenting with new technology within ViziCities, like virtual reality.
It’s amazing how quickly you can get that spark back if you give it a chance.
Thank youFind out more at ViziCities.com
[email protected] @ViziCities on Twitter
I’m afraid that’s all I have time for but as I mentioned, please grab me later if you have any questions or just want to chat.
You can find out more about ViziCities on the website at vizicities.com, or follow on Twitter @ViziCities.
Thank you.