vlog 4.5 user's guide - vaisala · setting audit trail options ... the instructions in the...
TRANSCRIPT
USER’S GUIDE
vLog 4.5Vaisala Veriteq vLog Software
M211334EN-A
CopyrightCopyright 2011 Vaisala Canada Inc. All rights reserved.
TrademarksVaisala Canada Inc, Vaisala Veriteq, Vaisala Veriteq vLog, and Vaisala Veriteq Spectrum are trade-marks of Vaisala Canada Inc.
Windows is a registered trademark of Microsoft Corporation.
All other trademarks referred to are the property of their respective owners.
Disclaimer and Limitation of LiabilityVaisala Canada Inc and its subsidiaries assume no responsibility for any damage or loss resulting from the use of this manual.
Vaisala Canada Inc and its subsidiaries assume no responsibility for any loss or claims by third parties which may arise through the use of this software. Vaisala Canada Inc and its subsidiaries assume no responsibility for any damage or loss caused by deletion of data as a result of hard-ware malfunction. Be sure to make backup copies of all important data to protect against data loss.
Vaisala Canada Inc makes no warranties, either expressed or implied, regarding Vaisala Veriteq data loggers or software, its merchantability, or its fitness for any particular purpose. The exclusion of implied warranties is not permitted by some states. As such, the exclusion may not apply to you.
Vaisala Veriteq vLog has been tested using a variety of network systems. However, the large num-ber of possible hardware and network configurations makes testing under every circumstance impossible. If you have trouble using Vaisala Veriteq vLog software, contact Vaisala Canada Inc.
Technical SupportFor technical support in North America, please call 1-866-861-3388, or for customers outside North America, see “Getting Help” on page 9.
Email: [email protected]
Document part number: M211334EN
Release date: July 2011
No copying, distribution, publication, modification, or incorporation of this document, in whole or part, is permitted for commercial purposes without the express written permission of Vaisala Can-ada Inc.
Vaisala Canada Inc13775 Commerce ParkwayRichmond, BC V6V 2V4Canada
Vaisala Veriteq vLog 4.5 i
Chapter 1: Introducing vLog . . . . . . . . . . . . . . . . . . . . . . . . . . . . . . . 1Overview . . . . . . . . . . . . . . . . . . . . . . . . . . . . . . . . . . . . . . 2
vLog SP or vLog VL? . . . . . . . . . . . . . . . . . . . . . . . . . . . . . . 3Preparing to use Vaisala Veriteq vLog Software . . . . . . . . . . 3Understanding the vLog Window . . . . . . . . . . . . . . . . . . . . . 5Using Menus & Keyboard Shortcuts . . . . . . . . . . . . . . . . . . . 6Using the Tool Bar . . . . . . . . . . . . . . . . . . . . . . . . . . . . . . . . 7Conventions Used in this Document . . . . . . . . . . . . . . . . . . 9
Getting Help . . . . . . . . . . . . . . . . . . . . . . . . . . . . . . . . . . . 9
Chapter 2: Getting Started . . . . . . . . . . . . . . . . . . . . . . . . . . . . . . . . 11System Requirements . . . . . . . . . . . . . . . . . . . . . . . . . . . 12Installing vLog Software . . . . . . . . . . . . . . . . . . . . . . . . . 12Setting Up and Using vLog—Overview . . . . . . . . . . . . . . 14
Ensuring Loggers are Calibrated . . . . . . . . . . . . . . . . . . . . 15Validating Loggers (vLog VL) . . . . . . . . . . . . . . . . . . . . . . . 15Connecting Loggers to PCs . . . . . . . . . . . . . . . . . . . . . . . . 16Logging on to vLog SP . . . . . . . . . . . . . . . . . . . . . . . . . . . . 17Logging on to vLog VL . . . . . . . . . . . . . . . . . . . . . . . . . . . . 17Setting Audit Trail Options (vLog VL) . . . . . . . . . . . . . . . . . 21Setting Security Levels (vLog VL) . . . . . . . . . . . . . . . . . . . . 22Working with User Accounts (vLog VL) . . . . . . . . . . . . . . . . 23Setting up PC Communication Ports . . . . . . . . . . . . . . . . . 25
Configuring Loggers . . . . . . . . . . . . . . . . . . . . . . . . . . . . 26Linking Loggers to an Audit Trail File (vLog VL) . . . . . . . . . 31Configuring Logger Description . . . . . . . . . . . . . . . . . . . . . 31Setting Logger Sample Timing . . . . . . . . . . . . . . . . . . . . . 33Setting the Sample Interval . . . . . . . . . . . . . . . . . . . . . . . . 37Enabling and Disabling Logger Channels . . . . . . . . . . . . . . 39Configuring Channels to Work with Transducers . . . . . . . . 39Configuring Warm Up Time . . . . . . . . . . . . . . . . . . . . . . . . 42Configuring Logger Channels to Work with Thermocouples 43Clearing Logger Samples . . . . . . . . . . . . . . . . . . . . . . . . . 44
Contents
ii © 2011 Vaisala Canada Inc
Configuring Loggers: Batch Setup (vLog VL) . . . . . . . . . . .46Mounting Loggers . . . . . . . . . . . . . . . . . . . . . . . . . . . . . .48Using External Temperature Probes . . . . . . . . . . . . . . . . .49Caring for Relative Humidity Sensors . . . . . . . . . . . . . . . .50
Chapter 3: Transferring Logger Files . . . . . . . . . . . . . . . . . . . . . . . . .51Transferring Data . . . . . . . . . . . . . . . . . . . . . . . . . . . . . . .52
Setting Transfer Preferences . . . . . . . . . . . . . . . . . . . . . . . 52Configuring the Default File Name Format . . . . . . . . . . . . . 53Transferring Logger Data to the PC . . . . . . . . . . . . . . . . . . 54
Logger File Creation Report (vLog VL) . . . . . . . . . . . . . . . .60Logger File ID Number (vLog VL) . . . . . . . . . . . . . . . . . . . . 63Setting System Date and Time . . . . . . . . . . . . . . . . . . . . . 64
Batch Transfer of Logger Data to the PC (vLog VL) . . . . . .64
Chapter 4: Working with Graphs . . . . . . . . . . . . . . . . . . . . . . . . . . . .67Displaying and Creating Graph Files . . . . . . . . . . . . . . . . .68
Inserting Logger Files . . . . . . . . . . . . . . . . . . . . . . . . . . . . 68Inserting Multiple Logger Files . . . . . . . . . . . . . . . . . . . . . . 70Removing Channels from a Graph . . . . . . . . . . . . . . . . . . . 70Scrolling Through Graphs . . . . . . . . . . . . . . . . . . . . . . . . . 71Pinpointing Graph Values and Times . . . . . . . . . . . . . . . . . 71Changing the Time Zone . . . . . . . . . . . . . . . . . . . . . . . . . . 72Adding Graph Titles . . . . . . . . . . . . . . . . . . . . . . . . . . . . . . 72Selecting a Graph Font . . . . . . . . . . . . . . . . . . . . . . . . . . . 73Zooming In . . . . . . . . . . . . . . . . . . . . . . . . . . . . . . . . . . . . 73Zooming Out . . . . . . . . . . . . . . . . . . . . . . . . . . . . . . . . . . . 76
Formatting Measurement Units . . . . . . . . . . . . . . . . . . . .77Specifying the Y-axis Scale . . . . . . . . . . . . . . . . . . . . . . . . 77Changing the Decimal Place Precision . . . . . . . . . . . . . . . . 78
Changing the Temperature Scale . . . . . . . . . . . . . . . . . . .78Setting Sample Smoothing . . . . . . . . . . . . . . . . . . . . . . . .79Adding Horizontal Lines to Graphs . . . . . . . . . . . . . . . . . .80Verifying a Graph (vLog VL) . . . . . . . . . . . . . . . . . . . . . . .82
Vaisala Veriteq vLog 4.5 iii
Copying and Pasting Graphs . . . . . . . . . . . . . . . . . . . . . . 83Exporting Graph Data . . . . . . . . . . . . . . . . . . . . . . . . . . . 83Saving Graphs . . . . . . . . . . . . . . . . . . . . . . . . . . . . . . . . . 84Printing Graphs . . . . . . . . . . . . . . . . . . . . . . . . . . . . . . . . 85
Printing Line Numbers on Graphs . . . . . . . . . . . . . . . . . . . 85Printing Footers on Graphs . . . . . . . . . . . . . . . . . . . . . . . . 86Print Preview . . . . . . . . . . . . . . . . . . . . . . . . . . . . . . . . . . . 86Printing Graphs . . . . . . . . . . . . . . . . . . . . . . . . . . . . . . . . . 86
Chapter 5: Viewing Reports and Statistics . . . . . . . . . . . . . . . . . . . 87Historical Data Reports . . . . . . . . . . . . . . . . . . . . . . . . . . 88
Adding Statistics to Historical Data Reports . . . . . . . . . . . . 89Customizing Headers, Footers and Font Sizes in Historical Data Reports . . . . . . . . . . . . . . . . . . . . . . . . . . . . . . . . . . . 91
Audit Trail Reports (vLog VL) . . . . . . . . . . . . . . . . . . . . . . 94Viewing and Filtering Audit Trail Reports . . . . . . . . . . . . . . 94Configuring Date and Time Columns in Audit Trail Reports . . . . . . . . . . . . . . . . . . . . . . . . . . . . . . . . . . . . . . . 97Customizing Headers, Footers and Font Sizes in Printed Audit Trail Reports . . . . . . . . . . . . . . . . . . . . . . . . . . . . . . . 97
Batch Setup Reports (vLog VL) . . . . . . . . . . . . . . . . . . . . 98Customizing Headers and Footers in Printed Batch Setup Reports . . . . . . . . . . . . . . . . . . . . . . . . . . . . . . . . . . . . . . . 99
Graph Security Problems Reports (vLog VL) . . . . . . . . . . 100Copying and Pasting Report Data . . . . . . . . . . . . . . . . . 101Saving Reports . . . . . . . . . . . . . . . . . . . . . . . . . . . . . . . 102
Printing Reports . . . . . . . . . . . . . . . . . . . . . . . . . . . . . . . 102
Appendix: FAQs and Troubleshooting . . . . . . . . . . . . . . . . . . . . . . . 103Software Error Messages . . . . . . . . . . . . . . . . . . . . . . . 103Frequently Asked Questions . . . . . . . . . . . . . . . . . . . . . 104
Glossary . . . . . . . . . . . . . . . . . . . . . . . . . . . . . . . . . . . . . . . . . . . . . 109
Index . . . . . . . . . . . . . . . . . . . . . . . . . . . . . . . . . . . . . . . . . . . . . . . . 117

iv © 2011 Vaisala Canada Inc
Vaisala Veriteq vLog 4.5 1
Chapter 1: Introducing vLog
The vLog 4.5 User’s Guide includes the information you need to install, configure and operate vLog. You can also review the vLog Quick Guide for an overview of vLog installation steps.
This chapter includes:
• overview of Vaisala Veriteq vLog VL and vLog SP software features
• hardware and software requirements
Overview
2 © 2011 Vaisala Canada Inc
OverviewVaisala Veriteq vLog 4.5 software provides high-integrity recordings of temperature, humidity and other conditions. It can also provide you with the level of file security required by the pharmaceutical industry, depending on the security key you use to install vLog. Your security key provides you with access to either vLog SP features or additional vLog VL features.
Note: vLog SP is designed to be used with Vaisala Ver-iteq SP-Series Data Loggers, while vLog VL can be used with both SP- and VL-Series loggers.
With Vaisala Veriteq vLog 4.5 you can:
• Create electronic records of temperature, humidity and other conditions. Using vLog VL, you can also generate secure files and Audit Trail Reports that ensure logger files have not been altered or modified in any way.
• Create graphs and reports from logger files. Additionally, if you use vLog VL, you can ensure your graphs and reports are secure and traceable. Traceability is achieved using Administrative Options (security levels), the Audit Trail Report, and Logger File ID Numbers. These features help ensure that you do not accidentally use the wrong logger files in your graphs and reports.
• Produce detailed graph reports and, in vLog VL, document the secure, verified and calibration status of both the logger and the data file.
• Overlay logger files within the same graph to check relationships between logger files.
• Zoom-in and zoom-out for a customized view of the graph.
• Add manual and automatic maximum, minimum, and average horizontal lines to graphs.
• Use the on-screen graph cursor to pinpoint exact values, times and dates.
• Open multiple graph windows at one time.
• Create statistical summaries.
• View, customize and print tabular-format reports with dates, times, logged values, interval statistics, headers and footers.
Overview
Vaisala Veriteq vLog 4.5 3
• Export graph data and reports to external databases, word processors or spreadsheets.
• Manually or automatically scale graphs.
• Use multiple Y-axes scaling and ranges.
• Enable and disable input channels.
• Set logger start and stop times, sample intervals and other logger settings.
vLog SP or vLog VL?While the core vLog features are the same, additional features are available if you install vLog using a vLog VL security key:
• Compatible with both Vaisala Veriteq SP- and VL-Series Data Loggers.
• Create secure graph and logger files - the security status of your data is identified on every report. You know whether files are secure or not, and if files have security problems or tampering issues.
• Data and user security - vLog uses Windows password authentication—domain level or local account authentication. Your IT staff can implement what they already use to protect other company assets.
• Audit Trail - A built-in audit trail report generator creates reports for all logger data or for a time period you specify. No changes to the system go unrecorded.
• Batch Setup and Transfer - Save time using the settings from one logger in additional loggers—start and stop time, sample interval, logger and channel descriptions, and channel flags. You can also configure the Batch Setup feature to support a range of COM ports.
Preparing to use Vaisala Veriteq vLog SoftwareVaisala Veriteq vLog software supports one or more Vaisala Veriteq SP-Series Data Loggers, a Vaisala Veriteq cable (PC-IC cable if connecting by Serial port, INT-USB-DL cable if connecting by USB, or Digi and Ethernet cables if connecting via Digi or Vaisala Veriteq vNet device through the network), and a PC with an attached printer.
Overview
4 © 2011 Vaisala Canada Inc
If you use vLog VL, you can also use Vaisala Veriteq VL-Series Validatable Data Loggers.
Once you connect loggers to a PC, you can use vLog software to configure logger settings such as the sampling interval, then place the loggers in the area where you want to measure conditions and record data. Your loggers collect the information and store it in their internal memory. Once the desired information is collected, you transfer it to a PC running vLog and import (“insert”) the data into a vLog graph. Use the graph to display, analyze, and print graphical or tabular reports, and, if needed, export the information to use in an analysis or presentation application.
VL-Series Validatable Data LoggersEach Vaisala Veriteq VL-Series Validatable Data Logger is factory-calibrated against National Institute of Standards and Technology (NIST) traceable standards. All calibration information is stored digitally in the logger’s memory. For logger specifications, see www.vaisala.com/lifescience-hitech or contact Vaisala Canada Inc.
There are many models of VL-Series loggers to choose from, including the VL-1000, VL-1200, VL-1400, VL-1700, VL-2000, VL-4000 and VLT series. Each logger has one or more channels and can monitor and record data for FDA-regulated applications, including ambient temperature and relative humidity. Many loggers can also have optional plug-in external probes attached.

Overview
Vaisala Veriteq vLog 4.5 5
Understanding the vLog WindowThe following illustration shows the main sections of the vLog window, with items described in Table 1:
Graph plot area
1234
5
6
7
8
9
10
11
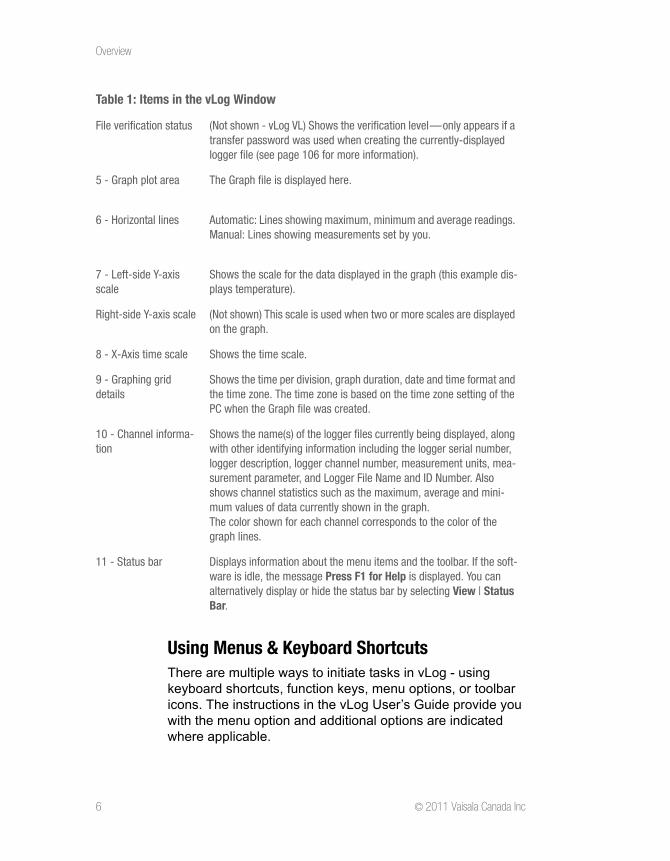
Table 1: Items in the vLog Window
1 - Title bar Shows the name of the active Graph file
2 - Menu bar Allows access to the various software functions
3 - Toolbar Allows quick access to the most used software functions
4 - File securitystatus
vLog VL: Shows the security level of the Graph file (note: If the check-sum in a logger file or graph file is invalid, vLog will not open the file).Tampered means at least one logger is a VL-Series logger but one of the loggers has an invalid checksum. Secure means each logger is a VL-Series logger and all data and graphs have valid checksums. Not Secure means there are security problems, such as one SP-Series logger shown in the graph, or one of the graphs or logger files does not have a checksum.
Overview
6 © 2011 Vaisala Canada Inc
Using Menus & Keyboard ShortcutsThere are multiple ways to initiate tasks in vLog - using keyboard shortcuts, function keys, menu options, or toolbar icons. The instructions in the vLog User’s Guide provide you with the menu option and additional options are indicated where applicable.
File verification status (Not shown - vLog VL) Shows the verification level—only appears if a transfer password was used when creating the currently-displayed logger file (see page 106 for more information).
5 - Graph plot area The Graph file is displayed here.
6 - Horizontal lines Automatic: Lines showing maximum, minimum and average readings. Manual: Lines showing measurements set by you.
7 - Left-side Y-axis scale
Shows the scale for the data displayed in the graph (this example dis-plays temperature).
Right-side Y-axis scale (Not shown) This scale is used when two or more scales are displayed on the graph.
8 - X-Axis time scale Shows the time scale.
9 - Graphing grid details
Shows the time per division, graph duration, date and time format and the time zone. The time zone is based on the time zone setting of the PC when the Graph file was created.
10 - Channel informa-tion
Shows the name(s) of the logger files currently being displayed, along with other identifying information including the logger serial number, logger description, logger channel number, measurement units, mea-surement parameter, and Logger File Name and ID Number. Also shows channel statistics such as the maximum, average and mini-mum values of data currently shown in the graph. The color shown for each channel corresponds to the color of the graph lines.
11 - Status bar Displays information about the menu items and the toolbar. If the soft-ware is idle, the message Press F1 for Help is displayed. You can alternatively display or hide the status bar by selecting View | Status Bar.
Table 1: Items in the vLog Window
Overview
Vaisala Veriteq vLog 4.5 7
You may wish to take a few minutes to become familiar with the menu items, or right-click on various parts of the window to discover additional ways to access menu items.
Here are some common keyboard shortcuts and function keys:
• Create a new blank Graph File: Ctrl+N (File | New)
• Open an existing Graph file: Ctrl+O (File | Open)
• Save a Graph file: Ctrl+S (File | Save)
• Insert a Logger file: Ctrl+I (File | Insert)
• Print a graph file: Ctrl+P (File | Print)
• Produce an historical report associated with the active graph: F6
• Scroll Backward: Alt+Left arrow
• Scroll Forward: Alt+Right arrow
• Open the Logger Setup window: F11
• Transfer information from the logger to your PC: F12
• Help: F1 (opens an online, printable version of the User’s Guide)
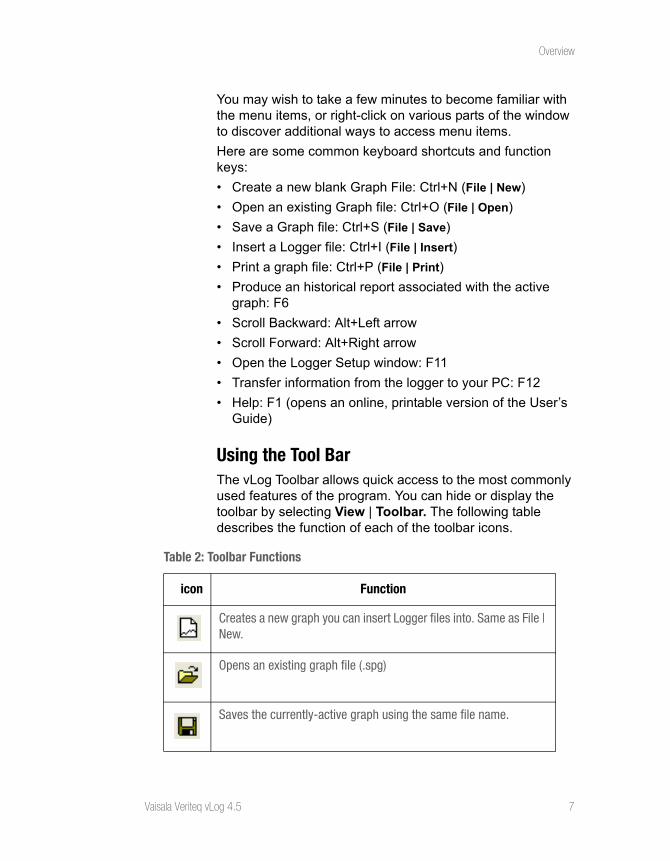
Using the Tool BarThe vLog Toolbar allows quick access to the most commonly used features of the program. You can hide or display the toolbar by selecting View | Toolbar. The following table describes the function of each of the toolbar icons.
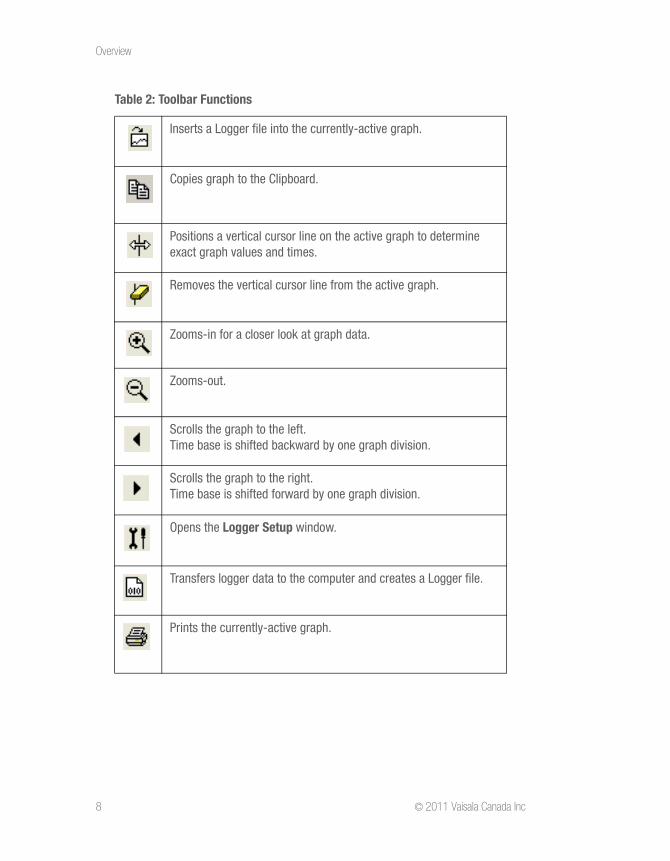
Table 2: Toolbar Functions
icon Function
Creates a new graph you can insert Logger files into. Same as File | New.
Opens an existing graph file (.spg)
Saves the currently-active graph using the same file name.
Overview
8 © 2011 Vaisala Canada Inc
Inserts a Logger file into the currently-active graph.
Copies graph to the Clipboard.
Positions a vertical cursor line on the active graph to determine exact graph values and times.
Removes the vertical cursor line from the active graph.
Zooms-in for a closer look at graph data.
Zooms-out.
Scrolls the graph to the left.Time base is shifted backward by one graph division.
Scrolls the graph to the right.Time base is shifted forward by one graph division.
Opens the Logger Setup window.
Transfers logger data to the computer and creates a Logger file.
Prints the currently-active graph.
Table 2: Toolbar Functions
Getting Help
Vaisala Veriteq vLog 4.5 9
Conventions Used in this DocumentThis document uses the following conventions:
• Menu selections, items you select, and the names of buttons are shown in bold.
• A sequence of actions is indicated by a list separated by a vertical line. For example:
‘In vLog, choose Tools | Options’
• Click: To select a screen button with a click of the mouse.
Getting HelpIf you need help, technical support is available.
North AmericaContact Vaisala Canada Inc, 8am-4pm PST Monday to Friday, at 1-866-861-3388 (or 604-273-6850) or email [email protected]. See also www.vaisala.com/lifescience-hitech.
For sales, pricing, quotations, or general information, please call 1-800-273-8374 (or 604-273-6850).
Vaisala Headquarters (Finland)Vanha Nurmijärventie 21
01670 Vantaa
FINLAND
Industrial Instruments
Phone: +358 9 8949 2658
Fax: +358 9 8949 2295
Japan Service Center42 Kagurazaka 6-Chome
Shinjuku-ku
Tokyo 162-0825
JAPAN
Phone: +81 3 3266 9611
Fax: +81 3 3266 9610
Getting Help
10 © 2011 Vaisala Canada Inc
China Service CenterFloor 2, EAS Building
No. 21, Xiao Yun Road, Dongsanhuan Beilu
Chaoyang District
Beijing 100027
CHINA
Phone: +86 10 5827 4100
Fax: +86 10 8526 1155
Vaisala Veriteq vLog 4.5 11
Chapter 2: Getting Started
This chapter will assist you by providing information about:
• system requirements
• installing and logging on to vLog
• configuring loggers
System Requirements
12 © 2011 Vaisala Canada Inc
System RequirementsvLog software requires a PC with the following minimum configuration:
• 32-bit or x64 version of: Microsoft Windows XP,
Windows Server 2003, Windows Vista,
Windows Server 2008, and Windows7
• one available Serial or USB communication port (for transferring logger data files; you can view graphs and reports for previously transferred logger files without this port).
Installing vLog SoftwareTo install vLog software:
Note: vLog installation automatically uninstalls vLog versions 4.3 and 4.4; earlier versions of vLog are not uninstalled automatically. Also note that the uninstall program will not remove logger files (.spl), Graph files (.spg), Batch Setup files (.bsf) or Audit trail files (.vat).
1 Ensure you have administrator privileges.
2 Start Windows, log in as the administrator, and close all running applications. If you will be using the USB Logger Cable, do not connect the cable until installation is complete.
3 Insert the Vaisala Veriteq vLog CD into the CD-ROM drive and wait for it to start automatically. If it does not start automatically, from the Start menu, select Run. Type d:\setup and press Enter. If d:\ is not your CD-ROM drive, type the appropriate drive letter.
Installing vLog Software
Vaisala Veriteq vLog 4.5 13
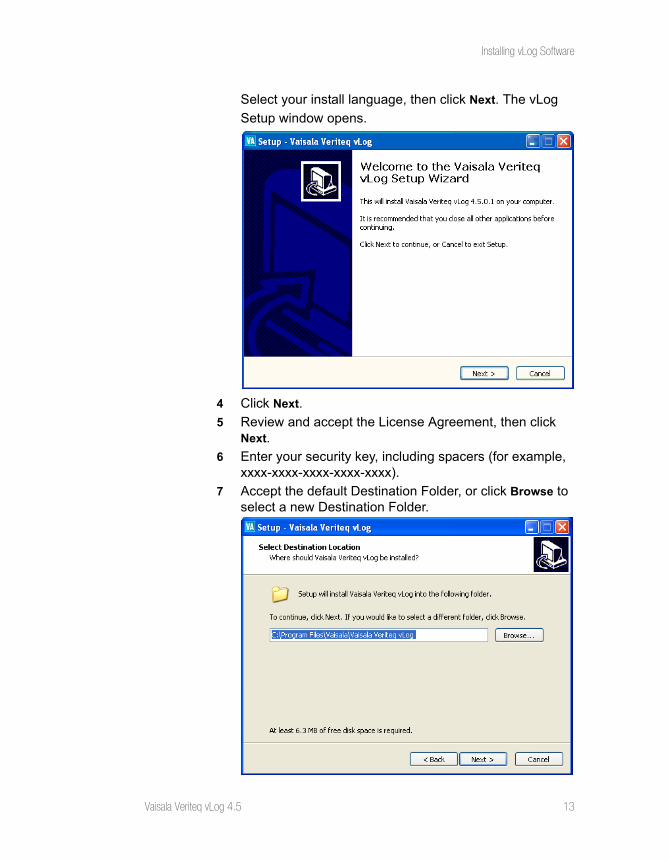
Select your install language, then click Next. The vLog
Setup window opens.
4 Click Next.
5 Review and accept the License Agreement, then click Next.
6 Enter your security key, including spacers (for example, xxxx-xxxx-xxxx-xxxx-xxxx).
7 Accept the default Destination Folder, or click Browse to select a new Destination Folder.
Setting Up and Using vLog—Overview
14 © 2011 Vaisala Canada Inc
8 Click Next.
9 Accept the default Start Menu Folder or click Browse to select a different folder. Click Next.
10 If you want to add a shortcut to your desktop, select this option then click Next.
11 Click Install.
12 Click Finish.
vLog is now installed.
Setting Up and Using vLog—OverviewOnce you have installed vLog, you may find the following checklist a useful overview of steps for setting up and using vLog:
1 Ensure that loggers are calibrated (see page 15).
2 Validate loggers (see page 15).
3 Connect loggers to the PC (see page 16).
4 Log on to vLog software (see page 17).
5 Set Administrator Options (see page 21).
6 Select a communications port (see page 25).
7 Configure loggers (see page 26).
8 Place loggers in the area you want to validate and collect samples for the desired time (see page 48).
9 Transfer raw data in the form of a logger file (.spl) to the PC (see “Transferring Data” on page 52).
10 Insert logger files (.spl) into Graph files (.spg) (see page 68).
11 View, copy, customize and print Graphs (see Chapter 4: Working with Graphs.)
12 View, copy, customize and print Reports (see Chapter 5: Viewing Reports and Statistics.)
13 Have the printed Graph or Report approved and signed.
Setting Up and Using vLog—Overview
Vaisala Veriteq vLog 4.5 15
Ensuring Loggers are CalibratedVaisala Veriteq loggers are calibrated at Vaisala Canada Inc and should be calibrated on a suitable frequency as determined by the accuracy requirements of the application in which the product is used.
If you use vLog VL, the Calibration frequency should be specified when the loggers are purchased, and the next calibration date pre-set in the logger. Vaisala Canada Inc recommends a 90-day interval for the most critical applications, while a one-year interval may be adequate for less demanding situations.
To calibrate your loggers, contact Vaisala Canada Inc for pricing, lead times, and delivery arrangements.
Note: Treat the calibration process very carefully. The consequences of poor calibration can be very expensive. Vaisala Veriteq loggers are high-accuracy instruments. In order to maintain the specified accuracy, it is essential to have trained calibration personnel, strict calibration proce-dures and proper test and calibration facilities. If you have questions about the calibration pro-cess, contact [email protected].
Validating Loggers (vLog VL)For companies that are required to validate the vLog system (including VL-Series Validatable Data Loggers and vLog VL software) prior to use, Vaisala Canada Inc provides a comprehensive protocol document.
Each package includes installation qualification (IQ) and operational qualification (OQ) procedures, and forms. The information and forms are provided as hard copies in a 3-ring binder and in electronic form (Microsoft Word documents) on a CD-ROM. The electronic files provide an easy way for you to customize the forms for the application.
For more information, contact Vaisala Canada Inc.
Setting Up and Using vLog—Overview
16 © 2011 Vaisala Canada Inc
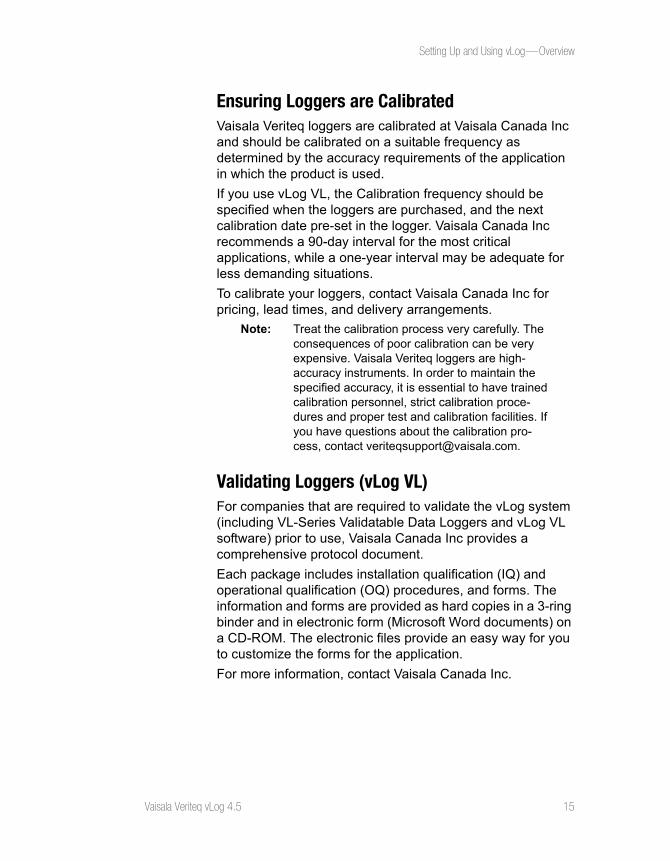
Connecting Loggers to PCsTo connect your logger to a PC using USB or Serial cable:
1 Connect the logger to a Vaisala Veriteq USB or Serial cable.
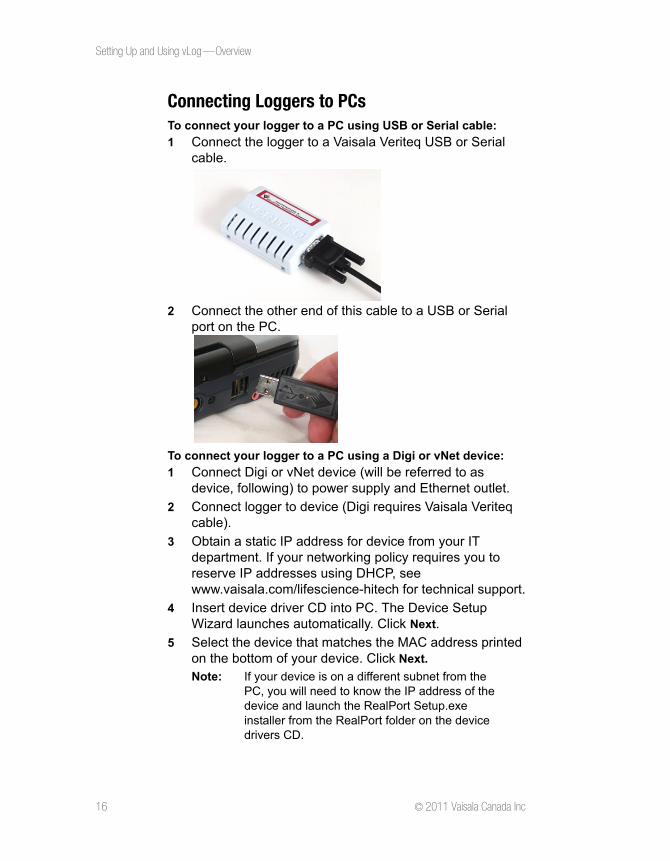
2 Connect the other end of this cable to a USB or Serial port on the PC.
To connect your logger to a PC using a Digi or vNet device:
1 Connect Digi or vNet device (will be referred to as device, following) to power supply and Ethernet outlet.
2 Connect logger to device (Digi requires Vaisala Veriteq cable).
3 Obtain a static IP address for device from your IT department. If your networking policy requires you to reserve IP addresses using DHCP, see www.vaisala.com/lifescience-hitech for technical support.
4 Insert device driver CD into PC. The Device Setup Wizard launches automatically. Click Next.
5 Select the device that matches the MAC address printed on the bottom of your device. Click Next.
Note: If your device is on a different subnet from the PC, you will need to know the IP address of the device and launch the RealPort Setup.exe installer from the RealPort folder on the device drivers CD.
Setting Up and Using vLog—Overview
Vaisala Veriteq vLog 4.5 17
6 In the Configure Network Settings window, enter an IP address (provided by your IT department). Click Next two times.
7 In the Configure RealPort Settings screen, select Install (Digi) RealPort on this computer. Click Next.
8 Click Next again. The settings are saved.
9 Click Finish. Drivers required to connect to your logger through the device have been installed.
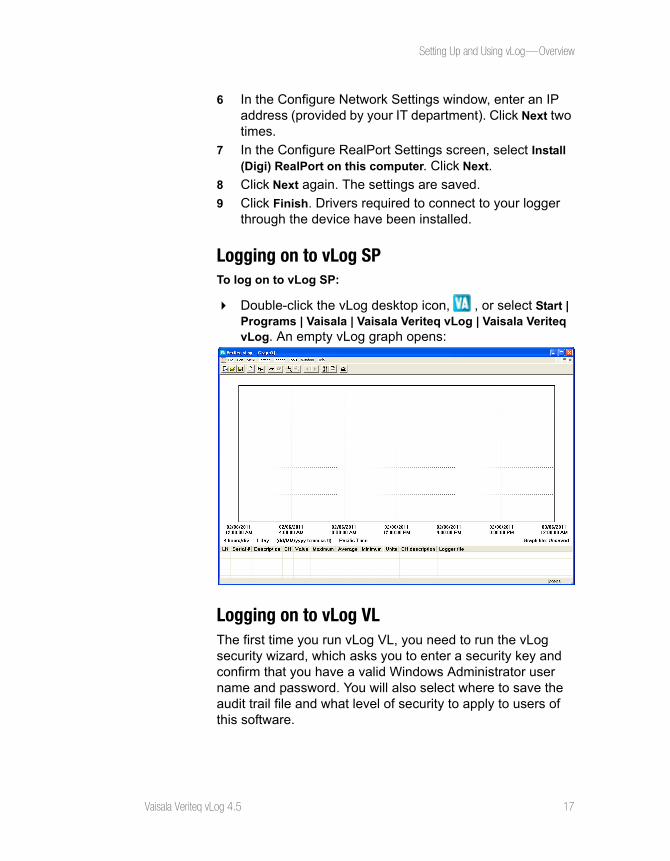
Logging on to vLog SPTo log on to vLog SP:
Double-click the vLog desktop icon, , or select Start | Programs | Vaisala | Vaisala Veriteq vLog | Vaisala Veriteq vLog. An empty vLog graph opens:
Logging on to vLog VLThe first time you run vLog VL, you need to run the vLog security wizard, which asks you to enter a security key and confirm that you have a valid Windows Administrator user name and password. You will also select where to save the audit trail file and what level of security to apply to users of this software.
Setting Up and Using vLog—Overview
18 © 2011 Vaisala Canada Inc
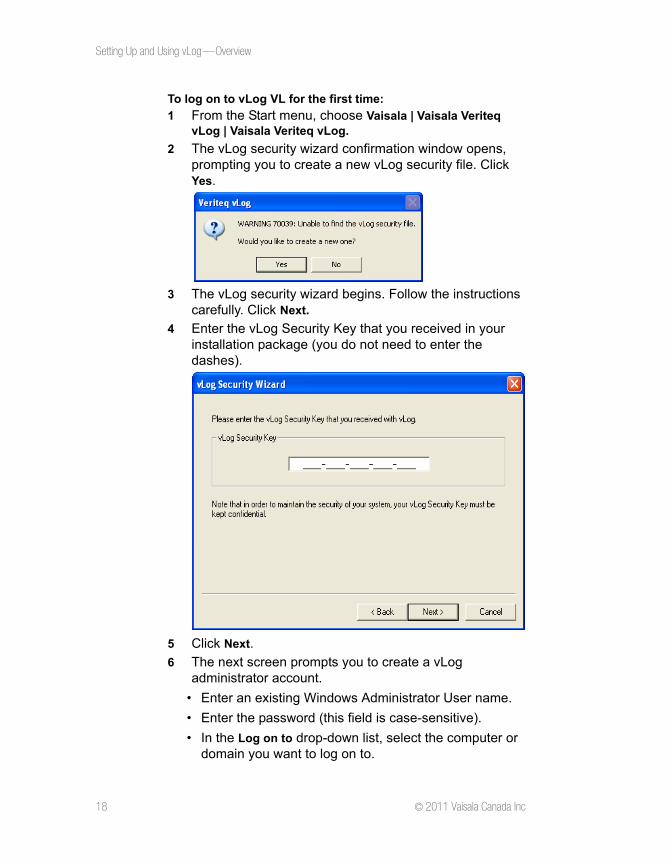
To log on to vLog VL for the first time:
1 From the Start menu, choose Vaisala | Vaisala Veriteq vLog | Vaisala Veriteq vLog.
2 The vLog security wizard confirmation window opens, prompting you to create a new vLog security file. Click Yes.
3 The vLog security wizard begins. Follow the instructions carefully. Click Next.
4 Enter the vLog Security Key that you received in your installation package (you do not need to enter the dashes).
5 Click Next.
6 The next screen prompts you to create a vLog administrator account.
• Enter an existing Windows Administrator User name.
• Enter the password (this field is case-sensitive).
• In the Log on to drop-down list, select the computer or domain you want to log on to.
Setting Up and Using vLog—Overview
Vaisala Veriteq vLog 4.5 19
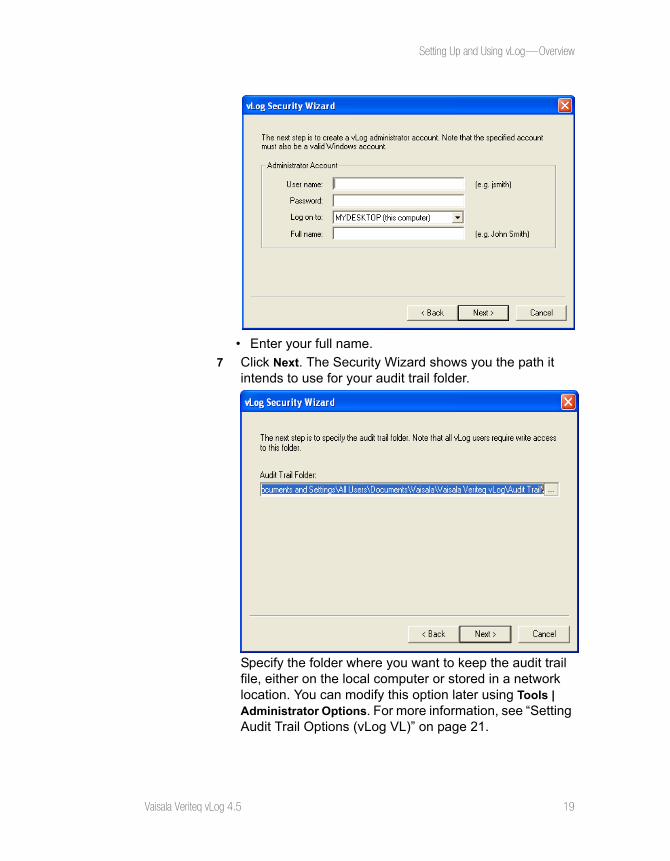
• Enter your full name.
7 Click Next. The Security Wizard shows you the path it intends to use for your audit trail folder.
Specify the folder where you want to keep the audit trail file, either on the local computer or stored in a network location. You can modify this option later using Tools | Administrator Options. For more information, see “Setting Audit Trail Options (vLog VL)” on page 21.
Setting Up and Using vLog—Overview
20 © 2011 Vaisala Canada Inc
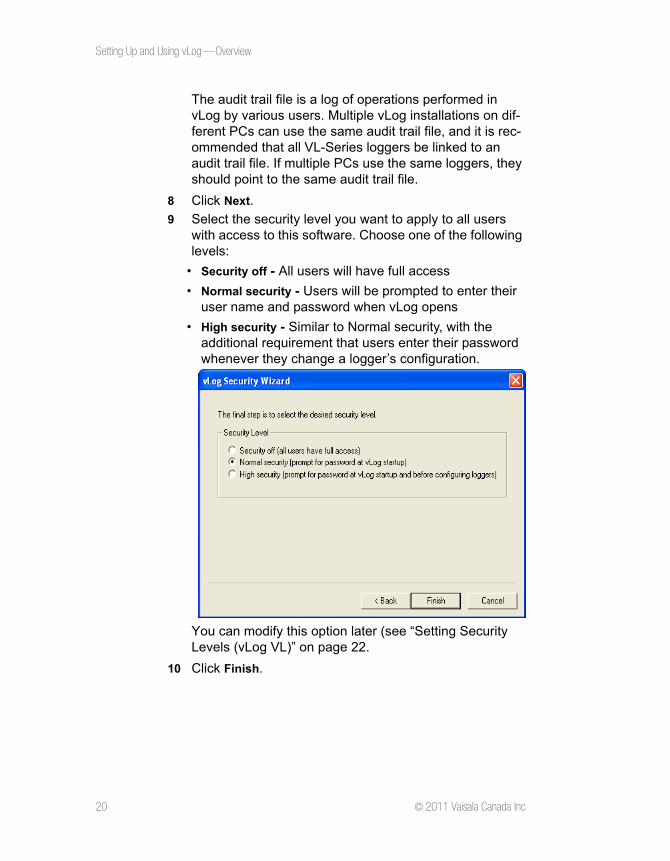
The audit trail file is a log of operations performed in vLog by various users. Multiple vLog installations on dif-ferent PCs can use the same audit trail file, and it is rec-ommended that all VL-Series loggers be linked to an audit trail file. If multiple PCs use the same loggers, they should point to the same audit trail file.
8 Click Next.
9 Select the security level you want to apply to all users with access to this software. Choose one of the following levels:
• Security off - All users will have full access
• Normal security - Users will be prompted to enter their user name and password when vLog opens
• High security - Similar to Normal security, with the additional requirement that users enter their password whenever they change a logger’s configuration.
You can modify this option later (see “Setting Security Levels (vLog VL)” on page 22.
10 Click Finish.
Setting Up and Using vLog—Overview
Vaisala Veriteq vLog 4.5 21
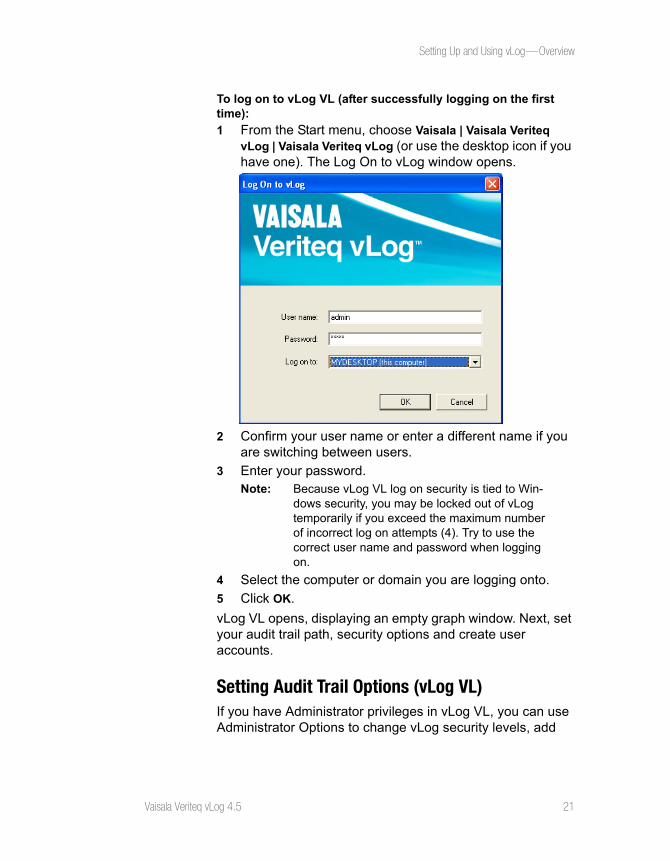
To log on to vLog VL (after successfully logging on the first time):
1 From the Start menu, choose Vaisala | Vaisala Veriteq vLog | Vaisala Veriteq vLog (or use the desktop icon if you have one). The Log On to vLog window opens.
2 Confirm your user name or enter a different name if you are switching between users.
3 Enter your password.Note: Because vLog VL log on security is tied to Win-
dows security, you may be locked out of vLog temporarily if you exceed the maximum number of incorrect log on attempts (4). Try to use the correct user name and password when logging on.
4 Select the computer or domain you are logging onto.
5 Click OK.
vLog VL opens, displaying an empty graph window. Next, set your audit trail path, security options and create user accounts.
Setting Audit Trail Options (vLog VL)If you have Administrator privileges in vLog VL, you can use Administrator Options to change vLog security levels, add
Setting Up and Using vLog—Overview
22 © 2011 Vaisala Canada Inc
and change user accounts and roles, and change where the audit trail file is saved.
To change the path to the audit trail file:
1 In vLog VL, choose Tools | Administrator Options.
2 From the Audit Trail tab, change the folder where the audit trail file is saved.
3 Click OK to save, or Cancel to close without saving.
Setting Security Levels (vLog VL)vLog VL has three security levels:
• Security off - all users will have full access.
• Normal security - users will be prompted to enter their user name and password when vLog opens.
• High security - similar to Normal security, with the additional requirement that users enter their password whenever they change a logger’s configuration.
User accounts also have roles which define their task permissions: Administrators can change security levels and other administrative options, while Users and Guests cannot. For more on user accounts and roles, see “Working with User Accounts (vLog VL)” on page 23.
To change user security levels:
1 In vLog VL, choose Tools | Administrator Options.
Setting Up and Using vLog—Overview
Vaisala Veriteq vLog 4.5 23
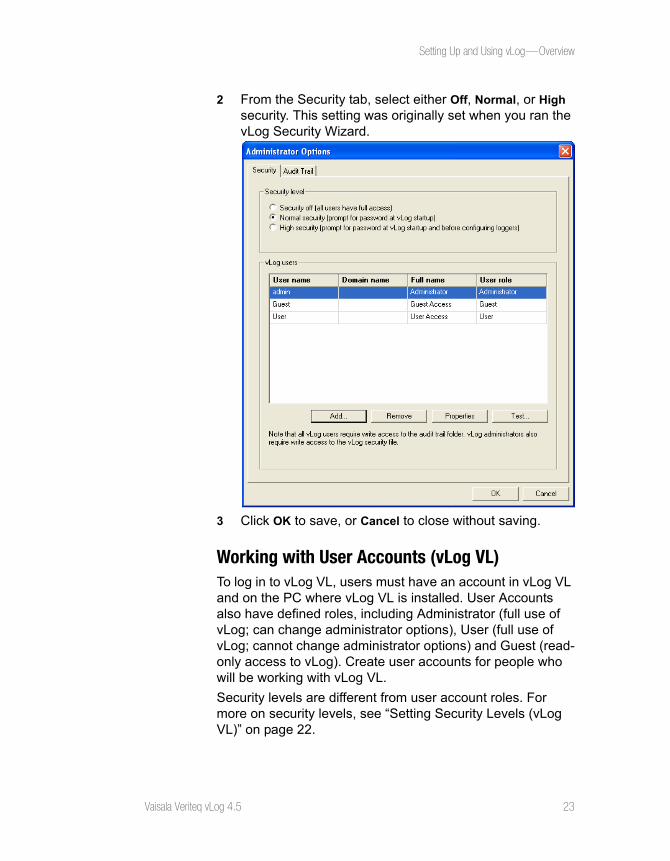
2 From the Security tab, select either Off, Normal, or High security. This setting was originally set when you ran the vLog Security Wizard.
3 Click OK to save, or Cancel to close without saving.
Working with User Accounts (vLog VL)To log in to vLog VL, users must have an account in vLog VL and on the PC where vLog VL is installed. User Accounts also have defined roles, including Administrator (full use of vLog; can change administrator options), User (full use of vLog; cannot change administrator options) and Guest (read-only access to vLog). Create user accounts for people who will be working with vLog VL.
Security levels are different from user account roles. For more on security levels, see “Setting Security Levels (vLog VL)” on page 22.
Setting Up and Using vLog—Overview
24 © 2011 Vaisala Canada Inc
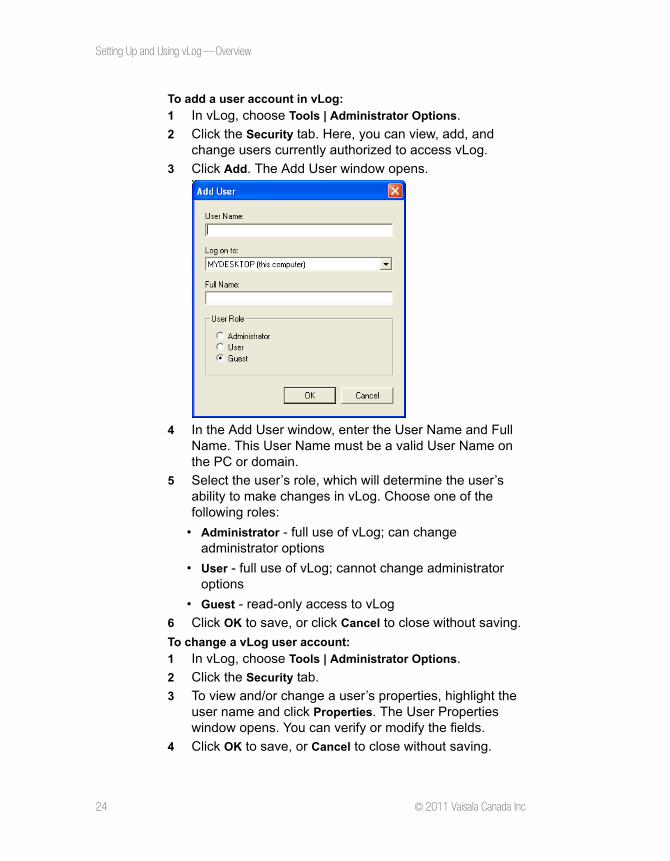
To add a user account in vLog:
1 In vLog, choose Tools | Administrator Options.
2 Click the Security tab. Here, you can view, add, and change users currently authorized to access vLog.
3 Click Add. The Add User window opens.
4 In the Add User window, enter the User Name and Full Name. This User Name must be a valid User Name on the PC or domain.
5 Select the user’s role, which will determine the user’s ability to make changes in vLog. Choose one of the following roles:
• Administrator - full use of vLog; can change administrator options
• User - full use of vLog; cannot change administrator options
• Guest - read-only access to vLog
6 Click OK to save, or click Cancel to close without saving.
To change a vLog user account:
1 In vLog, choose Tools | Administrator Options.
2 Click the Security tab.
3 To view and/or change a user’s properties, highlight the user name and click Properties. The User Properties window opens. You can verify or modify the fields.
4 Click OK to save, or Cancel to close without saving.
Setting Up and Using vLog—Overview
Vaisala Veriteq vLog 4.5 25
To remove a user account from vLog:
1 In vLog, choose Tools | Administrator Options.
2 Click the Security tab.
3 To remove a user, highlight the name and click Remove.
4 Click OK to save, or Cancel to close without saving.
Setting up PC Communication PortsBefore using a Vaisala Veriteq logger with vLog, you must select the correct PC serial communication (COM) port. vLog can support up to 4096 COM ports, numbered COM1 to COM4096.
To select a COM port:
1 Using Windows Device Manager, determine which COM port has been allocated to your logger:
• Windows XP: Start | Settings | Control Panel | System | Hardware | Device Manager
• Windows Server® 2003: Start | Control Panel | System | Hardware | Device Manager
• Windows Server® 2008 or Windows Vista®: Start | Control Panel | System | Device Manager
• Windows® 7: Start | Control Panel | Hardware and sound | Device Manager
Under Ports, make note of the COM port number allo-cated to the logger.
2 In vLog, choose Tools | Options, then choose the General tab.
Configuring Loggers
26 © 2011 Vaisala Canada Inc
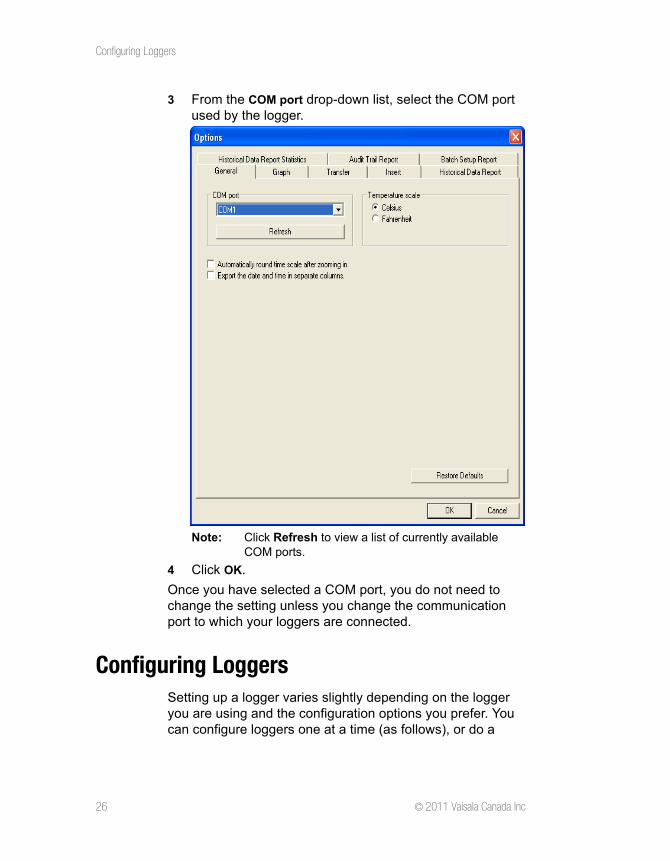
3 From the COM port drop-down list, select the COM port used by the logger.
Note: Click Refresh to view a list of currently available COM ports.
4 Click OK.
Once you have selected a COM port, you do not need to change the setting unless you change the communication port to which your loggers are connected.
Configuring LoggersSetting up a logger varies slightly depending on the logger you are using and the configuration options you prefer. You can configure loggers one at a time (as follows), or do a
Configuring Loggers
Vaisala Veriteq vLog 4.5 27
Batch Setup of multiple loggers (see “Configuring Loggers: Batch Setup (vLog VL)” on page 46).
Note: If you use vLog VL and have high security enabled, you will need to confirm your password to finalize all logger configuration changes. For more on security, see “Setting Security Levels (vLog VL)” on page 22.
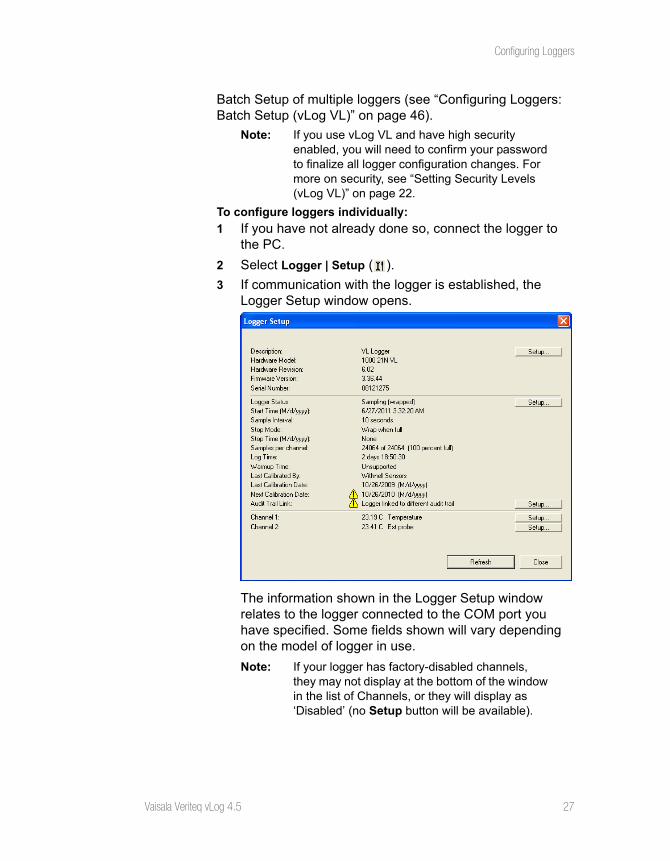
To configure loggers individually:
1 If you have not already done so, connect the logger to the PC.
2 Select Logger | Setup ( ).
3 If communication with the logger is established, the Logger Setup window opens.
The information shown in the Logger Setup window relates to the logger connected to the COM port you have specified. Some fields shown will vary depending on the model of logger in use.
Note: If your logger has factory-disabled channels, they may not display at the bottom of the window in the list of Channels, or they will display as ‘Disabled’ (no Setup button will be available).
Configuring Loggers
28 © 2011 Vaisala Canada Inc
You can use this window to:
• Edit the logger description (see page 31).• Set the sample timing (see page 33).• Enable or disable logger channels (see page 39).• vLog VL: Link loggers to audit trail file (see page 31).
Any changes will only affect the logger currently con-nected to the COM port.
Understanding the Logger Setup WindowThe following table describes the information displayed on the Logger Setup window:
Table 3: Logger Setup window information
DescriptionLogger description (For information on configuring the logger description, see “Configuring Logger Description” on page 31.)
Hardware Model
Hardware model number of the currently-connected logger
Hardware Revision
Hardware version number associated with the currently con-nected logger
Firmware Version
Firmware version associated with the currently connected logger
Serial NumberUnique eight-character product serial number of the currently-connected logger. This number should match the serial number label on the back of the logger.
Logger Status
Indicates the sampling status of the currently-connected logger. The possible modes are:• Sampling: The logger is currently taking samples and the
memory is not full.• Sampling (wrapped): The logger is currently taking samples
with the memory full. The oldest reading is discarded and replaced with the newest.
Configuring Loggers
Vaisala Veriteq vLog 4.5 29
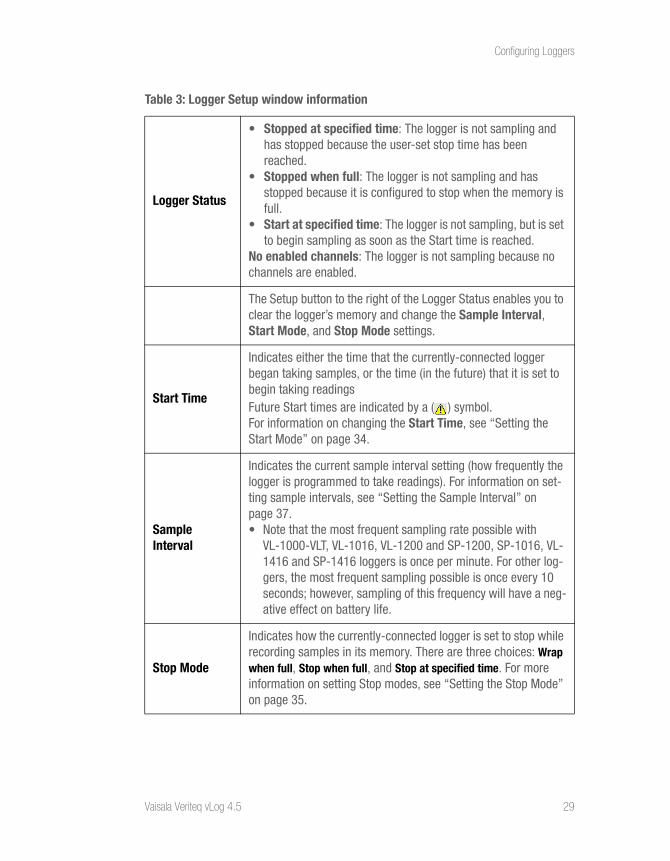
Logger Status
• Stopped at specified time: The logger is not sampling and has stopped because the user-set stop time has been reached.
• Stopped when full: The logger is not sampling and has stopped because it is configured to stop when the memory is full.
• Start at specified time: The logger is not sampling, but is set to begin sampling as soon as the Start time is reached.
No enabled channels: The logger is not sampling because no channels are enabled.
The Setup button to the right of the Logger Status enables you to clear the logger’s memory and change the Sample Interval, Start Mode, and Stop Mode settings.
Start Time
Indicates either the time that the currently-connected logger began taking samples, or the time (in the future) that it is set to begin taking readingsFuture Start times are indicated by a ( ) symbol. For information on changing the Start Time, see “Setting the Start Mode” on page 34.
Sample Interval
Indicates the current sample interval setting (how frequently the logger is programmed to take readings). For information on set-ting sample intervals, see “Setting the Sample Interval” on page 37. • Note that the most frequent sampling rate possible with
VL-1000-VLT, VL-1016, VL-1200 and SP-1200, SP-1016, VL-1416 and SP-1416 loggers is once per minute. For other log-gers, the most frequent sampling possible is once every 10 seconds; however, sampling of this frequency will have a neg-ative effect on battery life.
Stop Mode
Indicates how the currently-connected logger is set to stop while recording samples in its memory. There are three choices: Wrap when full, Stop when full, and Stop at specified time. For more information on setting Stop modes, see “Setting the Stop Mode” on page 35.
Table 3: Logger Setup window information
Configuring Loggers
30 © 2011 Vaisala Canada Inc
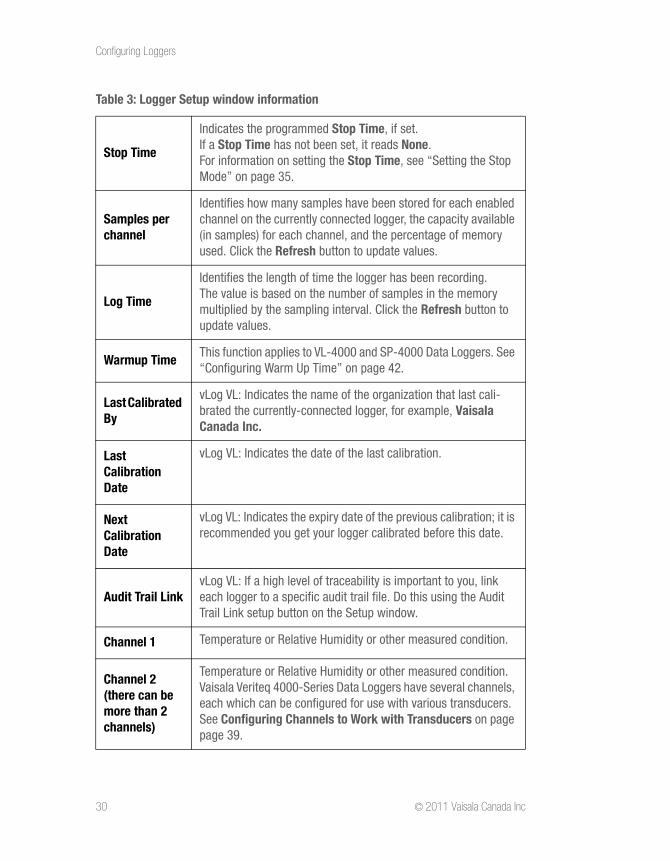
Stop Time
Indicates the programmed Stop Time, if set.If a Stop Time has not been set, it reads None.For information on setting the Stop Time, see “Setting the Stop Mode” on page 35.
Samples per channel
Identifies how many samples have been stored for each enabled channel on the currently connected logger, the capacity available (in samples) for each channel, and the percentage of memory used. Click the Refresh button to update values.
Log Time
Identifies the length of time the logger has been recording.The value is based on the number of samples in the memory multiplied by the sampling interval. Click the Refresh button to update values.
Warmup TimeThis function applies to VL-4000 and SP-4000 Data Loggers. See “Configuring Warm Up Time” on page 42.
Last Calibrated By
vLog VL: Indicates the name of the organization that last cali-brated the currently-connected logger, for example, Vaisala Canada Inc.
Last Calibration Date
vLog VL: Indicates the date of the last calibration.
Next Calibration Date
vLog VL: Indicates the expiry date of the previous calibration; it is recommended you get your logger calibrated before this date.
Audit Trail LinkvLog VL: If a high level of traceability is important to you, link each logger to a specific audit trail file. Do this using the Audit Trail Link setup button on the Setup window.
Channel 1 Temperature or Relative Humidity or other measured condition.
Channel 2(there can be more than 2 channels)
Temperature or Relative Humidity or other measured condition. Vaisala Veriteq 4000-Series Data Loggers have several channels, each which can be configured for use with various transducers. See Configuring Channels to Work with Transducers on page page 39.
Table 3: Logger Setup window information
Configuring Loggers
Vaisala Veriteq vLog 4.5 31
Linking Loggers to an Audit Trail File (vLog VL)If you use vLog VL and have enabled security, it is very important to link loggers to a specific audit trail file so you can see the exact configuration changes that have occurred over time. This linkage only needs to be done once per logger. You will know a logger is not linked to an audit trail when you open the Logger Setup window and see the alert, “Logger is not linked to audit trail.”
To link a logger to an audit trail file:
1 From Logger | Setup, click the Setup button in the row for Audit Trail Link.
2 You are prompted to link this logger to the audit trail file. Click Yes.
Now that the logger is linked to an audit trail file, changes made to the logger settings are tracked in the audit trail. To make changes to a logger linked to an audit trail, a user must first log on to a computer connected to the same audit trail.
Configuring Logger DescriptionThe Logger Description helps identify a logger every time you communicate with it. Using a description that refers to the application or location of the logger, and checking the logger description prior to each use, is a quick way to ensure you are connected to the correct logger.
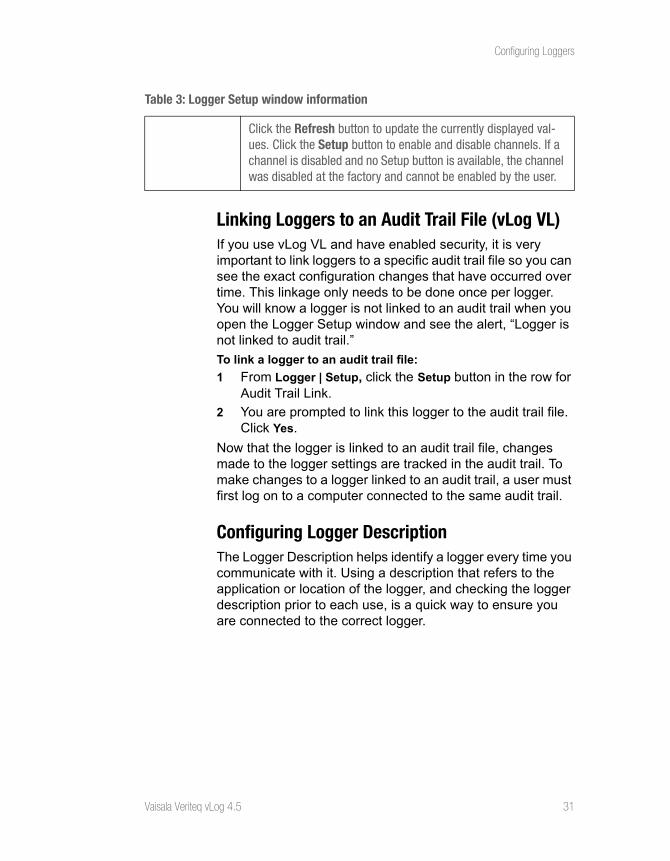
Click the Refresh button to update the currently displayed val-ues. Click the Setup button to enable and disable channels. If a channel is disabled and no Setup button is available, the channel was disabled at the factory and cannot be enabled by the user.
Table 3: Logger Setup window information
Configuring Loggers
32 © 2011 Vaisala Canada Inc
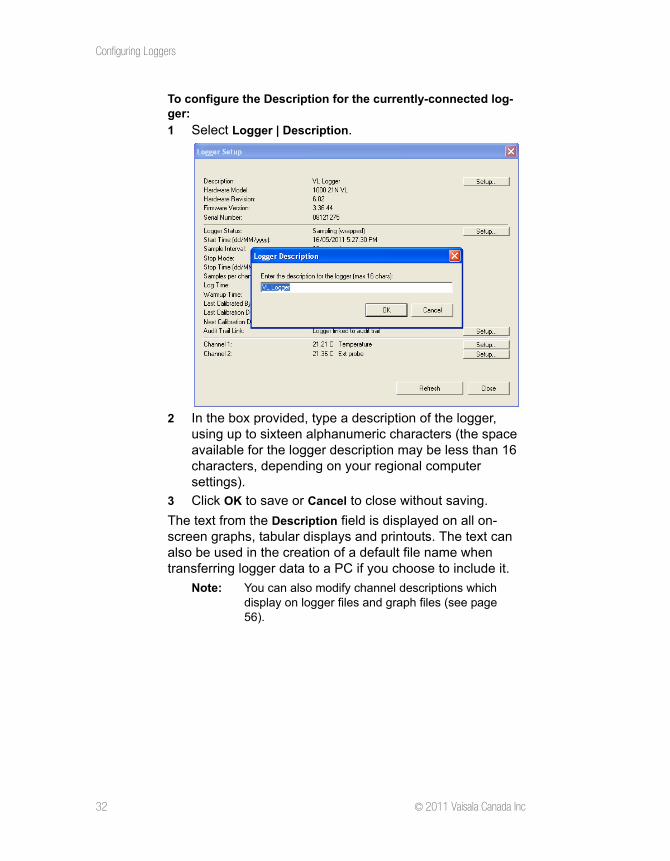
To configure the Description for the currently-connected log-ger:
1 Select Logger | Description.
2 In the box provided, type a description of the logger, using up to sixteen alphanumeric characters (the space available for the logger description may be less than 16 characters, depending on your regional computer settings).
3 Click OK to save or Cancel to close without saving.
The text from the Description field is displayed on all on-screen graphs, tabular displays and printouts. The text can also be used in the creation of a default file name when transferring logger data to a PC if you choose to include it.
Note: You can also modify channel descriptions which display on logger files and graph files (see page 56).
Configuring Loggers
Vaisala Veriteq vLog 4.5 33
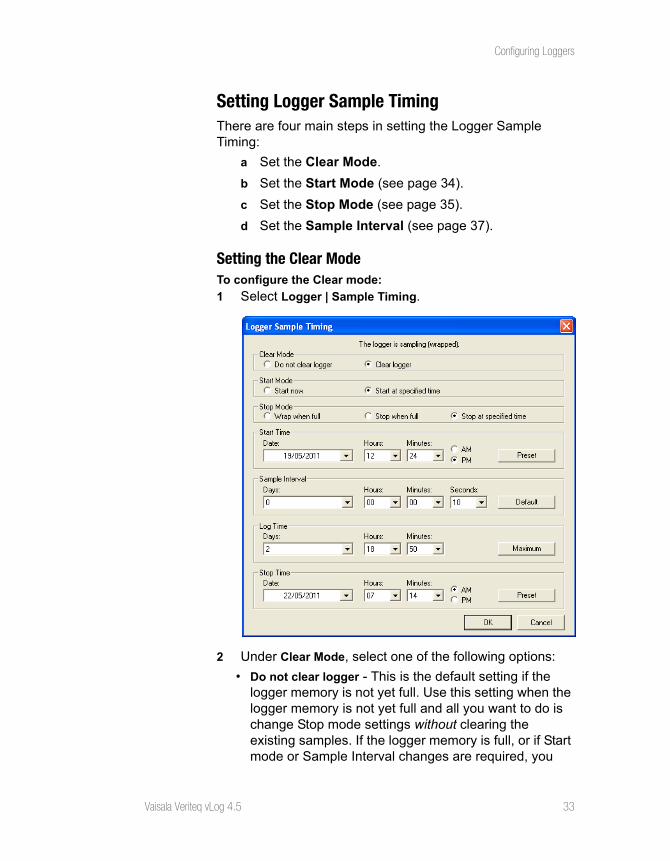
Setting Logger Sample TimingThere are four main steps in setting the Logger Sample Timing:
a Set the Clear Mode.
b Set the Start Mode (see page 34).
c Set the Stop Mode (see page 35).
d Set the Sample Interval (see page 37).
Setting the Clear ModeTo configure the Clear mode:
1 Select Logger | Sample Timing.
2 Under Clear Mode, select one of the following options:
• Do not clear logger - This is the default setting if the logger memory is not yet full. Use this setting when the logger memory is not yet full and all you want to do is change Stop mode settings without clearing the existing samples. If the logger memory is full, or if Start mode or Sample Interval changes are required, you
Configuring Loggers
34 © 2011 Vaisala Canada Inc
must use the Clear Logger setting to make the necessary changes.
• Clear Logger - This is the default setting if the logger memory is full. The Clear Logger setting allows you to modify both Start and Stop mode parameters and change Sample Interval values. Choosing this setting results in the logger’s memory being cleared following completion of the setup changes. You will lose data unless you transfer it first. If you are in doubt as to whether the information on the logger is still valuable, first make a copy of the data using Logger | Transfer, and then make the necessary logger setup changes.
When you choose Clear logger, the Start Mode and Stop Mode radio buttons become available.
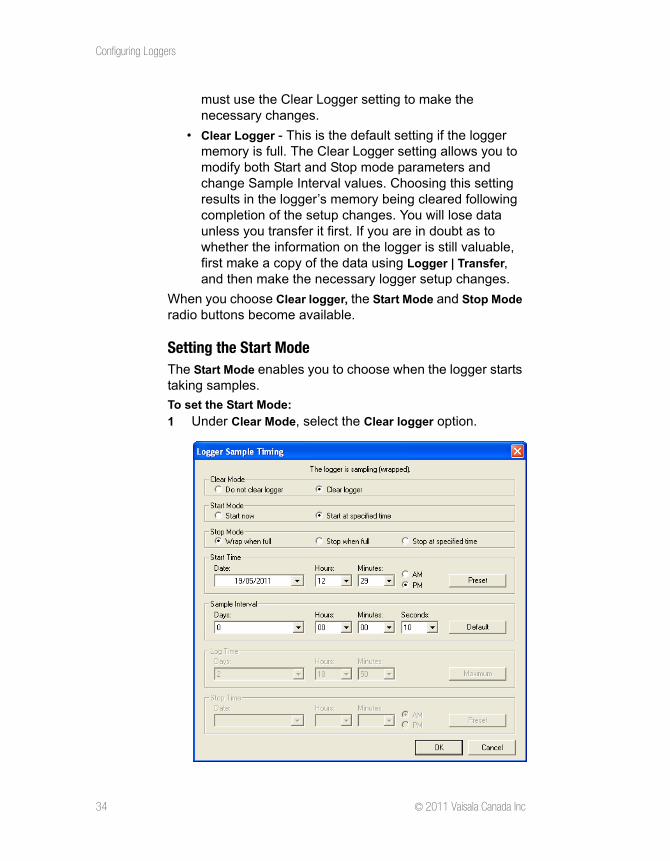
Setting the Start ModeThe Start Mode enables you to choose when the logger starts taking samples.
To set the Start Mode:
1 Under Clear Mode, select the Clear logger option.
Configuring Loggers
Vaisala Veriteq vLog 4.5 35
2 Under Start Mode, select one of the following options:
• Start now - This option sets a connected logger to start taking samples immediately (within one sample interval) after the changes in the Logger Sample Timing window have been applied to the logger’s memory.
• Start at specified time - This option sets a connected logger to start taking samples at a pre-defined date and time in the future. Until then, the logger remains dormant. This delayed start feature helps to save logger memory and minimizes the collection of unwanted data. You can also use the Start Time option to ensure that multiple loggers are synchronized to start logging at the same time.
3 When you choose the Start at specified time option, the Start Time section of the Logger Sample Timing window becomes available. Use the Date, Hours, and Minutes drop-down lists and AM/PM radio buttons to set the time you want the logger to begin recording samples. Note: You cannot choose a date or time earlier than
the current date and time values.
If desired, use the Preset button to automatically set the start time hours and minutes to the earliest possible set-ting for the date selected. For any day other than the cur-rent day, this value is 12:00AM.
You can use the Start at specified time option in conjunction with the Stop at specified time option to create a pre-defined logger monitoring period.
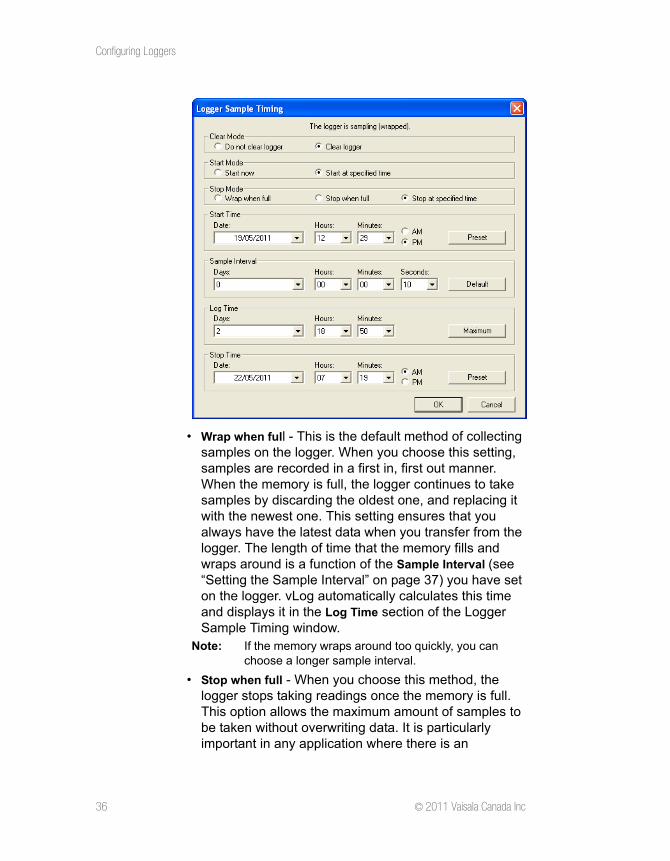
Setting the Stop ModeThe Stop Mode enables you to choose how the connected logger operates once the memory is full, or when a specified time is reached.
To set the Stop Mode:
Under Stop Mode, select one of the following options:
Configuring Loggers
36 © 2011 Vaisala Canada Inc
• Wrap when full - This is the default method of collecting samples on the logger. When you choose this setting, samples are recorded in a first in, first out manner. When the memory is full, the logger continues to take samples by discarding the oldest one, and replacing it with the newest one. This setting ensures that you always have the latest data when you transfer from the logger. The length of time that the memory fills and wraps around is a function of the Sample Interval (see “Setting the Sample Interval” on page 37) you have set on the logger. vLog automatically calculates this time and displays it in the Log Time section of the Logger Sample Timing window.
Note: If the memory wraps around too quickly, you can choose a longer sample interval.
• Stop when full - When you choose this method, the logger stops taking readings once the memory is full. This option allows the maximum amount of samples to be taken without overwriting data. It is particularly important in any application where there is an
Configuring Loggers
Vaisala Veriteq vLog 4.5 37
excessive time delay between the gathering of the data and the transferring of that data to the PC.
• Stop at specified time - This method enables you to set a precise time for a logger to stop recording data. When you choose this setting, both the Log Time and Stop Time sections of the Logger Sample Timing window are available.
The Log Time drop-down lists enable you to set an elapsed time for the logger to collect samples. For example, you can set the logger to collect samples for 24 hours, 48 hours, 7 days, and so on.
The Stop Time drop-down lists enable you to set absolute date and time values for when the logger is to stop taking samples.
Note: The Log Time and Stop Time options are interre-lated. Setting the Log Time to a specified period automatically adjusts the Stop Time values. Adjusting the Stop Time Date and Time values, in turn, automatically adjusts the Log Time val-ues.
Setting the Sample IntervalYou can change the sample interval on the logger to suit the requirements of the application. You can also set up more frequent sampling intervals to capture rapidly changing data, or spread out the readings to conserve memory usage and cover extended monitoring periods.
Note: You can only change sample intervals if you set the Clear Mode to the Clear logger setting (“Set-ting the Clear Mode” on page 33).
Configuring Loggers
38 © 2011 Vaisala Canada Inc
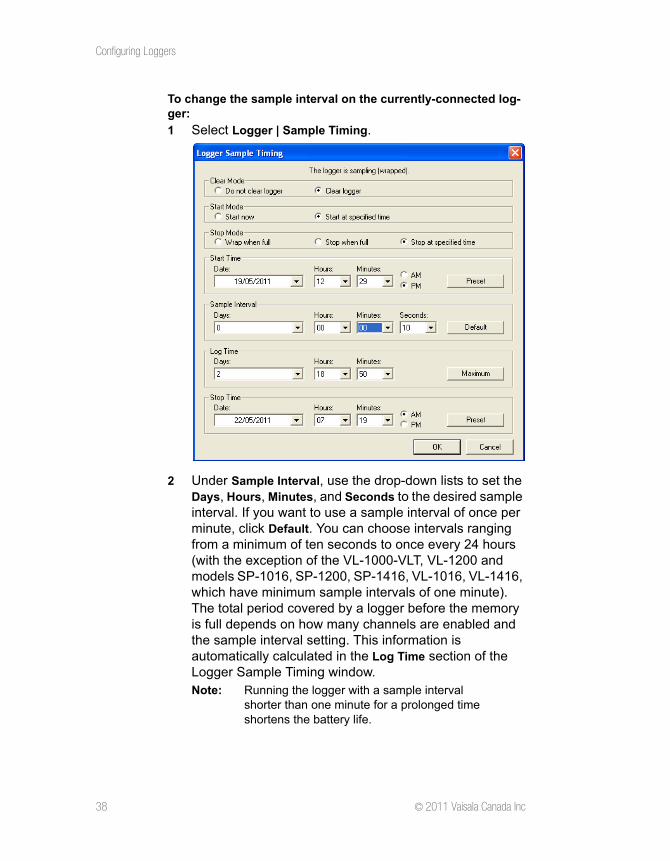
To change the sample interval on the currently-connected log-ger:
1 Select Logger | Sample Timing.
2 Under Sample Interval, use the drop-down lists to set the Days, Hours, Minutes, and Seconds to the desired sample interval. If you want to use a sample interval of once per minute, click Default. You can choose intervals ranging from a minimum of ten seconds to once every 24 hours (with the exception of the VL-1000-VLT, VL-1200 and models SP-1016, SP-1200, SP-1416, VL-1016, VL-1416, which have minimum sample intervals of one minute). The total period covered by a logger before the memory is full depends on how many channels are enabled and the sample interval setting. This information is automatically calculated in the Log Time section of the Logger Sample Timing window.Note: Running the logger with a sample interval
shorter than one minute for a prolonged time shortens the battery life.
Configuring Loggers
Vaisala Veriteq vLog 4.5 39
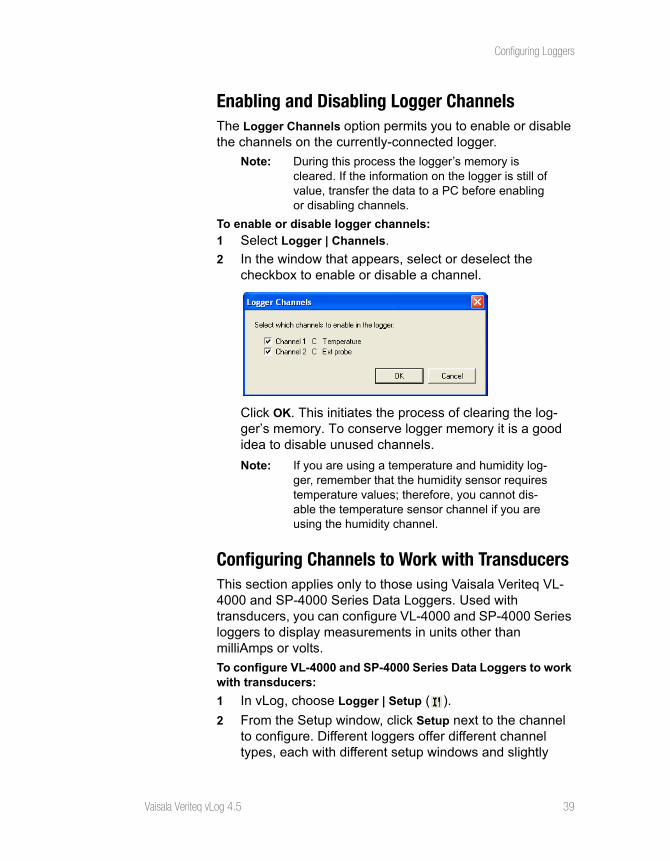
Enabling and Disabling Logger ChannelsThe Logger Channels option permits you to enable or disable the channels on the currently-connected logger.
Note: During this process the logger’s memory is cleared. If the information on the logger is still of value, transfer the data to a PC before enabling or disabling channels.
To enable or disable logger channels:
1 Select Logger | Channels.
2 In the window that appears, select or deselect the checkbox to enable or disable a channel.
Click OK. This initiates the process of clearing the log-ger’s memory. To conserve logger memory it is a good idea to disable unused channels.
Note: If you are using a temperature and humidity log-ger, remember that the humidity sensor requires temperature values; therefore, you cannot dis-able the temperature sensor channel if you are using the humidity channel.
Configuring Channels to Work with TransducersThis section applies only to those using Vaisala Veriteq VL-4000 and SP-4000 Series Data Loggers. Used with transducers, you can configure VL-4000 and SP-4000 Series loggers to display measurements in units other than milliAmps or volts.
To configure VL-4000 and SP-4000 Series Data Loggers to work with transducers:
1 In vLog, choose Logger | Setup ( ).
2 From the Setup window, click Setup next to the channel to configure. Different loggers offer different channel types, each with different setup windows and slightly
Configuring Loggers
40 © 2011 Vaisala Canada Inc
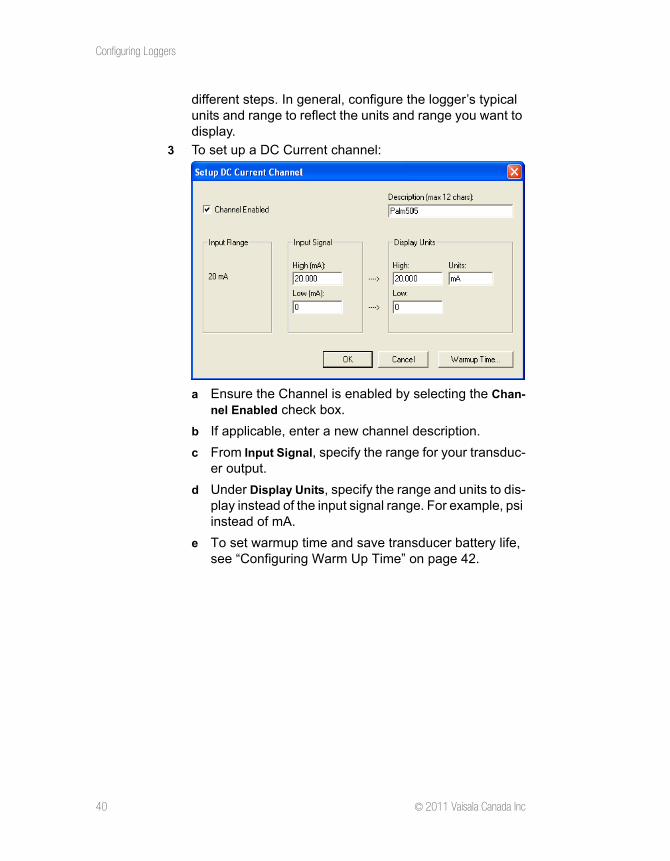
different steps. In general, configure the logger’s typical units and range to reflect the units and range you want to display.
3 To set up a DC Current channel:
a Ensure the Channel is enabled by selecting the Chan-nel Enabled check box.
b If applicable, enter a new channel description.
c From Input Signal, specify the range for your transduc-er output.
d Under Display Units, specify the range and units to dis-play instead of the input signal range. For example, psi instead of mA.
e To set warmup time and save transducer battery life, see “Configuring Warm Up Time” on page 42.
Configuring Loggers
Vaisala Veriteq vLog 4.5 41
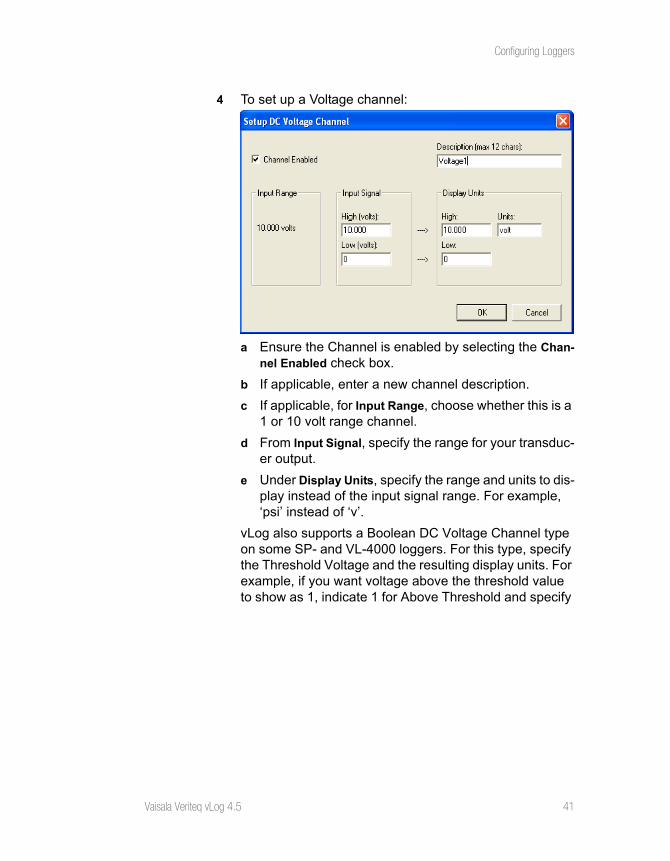
4 To set up a Voltage channel:
a Ensure the Channel is enabled by selecting the Chan-nel Enabled check box.
b If applicable, enter a new channel description.
c If applicable, for Input Range, choose whether this is a 1 or 10 volt range channel.
d From Input Signal, specify the range for your transduc-er output.
e Under Display Units, specify the range and units to dis-play instead of the input signal range. For example, ‘psi’ instead of ‘v’.
vLog also supports a Boolean DC Voltage Channel type on some SP- and VL-4000 loggers. For this type, specify the Threshold Voltage and the resulting display units. For example, if you want voltage above the threshold value to show as 1, indicate 1 for Above Threshold and specify
Configuring Loggers
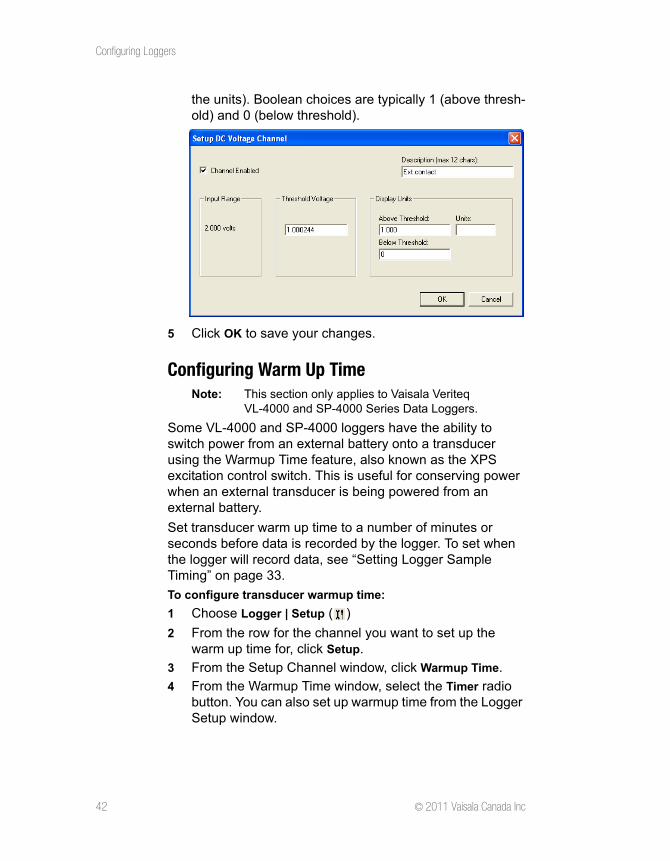
42 © 2011 Vaisala Canada Inc
the units). Boolean choices are typically 1 (above thresh-old) and 0 (below threshold).
5 Click OK to save your changes.
Configuring Warm Up TimeNote: This section only applies to Vaisala Veriteq
VL-4000 and SP-4000 Series Data Loggers.
Some VL-4000 and SP-4000 loggers have the ability to switch power from an external battery onto a transducer using the Warmup Time feature, also known as the XPS excitation control switch. This is useful for conserving power when an external transducer is being powered from an external battery.
Set transducer warm up time to a number of minutes or seconds before data is recorded by the logger. To set when the logger will record data, see “Setting Logger Sample Timing” on page 33.
To configure transducer warmup time:
1 Choose Logger | Setup ( )
2 From the row for the channel you want to set up the warm up time for, click Setup.
3 From the Setup Channel window, click Warmup Time.
4 From the Warmup Time window, select the Timer radio button. You can also set up warmup time from the Logger Setup window.
Configuring Loggers
Vaisala Veriteq vLog 4.5 43
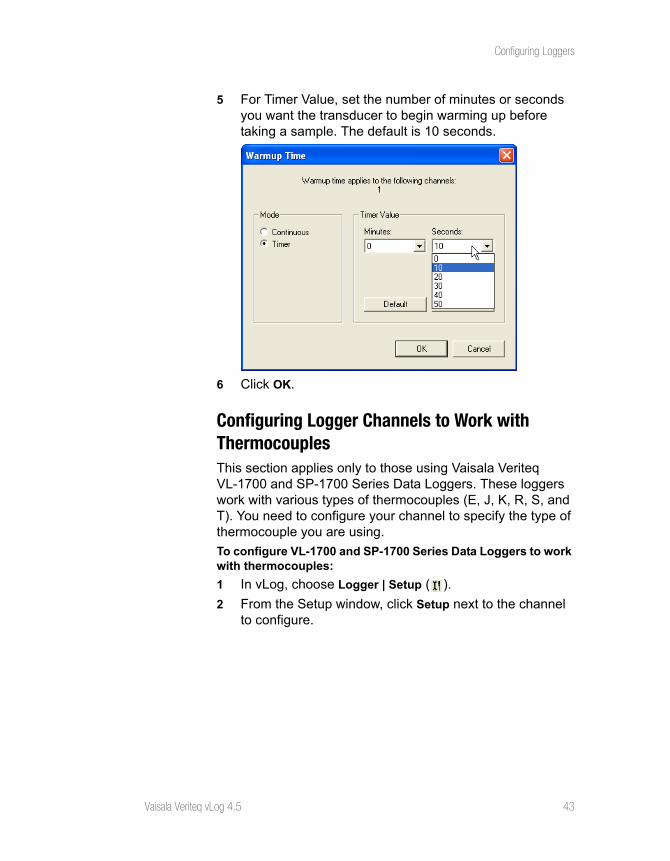
5 For Timer Value, set the number of minutes or seconds you want the transducer to begin warming up before taking a sample. The default is 10 seconds.
6 Click OK.
Configuring Logger Channels to Work with ThermocouplesThis section applies only to those using Vaisala Veriteq VL-1700 and SP-1700 Series Data Loggers. These loggers work with various types of thermocouples (E, J, K, R, S, and T). You need to configure your channel to specify the type of thermocouple you are using.
To configure VL-1700 and SP-1700 Series Data Loggers to work with thermocouples:
1 In vLog, choose Logger | Setup ( ).
2 From the Setup window, click Setup next to the channel to configure.
Configuring Loggers
44 © 2011 Vaisala Canada Inc
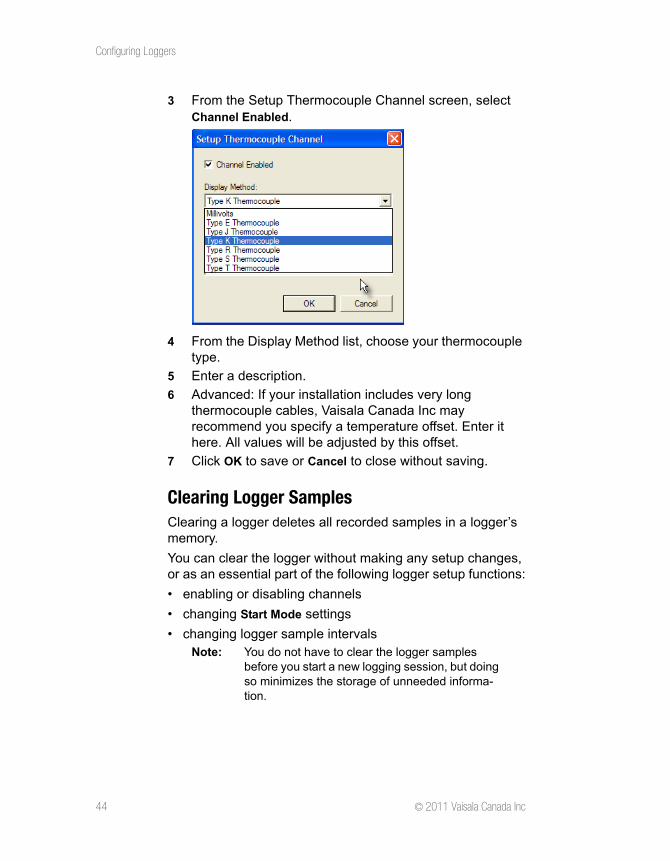
3 From the Setup Thermocouple Channel screen, select Channel Enabled.
4 From the Display Method list, choose your thermocouple type.
5 Enter a description.
6 Advanced: If your installation includes very long thermocouple cables, Vaisala Canada Inc may recommend you specify a temperature offset. Enter it here. All values will be adjusted by this offset.
7 Click OK to save or Cancel to close without saving.
Clearing Logger SamplesClearing a logger deletes all recorded samples in a logger’s memory.
You can clear the logger without making any setup changes, or as an essential part of the following logger setup functions:
• enabling or disabling channels
• changing Start Mode settings
• changing logger sample intervalsNote: You do not have to clear the logger samples
before you start a new logging session, but doing so minimizes the storage of unneeded informa-tion.
Configuring Loggers
Vaisala Veriteq vLog 4.5 45
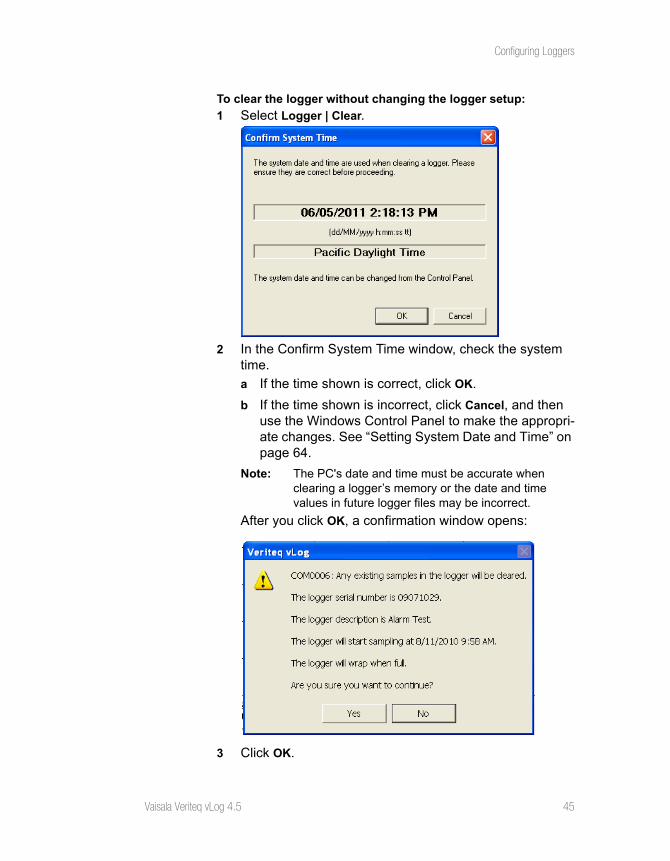
To clear the logger without changing the logger setup:
1 Select Logger | Clear.
2 In the Confirm System Time window, check the system time.
a If the time shown is correct, click OK.
b If the time shown is incorrect, click Cancel, and then use the Windows Control Panel to make the appropri-ate changes. See “Setting System Date and Time” on page 64.
Note: The PC's date and time must be accurate when clearing a logger’s memory or the date and time values in future logger files may be incorrect.
After you click OK, a confirmation window opens:
3 Click OK.
Configuring Loggers: Batch Setup (vLog VL)
46 © 2011 Vaisala Canada Inc
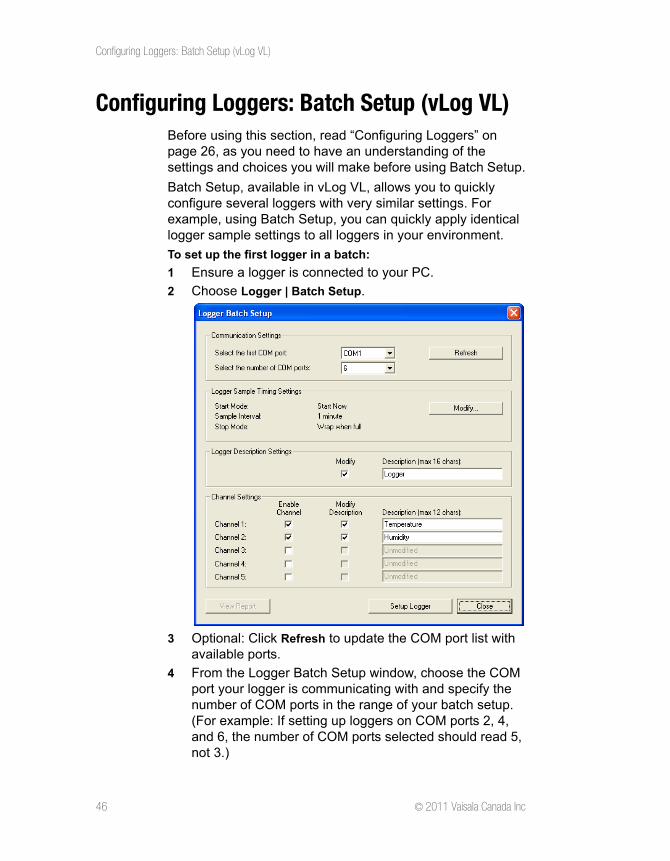
Configuring Loggers: Batch Setup (vLog VL)Before using this section, read “Configuring Loggers” on page 26, as you need to have an understanding of the settings and choices you will make before using Batch Setup.
Batch Setup, available in vLog VL, allows you to quickly configure several loggers with very similar settings. For example, using Batch Setup, you can quickly apply identical logger sample settings to all loggers in your environment.
To set up the first logger in a batch:
1 Ensure a logger is connected to your PC.
2 Choose Logger | Batch Setup.
3 Optional: Click Refresh to update the COM port list with available ports.
4 From the Logger Batch Setup window, choose the COM port your logger is communicating with and specify the number of COM ports in the range of your batch setup. (For example: If setting up loggers on COM ports 2, 4, and 6, the number of COM ports selected should read 5, not 3.)
Configuring Loggers: Batch Setup (vLog VL)
Vaisala Veriteq vLog 4.5 47
5 To set logger sample timing settings, click Modify in the Logger Sample Timing Settings area. In the window that appears, set start mode, stop mode, sample interval, and so on. Click OK.
6 To set logger description, select the Modify checkbox and enter a new description (depending on your regional font settings, the space available for the description may be less than 16 characters).
7 If desired, enable or disable channels.
8 To modify channel descriptions, select the Modify Description checkbox for the channel to modify and enter a new description.
9 Click Setup Logger (you can click Close to close without saving).
10 If security is enabled, enter your password, then click OK.
11 When the Confirm System Time dialog appears confirm the exact time before clearing the logger. Click OK.
12 Confirm any changes to the description(s). Click OK.
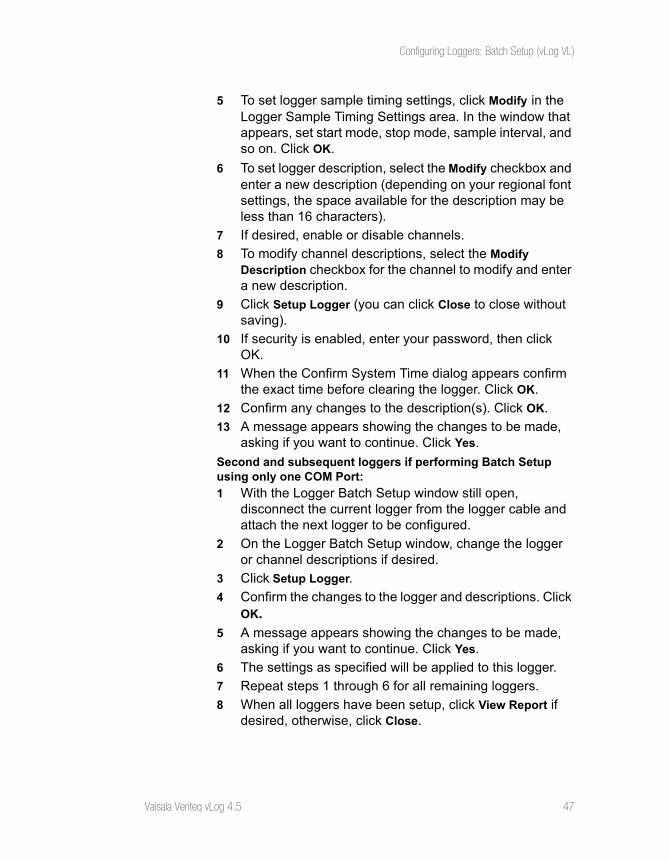
13 A message appears showing the changes to be made, asking if you want to continue. Click Yes.
Second and subsequent loggers if performing Batch Setup using only one COM Port:
1 With the Logger Batch Setup window still open, disconnect the current logger from the logger cable and attach the next logger to be configured.
2 On the Logger Batch Setup window, change the logger or channel descriptions if desired.
3 Click Setup Logger.
4 Confirm the changes to the logger and descriptions. Click OK.
5 A message appears showing the changes to be made, asking if you want to continue. Click Yes.
6 The settings as specified will be applied to this logger.
7 Repeat steps 1 through 6 for all remaining loggers.
8 When all loggers have been setup, click View Report if desired, otherwise, click Close.
Mounting Loggers
48 © 2011 Vaisala Canada Inc
Second and subsequent loggers if performing Batch Setup using multiple COM ports (vLog VL):
1 The Confirm Description dialog box opens for the next COM port.
2 If this COM port is assigned to a logger you wish to setup with the same Sample Timing settings as the first logger, skip to step 5. If this COM port is not assigned to a logger you wish to setup, click Cancel.
3 A message appears, asking if you would like to abort the batch setup. Click No.
4 Repeat from step 1 until you reach a COM port which is assigned to a logger you wish to setup.
5 In the Confirm Descriptions dialog box, change the Logger and Channel Descriptions as desired. Click OK.
6 A message appears showing the changes to be made, asking if you want to continue. Click Yes.
7 Repeat from step 1 for all remaining loggers.
8 When all loggers have been setup, click View Report if desired, otherwise, click Close.
Mounting LoggersBecause they are small and light, you can easily mount Vaisala Veriteq loggers in the field using a variety of techniques including Velcro strips, double-sided tape, duct tape, and magnetic strips.
In harsh environments, place the logger in a standard industrially-rated enclosure, and run external sensors and probes from the enclosure using special fittings in the openings.
Some tips for placing loggers:
• Ventilation - Do not obstruct the air passage holes in the logger. There should be a clear path for the air to get to the internal sensors (if they are used or available).
• Vibration - Excessive vibration can knock the unit off its mounting. If the location is subject to excessive jarring or vibration, mount the logger more securely.
• Temperature - Excessive temperature (low or high) can affect adhesives.
Using External Temperature Probes
Vaisala Veriteq vLog 4.5 49
• Moisture - Moisture can also affect the adhesive durability.
• Permanence - Make sure the mounting location is permanent for the duration of the recording period.
• Public access - If the logger location is too visible, people may interfere with the readings. Make sure it is not too accessible.
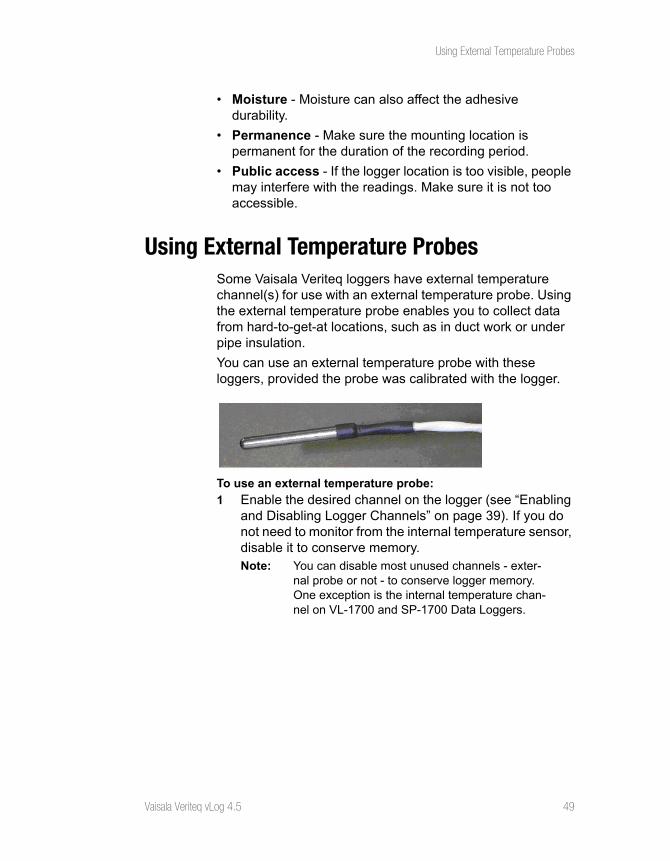
Using External Temperature ProbesSome Vaisala Veriteq loggers have external temperature channel(s) for use with an external temperature probe. Using the external temperature probe enables you to collect data from hard-to-get-at locations, such as in duct work or under pipe insulation.
You can use an external temperature probe with these loggers, provided the probe was calibrated with the logger.
To use an external temperature probe:
1 Enable the desired channel on the logger (see “Enabling and Disabling Logger Channels” on page 39). If you do not need to monitor from the internal temperature sensor, disable it to conserve memory. Note: You can disable most unused channels - exter-
nal probe or not - to conserve logger memory. One exception is the internal temperature chan-nel on VL-1700 and SP-1700 Data Loggers.
Caring for Relative Humidity Sensors
50 © 2011 Vaisala Canada Inc
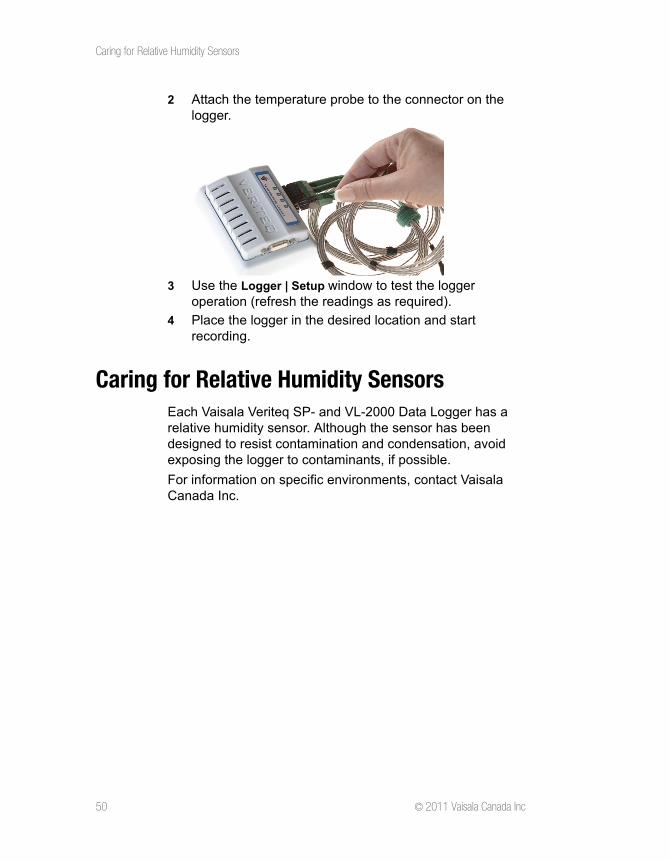
2 Attach the temperature probe to the connector on the logger.
3 Use the Logger | Setup window to test the logger operation (refresh the readings as required).
4 Place the logger in the desired location and start recording.
Caring for Relative Humidity SensorsEach Vaisala Veriteq SP- and VL-2000 Data Logger has a relative humidity sensor. Although the sensor has been designed to resist contamination and condensation, avoid exposing the logger to contaminants, if possible.
For information on specific environments, contact Vaisala Canada Inc.
Vaisala Veriteq vLog 4.5 51
Chapter 3: Transferring Logger Files
This section provides details about:
• transferring logger data and setting transfer preferences
• generating a logger file creation report and ID number (vLog VL)
• setting the system date and time
• changing the time zone
• transferring logger data in batches to your PC (vLog VL)
Transferring Data
52 © 2011 Vaisala Canada Inc
Transferring DataWhen you transfer data from a logger’s memory, vLog creates a copy of the data and stores it on your PC as a logger file.
Logger transfers can be performed either individually (logger by logger) or in a batch (by selecting a range of COM ports using vLog VL).
Data from secure loggers (VL loggers) is stored in secure logger files. Data from non-secure loggers (SP loggers) is stored in non-secure logger files. All logger files have the .spl extension, logger files from SP loggers are non-secure and can be opened in vLog SP or vLog VL. Files from VL loggers are secure and can only be opened in vLog VL.
After inserting a logger file into vLog, you can view the information as a graph or as a tabular report.
VL Data Loggers (vLog VL)During the data transfer process, vLog generates a Logger File Creation Report and a unique Logger File ID Number for VL-Series loggers. The Logger File ID Number also appears in the Logger file and on the graph and provides a convenient way to track the data from the logger to the final Graph file. The transfer process does not affect or delete the data in the logger.
Before transferring data, you may want to set the transfer preferences, and ensure that you have write permission to the folder on the PC where you are going to save your transferred data as logger files.
Setting Transfer PreferencesThere are a variety of logger configuration preferences available to you:
• Configure the default file name format for logger files to help manage file storage.
• Configure vLog VL to display a Logger File Creation Report after the transfer. This report displays all the details of the transfer. It can be printed and it provides a secure and verifiable link between logger files and printed
Transferring Data
Vaisala Veriteq vLog 4.5 53
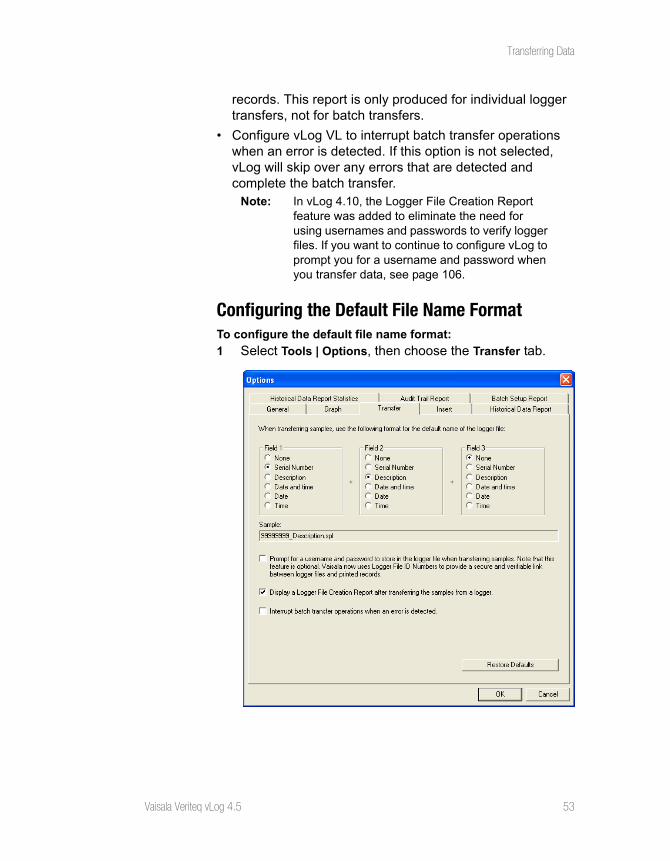
records. This report is only produced for individual logger transfers, not for batch transfers.
• Configure vLog VL to interrupt batch transfer operations when an error is detected. If this option is not selected, vLog will skip over any errors that are detected and complete the batch transfer.
Note: In vLog 4.10, the Logger File Creation Report feature was added to eliminate the need for using usernames and passwords to verify logger files. If you want to continue to configure vLog to prompt you for a username and password when you transfer data, see page 106.
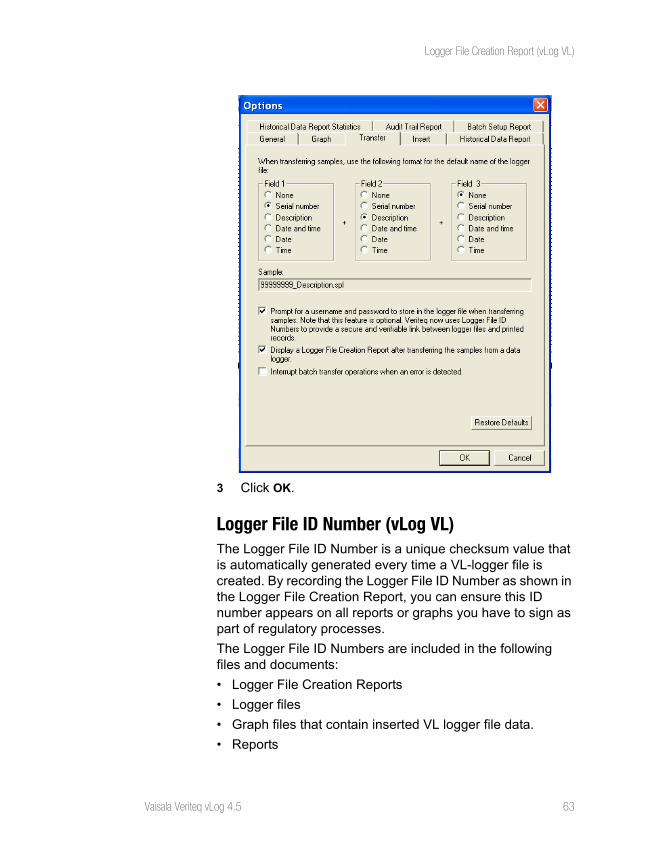
Configuring the Default File Name FormatTo configure the default file name format:
1 Select Tools | Options, then choose the Transfer tab.
Transferring Data
54 © 2011 Vaisala Canada Inc
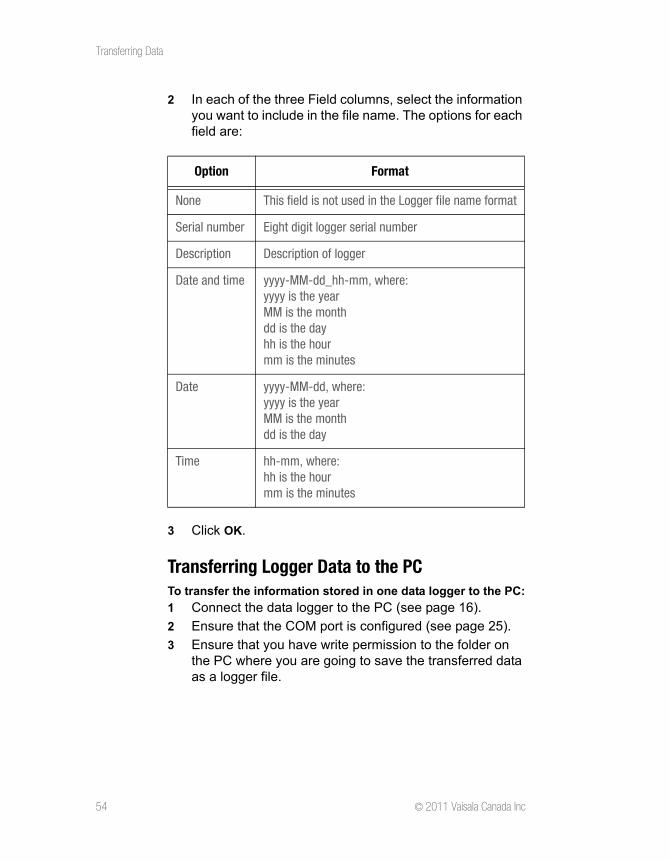
2 In each of the three Field columns, select the information you want to include in the file name. The options for each field are:
3 Click OK.
Transferring Logger Data to the PCTo transfer the information stored in one data logger to the PC:
1 Connect the data logger to the PC (see page 16).
2 Ensure that the COM port is configured (see page 25).
3 Ensure that you have write permission to the folder on the PC where you are going to save the transferred data as a logger file.
Option Format
None This field is not used in the Logger file name format
Serial number Eight digit logger serial number
Description Description of logger
Date and time yyyy-MM-dd_hh-mm, where: yyyy is the yearMM is the monthdd is the dayhh is the hourmm is the minutes
Date yyyy-MM-dd, where:yyyy is the yearMM is the monthdd is the day
Time hh-mm, where:hh is the hourmm is the minutes
Transferring Data
Vaisala Veriteq vLog 4.5 55
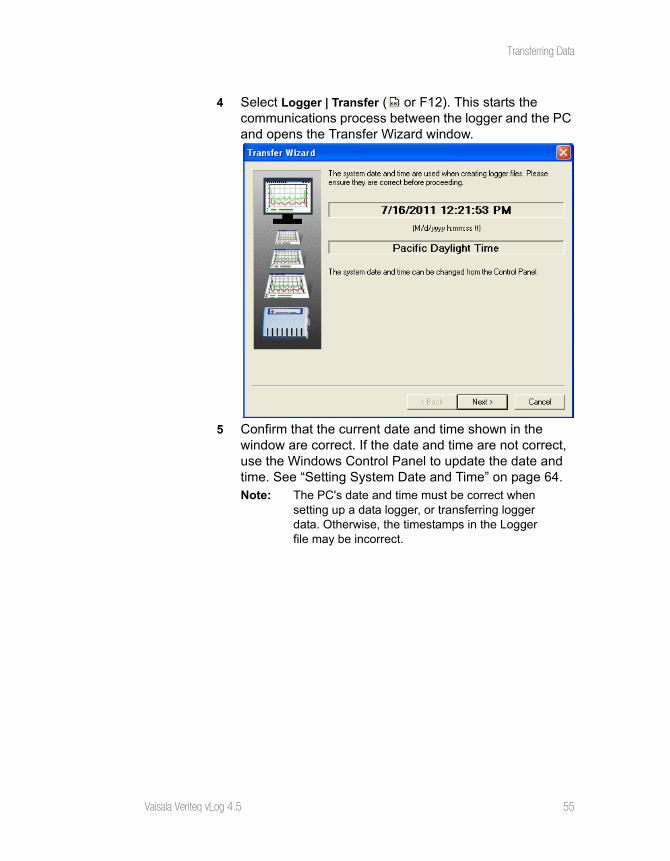
4 Select Logger | Transfer ( or F12). This starts the communications process between the logger and the PC and opens the Transfer Wizard window.
5 Confirm that the current date and time shown in the window are correct. If the date and time are not correct, use the Windows Control Panel to update the date and time. See “Setting System Date and Time” on page 64.Note: The PC's date and time must be correct when
setting up a data logger, or transferring logger data. Otherwise, the timestamps in the Logger file may be incorrect.
Transferring Data
56 © 2011 Vaisala Canada Inc
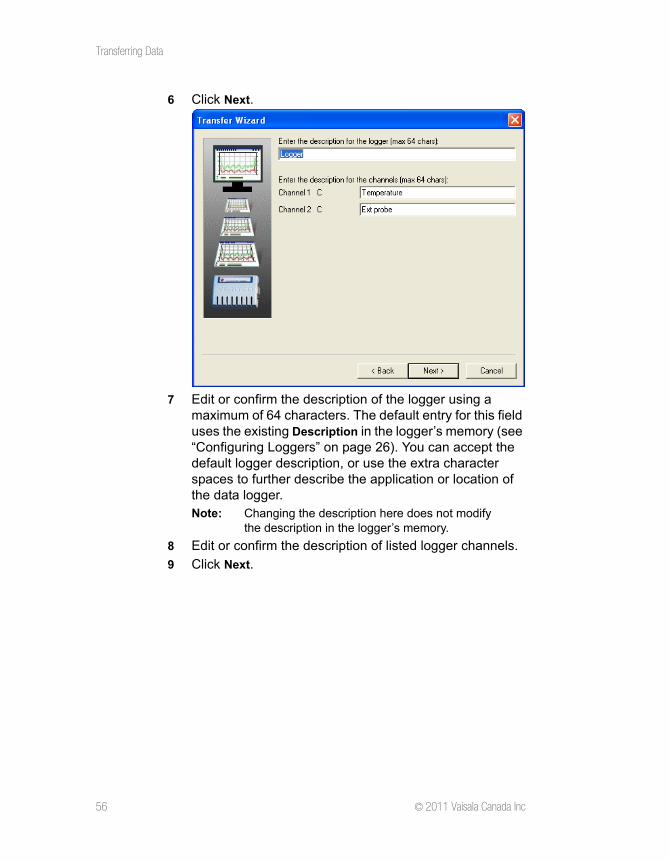
6 Click Next.
7 Edit or confirm the description of the logger using a maximum of 64 characters. The default entry for this field uses the existing Description in the logger’s memory (see “Configuring Loggers” on page 26). You can accept the default logger description, or use the extra character spaces to further describe the application or location of the data logger.Note: Changing the description here does not modify
the description in the logger’s memory.
8 Edit or confirm the description of listed logger channels.
9 Click Next.
Transferring Data
Vaisala Veriteq vLog 4.5 57
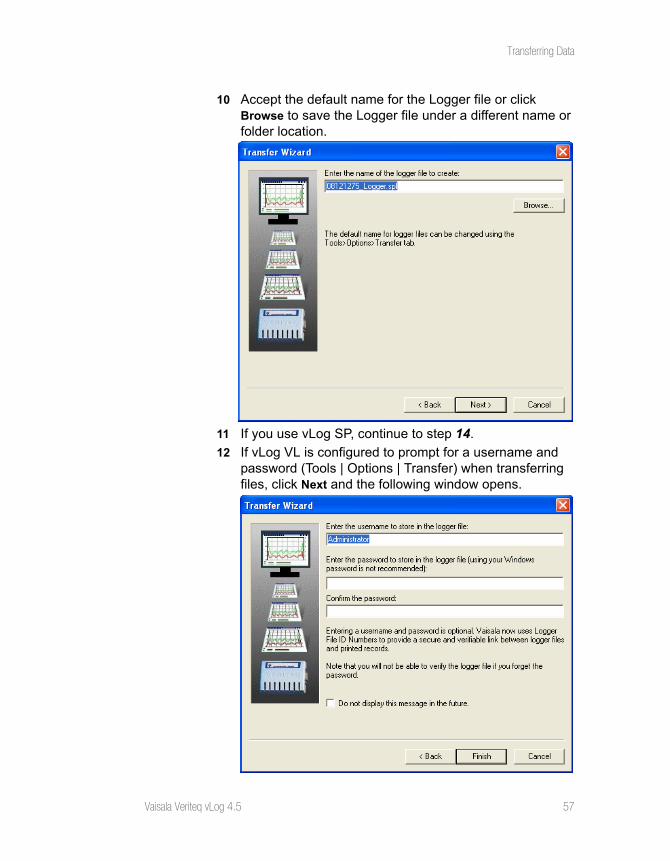
10 Accept the default name for the Logger file or click Browse to save the Logger file under a different name or folder location.
11 If you use vLog SP, continue to step 14.
12 If vLog VL is configured to prompt for a username and password (Tools | Options | Transfer) when transferring files, click Next and the following window opens.
Transferring Data
58 © 2011 Vaisala Canada Inc
13 Type a username and password. Retype the password to confirm.CAUTION:If you use this feature, it is vital to remember the
username and password you enter here, as you will need to re-enter the password when you ver-ify the graph (see page 82). This informa-tion cannot be recovered.
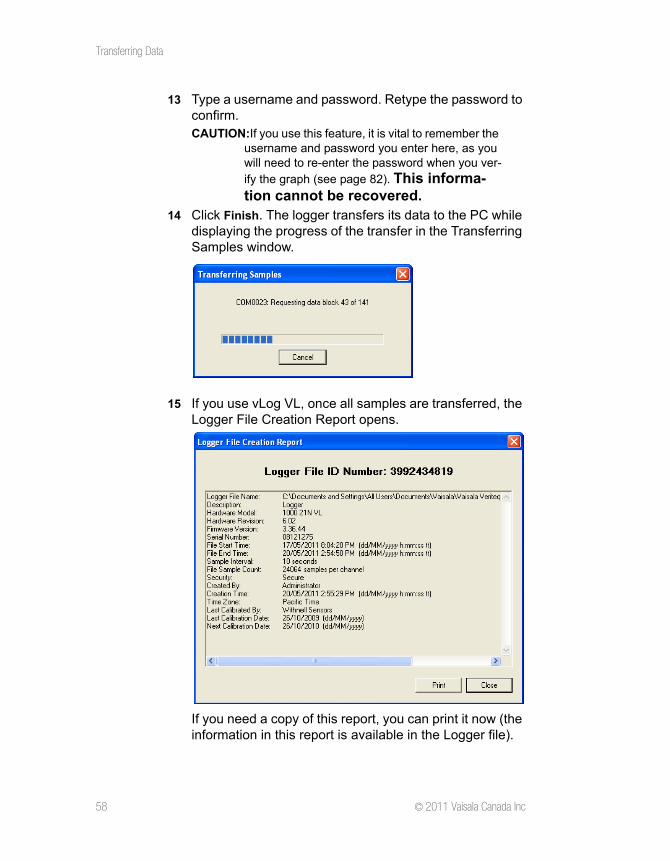
14 Click Finish. The logger transfers its data to the PC while displaying the progress of the transfer in the Transferring Samples window.
15 If you use vLog VL, once all samples are transferred, the Logger File Creation Report opens.
If you need a copy of this report, you can print it now (the information in this report is available in the Logger file).
Transferring Data
Vaisala Veriteq vLog 4.5 59
To print a copy of the report, click Print. To close this win-dow and return to the vLog main window, click Close.
Note: After the transfer, the data remains in the logger. If the logger memory was not full, the data logger continues to store additional data in its internal memory without interruption. If you want to clear the data logger, see “Clearing Logger Samples” on page 44.
16 Insert the newly transferred logger file into a new graph or the active (current) graph, if one is active.
17 Click OK.
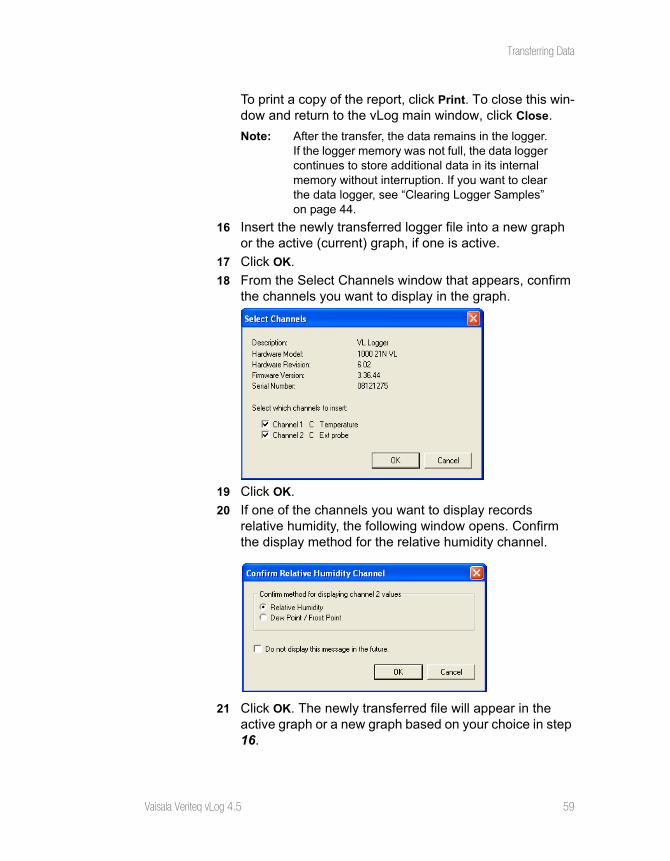
18 From the Select Channels window that appears, confirm the channels you want to display in the graph.
19 Click OK.
20 If one of the channels you want to display records relative humidity, the following window opens. Confirm the display method for the relative humidity channel.
21 Click OK. The newly transferred file will appear in the active graph or a new graph based on your choice in step 16.
Logger File Creation Report (vLog VL)
60 © 2011 Vaisala Canada Inc
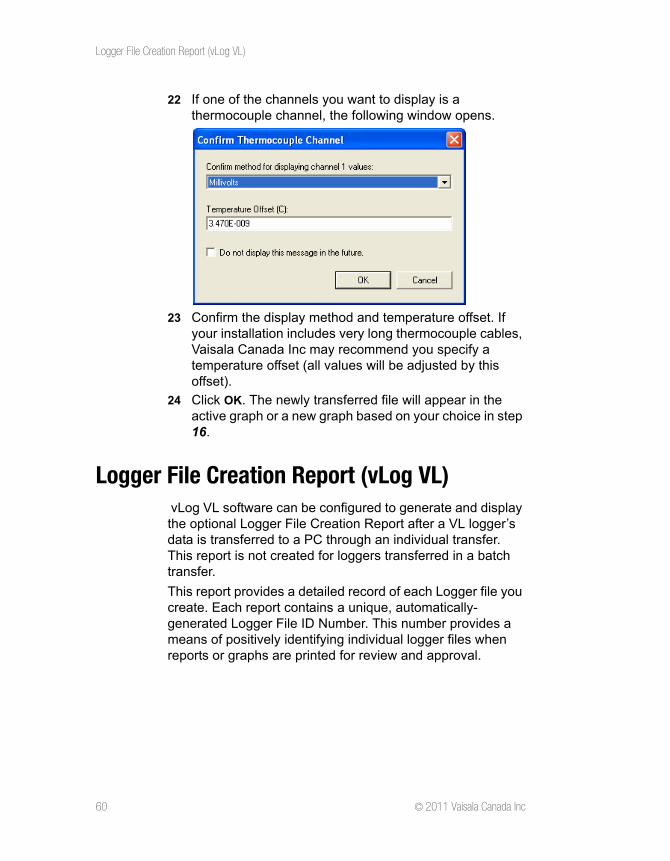
22 If one of the channels you want to display is a thermocouple channel, the following window opens.
23 Confirm the display method and temperature offset. If your installation includes very long thermocouple cables, Vaisala Canada Inc may recommend you specify a temperature offset (all values will be adjusted by this offset).
24 Click OK. The newly transferred file will appear in the active graph or a new graph based on your choice in step 16.
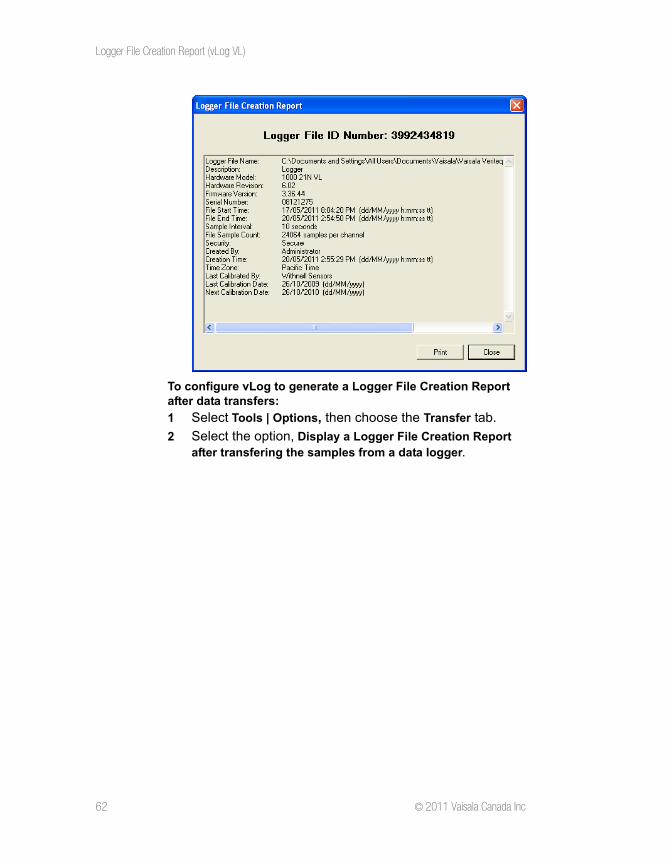
Logger File Creation Report (vLog VL) vLog VL software can be configured to generate and display the optional Logger File Creation Report after a VL logger’s data is transferred to a PC through an individual transfer. This report is not created for loggers transferred in a batch transfer.
This report provides a detailed record of each Logger file you create. Each report contains a unique, automatically-generated Logger File ID Number. This number provides a means of positively identifying individual logger files when reports or graphs are printed for review and approval.
Logger File Creation Report (vLog VL)
Vaisala Veriteq vLog 4.5 61
In addition to the Logger File ID Number, the Logger File Creation Report contains the following information necessary as part of the validation process:
• Logger file name
• Logger description
• Hardware model of the data logger
• Hardware revision for the data logger
• Firmware version number for the data logger
• Serial number of the data logger
• File start time
• File stop time
• Sample interval
• File sample count
• Whether or not the file is secure
• Username of the person who created the file (if that option is selected)
• Creation time
• Time zone
• Name of the organization who last calibrated the data logger
• Date of the last calibration
• Recommended date for the next calibration
Logger File Creation Report (vLog VL)
62 © 2011 Vaisala Canada Inc
To configure vLog to generate a Logger File Creation Report after data transfers:
1 Select Tools | Options, then choose the Transfer tab.
2 Select the option, Display a Logger File Creation Report after transfering the samples from a data logger.
Logger File Creation Report (vLog VL)
Vaisala Veriteq vLog 4.5 63
3 Click OK.
Logger File ID Number (vLog VL)The Logger File ID Number is a unique checksum value that is automatically generated every time a VL-logger file is created. By recording the Logger File ID Number as shown in the Logger File Creation Report, you can ensure this ID number appears on all reports or graphs you have to sign as part of regulatory processes.
The Logger File ID Numbers are included in the following files and documents:
• Logger File Creation Reports
• Logger files
• Graph files that contain inserted VL logger file data.
• Reports
Batch Transfer of Logger Data to the PC (vLog VL)
64 © 2011 Vaisala Canada Inc
Setting System Date and TimeTo set the PC’s date and time using the Windows operating system:
1 Select Start | Control Panel, and then double-click Date/Time.
2 Reset the time to the correct values.
3 Click OK.
Batch Transfer of Logger Data to the PC (vLog VL)
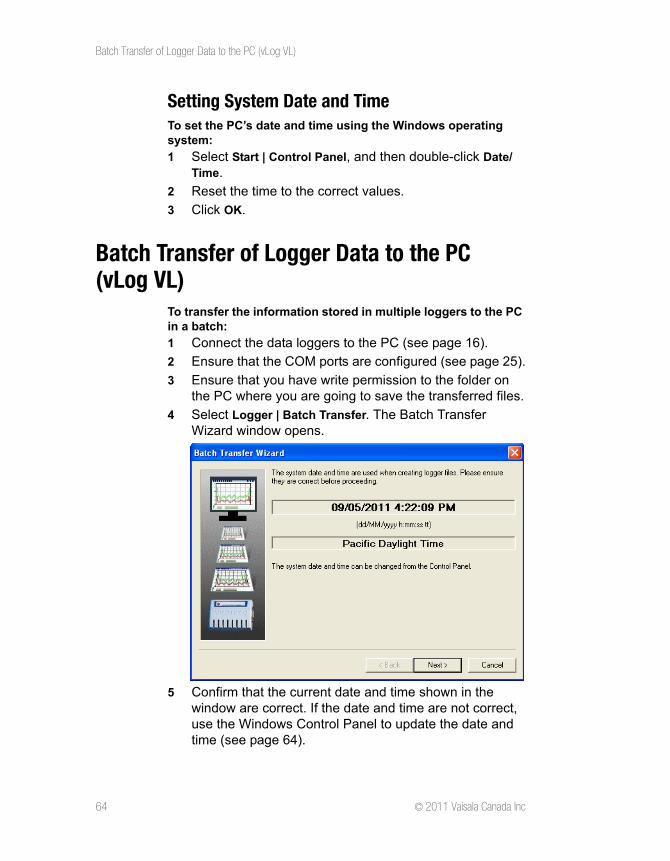
To transfer the information stored in multiple loggers to the PC in a batch:
1 Connect the data loggers to the PC (see page 16).
2 Ensure that the COM ports are configured (see page 25).
3 Ensure that you have write permission to the folder on the PC where you are going to save the transferred files.
4 Select Logger | Batch Transfer. The Batch Transfer Wizard window opens.
5 Confirm that the current date and time shown in the window are correct. If the date and time are not correct, use the Windows Control Panel to update the date and time (see page 64).
Batch Transfer of Logger Data to the PC (vLog
Vaisala Veriteq vLog 4.5 65
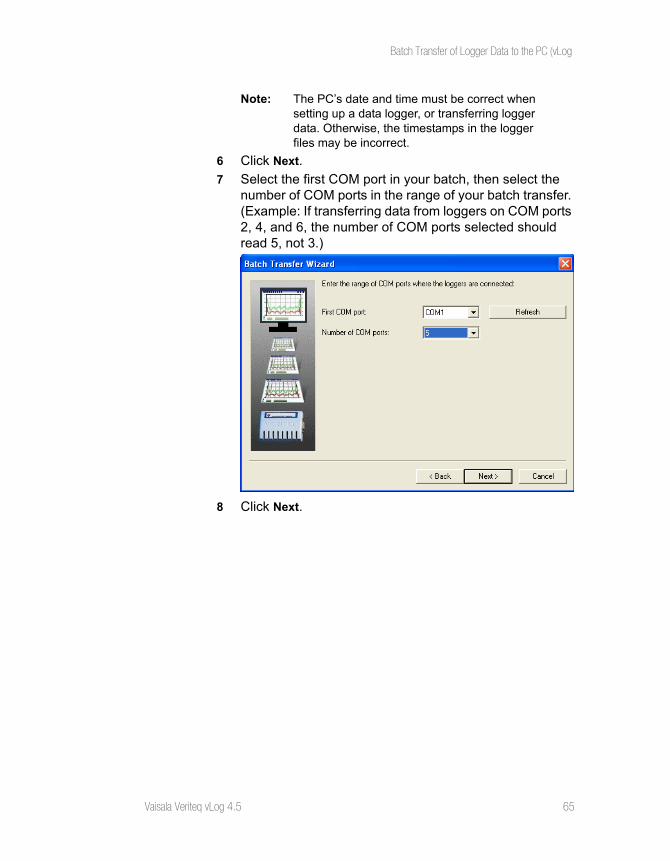
Note: The PC’s date and time must be correct when setting up a data logger, or transferring logger data. Otherwise, the timestamps in the logger files may be incorrect.
6 Click Next.
7 Select the first COM port in your batch, then select the number of COM ports in the range of your batch transfer. (Example: If transferring data from loggers on COM ports 2, 4, and 6, the number of COM ports selected should read 5, not 3.)
8 Click Next.
Batch Transfer of Logger Data to the PC (vLog VL)
66 © 2011 Vaisala Canada Inc
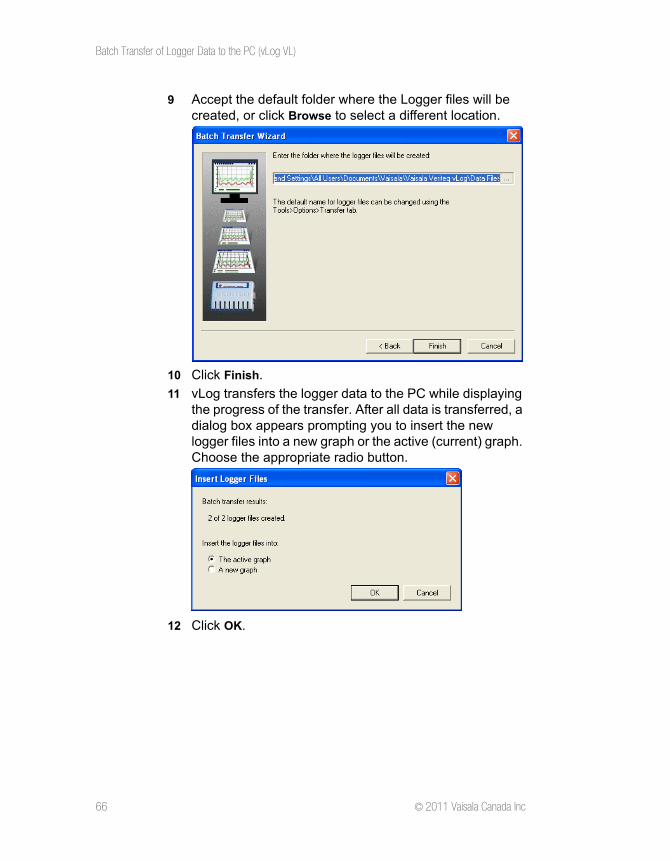
9 Accept the default folder where the Logger files will be created, or click Browse to select a different location.
10 Click Finish.
11 vLog transfers the logger data to the PC while displaying the progress of the transfer. After all data is transferred, a dialog box appears prompting you to insert the new logger files into a new graph or the active (current) graph. Choose the appropriate radio button.
12 Click OK.
Vaisala Veriteq vLog 4.5 67
Chapter 4: Working with Graphs
Graphs are a key component of vLog, allowing you to display and analyze data.
This section provides details about:
• displaying existing and creating new graph files
• formatting graphs: adding graph titles, modifying fonts, formatting time zones and measurement units
• working in graphs: zooming in or out, changing the temperature scale, sample smoothing, displaying line numbers and horizontal lines
• moving graph data to new locations: copying and pasting graphs, exporting graph data and saving and printing graphs
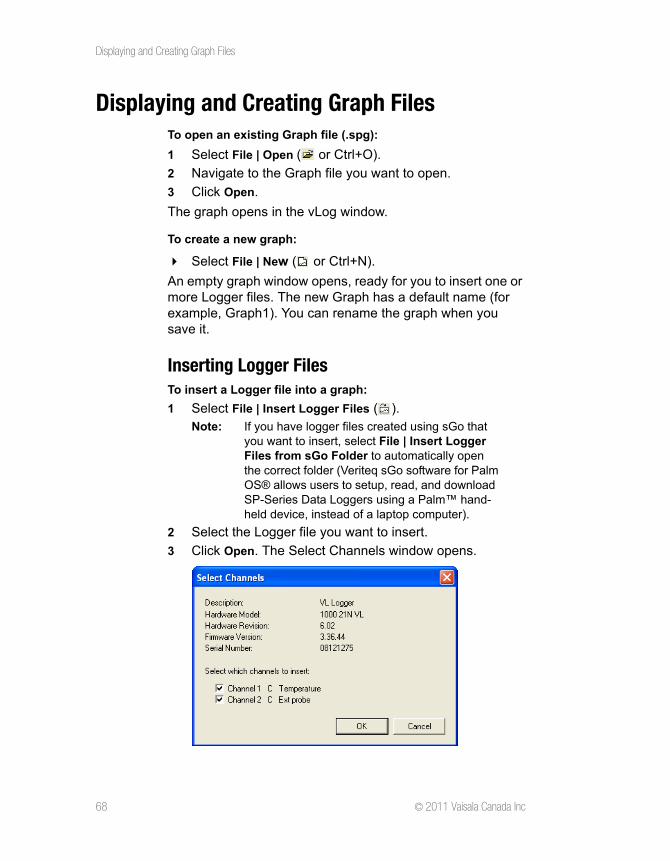
Displaying and Creating Graph Files
68 © 2011 Vaisala Canada Inc
Displaying and Creating Graph FilesTo open an existing Graph file (.spg):
1 Select File | Open ( or Ctrl+O).
2 Navigate to the Graph file you want to open.
3 Click Open.
The graph opens in the vLog window.
To create a new graph:
Select File | New ( or Ctrl+N).
An empty graph window opens, ready for you to insert one or more Logger files. The new Graph has a default name (for example, Graph1). You can rename the graph when you save it.
Inserting Logger FilesTo insert a Logger file into a graph:
1 Select File | Insert Logger Files ( ).Note: If you have logger files created using sGo that
you want to insert, select File | Insert Logger Files from sGo Folder to automatically open the correct folder (Veriteq sGo software for Palm OS® allows users to setup, read, and download SP-Series Data Loggers using a Palm™ hand-held device, instead of a laptop computer).
2 Select the Logger file you want to insert.
3 Click Open. The Select Channels window opens.
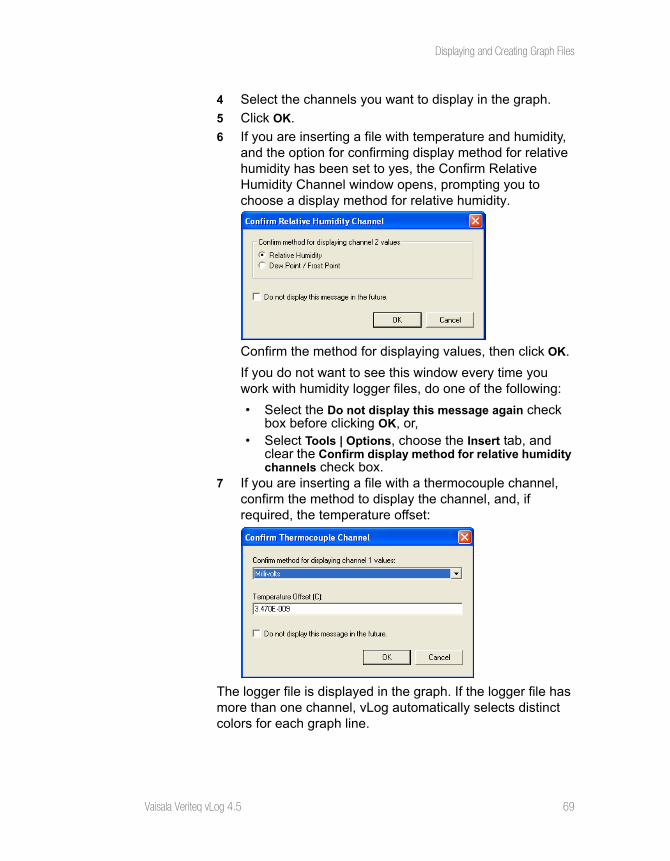
Displaying and Creating Graph Files
Vaisala Veriteq vLog 4.5 69
4 Select the channels you want to display in the graph.
5 Click OK.
6 If you are inserting a file with temperature and humidity, and the option for confirming display method for relative humidity has been set to yes, the Confirm Relative Humidity Channel window opens, prompting you to choose a display method for relative humidity.
Confirm the method for displaying values, then click OK.
If you do not want to see this window every time you work with humidity logger files, do one of the following:
• Select the Do not display this message again check box before clicking OK, or,
• Select Tools | Options, choose the Insert tab, and clear the Confirm display method for relative humidity channels check box.
7 If you are inserting a file with a thermocouple channel, confirm the method to display the channel, and, if required, the temperature offset:
The logger file is displayed in the graph. If the logger file has more than one channel, vLog automatically selects distinct colors for each graph line.
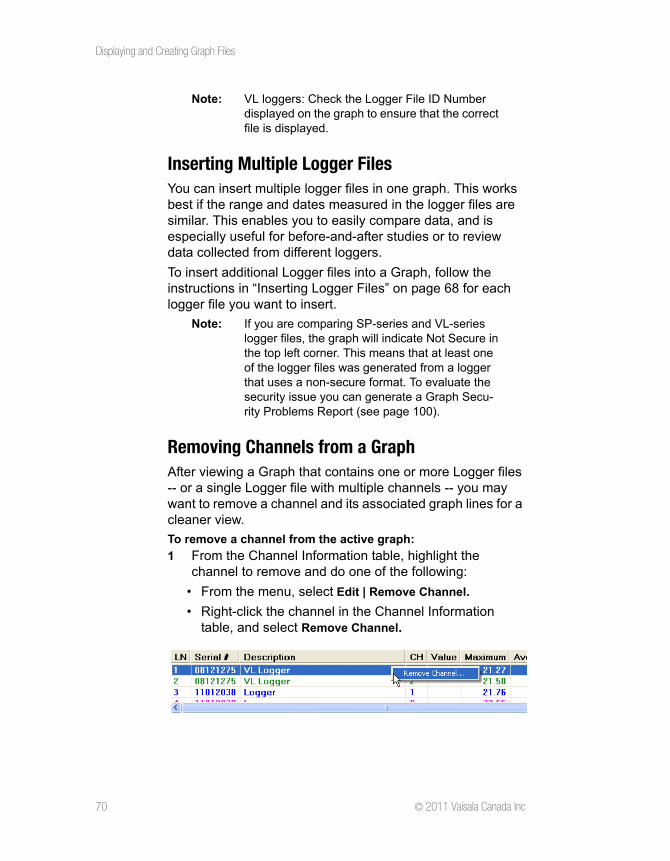
Displaying and Creating Graph Files
70 © 2011 Vaisala Canada Inc
Note: VL loggers: Check the Logger File ID Number displayed on the graph to ensure that the correct file is displayed.
Inserting Multiple Logger FilesYou can insert multiple logger files in one graph. This works best if the range and dates measured in the logger files are similar. This enables you to easily compare data, and is especially useful for before-and-after studies or to review data collected from different loggers.
To insert additional Logger files into a Graph, follow the instructions in “Inserting Logger Files” on page 68 for each logger file you want to insert.
Note: If you are comparing SP-series and VL-series logger files, the graph will indicate Not Secure in the top left corner. This means that at least one of the logger files was generated from a logger that uses a non-secure format. To evaluate the security issue you can generate a Graph Secu-rity Problems Report (see page 100).
Removing Channels from a GraphAfter viewing a Graph that contains one or more Logger files -- or a single Logger file with multiple channels -- you may want to remove a channel and its associated graph lines for a cleaner view.
To remove a channel from the active graph:
1 From the Channel Information table, highlight the channel to remove and do one of the following:
• From the menu, select Edit | Remove Channel.
• Right-click the channel in the Channel Information table, and select Remove Channel.
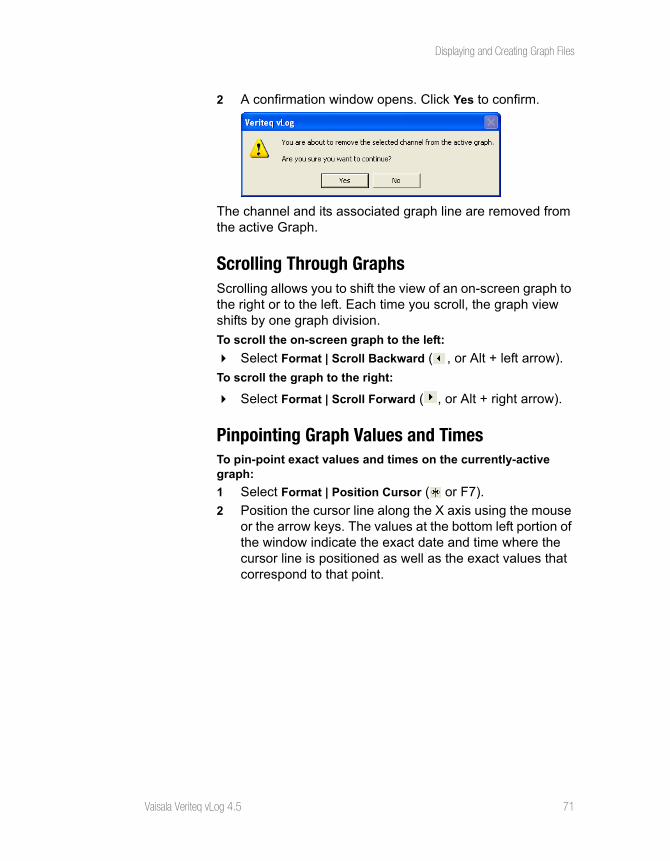
Displaying and Creating Graph Files
Vaisala Veriteq vLog 4.5 71
2 A confirmation window opens. Click Yes to confirm.
The channel and its associated graph line are removed from the active Graph.
Scrolling Through GraphsScrolling allows you to shift the view of an on-screen graph to the right or to the left. Each time you scroll, the graph view shifts by one graph division.
To scroll the on-screen graph to the left:
Select Format | Scroll Backward ( , or Alt + left arrow).
To scroll the graph to the right:
Select Format | Scroll Forward ( , or Alt + right arrow).
Pinpointing Graph Values and TimesTo pin-point exact values and times on the currently-active graph:
1 Select Format | Position Cursor ( or F7).
2 Position the cursor line along the X axis using the mouse or the arrow keys. The values at the bottom left portion of the window indicate the exact date and time where the cursor line is positioned as well as the exact values that correspond to that point.
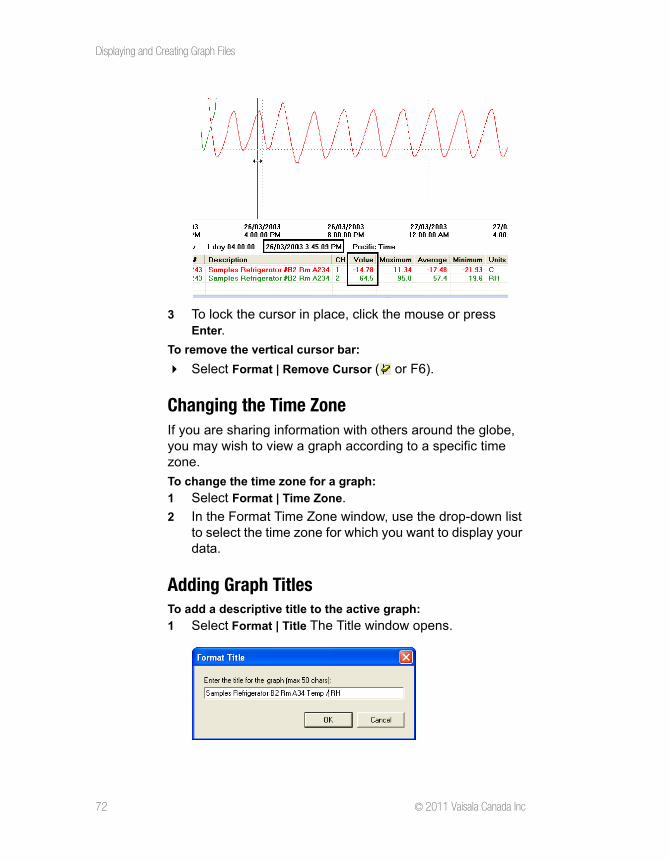
Displaying and Creating Graph Files
72 © 2011 Vaisala Canada Inc
3 To lock the cursor in place, click the mouse or press Enter.
To remove the vertical cursor bar:
Select Format | Remove Cursor ( or F6).
Changing the Time ZoneIf you are sharing information with others around the globe, you may wish to view a graph according to a specific time zone.
To change the time zone for a graph:
1 Select Format | Time Zone.
2 In the Format Time Zone window, use the drop-down list to select the time zone for which you want to display your data.
Adding Graph TitlesTo add a descriptive title to the active graph:
1 Select Format | Title The Title window opens.
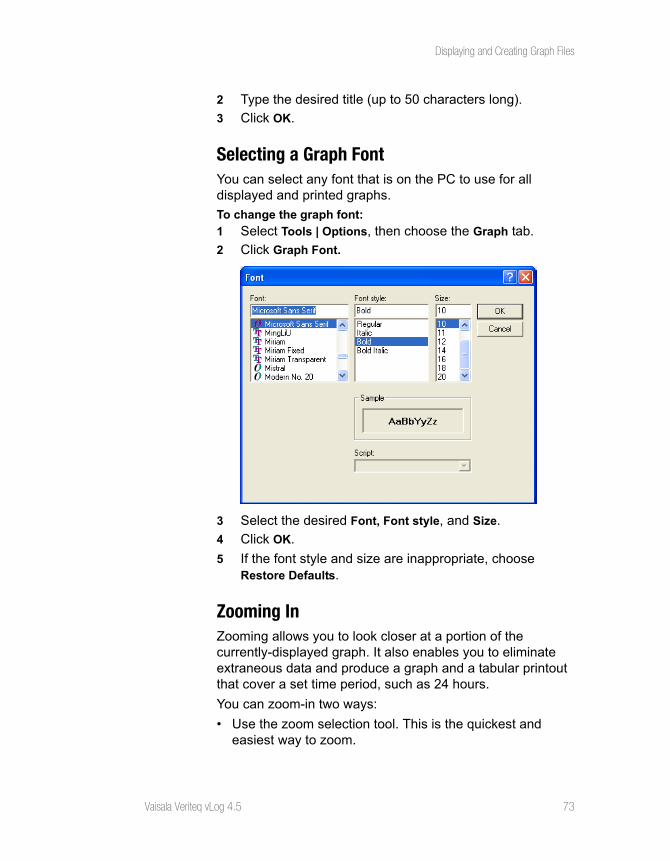
Displaying and Creating Graph Files
Vaisala Veriteq vLog 4.5 73
2 Type the desired title (up to 50 characters long).
3 Click OK.
Selecting a Graph FontYou can select any font that is on the PC to use for all displayed and printed graphs.
To change the graph font:
1 Select Tools | Options, then choose the Graph tab.
2 Click Graph Font.
3 Select the desired Font, Font style, and Size.
4 Click OK.
5 If the font style and size are inappropriate, choose Restore Defaults.
Zooming InZooming allows you to look closer at a portion of the currently-displayed graph. It also enables you to eliminate extraneous data and produce a graph and a tabular printout that cover a set time period, such as 24 hours.
You can zoom-in two ways:
• Use the zoom selection tool. This is the quickest and easiest way to zoom.
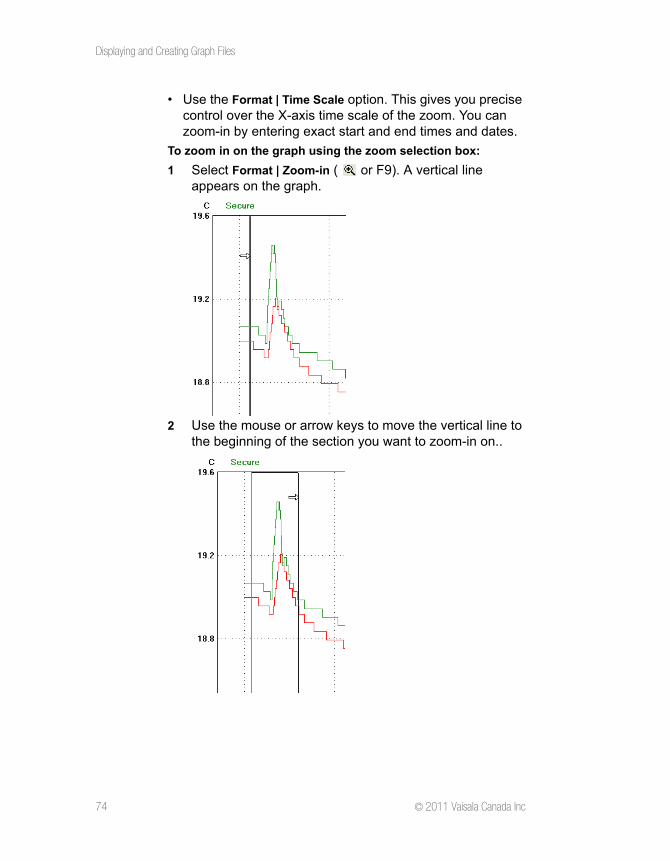
Displaying and Creating Graph Files
74 © 2011 Vaisala Canada Inc
• Use the Format | Time Scale option. This gives you precise control over the X-axis time scale of the zoom. You can zoom-in by entering exact start and end times and dates.
To zoom in on the graph using the zoom selection box:
1 Select Format | Zoom-in ( or F9). A vertical line appears on the graph.
2 Use the mouse or arrow keys to move the vertical line to the beginning of the section you want to zoom-in on..
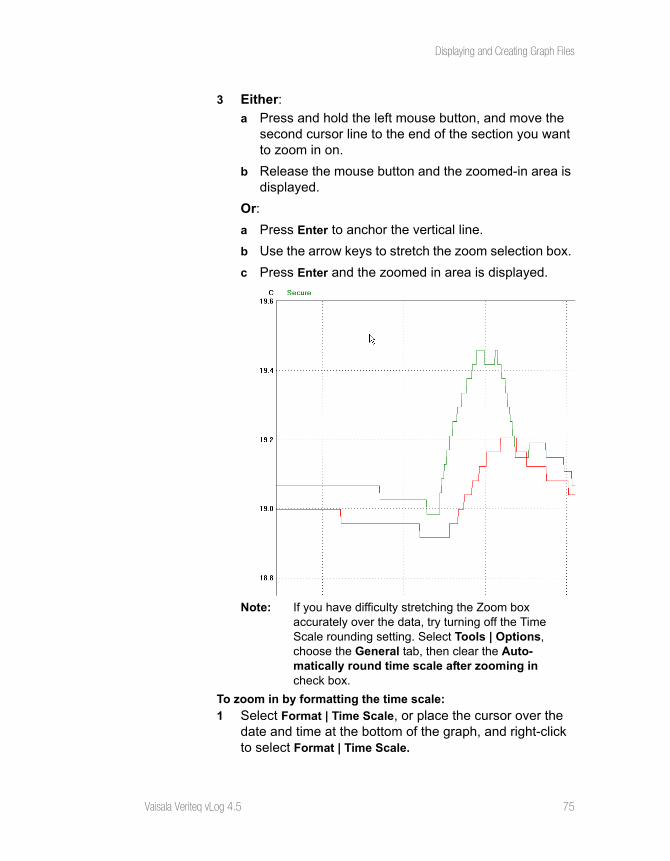
Displaying and Creating Graph Files
Vaisala Veriteq vLog 4.5 75
3 Either:
a Press and hold the left mouse button, and move the second cursor line to the end of the section you want to zoom in on.
b Release the mouse button and the zoomed-in area is displayed.
Or:
a Press Enter to anchor the vertical line.
b Use the arrow keys to stretch the zoom selection box.
c Press Enter and the zoomed in area is displayed.
Note: If you have difficulty stretching the Zoom box accurately over the data, try turning off the Time Scale rounding setting. Select Tools | Options, choose the General tab, then clear the Auto-matically round time scale after zooming in check box.
To zoom in by formatting the time scale:
1 Select Format | Time Scale, or place the cursor over the date and time at the bottom of the graph, and right-click to select Format | Time Scale.
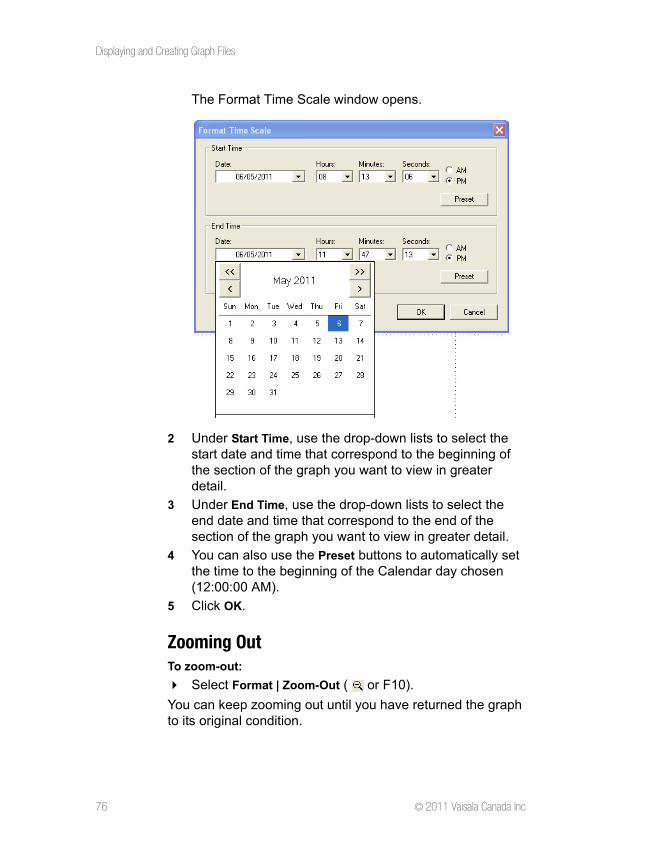
Displaying and Creating Graph Files
76 © 2011 Vaisala Canada Inc
The Format Time Scale window opens.
2 Under Start Time, use the drop-down lists to select the start date and time that correspond to the beginning of the section of the graph you want to view in greater detail.
3 Under End Time, use the drop-down lists to select the end date and time that correspond to the end of the section of the graph you want to view in greater detail.
4 You can also use the Preset buttons to automatically set the time to the beginning of the Calendar day chosen (12:00:00 AM).
5 Click OK.
Zooming OutTo zoom-out:
Select Format | Zoom-Out ( or F10).
You can keep zooming out until you have returned the graph to its original condition.
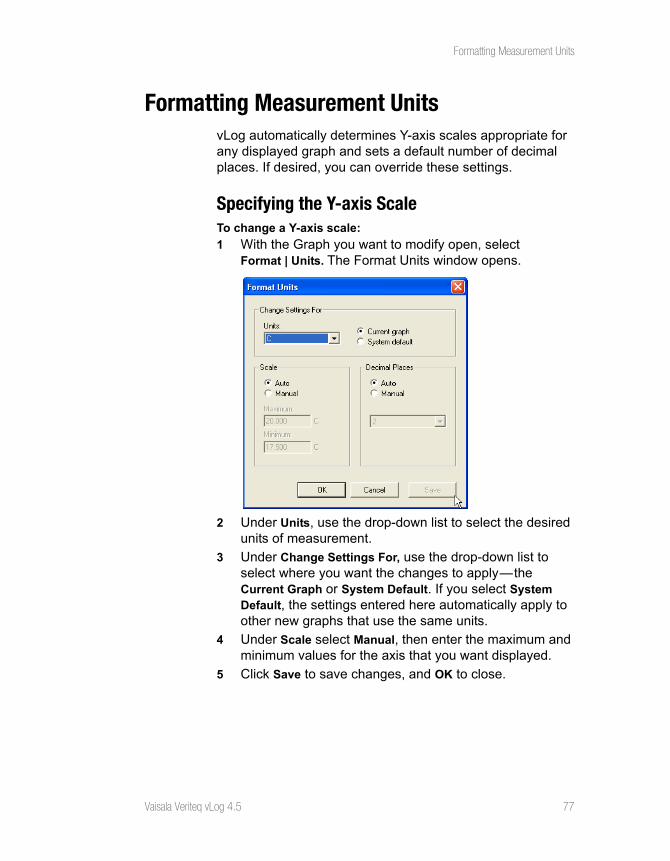
Formatting Measurement Units
Vaisala Veriteq vLog 4.5 77
Formatting Measurement UnitsvLog automatically determines Y-axis scales appropriate for any displayed graph and sets a default number of decimal places. If desired, you can override these settings.
Specifying the Y-axis ScaleTo change a Y-axis scale:
1 With the Graph you want to modify open, selectFormat | Units. The Format Units window opens.
2 Under Units, use the drop-down list to select the desired units of measurement.
3 Under Change Settings For, use the drop-down list to select where you want the changes to apply—the Current Graph or System Default. If you select System Default, the settings entered here automatically apply to other new graphs that use the same units.
4 Under Scale select Manual, then enter the maximum and minimum values for the axis that you want displayed.
5 Click Save to save changes, and OK to close.
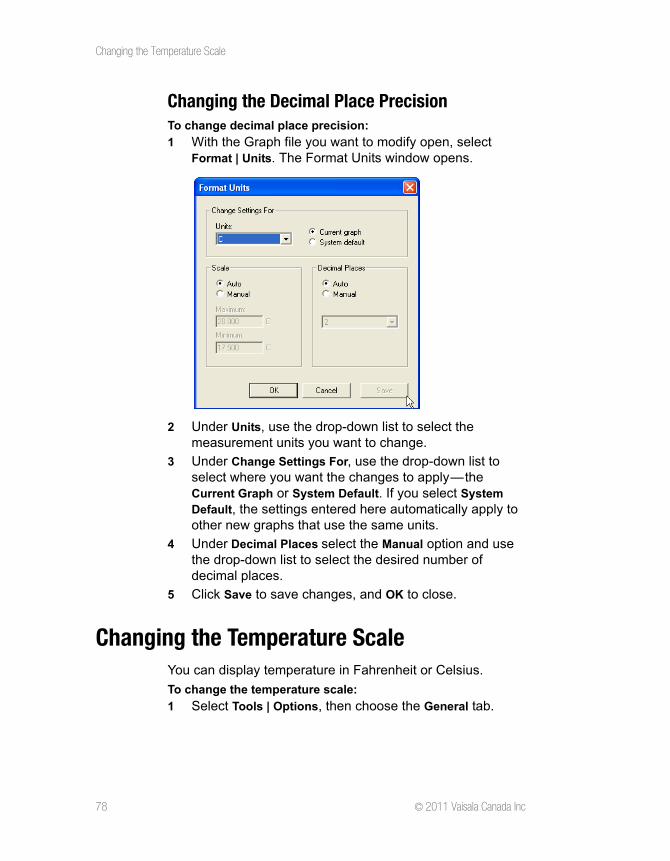
Changing the Temperature Scale
78 © 2011 Vaisala Canada Inc
Changing the Decimal Place PrecisionTo change decimal place precision:
1 With the Graph file you want to modify open, selectFormat | Units. The Format Units window opens.
2 Under Units, use the drop-down list to select the measurement units you want to change.
3 Under Change Settings For, use the drop-down list to select where you want the changes to apply—the Current Graph or System Default. If you select System Default, the settings entered here automatically apply to other new graphs that use the same units.
4 Under Decimal Places select the Manual option and use the drop-down list to select the desired number of decimal places.
5 Click Save to save changes, and OK to close.
Changing the Temperature ScaleYou can display temperature in Fahrenheit or Celsius.
To change the temperature scale:
1 Select Tools | Options, then choose the General tab.
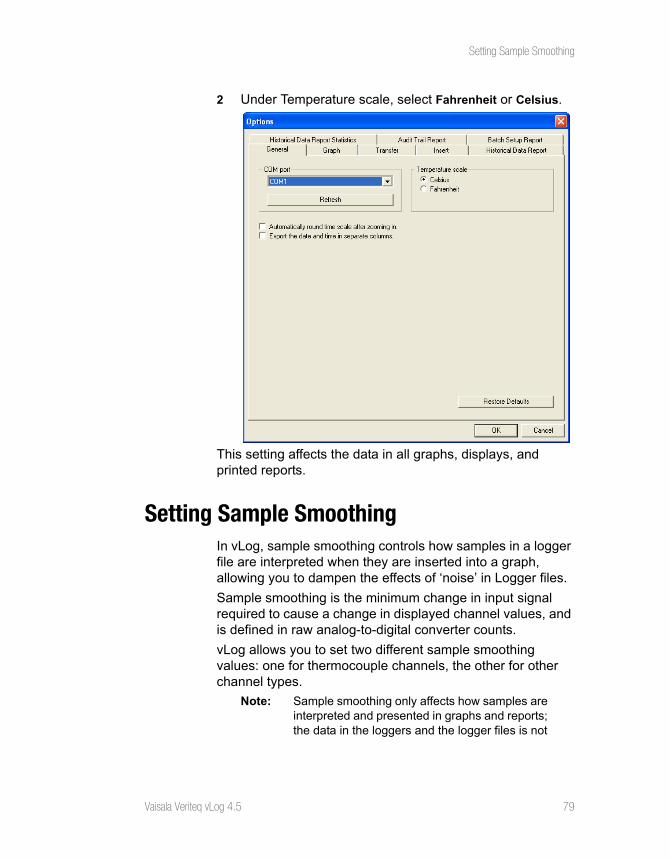
Setting Sample Smoothing
Vaisala Veriteq vLog 4.5 79
2 Under Temperature scale, select Fahrenheit or Celsius.
This setting affects the data in all graphs, displays, and printed reports.
Setting Sample SmoothingIn vLog, sample smoothing controls how samples in a logger file are interpreted when they are inserted into a graph, allowing you to dampen the effects of ‘noise’ in Logger files.
Sample smoothing is the minimum change in input signal required to cause a change in displayed channel values, and is defined in raw analog-to-digital converter counts.
vLog allows you to set two different sample smoothing values: one for thermocouple channels, the other for other channel types.
Note: Sample smoothing only affects how samples are interpreted and presented in graphs and reports; the data in the loggers and the logger files is not
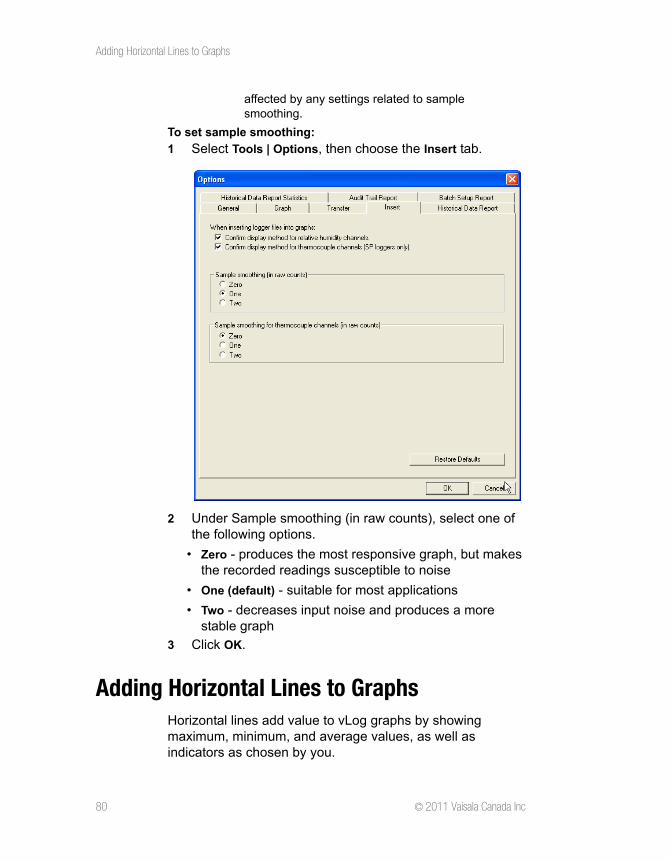
Adding Horizontal Lines to Graphs
80 © 2011 Vaisala Canada Inc
affected by any settings related to sample smoothing.
To set sample smoothing:
1 Select Tools | Options, then choose the Insert tab.
2 Under Sample smoothing (in raw counts), select one of the following options.
• Zero - produces the most responsive graph, but makes the recorded readings susceptible to noise
• One (default) - suitable for most applications
• Two - decreases input noise and produces a more stable graph
3 Click OK.
Adding Horizontal Lines to GraphsHorizontal lines add value to vLog graphs by showing maximum, minimum, and average values, as well as indicators as chosen by you.
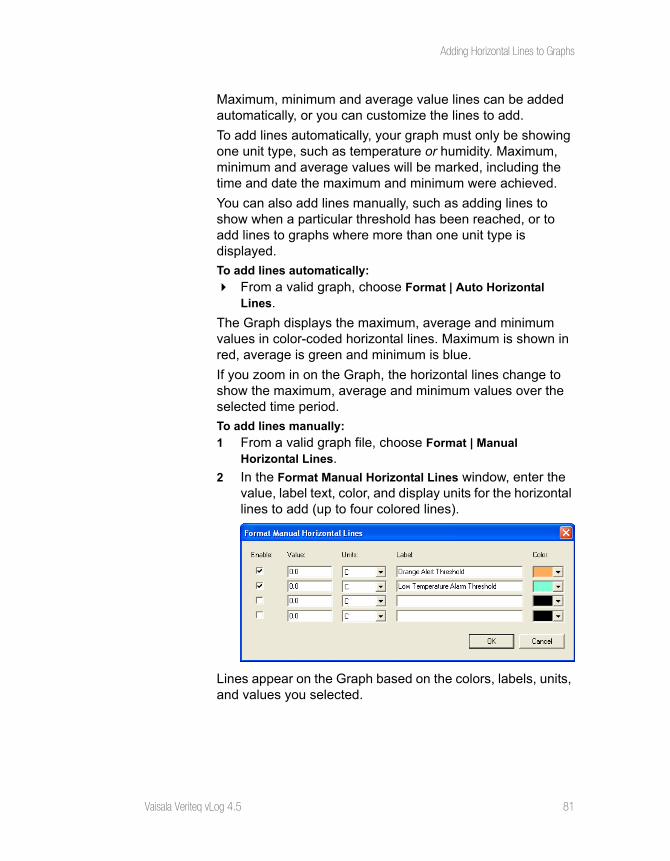
Adding Horizontal Lines to Graphs
Vaisala Veriteq vLog 4.5 81
Maximum, minimum and average value lines can be added automatically, or you can customize the lines to add.
To add lines automatically, your graph must only be showing one unit type, such as temperature or humidity. Maximum, minimum and average values will be marked, including the time and date the maximum and minimum were achieved.
You can also add lines manually, such as adding lines to show when a particular threshold has been reached, or to add lines to graphs where more than one unit type is displayed.
To add lines automatically:
From a valid graph, choose Format | Auto Horizontal Lines.
The Graph displays the maximum, average and minimum values in color-coded horizontal lines. Maximum is shown in red, average is green and minimum is blue.
If you zoom in on the Graph, the horizontal lines change to show the maximum, average and minimum values over the selected time period.
To add lines manually:
1 From a valid graph file, choose Format | Manual Horizontal Lines.
2 In the Format Manual Horizontal Lines window, enter the value, label text, color, and display units for the horizontal lines to add (up to four colored lines).
Lines appear on the Graph based on the colors, labels, units, and values you selected.
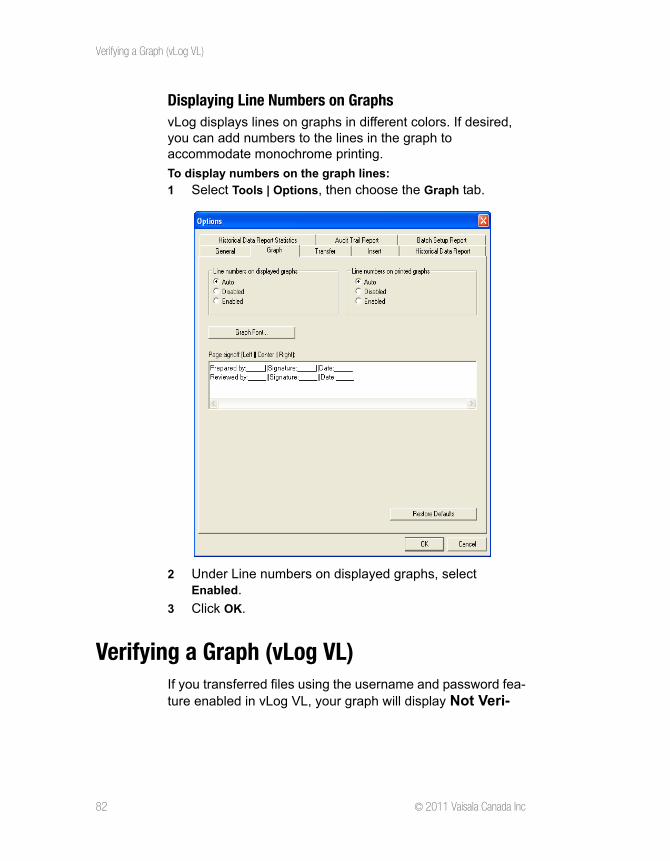
Verifying a Graph (vLog VL)
82 © 2011 Vaisala Canada Inc
Displaying Line Numbers on GraphsvLog displays lines on graphs in different colors. If desired, you can add numbers to the lines in the graph to accommodate monochrome printing.
To display numbers on the graph lines:
1 Select Tools | Options, then choose the Graph tab.
2 Under Line numbers on displayed graphs, select Enabled.
3 Click OK.
Verifying a Graph (vLog VL)If you transferred files using the username and password fea-ture enabled in vLog VL, your graph will display Not Veri-
Copying and Pasting Graphs
Vaisala Veriteq vLog 4.5 83
fied in the upper right corner of the graph. Refer to the instructions on verifying graphs on page 106.
Note: This verification method is no longer recom-mended as vLog now allows you to track Logger File ID numbers (see “Setting Transfer Prefer-ences” on page 52).
Copying and Pasting GraphsvLog allows you to copy graphs into the Clipboard for pasting into other applications, such as a Microsoft Word file or PowerPoint presentation file.
To copy graph data:
1 From vLog, choose Edit | Copy (Ctrl+C).
2 Go to the application you want to paste the graph image into. In the selected application, choose Edit | Paste.
Exporting Graph DatavLog allows you to export graph data (either .txt or .csv format) for import into spreadsheet and database programs for further analysis and manipulation. You can also specify whether to have date and time saved within one column or separated. As an alternative, you can view and save the Historical Data Report; it contains identical data, plus much more (see “Historical Data Reports” on page 88).
To export graph data to .txt or .csv files:
1 By default, date and time are exported in a single column. To have date and time exported into separate columns:
a Select Tools | Options, then choose the General tab.
b Select the option, Export the date and time in separate columns.
c Click OK.
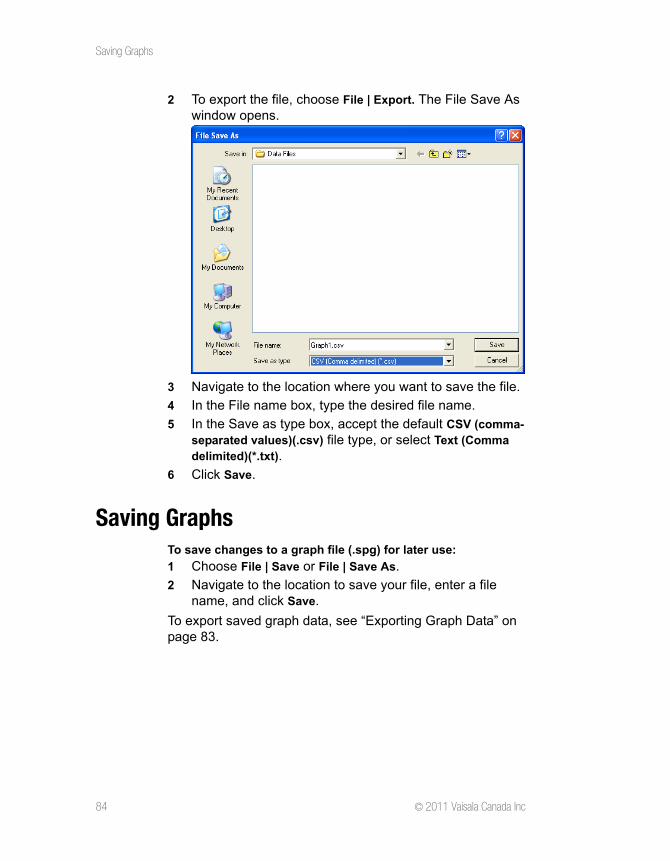
Saving Graphs
84 © 2011 Vaisala Canada Inc
2 To export the file, choose File | Export. The File Save As window opens.
3 Navigate to the location where you want to save the file.
4 In the File name box, type the desired file name.
5 In the Save as type box, accept the default CSV (comma-separated values)(.csv) file type, or select Text (Comma delimited)(*.txt).
6 Click Save.
Saving GraphsTo save changes to a graph file (.spg) for later use:
1 Choose File | Save or File | Save As.
2 Navigate to the location to save your file, enter a file name, and click Save.
To export saved graph data, see “Exporting Graph Data” on page 83.
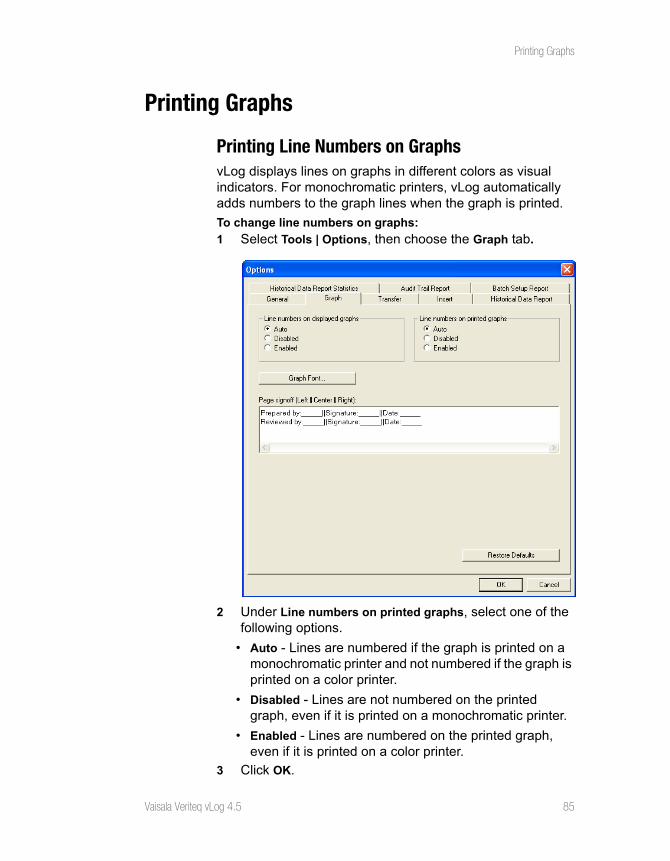
Printing Graphs
Vaisala Veriteq vLog 4.5 85
Printing Graphs
Printing Line Numbers on GraphsvLog displays lines on graphs in different colors as visual indicators. For monochromatic printers, vLog automatically adds numbers to the graph lines when the graph is printed.
To change line numbers on graphs:
1 Select Tools | Options, then choose the Graph tab.
2 Under Line numbers on printed graphs, select one of the following options.
• Auto - Lines are numbered if the graph is printed on a monochromatic printer and not numbered if the graph is printed on a color printer.
• Disabled - Lines are not numbered on the printed graph, even if it is printed on a monochromatic printer.
• Enabled - Lines are numbered on the printed graph, even if it is printed on a color printer.
3 Click OK.
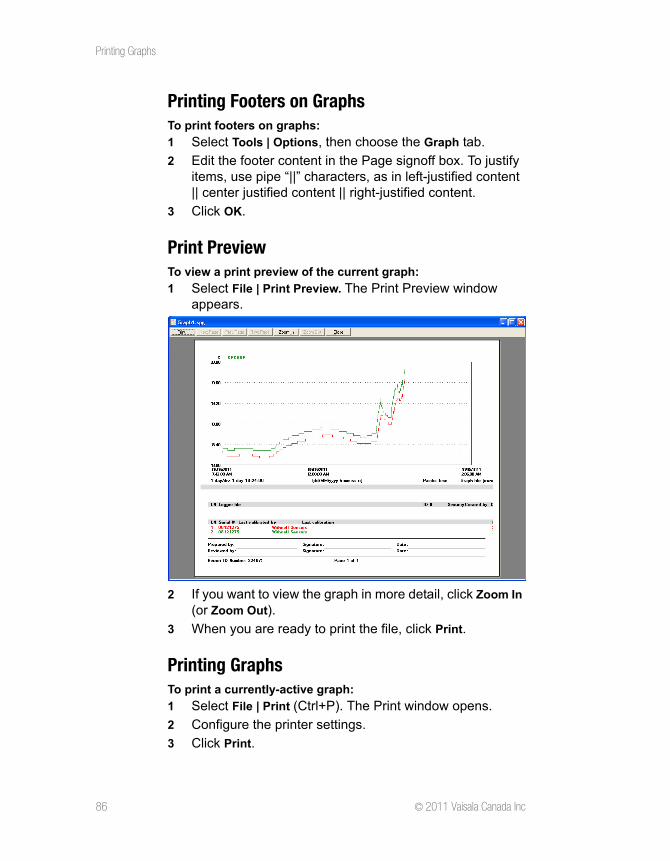
Printing Graphs
86 © 2011 Vaisala Canada Inc
Printing Footers on GraphsTo print footers on graphs:
1 Select Tools | Options, then choose the Graph tab.
2 Edit the footer content in the Page signoff box. To justify items, use pipe “||” characters, as in left-justified content || center justified content || right-justified content.
3 Click OK.
Print PreviewTo view a print preview of the current graph:
1 Select File | Print Preview. The Print Preview window appears.
2 If you want to view the graph in more detail, click Zoom In (or Zoom Out).
3 When you are ready to print the file, click Print.
Printing GraphsTo print a currently-active graph:
1 Select File | Print (Ctrl+P). The Print window opens.
2 Configure the printer settings.
3 Click Print.
Vaisala Veriteq vLog 4.5 87
Chapter 5: Viewing Reports and Statistics
Using vLog you can generate a variety of reports to assist you with the analysis of monitoring changes in data logger readings. These reports include:
• Historical Data Reports
• Audit Trail Reports (vLog VL)
• Batch Setup Reports (vLog VL)
• Graph Security Problems report (vLog VL)
You can also copy and paste report data for use in other applications.
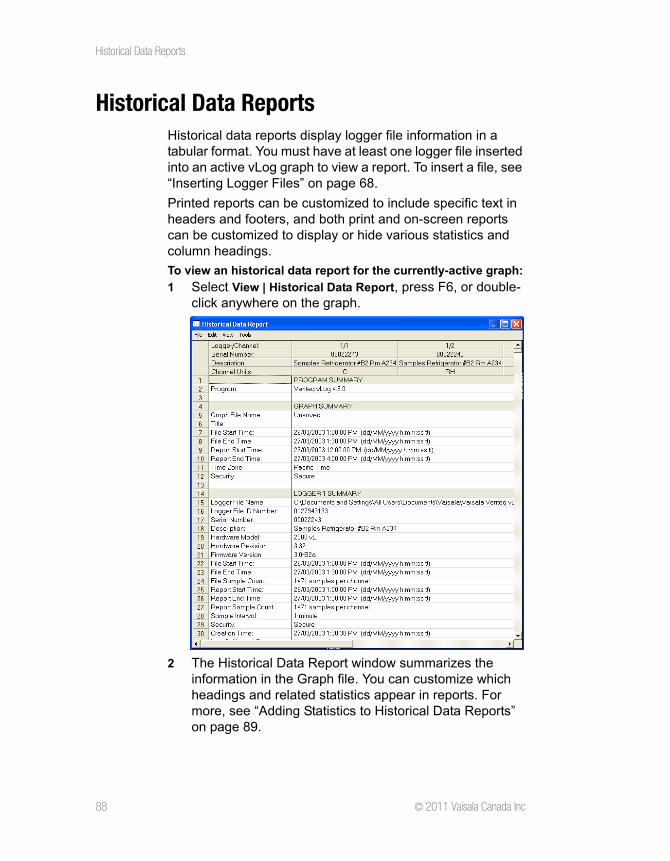
Historical Data Reports
88 © 2011 Vaisala Canada Inc
Historical Data ReportsHistorical data reports display logger file information in a tabular format. You must have at least one logger file inserted into an active vLog graph to view a report. To insert a file, see “Inserting Logger Files” on page 68.
Printed reports can be customized to include specific text in headers and footers, and both print and on-screen reports can be customized to display or hide various statistics and column headings.
To view an historical data report for the currently-active graph:
1 Select View | Historical Data Report, press F6, or double-click anywhere on the graph.
2 The Historical Data Report window summarizes the information in the Graph file. You can customize which headings and related statistics appear in reports. For more, see “Adding Statistics to Historical Data Reports” on page 89.
Historical Data Reports
Vaisala Veriteq vLog 4.5 89
3 To print the report, from the Historical Data Report window, select File | Print. To customize headers and footers on printed reports, see “Customizing Headers, Footers and Font Sizes in Historical Data Reports” on page 91.
Adding Statistics to Historical Data ReportsAs you view or print a historical data report, you can also include statistical information derived from the logger file, including maximum, average and minimum values for various intervals within the data in the currently-active graph. Standard deviation, mean kinetic temperature, lethality, sample count and/or group statistics can also be included.
To view statistical summaries in historical data reports:
1 With the desired Graph file active, do one of the following:
• Select Tools | Options, then choose the Historical Data Report Statistics tab.
• From the Historical Data Report window, select Tools | Options, then choose the Historical Data Report Statistics tab.
• From the Historical Data Report window, right-click and choose Options | Historical Data Report Statistics.
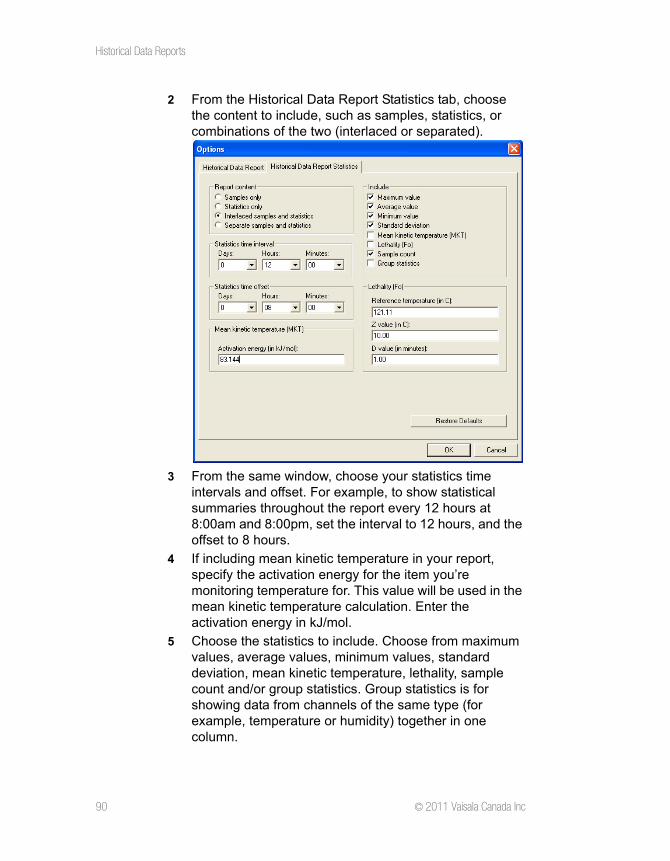
Historical Data Reports
90 © 2011 Vaisala Canada Inc
2 From the Historical Data Report Statistics tab, choose the content to include, such as samples, statistics, or combinations of the two (interlaced or separated).
3 From the same window, choose your statistics time intervals and offset. For example, to show statistical summaries throughout the report every 12 hours at 8:00am and 8:00pm, set the interval to 12 hours, and the offset to 8 hours.
4 If including mean kinetic temperature in your report, specify the activation energy for the item you’re monitoring temperature for. This value will be used in the mean kinetic temperature calculation. Enter the activation energy in kJ/mol.
5 Choose the statistics to include. Choose from maximum values, average values, minimum values, standard deviation, mean kinetic temperature, lethality, sample count and/or group statistics. Group statistics is for showing data from channels of the same type (for example, temperature or humidity) together in one column.
Historical Data Reports
Vaisala Veriteq vLog 4.5 91
6 If you’re including lethality in your report, specify the following values:
• reference temperature in degrees
• Z value in degrees (the Z value is the temperature required to change the D value by a factor of 10)
• D value in minutes (the D value is the time required to destroy 1 log cycle (90%) of the microbial population at the reference temperature)
7 Click OK. The report is displayed. Scroll through the report to see your statistical information.
8 To print your report, from the Historical Data Report window, choose File | Print. To customize your report’s appearance, see “Customizing Headers, Footers and Font Sizes in Historical Data Reports” on page 91.
9 To perform a more in-depth statistical analysis, you can save the report using File | Save As from the Historical Data Report window, then analyze the report contents in a spreadsheet program such as Microsoft Excel. See “Saving Reports” on page 102.
Customizing Headers, Footers and Font Sizes in Historical Data ReportsHistorical data reports can be customized to include certain items in column headings, certain items and statistics within the report itself, as well as specific headers, footers, and font size in a printed report.
You can also choose to include or not include logger serial numbers, descriptions, and channel descriptions in report column headings for both printed and on-screen reports.
To customize column headings:
1 From vLog, select Tools | Options then choose the Historical Data Report tab.
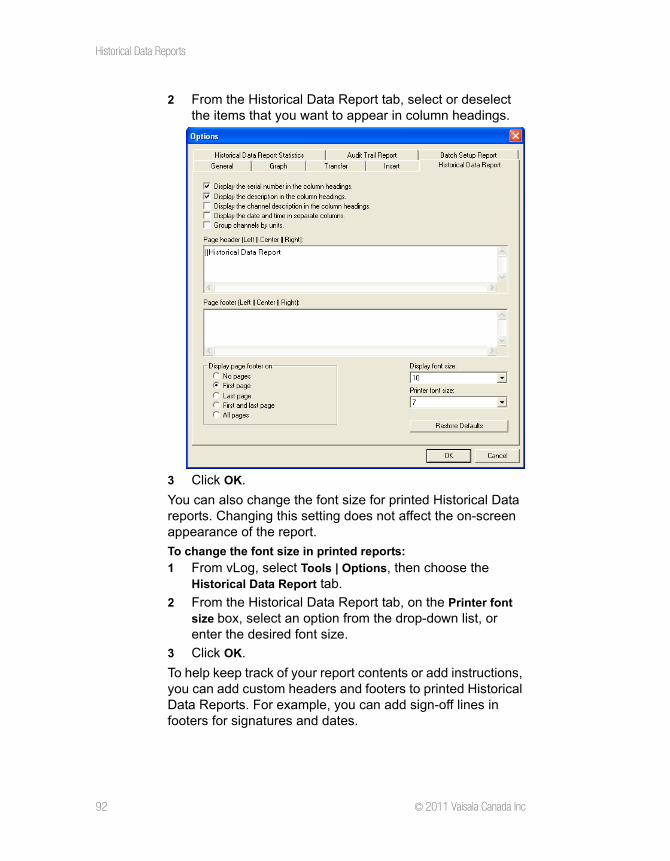
Historical Data Reports
92 © 2011 Vaisala Canada Inc
2 From the Historical Data Report tab, select or deselect the items that you want to appear in column headings.
3 Click OK.
You can also change the font size for printed Historical Data reports. Changing this setting does not affect the on-screen appearance of the report.
To change the font size in printed reports:
1 From vLog, select Tools | Options, then choose the Historical Data Report tab.
2 From the Historical Data Report tab, on the Printer font size box, select an option from the drop-down list, or enter the desired font size.
3 Click OK.
To help keep track of your report contents or add instructions, you can add custom headers and footers to printed Historical Data Reports. For example, you can add sign-off lines in footers for signatures and dates.
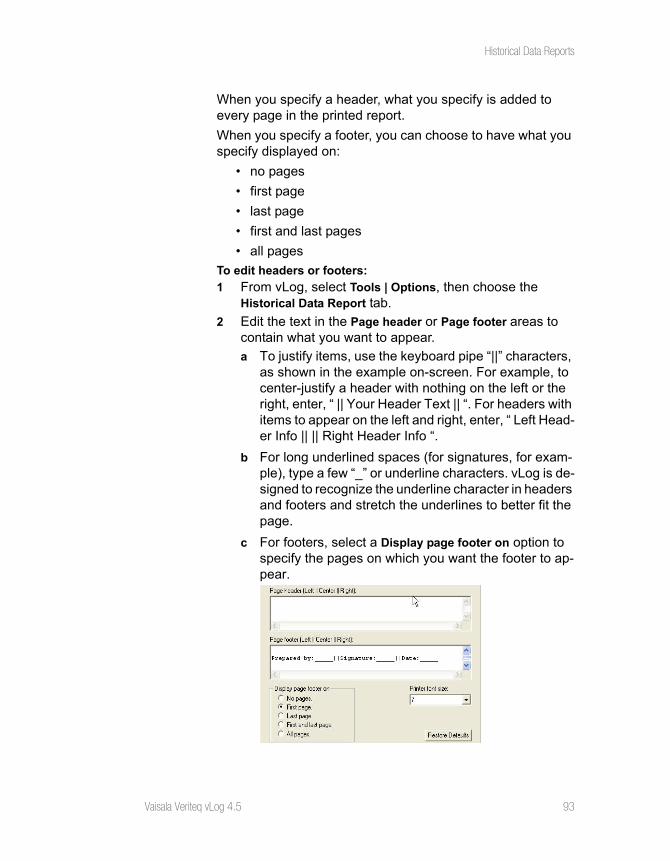
Historical Data Reports
Vaisala Veriteq vLog 4.5 93
When you specify a header, what you specify is added to every page in the printed report.
When you specify a footer, you can choose to have what you specify displayed on:
• no pages
• first page
• last page
• first and last pages
• all pages
To edit headers or footers:
1 From vLog, select Tools | Options, then choose the Historical Data Report tab.
2 Edit the text in the Page header or Page footer areas to contain what you want to appear.
a To justify items, use the keyboard pipe “||” characters, as shown in the example on-screen. For example, to center-justify a header with nothing on the left or the right, enter, “ || Your Header Text || “. For headers with items to appear on the left and right, enter, “ Left Head-er Info || || Right Header Info “.
b For long underlined spaces (for signatures, for exam-ple), type a few “_” or underline characters. vLog is de-signed to recognize the underline character in headers and footers and stretch the underlines to better fit the page.
c For footers, select a Display page footer on option to specify the pages on which you want the footer to ap-pear.
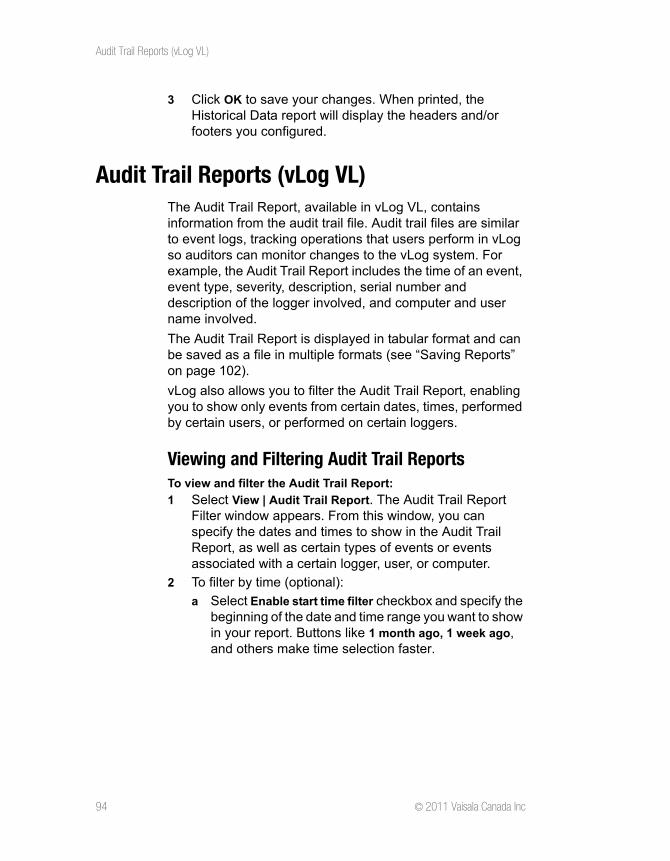
Audit Trail Reports (vLog VL)
94 © 2011 Vaisala Canada Inc
3 Click OK to save your changes. When printed, the Historical Data report will display the headers and/or footers you configured.
Audit Trail Reports (vLog VL)The Audit Trail Report, available in vLog VL, contains information from the audit trail file. Audit trail files are similar to event logs, tracking operations that users perform in vLog so auditors can monitor changes to the vLog system. For example, the Audit Trail Report includes the time of an event, event type, severity, description, serial number and description of the logger involved, and computer and user name involved.
The Audit Trail Report is displayed in tabular format and can be saved as a file in multiple formats (see “Saving Reports” on page 102).
vLog also allows you to filter the Audit Trail Report, enabling you to show only events from certain dates, times, performed by certain users, or performed on certain loggers.
Viewing and Filtering Audit Trail ReportsTo view and filter the Audit Trail Report:
1 Select View | Audit Trail Report. The Audit Trail Report Filter window appears. From this window, you can specify the dates and times to show in the Audit Trail Report, as well as certain types of events or events associated with a certain logger, user, or computer.
2 To filter by time (optional):
a Select Enable start time filter checkbox and specify the beginning of the date and time range you want to show in your report. Buttons like 1 month ago, 1 week ago, and others make time selection faster.
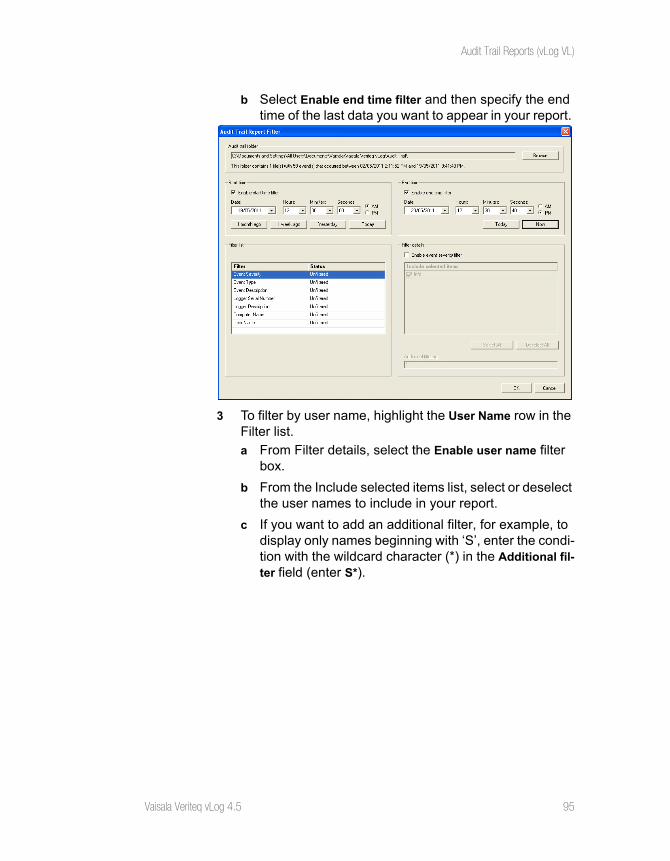
Audit Trail Reports (vLog VL)
Vaisala Veriteq vLog 4.5 95
b Select Enable end time filter and then specify the end time of the last data you want to appear in your report.
3 To filter by user name, highlight the User Name row in the Filter list.
a From Filter details, select the Enable user name filter box.
b From the Include selected items list, select or deselect the user names to include in your report.
c If you want to add an additional filter, for example, to display only names beginning with ‘S’, enter the condi-tion with the wildcard character (*) in the Additional fil-ter field (enter S*).
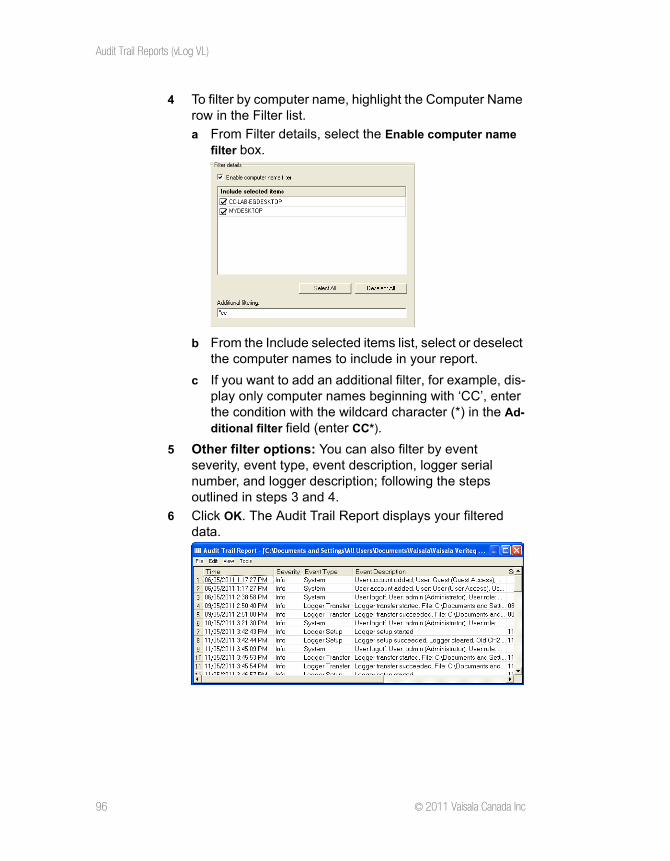
Audit Trail Reports (vLog VL)
96 © 2011 Vaisala Canada Inc
4 To filter by computer name, highlight the Computer Name row in the Filter list.
a From Filter details, select the Enable computer name filter box.
b From the Include selected items list, select or deselect the computer names to include in your report.
c If you want to add an additional filter, for example, dis-play only computer names beginning with ‘CC’, enter the condition with the wildcard character (*) in the Ad-ditional filter field (enter CC*).
5 Other filter options: You can also filter by event severity, event type, event description, logger serial number, and logger description; following the steps outlined in steps 3 and 4.
6 Click OK. The Audit Trail Report displays your filtered data.
Audit Trail Reports (vLog VL)
Vaisala Veriteq vLog 4.5 97
Configuring Date and Time Columns in Audit Trail ReportsIn vLog VL, you have the option of showing date and time in one or two columns in the Audit Trail Report.
To show date and time in two (or one) columns (vLog VL):
1 From the Audit Trail Report window, select Tools | Options.
2 Select or deselect the Display the date and time in separate columns check box.
3 Click OK.
Customizing Headers, Footers and Font Sizes in Printed Audit Trail Reports To customize the printed Audit Trail Report (vLog VL):
1 From the Audit Trail Report window, select Tools | Options.
2 Edit the text in the Page header or Page footer areas to contain what you want to appear.
a To justify items, use the keyboard pipe “||” characters, as shown in the example on-screen. For example, to center-justify a header with nothing on the left or the right, enter, “ || Your Header Text || “. For headers with items to appear on the left and right, enter, “ Left Head-er Info || || Right Header Info “.
b For long underlined spaces (for signatures, for exam-ple), type a few “_” or underline characters. vLog is de-signed to recognize the underline character in headers and footers and stretch the underlines to better fit the page.
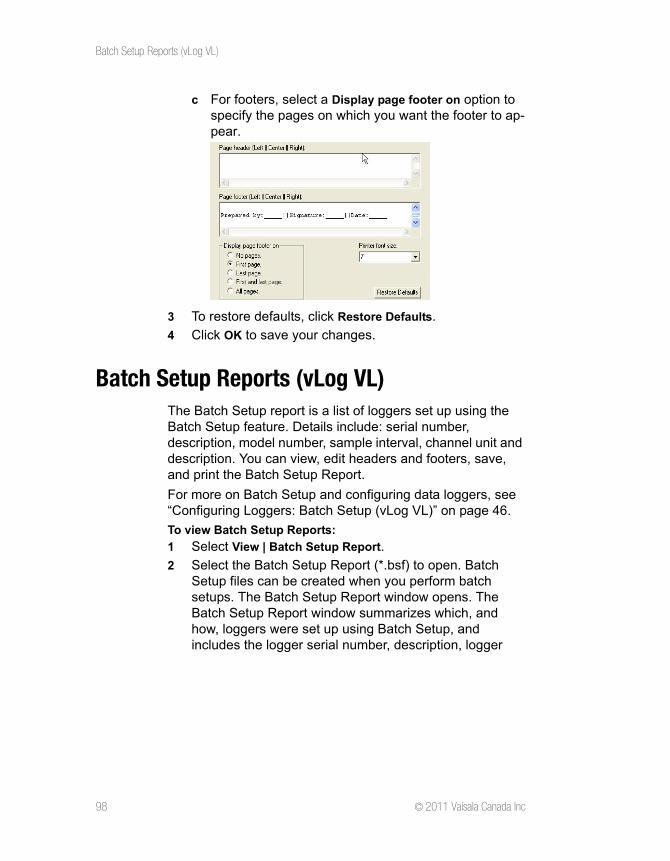
Batch Setup Reports (vLog VL)
98 © 2011 Vaisala Canada Inc
c For footers, select a Display page footer on option to specify the pages on which you want the footer to ap-pear.
3 To restore defaults, click Restore Defaults.
4 Click OK to save your changes.
Batch Setup Reports (vLog VL)The Batch Setup report is a list of loggers set up using the Batch Setup feature. Details include: serial number, description, model number, sample interval, channel unit and description. You can view, edit headers and footers, save, and print the Batch Setup Report.
For more on Batch Setup and configuring data loggers, see “Configuring Loggers: Batch Setup (vLog VL)” on page 46.
To view Batch Setup Reports:
1 Select View | Batch Setup Report.
2 Select the Batch Setup Report (*.bsf) to open. Batch Setup files can be created when you perform batch setups. The Batch Setup Report window opens. The Batch Setup Report window summarizes which, and how, loggers were set up using Batch Setup, and includes the logger serial number, description, logger
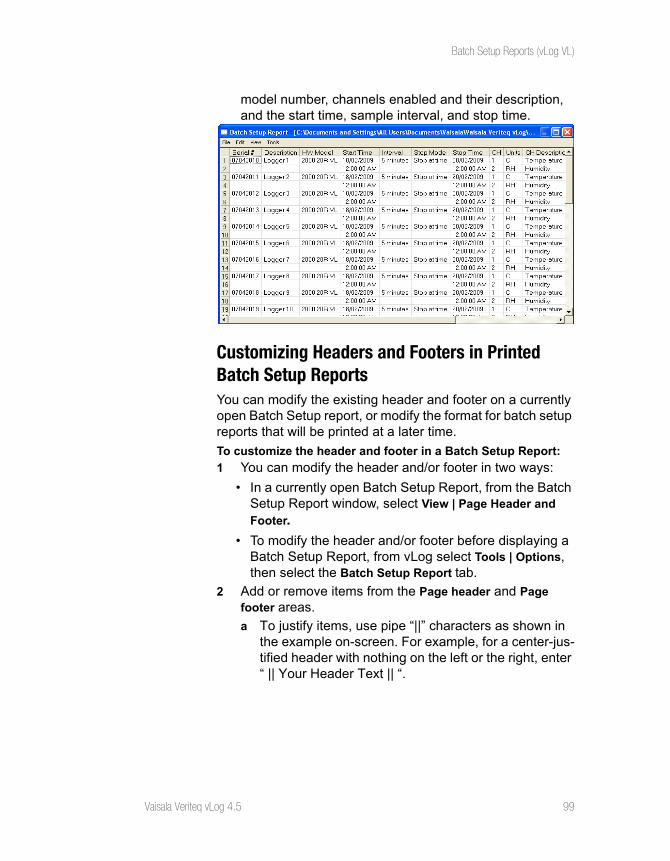
Batch Setup Reports (vLog VL)
Vaisala Veriteq vLog 4.5 99
model number, channels enabled and their description, and the start time, sample interval, and stop time.
Customizing Headers and Footers in Printed Batch Setup ReportsYou can modify the existing header and footer on a currently open Batch Setup report, or modify the format for batch setup reports that will be printed at a later time.
To customize the header and footer in a Batch Setup Report:
1 You can modify the header and/or footer in two ways:
• In a currently open Batch Setup Report, from the Batch Setup Report window, select View | Page Header and
Footer.• To modify the header and/or footer before displaying a
Batch Setup Report, from vLog select Tools | Options, then select the Batch Setup Report tab.
2 Add or remove items from the Page header and Page footer areas.
a To justify items, use pipe “||” characters as shown in the example on-screen. For example, for a center-jus-tified header with nothing on the left or the right, enter “ || Your Header Text || “.
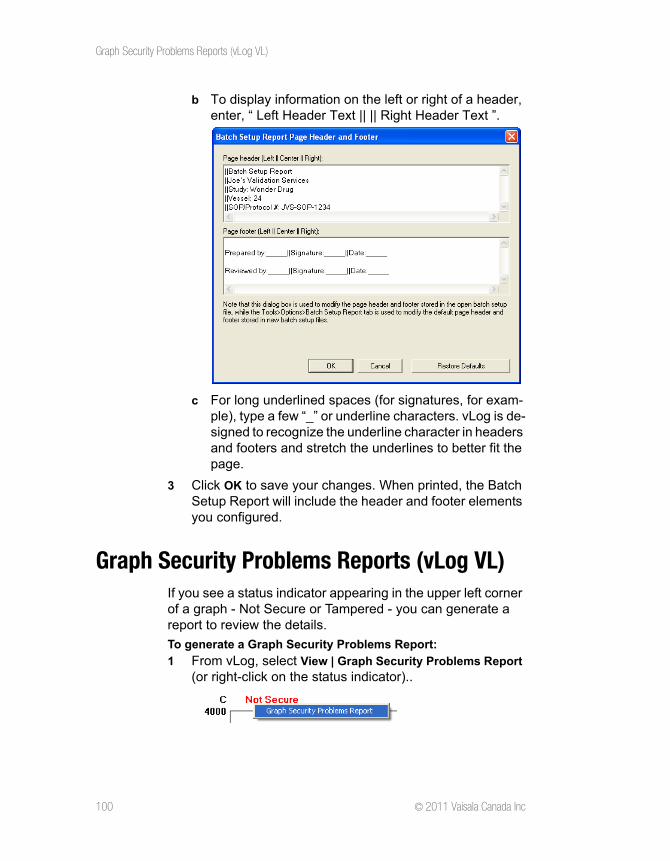
Graph Security Problems Reports (vLog VL)
100 © 2011 Vaisala Canada Inc
b To display information on the left or right of a header, enter, “ Left Header Text || || Right Header Text ”.
c For long underlined spaces (for signatures, for exam-ple), type a few “_” or underline characters. vLog is de-signed to recognize the underline character in headers and footers and stretch the underlines to better fit the page.
3 Click OK to save your changes. When printed, the Batch Setup Report will include the header and footer elements you configured.
Graph Security Problems Reports (vLog VL)If you see a status indicator appearing in the upper left corner of a graph - Not Secure or Tampered - you can generate a report to review the details.
To generate a Graph Security Problems Report:
1 From vLog, select View | Graph Security Problems Report (or right-click on the status indicator)..
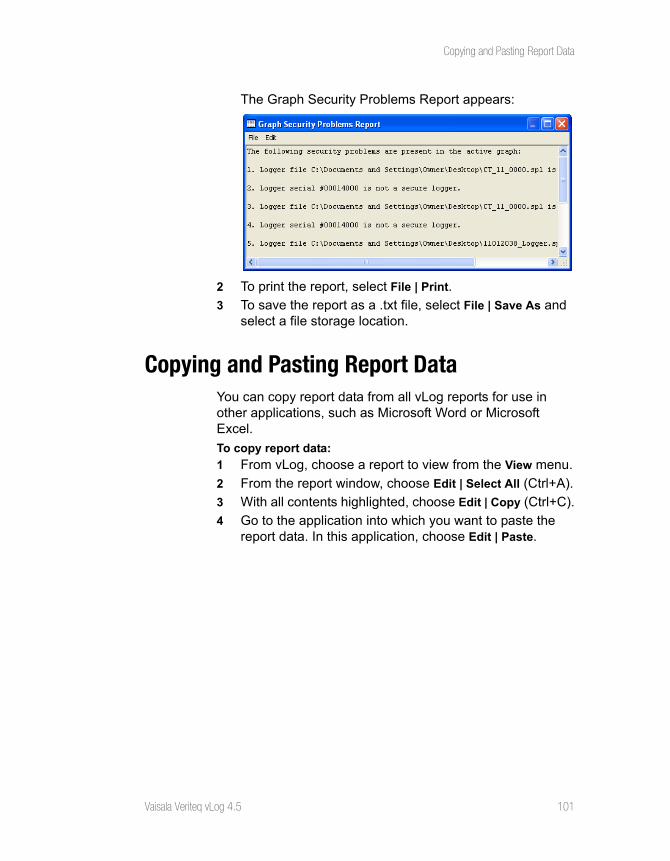
Copying and Pasting Report Data
Vaisala Veriteq vLog 4.5 101
The Graph Security Problems Report appears:
2 To print the report, select File | Print.
3 To save the report as a .txt file, select File | Save As and select a file storage location.
Copying and Pasting Report DataYou can copy report data from all vLog reports for use in other applications, such as Microsoft Word or Microsoft Excel.
To copy report data:
1 From vLog, choose a report to view from the View menu.
2 From the report window, choose Edit | Select All (Ctrl+A).
3 With all contents highlighted, choose Edit | Copy (Ctrl+C).
4 Go to the application into which you want to paste the report data. In this application, choose Edit | Paste.
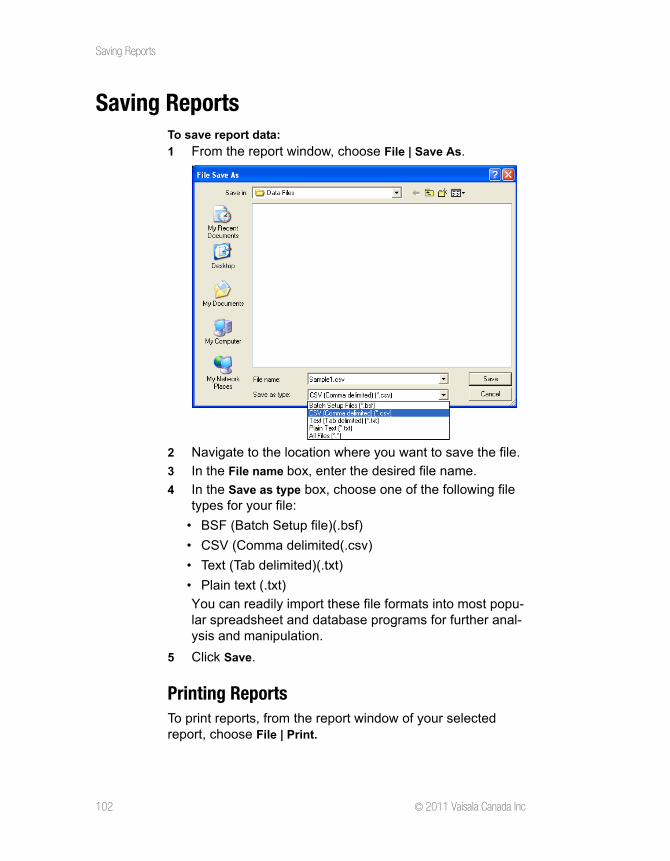
Saving Reports
102 © 2011 Vaisala Canada Inc
Saving ReportsTo save report data:
1 From the report window, choose File | Save As.
2 Navigate to the location where you want to save the file.
3 In the File name box, enter the desired file name.
4 In the Save as type box, choose one of the following file types for your file:
• BSF (Batch Setup file)(.bsf)
• CSV (Comma delimited(.csv)
• Text (Tab delimited)(.txt)
• Plain text (.txt)
You can readily import these file formats into most popu-lar spreadsheet and database programs for further anal-ysis and manipulation.
5 Click Save.
Printing ReportsTo print reports, from the report window of your selected report, choose File | Print.
Vaisala Veriteq vLog 4.5 103
Appendix: FAQs and Troubleshooting
Software Error MessagesUnable to allocate COM port because it is busyvLog was unable to allocate the COM port because it was already allocated by a different program. You may have to wait until the COM port becomes available.
Unable to allocate COM port because it is unavailable vLog was unable to allocate the COM port because it did not exist in the operating system. Check your available COM ports.
Unable to receive sync byte from COM portvLog sent a request message to the data logger, but did not receive any response from the data logger. This could mean the data logger is unplugged or the cable is not connected properly.
Unable to receive all of the bytes from COM portvLog sent a request message to the data logger, but received an incomplete response message from the data logger. This may mean there is a problem with the COM port on this PC, a problem with the cable, or a problem with the logger itself. Check these possibilities.
Unable to communicate with logger on COM portYou may receive this error message for miscellaneous error conditions, other than those listed previously. This message could mean that there is a problem with the COM port on this PC, a problem with the cable, or a problem with the logger.
Things to Try:
• Does the logger and interface cable work on a different PC? If so, the problem likely resides in the serial port configurations on the PC.
Appendix: FAQs and Troubleshooting
104 © 2011 Vaisala Canada Inc
• Are there other devices that use the serial port in question without problems? If so, that port is likely not the problem.
• Can you transfer data using a different interface cable? If so, the cable may be damaged.
• Can you transfer data using a different logger (with the same interface cable)? If so, the data logger may be damaged.
Invalid hardware model vLog did not recognize the hardware model of the data logger, and as a result, did not know how to interpret the information stored in the data logger. Ensure you are using a data logger supported by vLog.
Unable to create logger fileThis error message is generated when vLog attempts to create a logger file on a disk and an error occurs. Some possible reasons include:
• The disk is full.
• The user does not have write access to the disk. Ensure the user has write permission to the folder where the logger file is being saved.
• The file is already open by a different program. Close it.
• The file name is invalid. Try using a more simple .spl file name.
Frequently Asked QuestionsQ: I have recently upgraded Vaisala Veriteq vLog software to the latest version. Will this new software work with my existing loggers and files?A: Yes. Each version of Vaisala Veriteq vLog software is designed with backward compatibility. This means that it works with all previous versions of loggers or files created from those loggers.
Q: I have recently upgraded to Vaisala Veriteq vLog software from an older version of Spectrum software. Will this new software work with my existing Spectrum loggers and files?A: Yes. Vaisala Veriteq vLog (vLog VL or vLog SP) software is designed with backward compatibility and supports Spectrum
Appendix: FAQs and Troubleshooting
Vaisala Veriteq vLog 4.5 105
loggers and Spectrum software files. This means it works with all previous versions of loggers or files created from those loggers. The key difference is that Spectrum loggers use a non-secure file format.
Q: I have recently purchased a new logger. Will it work with my older version of vLog software?A: Not always. In our pursuit of continual product improvement, we periodically upgrade logger hardware or release new logger models. Unfortunately, these changes may not be recognized by an older version of Vaisala Veriteq vLog software and can result in difficulties. For that reason, each logger that you purchase includes a note indicating which software version it must be used with. The safest choice is to always upgrade to the latest version of software. Contact Vaisala Canada Inc if you require a software update.
Q: What is the difference between Vaisala Veriteq VL-Series Loggers and Vaisala Veriteq SP-Series Data Loggers (formerly Spectrum)?A: The primary difference is the VL-Series models provide you with the ability to obtain additional information and utilize security features. Vaisala Veriteq VL-Series Loggers allocate a portion of their internal memory to store important calibration-related parameters.
The stored parameters include the following:
• The company or person who last calibrated the data logger
• The last calibration date
• The next calibration date
• Security information (to prevent unauthorized calibration or manipulation of the data in the logger).
Q: Does the software account for daylight savings time changes?A: Yes. Daylight savings time changes are automatically accounted for in all graph and tabular displays.
Q: How many logger files can I overlay onto the same graph?A: You can overlay many channels of data onto the same graph; in testing, we inserted more than 100 channels successfully.
Appendix: FAQs and Troubleshooting
106 © 2011 Vaisala Canada Inc
Q: Do all graphs have to be created from one data logger?A: No. You can create graphs using files from different data loggers and different data logger models.
Q: I have a version of vLog earlier than version 4.5. What happened to that Verification process? And why, in Version 4.10 and later, has this been replaced by the Logger File ID Number?In Vaisala Veriteq vLog, logger data and graph files can be generated at different times by different people. Consequently, there is a need for verification that the logger files used to create graph files are the right ones. This has been handled in vLog versions prior to version 4.10 by the verification process that required a transfer username and password to be entered in order to verify graphs.
The Logger File ID Number is a more flexible approach that allows users to compare the printed records they have against the logger files they are using to create graphs.
However, if you are an existing customer with VL-Series loggers you can still use usernames and passwords for verification.
Note: Do not use your Windows username and password, as you may be required to share the username and password with others. Also, the username and pass-word option cannot can be used for Batch Transfers in vLog VL.
To configure the username and password prompting option:
1 Select Tools | Options, then choose the Transfer tab.
2 Select the Prompt for username and password when transferring samples checkbox.
3 Click OK. See page 107 for instructions on how to verify a graph with a username and password.
Q: How can I verify a graph on the screen if I have forgotten my pass-word?A: You can’t. Vaisala Veriteq vLog VL software requires the original password when transferring the data logger in order to verify the status of the file. This is a security feature for validation to ensure that the person responsible for transferring the data is also the person who creates the graph. For vLog 4.10 and later, the username and password feature is optional and can be
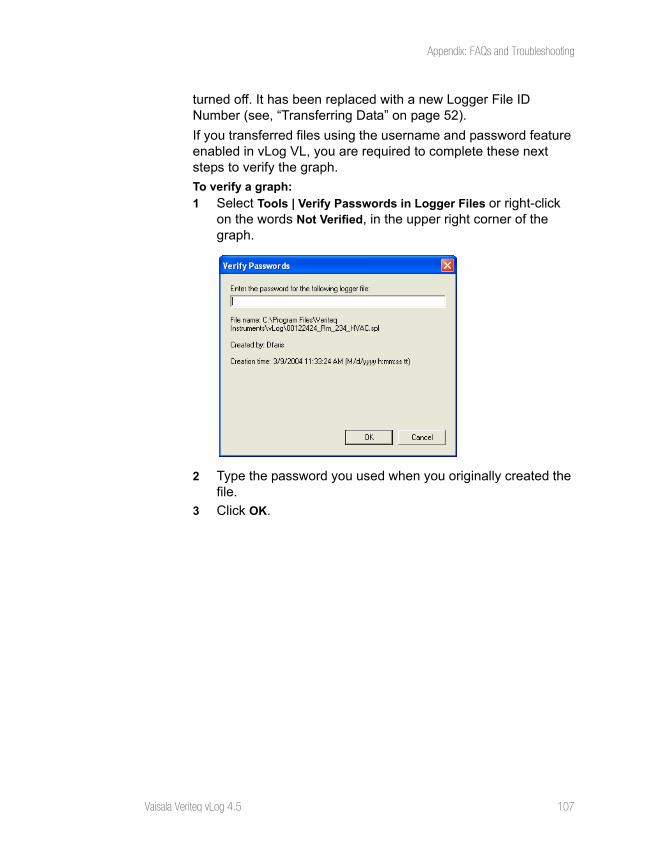
Appendix: FAQs and Troubleshooting
Vaisala Veriteq vLog 4.5 107
turned off. It has been replaced with a new Logger File ID Number (see, “Transferring Data” on page 52).
If you transferred files using the username and password feature enabled in vLog VL, you are required to complete these next steps to verify the graph.
To verify a graph:
1 Select Tools | Verify Passwords in Logger Files or right-click on the words Not Verified, in the upper right corner of the graph.
2 Type the password you used when you originally created the file.
3 Click OK.

Appendix: FAQs and Troubleshooting
108 © 2011 Vaisala Canada Inc
Vaisala Veriteq vLog 4.5 109
Glossary
#
21 CFR Part 11 (vLog VL)A Food and Drug Administration (FDA) rule relating to the use of Electronic Records and Electronic Signatures. The FDA’s view is that the risks of falsification, misinterpretation, and change without leaving evidence are higher with electronic records than paper records, and, consequently, 21 CFR Part 11 has been developed to provide adequate control over these risks.
A– B
Ambient temperatureThe average or mean temperature of the surrounding air that comes in contact with the equipment or instrument.
AxisA line that borders one side of the graph area, providing a frame of reference for measurement or comparison. In vLog software, measurement values are plotted on the vertical Y-axis while date and time values are plotted on the horizontal X-axis.
C–E
CalibrateTo compare and correlate readings against a standard measurement
Calibration certificateDocumented evidence that a product has been calibrated against a standard measurement reference and that it falls within the specified requirements
CFRThe acronym for Code of Federal Regulations; this is a book of federal rules and regulations that are followed by government agencies
Glossary
110 © 2011 Vaisala Canada Inc
ChannelThe path through which an instrument receives the input signals it measures
DewpointDewpoint is defined as the temperature at which the amount of moisture present in the air is the MAXIMUM amount the air can hold (at a constant pressure and water vapor content). This means that when the temperature falls to the dew point, the relative humidity is 100% and the air is considered saturated.
Dewpoint does not vary with temperature, as does relative humidity (RH). Rather, dewpoint is a DIRECT measure of the actual moisture content in the air and thus is preferred as the unit of measurement in many scientific and industrial applications—particularly in tightly controlled environments where precise indications of water content in the air are required.
The dewpoint is never greater than the air temperature. Once the dewpoint is reached and the air temperature continues to drop, water vapor is forced to leave the air through condensation. This condensation may take the form of water droplets, dew, or may remain suspended in the air as clouds or fog.
To better understand how dewpoint and relative humidity are related to each other, try inserting a logger file with relative humidity (RH) channel values into a graph twice—once, displaying RH using dewpoint and once displaying RH using relative humidity.
in vLog, dewpoint readings below 0 degrees C are recorded as frostpoint.
F–K
FDAAn acronym for the US Food and Drug Administration; this is a government agency responsible for enforcing the Federal Food, Drug and Cosmetic Act
Glossary
Vaisala Veriteq vLog 4.5 111
GMPAn acronym for Good Manufacturing Practices; these are the regulations found in the CFR, parts 210 and 211
Graph fileA file that is created to display the data from one or more Logger files. Graph files retain formatting information such as graph title, zoom levels, Y-axis scaling and Logger file data and are identified by their .spg extension (for example, LAB_1.spg)
L–Q
Local timeA value equal to the current time used at a particular location. A relative indicator of time meaningful only if Time Zone Information is also known, Local Time contrasts with UTC Time, an absolute time reference. The software records Local Time and UTC Time in each Logger file.
Logger fileA file that is created after transferring a logger’s data to the PC. The file contains the collected readings (from all active channels) for the transferred logger including the logger’s description, model number, serial number, firmware version number, file description, and Local time. Logger files are identified by their .spl extension (for example, PRIMARY_GAS_FLOW.spl). Logger files cannot be viewed directly—you have to insert the Logger file into a Graph file before the data is displayed as a graph
NISTAn acronym for the National Institute of Standards and Technology
R–T
RangeNormal operating limits, specified by the lowest calibration point to the highest calibration point.
Glossary
112 © 2011 Vaisala Canada Inc
Relative humidityRelative humidity is the measure of the amount of water vapor in the air compared to how much it can possibly hold at that temperature. A relative humidity of 50% means that the air contains only one-half as much water as it could possibly hold. The capacity of air to hold water is heavily dependent on the temperature of the air. The colder the air, the less water it can hold. Air at 50°F can hold only one-quarter the amount of water as air at 95°F
SampleA measurement reading that is stored to data logger’s memory
Sample smoothing (deadband)A setting in vLog (Tools | Options | Insert tab - Sample smoothing) that controls how the samples in a logger file are interpreted when they are inserted into a graph. Sample smoothing (or sample deadband) is the minimum change in the input signal required to cause a change in the displayed channel values. Sample smoothing is used to dampen the effects of noise, and is defined in terms of raw analog-to-digital converter counts.
Sample intervalThe sample interval is the rate at which the logger takes and records readings to memory. The sample interval applies to all enabled channels on the logger. You may want to occasionally change the sample interval on the logger because:
• Faster sample rates may be required by the application
• You need to record readings over a longer duration
• You want to minimize the collection of unnecessary data
ScaleThe range of values a graph displays
Glossary
Vaisala Veriteq vLog 4.5 113
SecureThe status of an on-screen or printed graph file (.spg) that has been created in vLog using data from a VL-Series Data Logger. Although vLog displays graph files produced from SP data loggers, they are labeled Not Secure. Only VL-Series loggers produce secure files.
Serial portThe communications port to which you can attach devices such as a modem, mouse, or serial printer to the computer. The serial communication ports on the computer are commonly referred to as COM1, COM2, COM3, and so on. Serial ports exchange data sequentially, one unit at time.
StabilityThe ability of a sensor or measurement instrument to maintain its performance characteristics over a specified period of time
ThermistorA temperature-sensing element (a thermally-sensitive resistor) composed of sintered semiconductor material that exhibits a large change in resistance in proportion to a small change in temperature. The relationship between temperature and resistance is approximated for most thermistors by the Steinhart-Hart equation.
TraceableCapable of being traced back to a recognized measurement standard or reference
TransferThe term used when the software makes a copy of the data contained in a connected data logger. The transfer process creates a file on the PC but does not affect or delete the data on the logger. Other terms commonly used to describe the transfer process are download, upload, backup, or copy. Transfers can be performed one logger at a time or in batches.
Glossary
114 © 2011 Vaisala Canada Inc
U–Z
USBAn acronym for Universal Serial Bus, a standard for connecting external devices such as a mouse, keyboard, scanner, printer. USB offers many benefits over serial and parallel port connections, including thinner and cheaper cables, greater expandability (with the addition of a USB hub, a single USB port can handle over 100 peripheral devices) and greater speed.
UTCAn acronym for Universal Time Coordinated, UTC is a standard time common to every place in the world. Also known as Greenwich Mean Time (GMT) and World Time; UTC is expressed using a 24-hour clock but can be converted into a 12-hour clock (AM and PM). An absolute time reference that does not rely on Time Zone information, UTC contrasts with Local time. UTC and Local Time information is contained in Logger files and is used to form the time base on logger graphs and data.
ValidatableCapable of being validated. Three issues are essential before equipment can be considered validatable:
• There must be documented evidence of performance verification available. As an example of this requirement for documented evidence, a NIST – traceable calibration certificate is provided with every VL-Series Data Logger
• The equipment must match the specific requirements of the application. Each application may involve special accuracy, operating range, performance stability or other requirements that the product must meet
• The equipment must be capable of maintaining a validated state throughout the application process. The product or its output cannot be manipulated, changed or tampered with
Glossary
Vaisala Veriteq vLog 4.5 115
ValidationValidation is the process of proving that something does what it is supposed to do. The FDA’s definition is “establishing through documented evidence, a high degree of assurance that a specific process consistently produces a product that meets its predetermined specifications and quality characteristics”.
VerifiedThe status of an on-screen or printed graph file (.spg) that has been “verified” by entry of the same password (using Tools | Verify Passwords in Logger Files) used when the file was created (during logger transferring).
Note that the Verified status (Verified or Not Verified) does not appear in vLog graphs if the optional password was not entered during the transferring of the original logger data.
The default verification status of any Graph file that has used a transfer password is Not Verified.
ZoomingEnlarging a portion of an on-screen graph

Glossary
116 © 2011 Vaisala Canada Inc
Index
Vaisala Veriteq vLog 4.5 117
Numerics21 CFR Part 11 109
Aaccounts, user 23activation energy 90administrator options 20, 22
audit trail file path 21security levels 22user accounts 23
ASCII filecreating 83, 84
audit trail 19, 28link 30linking loggers to 31paths to 21reports
date & time columns 97saving reports 102
Audit Trail Reports 94–98averages 89, 90axis 109
unit precision 78
Bbatch setup 27, 46–48
saving reports 102Batch Setup Reports 98–100batch transfers 64
Ccables 16calibration 15, 30, 109celsius 78CFR 109
21 CFR Part 11 109
changingsample interval 37–38time zone 72user accounts 24
channels 39, 110DC current 40description 40, 44, 47disabling or enabling 39factory-disabled 27samples per channel 30thermocouple 60, 69transducers 39voltage 41
checklist for setting up vLog 14checksums 63clear loggers 34clear mode 33clipboard, copying graphs or report data to 8COM ports 103
selecting 25setting up 25troubleshooting 103
configuringdata loggers 26data loggers, individually 27loggers
thermocouples 43loggers in a batch 46–48
copying report data 101csv files 83cursors
positioning 71
Ddata
exporting 83transferring to PCs 54, 64
Index
Index
118 © 2011 Vaisala Canada Inc
data logger. See loggers.data recorder. See loggers.date & time columns in audit trail reports 97dates, setting 64daylight savings time
loggers awareness of 105DC current channels 40deadband 112decimal place precision 78description 28, 31, 32
channels 40, 44, 47loggers 32, 47
descriptions 31dewpoint 110
Ffactory-disabled channels 27fahrenheit 78file security status 5files 83, 102
graph 111inserting into graphs 68logger 52spg 111spl 52, 111
filteringaudit trail report 94
firmware revision 28fonts
in graphs 73in printed reports 91, 92, 97
footers, in reports 97, 99
GGraph Security Problems Report 100graphs 111
adding max, min, avg lines 80copying into clipboard 8, 83
creating 68displaying 68exporting data 83files 111fonts 73horizontal lines 80line number display 82opening 68positioning cursors 71print preview 86printing 85, 86printing with line numbers 85saving 84scrolling 71security problems report 100time zone 72titles 72verification 107zooming 73, 115
Hhardware model 28hardware revision 28headers, in reports 97, 99Help
contacts 9high security 20, 22Historical Data Reports 88–94
customizing headers and footers 92saving 102
horizontal lines 80adding automatically 81adding manually 81
humidity sensor 50
Iicons on the toolbar 7inserting logger files 68installation 12–14
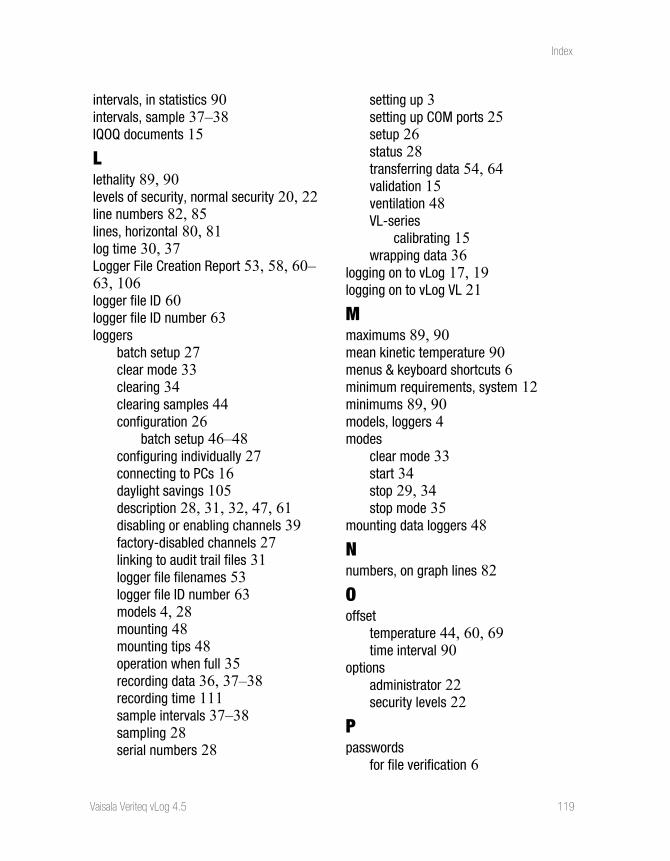
Index
Vaisala Veriteq vLog 4.5 119
intervals, in statistics 90intervals, sample 37–38IQOQ documents 15
Llethality 89, 90levels of security, normal security 20, 22line numbers 82, 85lines, horizontal 80, 81log time 30, 37Logger File Creation Report 53, 58, 60–63, 106logger file ID 60logger file ID number 63loggers
batch setup 27clear mode 33clearing 34clearing samples 44configuration 26
batch setup 46–48configuring individually 27connecting to PCs 16daylight savings 105description 28, 31, 32, 47, 61disabling or enabling channels 39factory-disabled channels 27linking to audit trail files 31logger file filenames 53logger file ID number 63models 4, 28mounting 48mounting tips 48operation when full 35recording data 36, 37–38recording time 111sample intervals 37–38sampling 28serial numbers 28
setting up 3setting up COM ports 25setup 26status 28transferring data 54, 64validation 15ventilation 48VL-series
calibrating 15wrapping data 36
logging on to vLog 17, 19logging on to vLog VL 21
Mmaximums 89, 90mean kinetic temperature 90menus & keyboard shortcuts 6minimum requirements, system 12minimums 89, 90models, loggers 4modes
clear mode 33start 34stop 29, 34stop mode 35
mounting data loggers 48
Nnumbers, on graph lines 82
Ooffset
temperature 44, 60, 69time interval 90
optionsadministrator 22security levels 22
Ppasswords
for file verification 6
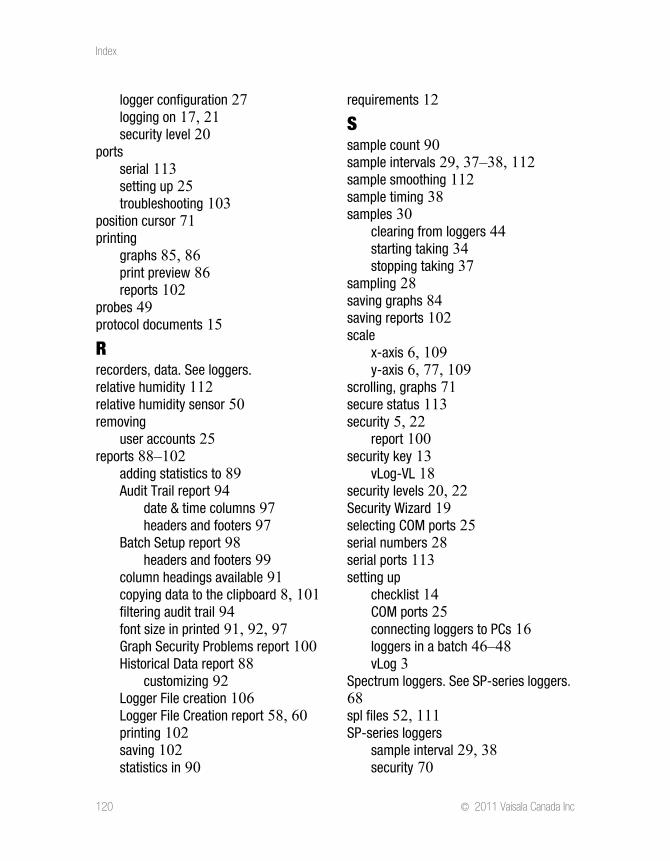
Index
120 © 2011 Vaisala Canada Inc
logger configuration 27logging on 17, 21security level 20
portsserial 113setting up 25troubleshooting 103
position cursor 71printing
graphs 85, 86print preview 86reports 102
probes 49protocol documents 15
Rrecorders, data. See loggers.relative humidity 112relative humidity sensor 50removing
user accounts 25reports 88–102
adding statistics to 89Audit Trail report 94
date & time columns 97headers and footers 97
Batch Setup report 98headers and footers 99
column headings available 91copying data to the clipboard 8, 101filtering audit trail 94font size in printed 91, 92, 97Graph Security Problems report 100Historical Data report 88
customizing 92Logger File creation 106Logger File Creation report 58, 60printing 102saving 102statistics in 90
requirements 12
Ssample count 90sample intervals 29, 37–38, 112sample smoothing 112sample timing 38samples 30
clearing from loggers 44starting taking 34stopping taking 37
sampling 28saving graphs 84saving reports 102scale
x-axis 6, 109y-axis 6, 77, 109
scrolling, graphs 71secure status 113security 5, 22
report 100security key 13
vLog-VL 18security levels 20, 22Security Wizard 19selecting COM ports 25serial numbers 28serial ports 113setting up
checklist 14COM ports 25connecting loggers to PCs 16loggers in a batch 46–48vLog 3
Spectrum loggers. See SP-series loggers. 68spl files 52, 111SP-series loggers
sample interval 29, 38security 70
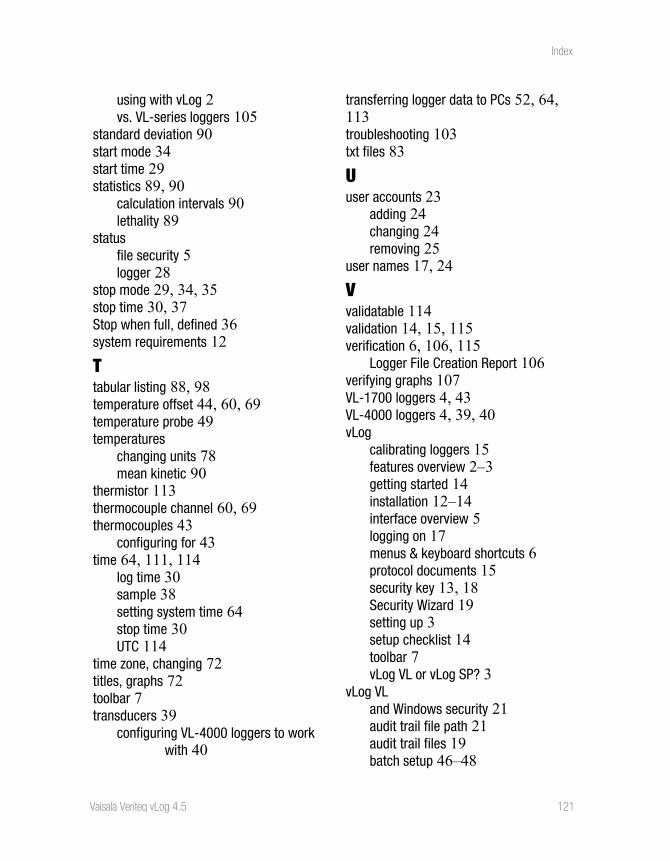
Index
Vaisala Veriteq vLog 4.5 121
using with vLog 2vs. VL-series loggers 105
standard deviation 90start mode 34start time 29statistics 89, 90
calculation intervals 90lethality 89
statusfile security 5logger 28
stop mode 29, 34, 35stop time 30, 37Stop when full, defined 36system requirements 12
Ttabular listing 88, 98temperature offset 44, 60, 69temperature probe 49temperatures
changing units 78mean kinetic 90
thermistor 113thermocouple channel 60, 69thermocouples 43
configuring for 43time 64, 111, 114
log time 30sample 38setting system time 64stop time 30UTC 114
time zone, changing 72titles, graphs 72toolbar 7transducers 39
configuring VL-4000 loggers to work with 40
transferring logger data to PCs 52, 64, 113troubleshooting 103txt files 83
Uuser accounts 23
adding 24changing 24removing 25
user names 17, 24
Vvalidatable 114validation 14, 15, 115verification 6, 106, 115
Logger File Creation Report 106verifying graphs 107VL-1700 loggers 4, 43VL-4000 loggers 4, 39, 40vLog
calibrating loggers 15features overview 2–3getting started 14installation 12–14interface overview 5logging on 17menus & keyboard shortcuts 6protocol documents 15security key 13, 18Security Wizard 19setting up 3setup checklist 14toolbar 7vLog VL or vLog SP? 3
vLog VLand Windows security 21audit trail file path 21audit trail files 19batch setup 46–48
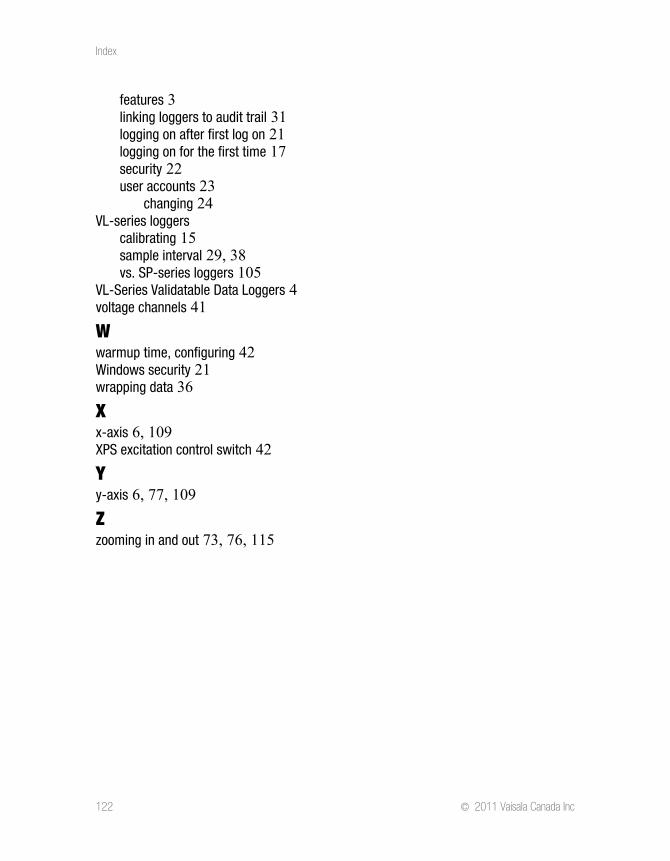
Index
122 © 2011 Vaisala Canada Inc
features 3linking loggers to audit trail 31logging on after first log on 21logging on for the first time 17security 22user accounts 23
changing 24VL-series loggers
calibrating 15sample interval 29, 38vs. SP-series loggers 105
VL-Series Validatable Data Loggers 4voltage channels 41
Wwarmup time, configuring 42Windows security 21wrapping data 36
Xx-axis 6, 109XPS excitation control switch 42
Yy-axis 6, 77, 109
Zzooming in and out 73, 76, 115