vlx the global cable assembly specialists - volex · pdf filesolutions servicing a diverse...
TRANSCRIPT

25431.02 22 June 2017 11:48 AM Proof 8 25431.02 22 June 2017 11:48 AM Proof 8
Volex p
lc Annual R
eport and
Accounts 2017
Stock C
ode: V
LX
Annual Report and Accounts 2017
The Global Cable Assembly Specialists
Volex AR2017 Front.indd 3 22/06/2017 11:56:48

25431.02 22 June 2017 11:48 AM Proof 8 25431.02 22 June 2017 11:48 AM Proof 8
Welcome to our 2017 Annual ReportWho we are
We are a leading global supplier of power cords and cable assembly solutions servicing a diverse range of markets including consumer electronics, medical equipment, data centres, telecommunications, industrial robotics and the automotive industry.Volex is headquartered in the UK but we operate from eight manufacturing locations and we employ approximately 6,000 staff across nineteen countries. Volex’s products are sold through its own global sales force and distributors to Original Equipment Manufacturers (OEM’s) and Electronic Manufacturing Services companies.
Volex’s products and services are integral to the increasingly sophisticated digital world in which we live, providing power and connectivity to everyday items as well as complex machinery.
ScaleVolex is one of the two largest power cord manufacturers in the world allowing it to benefit from economies of scale. Our
global manufacturing footprint, spanning three continents is a
key competitive advantage.
QualityVolex has an unrivalled reputation in the industry for quality. Whilst our competition may be cheaper, none have the consistent safety
record of Volex.
ExperienceWith over a 100 years’ experience
in energy storage and transmission, there are few cabling problems that our engineering team can’t
solve. Volex continues to be at the forefront of rapid data transmission
cabling technology.
How we do itVolex has eight manufacturing facilities located across six countries. These factories are supported by sales offices in a further thirteen countries and a number of leased warehouses and stock hubs close to our key customers in order to support their global operational requirements.
Whilst all of our factories are capable of power cord and cable assembly production, the majority of power cord production is performed in China, close to the raw material suppliers and where the labour cost is still relatively low. Power cord procurement and engineering is managed centrally from our Asian head office in Singapore.
Cable Assembly production tends to be more bespoke and therefore our key factories have developed their own manufacturing, procurement and engineering processes. Our factory in Suzhou caters primarily for the high speed data transmission cables, our factory in Poland for European healthcare and telecommunications customers and our factory in Mexico for North American healthcare customers.
Our key differentiators
Volex differentiates itself from the competition in three key aspects:
Read more about our Business Model on page 08
Annual Report and Accounts 2017 Stock code: VLX
Volex AR2017 Front.indd 4 22/06/2017 11:56:49

25431.02 22 June 2017 11:48 AM Proof 8
Read more about on Pages
Strategic ReportExecutive Chairman’s Statement 02
About Volex plc 05
Our Locations 06
Our Marketplace 07
Our Business Model 08
Strategy 10
Key Performance Indicators 11
Operational Review 12
Divisional Review 14
Financial Review 16
Group Risk Management 20
Corporate and Social Responsibility 24
GovernanceBoard of Directors 26
Chairman’s Introduction 28
Corporate Governance Report 29
Audit Committee Report 34
Remuneration Report 37
Directors’ Report 52
Independent Auditor’s Report 56
Financial StatementsConsolidated Income Statement 64
Consolidated Statement of Comprehensive Income
65
Consolidated and Company Statement of Financial Position
66
Consolidated and Company Statements of Changes in Equity
67
Consolidated and Company Statement of Cash Flows
68
Notes to the Financial Statements 69
Other Financial Information
Five Year Summary 105
Subsidiaries 106
Shareholder Information 108
Registered Office and Advisors 108
Look out for these icons:Read more online at: www.volex.com
Read more online at: www.volex.com
Contents
10Our Strategy
25431.02 7 June 2017 5:01 PM Proof 2 25431.02 7 June 2017 5:01 PM Proof 2
Our Business Model
Volex’s business model is based on adding value to customer products, delivered through our expertise in design and development, manufacturing and testing, and excellent customer service from our global footprint.We aim for ‘trusted partner’ status with our customers whereby we can engage with their product development cycles at an early stage to provide solutions that meet their specific requirements for product performance and quality, greater efficiency and timely delivery.
Read more about our Lorem Ipsum on page ••
Read more about our Lorem Ipsum on page ••
Competitive advantage derived from
Consumer ElectronicsPrimarily supplying power cords to the manufacturers of PC’s, laptops, tablets,
printers, TV’s and other domestic appliances. Cost tends to be a critical factor
in winning new business in this field.
HealthcareThe supply of both power cords and
complex wiring harnesses to the manufacturers of medical diagnostic
equipment such as CT and MRI scanners. Here quality and reliability are the critical
success factors
Datacoms/TelecomsThe supply of industry standard cables
which can guarantee high speed, reliable data transmission at a reasonable price
point. This is seen as one of the key growth areas for Volex in the coming years.
Industrial The supply of wiring harnesses to the
industrial robotic industry. These harnesses can range from the extremely simple to the
mind-boggling complex.
Automotive
the supply of power chargers to the electric car industry. This is a new market
for Volex and one viewed as potentially high growth utilising our in-depth
knowledge of power transmission.
Engineering/DesignWe design solutions that meet the power and
connectivity needs of our customers whilst also addressing the challenges our customers face
with their next-generation products.
We collaborate with our customers’ engineering team at an early stage of the design/development
cycle to produce design blueprints that utilise latest technologies to ensure cost-effective,
high performance products. Our design-to-cost strategy seeks to ensure the products meet both the customer’s quality and price expectations.
Supply Chain ManagementWe manage, on behalf of our customers, the sourcing of all required components, for their
cable assembly solutions. We seek to own the bill of materials for all our products, allowing selection of components that offer the best
all round performance, after considering cost, quality and delivery response times.
ManufacturingWe manufacture and test cable assembly
solutions according to customer requirements for volume, quality, lead-time and price.
Our global manufacturing footprint and distribution hubs enable cost-efficient localised
production and effective inventory control.
Global LogisticsWe maintain facilities over three continents
in order to be a ‘local’ supplier to customers and better support their own production and speed to market objectives. Our customer
hubs enable us to support fully our customers’ just-in-time manufacturing processes.
Within these markets Delivered through
Engineering/DesignConsumer Electronics
Supply Chain ManagementHealthcare
ManufacturingDatacoms / Telecoms
Industrial
Automotive
Global Logistics
Within these Markets Delivered Through
Product Development
Contract Manufacturing
Cable Assembly Specialising in
Competitive advantage derived from:
Unrivalled global manufacturing
footprint
Respected brand known for quality and
reliability
Scale
Contract ManufacturingTaking a customer blueprint, Volex can source the raw materials (either independently or from an Approved
Vendor Listing), build the manufacturing line and develop rigorous testing procedures to ensure the cable is produced in the required volumes, in accordance with national safety
requirements, at a low cost price point.
Product DevelopmentShould a customer choose to outsource
its entire cabling function, our team of experienced engineers can engage with
the customer’s product development team at an early stage to design and build the best cabling solution for their needs.
Cable Assembly Specialising in
Unrivalled global manufacturing footprint
None of our direct competitors are able to offer manufacturing facilities located over six separate countries,
across three continents. For our global customers this offers one global
supplier but with detailed knowledge of their key local markets and an ability
to reduce local lead times.
Respected brand known for quality and reliability
Volex is unable to compete purely on price, however, of importance to our premium customer base is quality and reliability. Brand names are
quickly tarnished should products fail or catch fire. Volex has an enviable reputation in the market for safety
and a detailed understanding of local regulatory requirements.
Scale
In a very fragmented power cord market, Volex is one of the two
largest producers with approximately 7% market share. This allows Volex to benefit from economies of scale with significant purchasing power in
the Chinese wire market.
The Volex brand is maintained and financial sustainability is generated throughout the process,
adding value to both Volex and its shareholders.
Sustainable Value
Annual Report and Accounts 2017 Stock code: VLX www.volex.com STRATEGIC REPORT
Volex plc Volex plc 0908
Volex AR2017 Proof 2.indd 8-9 08/06/2017 10:29:20
08Our Business Model
05About Volex plc
26Our Board of Directors
Volex plc 01
www.volex.com STRATEGIC REPORT
Volex AR2017 Front.indd 1 22/06/2017 11:56:57

25431.02 22 June 2017 11:48 AM Proof 8
Executive Chairman’s StatementNathaniel Rothschild
Volex delivers strong cash generation and returns to a net cash position.
Restructuring activities and tight cost control contribute to an increase in
underlying operating margins.
I have now served as Chairman of Volex for over 18 months and whilst the environment continues to be both competitive and extremely challenging, I am pleased to report that many of the initiatives started by our new management team are beginning to yield results. There has been strong progress at the factory level with improvements in operational efficiency and reductions in both inventories and factory operating expenses. Together with the restructuring activities (that have included downsizing of our largest Chinese factory and the closure of our Brazil factory) I am pleased to report an underlying operating profit* for the year of $9.1 million, up 26.6% on the prior year. Furthermore, through tight working capital management, we have returned Volex to a net cash position at year-end of $11.3 million. The Group has negotiated extended credit facilities of $30.0 million and we now have a stronger and more stable foundation upon which to grow our business.
In addition to operational initiatives, we have embarked on an improved Power Cords sales strategy which is expected to generate new sources of revenue in the coming year. Volex continues to occupy an enviable leadership position in the power space, consistently occupying a top 5 position for more than a decade, and with a market leading position in Japan. However, it no longer makes sense to compete head-to-head on price with the high volume ultra-low cost vertically-integrated Chinese cable manufacturers. Instead we are going to focus on growing our premium brand customers who require global scale, reliability and quality. We have enjoyed several major new customer wins in the higher value-added and growing markets of electric vehicles and high-end power cords. This new business is expected to result in a growth in our revenue in the coming year.
On the Cable Assembly side of our business, the picture is much more positive: we are expecting strong growth across a range of accounts and industries, and expect this segment to experience revenue growth in 2018, driven by strong sales to North America, from our strategically located Tijuana facility.
Recent performanceAlthough revenue for FY2017 at $319.6 million is 13% down on the prior year, this decline can be attributed to three key accounts. Sales to our single largest customer accounted for 77% of the decline (or $36.7 million), however, we believe that the sales have now stabilised and are exploring new areas to diversify our revenue stream and re-build our position with this customer. Sales to our largest telecoms customer (which is experiencing intense price competition from a low-cost Chinese rival) fell 23% to $16.8 million whilst sales to a US customer operating in the logistics sector fell by 46% to $8.6 million. This market has long been cyclical and we expect to see a recovery in the coming year.
Excluding these three customers, revenue from the remaining business has grown by $1.2m. We expect four new customers to scale in the year ahead and these are expected to contribute over $10 million between them in FY2018.
We inherited a business that was in decline due to an over-reliance on a small number of very large customers and a product range that was over-exposed to a declining PC market. The Group had struggled to diversify its business, failing to tackle an uncompetitive cost structure, high staff turnover, slow response times and a focus by our sales force to harvest the key accounts rather than seek out new revenues. Each of these factors are being addressed by our new team and as a result we are optimistic of bringing on a number of new revenue streams in the coming year to diversify our business and deliver overall growth.
The reduction in revenue from our largest customer resulted in the decision to significantly restructure our Shenzhen facility during the year. The fixed costs have been reduced through closure of a large warehouse facility and the return of one leased production-building to the landlord, with the headcount and support costs similarly reduced. Historic over investment in production capacity for our largest customer, had resulted in excess capacity at this site for a number of years.
* Operating profit before non-recurring items and share-based payments expense
Annual Report and Accounts 2017 Stock code: VLX
Volex plc02
Volex AR2017 Front.indd 2 22/06/2017 11:57:01

25431.02 22 June 2017 11:48 AM Proof 8
As a result, following the latest fall in revenue and no immediate sign of recovery, it was concluded that those assets specific to this customer should be impaired, leading to a $12.0 million non-cash impairment charge. The majority of these assets had been acquired in 2012 and 2013.
Going forward, we will focus on profitable growth and will measure all new business against internal return on capital targets to ensure that shareholders’ returns are protected and enhanced.
Turning to the wider business, I am pleased to report that underlying profitability has improved year on year with the underlying gross profit margin up 1.0% to 17.4% and underlying operating margin up 0.8% to 2.8%. As soon as it became apparent that revenue would fall short of expectation, the Group reacted swiftly by further reducing its cost base. Actions in addition to the downsizing of our Chinese factory included:
• Closure of our Brazil factory;
• Closure of a number of our regional sales offices with sales responsibilities transferred either to other sales offices or to the factories themselves;
• Closure of a number of our stock-holding hubs in Asia; and
• Closure of a US facility and a 50% reduction in the size of our Singapore headquarters.
These actions when combined with the actions taken in the prior year have helped significantly reduce the underlying fixed cost base.
Furthermore the manufacturing optimisation reviews which took place in each of our factories have helped improve the underlying gross margin despite the deleveraging effect of lower volumes passing through certain factories. As noted in last year’s accounts, our Mexico facility was chosen as the pilot site in which all aspects of the production process were being reviewed and improved. During the current year, this project continued and has been extended to all of our other facilities.
As a result of these significant cost reduction measures, the ongoing rigorous cost control, operational efficiency improvements and favourable foreign exchange rate movements, the Group has recorded an underlying operating profit of $9.1 million in the year, up $1.9 million on the prior year.
The reduction in working capital that has arisen through both reduced trade and active working capital management (particularly in the area of stock) has helped generate a healthy $15.9m of operating cash inflow. This has resulted in the Group reporting net cash at year-end of $11.3m.
The opportunity aheadFY2017 has been a year of transition in which Volex moves away from its old sales strategy of focusing on our large existing customers to targeting new accounts. This has necessitated personnel changes within our sales and engineering functions and with the on-boarding of new customers typically taking between 12 and 18 months, the full impact of the new strategy is not expected until next year. However, the Group has reason to be encouraged about multiple new opportunities within its sales pipeline particularly in the areas of high speed data cabling, required for data centres, and high current power cables, required for electric vehicles.
Our Power Cord business will continue to be highly competitive and any cost savings can lead to competitive advantage. We remain excited about our previously announced joint venture agreement with a Taiwanese manufacturer which aims to produce competitively priced Volex-branded AC raw cables. We expect to benefit from cost reductions from these activities in the coming financial year.
In Cable Assemblies we see a number of major opportunities from customers who want access to our global footprint and consistent levels of high quality. We are starting to enter mass production on a number of new and sizeable projects and expect to report growth in this division in the coming year.
As the business recovers, we will need to invest in our people and our technical capabilities. We expect to continue to invest in our sales, engineering and procurement organisations in the coming year in order to maximise our growth potential.
PeopleSince becoming Chairman, Daren Morris (our CFO) and I have relentlessly visited our sites and had the opportunity to meet more of our people. It is evident that Volex’s recent turnaround is a result of the skill and dedication of our employees who have embraced the changes we are trying to make especially a cultural shift towards continuous improvement. Volex continues to invest in its people through a variety of programmes and has been able to make a number of senior appointments this year from internal talent. On behalf of the Board, I would like to thank all the 6,000 employees for their contribution to an excellent year, it is their hard work and commitment that is the reason for our success this year.
OutlookIt has been a year of significant progress and I am very positive about the further opportunities for the Group, even as our markets remain fiercely competitive. With an encouraging set of projects in the sales pipeline, which we believe will offset any further reductions seen in the existing customer base, we anticipate that our revenues have stabilised at the current level and expect to deliver modest growth in the coming year.
Similarly we expect the full year impact of our cost reduction measures and operational improvements to offset any commodity price rises and therefore believe margins will be maintained at a similar level in the year ahead.
As a result, I am confident in Volex’s ability to continue to make progress and deliver further value to our shareholders.
Yours sincerely,
Nathaniel RothschildExecutive Chairman
www.volex.com STRATEGIC REPORT
Volex plc 03
Volex AR2017 Front.indd 3 22/06/2017 11:57:02

25431.02 22 June 2017 11:48 AM Proof 8
04Strategic ReportAbout Volex plc 05Our Locations 06Our Marketplace 07Our Business Model 08Strategy 10Key Performance Indicators 11Operational Review 12Divisional Review 14Financial Review 16Group Risk Management 20Corporate and Social Responsibility 24
Annual Report and Accounts 2017 Stock code: VLX
Volex AR2017 Front.indd 4 22/06/2017 11:57:04
25431.02 22 June 2017 11:48 AM Proof 8
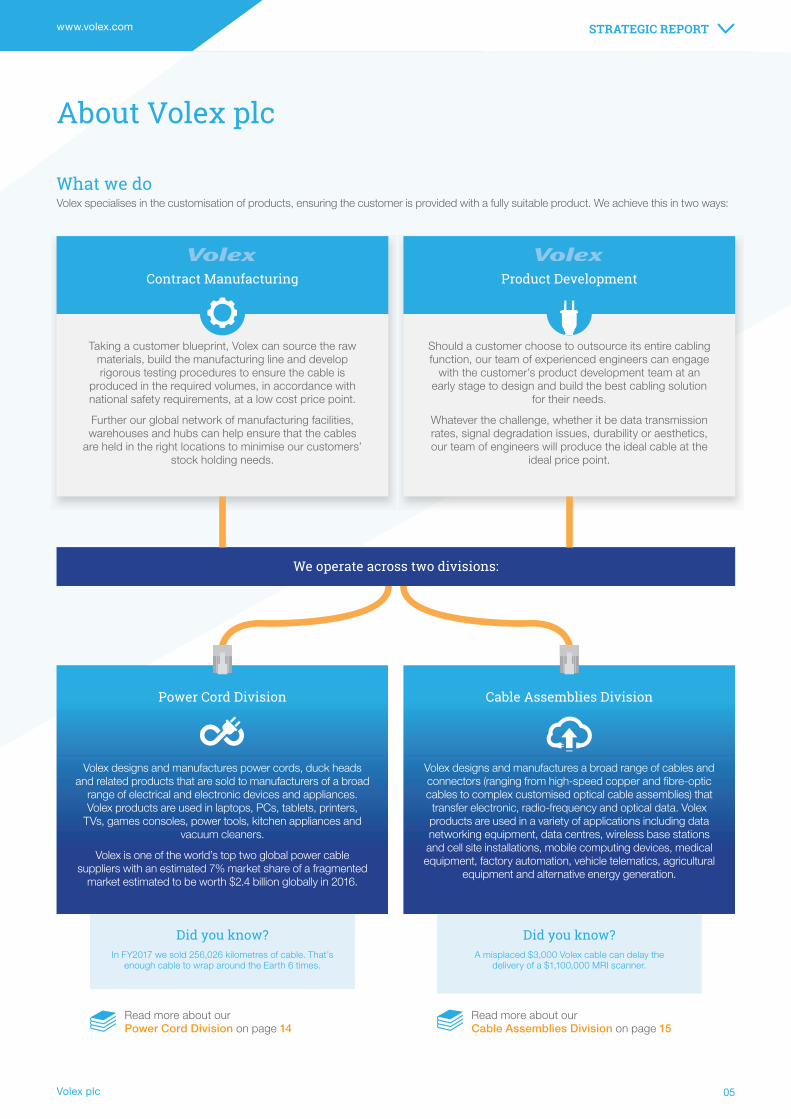
Should a customer choose to outsource its entire cabling function, our team of experienced engineers can engage
with the customer’s product development team at an early stage to design and build the best cabling solution
for their needs.
Whatever the challenge, whether it be data transmission rates, signal degradation issues, durability or aesthetics, our team of engineers will produce the ideal cable at the
ideal price point.
Taking a customer blueprint, Volex can source the raw materials, build the manufacturing line and develop rigorous testing procedures to ensure the cable is
produced in the required volumes, in accordance with national safety requirements, at a low cost price point.
Further our global network of manufacturing facilities, warehouses and hubs can help ensure that the cables
are held in the right locations to minimise our customers’ stock holding needs.
About Volex plc
Did you know?In FY2017 we sold 256,026 kilometres of cable. That’s
enough cable to wrap around the Earth 6 times.
Did you know?A misplaced $3,000 Volex cable can delay the
delivery of a $1,100,000 MRI scanner.
Cable Assemblies Division
What we doVolex specialises in the customisation of products, ensuring the customer is provided with a fully suitable product. We achieve this in two ways:
Volex designs and manufactures power cords, duck heads and related products that are sold to manufacturers of a broad
range of electrical and electronic devices and appliances. Volex products are used in laptops, PCs, tablets, printers,
TVs, games consoles, power tools, kitchen appliances and vacuum cleaners.
Volex is one of the world’s top two global power cable suppliers with an estimated 7% market share of a fragmented
market estimated to be worth $2.4 billion globally in 2016.
Volex designs and manufactures a broad range of cables and connectors (ranging from high-speed copper and fibre-optic cables to complex customised optical cable assemblies) that transfer electronic, radio-frequency and optical data. Volex products are used in a variety of applications including data networking equipment, data centres, wireless base stations and cell site installations, mobile computing devices, medical equipment, factory automation, vehicle telematics, agricultural
equipment and alternative energy generation.
Power Cord Division
We operate across two divisions:
Product DevelopmentContract Manufacturing
Read more about our Power Cord Division on page 14
Read more about our Cable Assemblies Division on page 15
www.volex.com STRATEGIC REPORT
Volex plc 05
Volex AR2017 Front.indd 5 22/06/2017 11:57:06
25431.02 22 June 2017 5:11 PM Proof 8
Our Locations
Key
Regional Head OfficeHeadquarters
SalesManufacturing
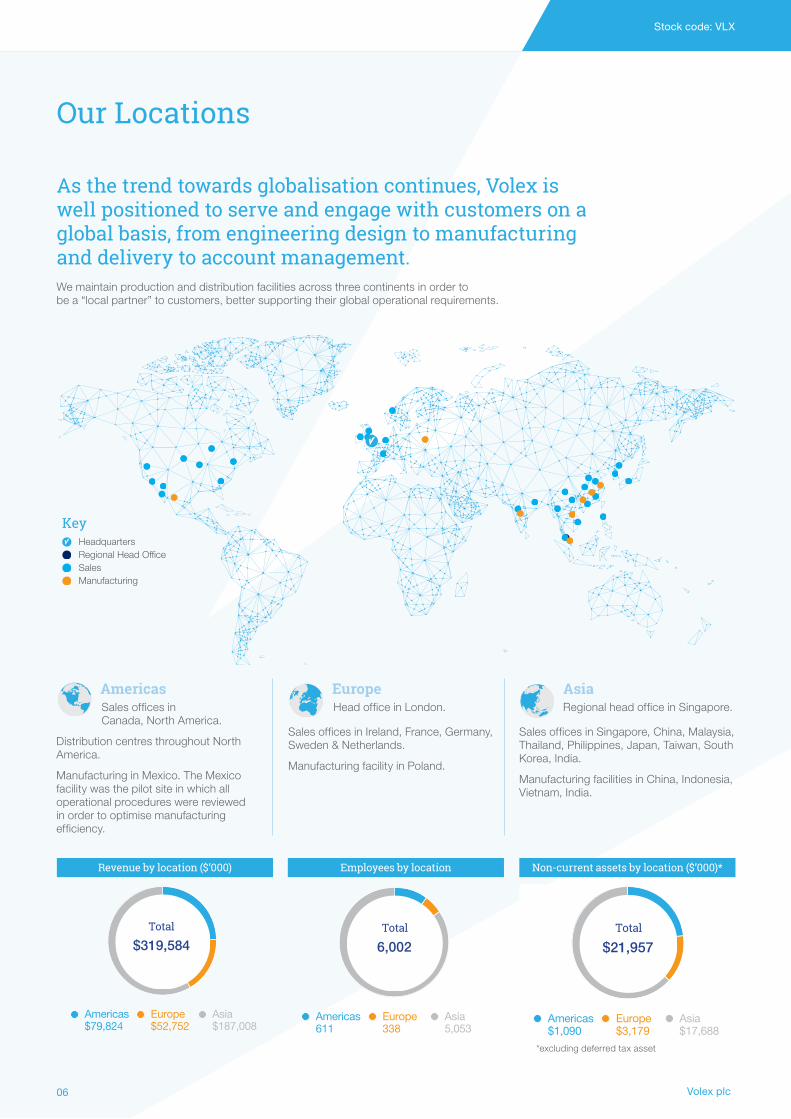
As the trend towards globalisation continues, Volex is well positioned to serve and engage with customers on a global basis, from engineering design to manufacturing and delivery to account management.
Total
$319,584
Americas Europe Asia$79,824 $52,752 $187,008
Total
6,002
Americas Europe Asia611 338 5,053
Total
$21,957
Americas Europe Asia$1,090 $3,179 $17,688
Revenue by location ($’000)
AmericasSales offices in Canada, North America.
Distribution centres throughout North America.
Manufacturing in Mexico. The Mexico facility was the pilot site in which all operational procedures were reviewed in order to optimise manufacturing efficiency.
Employees by location Non-current assets by location ($’000)*
We maintain production and distribution facilities across three continents in order to be a “local partner” to customers, better supporting their global operational requirements.
EuropeHead office in London.
Sales offices in Ireland, France, Germany, Sweden & Netherlands.
Manufacturing facility in Poland.
Asia Regional head office in Singapore.
Sales offices in Singapore, China, Malaysia, Thailand, Philippines, Japan, Taiwan, South Korea, India.
Manufacturing facilities in China, Indonesia, Vietnam, India.
*excluding deferred tax asset
Annual Report and Accounts 2017 Stock code: VLX
Volex plc06
Volex AR2017 Front.indd 6 23/06/2017 11:30:39

25431.02 22 June 2017 11:48 AM Proof 8
Read more about our Business Model on page 08
Our Marketplace
308.1
315.3
2014
2013
276.72015
258.22016
249.12020
272.62019
millions of units
Consumer Electronics High speed solutions Healthcare
Trends affecting the market
• Global PC sale volumes dropped in 2016 by 6.7% marking the fifth consecutive year of decline due to further cannibalisation of the market by the smartphone.
• Tablet sales by our largest customer declined by 11.6% in the year and laptop sales by 5.7%.
• Global printer shipments declined by 4.1% in 2016.
• Product miniaturisation is leading to fewer devices requiring a traditional power cord instead charged via a USB cable.
• Improving battery technology sees increase in cordless domestic appliances.
• Global data centre traffic has grown by approx. 40% in 2016 to 6.5 Zettabytes and is forecast to grow by a further 240% over the next 4 years fuelled by increasing cloud usage.
• To meet this growth, the number of “hyperscale” data centres will grow from 259 in 2015 to 485 by 2020 – an 87% growth.
• The transition to the “software-as-a-service” model is fuelling the above growth as companies dispense with local privately owned servers and instead store data in large data centres.
• Global medical technology expenditure is expected to grow with a CAGR of 5% from 2017 to 2022.
• Within this, the global diagnostic imaging market is forecast to grow with a CAGR of 6.6%.
• This growth is fuelled by an ageing population in the West and the improved wealth of the Chinese “middle class”.
• Medical robotic shipments are forecast to grow with a CAGR of 21.1% between 2016 and 2021.
What this means to Volex
• Volex’s traditional markets for power cords are in decline due to changing tastes and disruptive technology.
• The competition for power cord sales to this reducing market will continue to intensify putting further pricing pressure on already thin margins.
• Volex manufactures a market leading QSFP+ cable which supports four 10 Gbit/sec channels carrying 10 Gigabit Ethernet, 10GFC FiberChannel, or QDR InfiniBand. This is one of the fastest data transmission cables available and is produced at a competitive price from our Suzhou factory.
• Volex already supplies cabling solutions to a number of healthcare imaging manufacturers including one of the world’s largest. This company is looking to consolidate its fragmented supply chain and Volex is their preferred cable provider.
How we are responding
• Revised sales strategy to target only those global customers with a premium brand name for which product quality and service reliability are as important as cost.
• Diversify our sales from our traditional markets but which will require Volex’s expertise in power cord production. In FY2018 we expect to ship our first power cables to the electric car industry (electric cars are expected to make up 35% of global car sales by 2040).
• Look at strategic initiatives to further reduce our cost base. The setting up of the joint venture to develop and manufacture cheaper Volex-branded AC raw cables is the first such initiative.
• At present we have a key strategic partnership with a leading Infiniband and Ethernet hardware storage supplier. We will look to further cement this relationship over the coming years.
• Targeting those potential customers not covered by our strategic partnership and talking direct to their procurement teams in order to establish a trading relationship in the future.
• Continue to fund our R&D function in order to ensure our high speed data transmission cables remain at the forefront of cable technology.
• Volex is looking to build on its market position through focusing on our reputation for reliability and quality.
• Due to the high growth prospects in this field over the coming years, Volex is investigating a number of strategic initiatives to further our sales including a number of small joint venture start-ups.
Global PC Sales Data Centre storage capacity Global medical technology spend
2017
2016
20150 2,0001,5001,000500
2018
2019
2020
Public Private Traditional Data Centre
Exabytes
2019
2018
2017
2016
2020
2021
2022 530
506483459
436414392
$ billions
www.volex.com STRATEGIC REPORT
Volex plc 07
Volex AR2017 Front.indd 7 22/06/2017 11:57:09

25431.02 22 June 2017 11:48 AM Proof 8
Our Business Model
Volex’s business model is based on adding value to customer products, delivered through our expertise in design and development, manufacturing and testing, and excellent customer service from our global footprint.We aim for ‘trusted partner’ status with our customers whereby we can engage with their product development cycles at an early stage to provide solutions that meet their specific requirements for product performance and quality, greater efficiency and timely delivery.
Read more about Our Marketplace on page 07
Read more about Our Performance on page 12
Engineering/DesignConsumer Electronics
Supply Chain ManagementHealthcare
ManufacturingDatacoms / Telecoms
Industrial
Automotive
Global Logistics
Within these Markets Delivered Through
Product Development
Contract Manufacturing
Cable Assembly Specialising in
Competitive advantage derived from:
Unrivalled global manufacturing
footprint
Respected brand known for quality and
reliability
Scale
The Volex brand is maintained and financial sustainability is generated throughout the process,
adding value to both Volex and its shareholders.
Sustainable Value
Annual Report and Accounts 2017 Stock code: VLX
Volex plc08
Volex AR2017 Front.indd 8 22/06/2017 11:57:13

25431.02 22 June 2017 11:48 AM Proof 8
Competitive advantage derived from
Consumer ElectronicsPrimarily supplying power cords to the manufacturers of PC’s, laptops, tablets,
printers, TV’s and other domestic appliances. Cost tends to be a critical factor
in winning new business in this field.
HealthcareThe supply of both power cords and
complex wiring harnesses to the manufacturers of medical diagnostic
equipment such as CT and MRI scanners. Here quality and reliability are the critical
success factors
Datacoms/TelecomsThe supply of industry standard cables
which can guarantee high speed, reliable data transmission at a reasonable price
point. This is seen as one of the key growth areas for Volex in the coming years.
Industrial The supply of wiring harnesses to the
industrial robotic industry. These harnesses can range from the extremely simple to the
mind-boggling complex.
Automotive
The supply of power chargers to the electric car industry. This is a new market
for Volex and one viewed as potentially high growth utilising our in-depth
knowledge of power transmission.
Engineering/DesignWe design solutions that meet the power and
connectivity needs of our customers whilst also addressing the challenges our customers face
with their next-generation products.
We collaborate with our customers’ engineering team at an early stage of the design/development
cycle to produce design blueprints that utilise latest technologies to ensure cost-effective,
high performance products. Our design-to-cost strategy seeks to ensure the products meet both the customer’s quality and price expectations.
Supply Chain ManagementWe manage, on behalf of our customers, the sourcing of all required components for their
cable assembly solutions. We seek to own the bill of materials for all our products, allowing selection of components that offer the best
all round performance, after considering cost, quality and delivery response times.
ManufacturingWe manufacture and test cable assembly
solutions according to customer requirements for volume, quality, lead-time and price.
Our global manufacturing footprint and distribution hubs enable cost-efficient localised
production and effective inventory control.
Global LogisticsWe maintain facilities over three continents
in order to be a ‘local’ supplier to customers and better support their own production and speed to market objectives. Our customer
hubs enable us to support fully our customers’ just-in-time manufacturing processes.
Within these markets Delivered through
Contract ManufacturingTaking a customer blueprint, Volex can source the raw materials (either independently or from an Approved
Vendor Listing), build the manufacturing line and develop rigorous testing procedures to ensure the cable is produced in the required volumes, in accordance with national safety
requirements, at a low cost price point.
Product DevelopmentShould a customer choose to outsource
its entire cabling function, our team of experienced engineers can engage with
the customer’s product development team at an early stage to design and build the best cabling solution for their needs.
Cable Assembly Specialising in
Unrivalled global manufacturing footprint
None of our direct competitors are able to offer manufacturing facilities located over six separate countries,
across three continents. For our global customers this offers one global
supplier but with detailed knowledge of their key local markets and an ability
to reduce local lead times.
Respected brand known for quality and reliability
Volex is unable to compete purely on price, however, of importance to our premium customer base is quality and reliability. Brand names are
quickly tarnished should products fail or catch fire. Volex has an enviable reputation in the market for safety
and a detailed understanding of local regulatory requirements.
Scale
In a very fragmented power cord market, Volex is one of the two
largest producers with approximately 7% market share. This allows Volex to benefit from economies of scale with significant purchasing power in
the Chinese wire market.
www.volex.com STRATEGIC REPORT
Volex plc 09
Volex AR2017 Front.indd 9 22/06/2017 11:57:17

25431.02 22 June 2017 11:48 AM Proof 8
With Volex’s traditional power cord markets in decline and certain specific customers in the midst of their own turnaround plans, this strategy has been sales lead with the development of new markets and new customers key.
The new strategy builds upon the recovery strategy we highlighted in last year’s accounts and if successful will not only improve the financial strength of the Group but also allow for a return to our shareholders.
Update on recovery strategyLast year Volex outlined six key short term strategic actions that would be implemented to turn around the Group’s performance. We have achieved results in each of these areas:
To align the cost base of the Group with the revised revenue forecasts. Whilst a number of heads and operational costs have been taken out of the business over the past 6 months, further cost savings are being investigated across all functions.
What we did: A number of difficult decisions were taken in the year to address the revised revenue forecasts. These included:
• the closure of our Brazil facility until such time as the Brazilian economy strengthens. This resulted in the removal of approx. 65 members of staff and annualised fixed overhead costs of circa $0.8 million. In FY2017, Volex Brazil had contributed a loss of $0.7 million (FY2016: $1.1 million) to the Group’s underlying operating profit;
• reduction in size of our Shenzhen facility in China from three buildings to two saving us annual costs of $0.6 million and the reduction in the workforce by approx. 60;
• closure of sales offices in Ireland, Japan, Indonesia and North America; and
• impairment of assets primarily used on our largest customer.
Going forward we will continue to review the Group’s cost base and make changes accordingly.
To improve operational efficiency throughout the Group in order to improve margins and allow for more competitive pricing.
What we did: An external consultancy firm, Yomo, was hired to provide a factory floor assessment of our production processes. Starting in our Mexico facility but then visiting China and our other factories, they deconstructed the manufacturing methodologies and looked to identify bottlenecks and implement best practice. From this work, production lines and work-flows have been redesigned to improve efficiency and customer engagement increased to try and smooth ordering patterns. Underlying gross profit has increased from 16.4% in FY2016 to 17.4% in FY2017 as a result of these improvements.
To remove loss-making activities – by part number, by customer and by factory.
An element of the revenue reduction observed in FY2017 is a result of Volex exiting loss making and low margin accounts.
In FY2016, within the power cords division Volex sold close to 1,100 parts with a negative contribution margin. From the $23.4 million of revenue generated, a loss of $2.5 million was generated. Many of these parts would have been sold within a bundled package on which the overall bundle profitability was monitored. In FY2017, the corresponding number of parts has been reduced to 700 generating revenues of $11.5 million with a loss of $1.3 million. In the next round of annual pricing reviews we will look to reduce these parts still further.
To improve working capital management, in particular the levels of stock held, in order to free up cash and provide the Group with greater financial flexibility.
All factory general managers are now assessed on their stock holding with weekly reports distributed updating them on their stock levels, the ageing of the stock and that stock which is believed to be excess and obsolete. At year end net stock is $36.0 million, down from $41.5 million at the prior year end. This represents inventory holding days of 61 (FY2016: 64) and whilst a slight improvement, is not where management wants it to be. Work continues to further reduce the stock holding with a particular focus on our Mexican factory.
To improve the analysis of customer profitability so that indirect costs are better allocated to specific customers and products. This will allow the Group to more accurately determine those customers and products which should be cherished and those where the relationship needs to be re-assessed due to low returns.
A one off project was performed at the start of FY2017 in which the profitability of the top 10 key accounts was reviewed with a specific focus on the allocation of overheads and other indirect costs. Production line set up costs, volume throughput and warehousing costs were all carefully considered and allocated on a specific basis. The output from this analysis was then compared to the standard customer profitability reports run each month and overhead allocation amended. These revised reports were then used to identify the negative margin products which we have been exiting throughout the year.
To engage with our customers at a more senior level so that they better understand the challenges faced by Volex, and the true value of engineering and quality in our product offerings.
Both the Group Executive Chairman and Chief Financial Officer are client facing spending significant time at our key customers listening to their concerns whilst also highlighting the difficulties Volex faces in servicing their account. Through this senior interaction, we have been provided with better forecast data and have also been able to better renegotiate pricing with prices downs now offered generally only when guaranteed volumes are provided.
Long term strategic planVolex for the past five years has focussed on six long-standing key customers, failing to generate any new significant markets or accounts. The Group has struggled to diversify the customer base due to an uncompetitive cost structure, high staff turnover, slow response times and a lack of focus on new markets. Each of these issues has been addressed throughout FY2017 with most importantly a realisation that Volex should not attempt to compete against the lowest-cost, mass volume commodity Chinese manufacturers. Instead Volex now intends to operate as a low-cost, high quality producer of power cords, high-speed cables and complex harness assemblies to premium brand customers to which quality and reliability are equally as important as cost. Identifying those premium brand customers to target is key and for these customers we must be able to demonstrate why Volex’s experience and unrivalled record on quality is worth paying a premium.
During the year, the Board has developed a new long-term strategic plan, accompanied by a three year financial plan, which seeks to return the group to sustainable, profitable growth.
Annual Report and Accounts 2017 Stock code: VLX
Volex plc10
Strategy
Volex AR2017 Front.indd 10 22/06/2017 11:57:18

25431.02 22 June 2017 11:48 AM Proof 8
This change in strategy, driven by the Executive Chairman, has been embraced by a reinvigorated sales force such that a number of new customers are looking to scale production with Volex in FY2018. These customers include two of the largest names in the on-line space which both require high speed data solutions for their data centres, a North American Fortune 1000 engineering company and a leading manufacturer of electric cars. It is planned that as this business ramps and further new companies are on-boarded (18-24 months is the standard length of time to scale a customer), the new revenue generated will replace that from the declining traditional Volex markets.
To help develop new markets, Volex will also consider entering into joint venture arrangements with strategic partners. A number of these joint ventures are currently under review, primarily in the healthcare sector, however, Volex will be careful to limit its financial exposure.
To assist the sales team in finding new markets and customers, they must have access to market leading products. To this end we restructured the engineering function of Volex in FY2017 and plan to invest heavily in this area in
the coming years. We plan to employ additional engineers in key R&D locations who will bring with them detailed knowledge of electric vehicle design, data centre power requirements, 400G high speed data transfer and other knowledge gaps that we identify. Volex will explore partnerships with key strategic supply sources to further enhance our product and technology solutions, especially in the area of Active Optical Cables and high speed data transmission and high voltage power supply.
Whilst certain customers value the quality and reliability provided by Volex, they will only be prepared to pay a certain premium over the competition and therefore Volex will have to remain cost competitive. The key strategic initiatives focussed on our operations include:
• development of the joint venture agreement with Joinsoon Electronics Mfg Co Ltd, a Taiwanese-based manufacturer, to develop and manufacture Volex branded AC raw cables at a discount to the current price Volex pays. The benefits of this JV are expected to commence in FY2018;
• consolidation of the fragmented procurement process across the Cable Assemblies division in which each factory has largely been left responsible for its own procurement. As part of this process, Volex will seek to challenge customers on their approved suppliers agreeing to share any cost savings whilst maintaining quality;
• implementation of lean initiatives across the Group, spearheaded by our new VP of Global Operations; and
• focus on quality and a culture of continuous improvement culture that seeks a “Zero Defect” manufacturing environment whilst maintaining low scrap rates.
Should Volex be successful in implementing the above initiatives, it is planned that the Power revenues will remain relatively flat over the forecast 3 year period, however, significant growth will be seen in the Cable Assemblies division. Gross profit margins will remain stable as operational efficiency gains and procurement savings help off-set downward pricing pressure from competition whilst operating profit margins will increase due to the leveraging effect.
Key Performance IndicatorsSince reassessing the KPI’s, Volex now has six measures by which it assesses performance:
Annual Revenue change (%)
Inventory holding days (days)
Underlying volumes of PVC cable sales (millions of units)
Free cash flow ($’m)
Factory utilisation (%)
Return on Capital Employed (%)
2013 (8.6)
2014 (15.4)
2015
(13.2)
(13.0)2017
5.8
2016
2013 N/A
2014 131.6
2015
144.1
140.22017
145.4
2016
N/A2013
2014 37
2015
45
2017
49
2016
55
2013 55
2014 54
2015
64
612017
57
2016
2013 21.9%
2014 6.8%
2015
13.4%
20.3%2017
14.5%
2016
2013 (20.7)
2014 (21.4)
2015
(4.7)
13.62017
2.7
2016
Progress in the yearReduction in revenue can be attributed to three key accounts with Volex’s largest customer alone experiencing a $36.7 million decline.
Progress in the yearThe reduction in stock holding days to 61 is mildly disappointing given the intense focus on this measure during the year. Further work will be performed to reduce inventory holding days in FY2018 with a particular focus on the Tijuana factory.
Progress in the year Reduced PC and printer shipments have resulted in a volume drop of 2.7%.
Progress in year Despite the fall in revenue, factory utilisation has increased due to the restructuring activities taken which include the return of factories to landlords and warehousing brought in-house.
Progress in the yearThe reduction in working capital due to the lower sales and active working capital management has helped generate a free cash inflow of $13.6m in the year.
Progress in the yearIncrease in ROCE due to improved underlying profitability and a reduced asset base following impairment.
www.volex.com STRATEGIC REPORT
Volex plc 11
Volex AR2017 Front.indd 11 22/06/2017 11:57:19

25431.02 22 June 2017 11:48 AM Proof 8
$’000
52 weeks ending
2 April 2017
52 weeks ending
3 April 2016
RevenuePower Cords 188,256 230,205Cable Assemblies 131,328 137,329
319,584 367,534
Underlying* gross profitPower Cords 27,523 29,750Cable Assemblies 27,936 30,617
55,459 60,367Underlying* gross margin 17.4% 16.4%
Statutory gross profit 42,347 58,519
Underlying* operating profitPower Cords 3,228 2,293Cable Assemblies 10,528 9,842Central costs (4,677) (4,963)
9,079 7,172Underlying* operating margin 2.8% 2.0%
Non-recurring items and share-based payments (15,700) (3,733)
Statutory operating profit / (loss) (6,621) 3,439
* Before non-recurring items and share-based payments credit/charge
FY17 FY16
Declining top 3 Other
235,787
83,797
319,584234,599
132,935
367,534
1%
37%
13%
Group revenue FY2016 to FY2017
Progress in the yearA $49.1m revenue reduction in three key accounts resulted in a 13.0% fall in group revenue.
Despite the drop in revenue, the Group has recorded a $1.9 million increase in underlying operating profit.
Group revenue fell in FY2017 by 13.0% from $367.5 million to $319.6 million. Of the $47.9 million reduction, $49.1 million was derived from just three accounts with the Group’s largest customer reporting a $36.7 million fall. This 38.6% year on year account reduction highlights the significant structural problems facing the Power Cord division, namely that the traditional consumer electronics markets to which we supply are in decline. The continuing contraction of the PC market (and associated peripherals) and product miniaturisation (leading to more devices which can be charged with a USB cord rather than a conventional power cord) will further reduce demand in these markets and hence the need to diversify our customer base through on-boarding new customers and entering new markets.
The other two customers suffering significant declines were both in the Cable Assemblies division, one being our largest European telecoms customer that is losing market share to Chinese competition ($5.0 million decline) and the other a North American logistics company specialising in fleet management which we believe currently to be at the bottom of a revenue cycle.
Away from these three accounts the remaining business was slightly ahead of prior year by $1.2 million with some significant new business wins and growth in existing accounts offsetting decline in other mature accounts.
Annual Report and Accounts 2017 Stock code: VLX
Volex plc12
Operational Review
Volex AR2017 Front.indd 12 22/06/2017 11:57:19

25431.02 22 June 2017 11:48 AM Proof 8
The Group reacted to the revenue fall by further reducing its cost base. The significant actions taken in the prior year allowed the Group to better weather this decline, however, given its scale further actions were required. These included:
• transferring a proportion of PVC production from the largest facility in China, Shenzhen, to Zhongshan (another Power factory in China) and Batam (Power factory in Indonesia). Zhongshan and Batam factories enjoy lower labour costs than in Shenzhen and should further benefit from economies of scale as greater PVC cable volumes pass through these factories;
• this then allowed for a significant (33%) reduction in size to our Shenzhen factory, helping lower the costs associated with servicing the Power division’s largest customer;
• closure of our Brazil factory until such time as the Brazilian economy recovers;
• closure of a number of our regional sales offices with sales responsibilities transferred either to other sales offices or to the factories themselves;
• rationalisation of our stock-holding hub network in Asia leading to the closure of 4 external hubs; and
• closure of a US facility and a 50% reduction in the size of our Singapore and London headquarters.
Furthermore the manufacturing optimisation reviews that took place in each of the factories has helped improve the underlying gross margin despite the deleveraging effect of lower volumes passing through certain factories. The tangible benefit of this factory operational focus coupled with the above cost reduction measures and favourable foreign exchange movements can be seen in the margin improvement from 16.4% in FY2016 to 17.4% in FY2017 despite the 13.0% reduction in sales.
Following the downturn in revenue from Volex’s largest customer and the low margin achieved on those sales that remained (following constant pressure from the customer for price reductions), the cost base of those assets servicing the account was reviewed relative to the forecast future profitability from the account. As a consequence it was concluded that those assets specific to this customer should be impaired, leading to a $12.0 million non-cash impairment charge. The majority of these assets had been acquired in 2012 and 2013. This charge along with other factory plant and machinery impairments and severance fees paid to manufacturing staff are all included within the statutory gross profit figure of $42.3 million.
In addition to the above, Volex announced in FY2017 it was to enter into a joint venture agreement with a Taiwan-based manufacturer, Joinsoon Electronics Mfg. Co. Ltd to engage in the development, manufacture and marketing of Volex-
branded AC raw cables. The impact of the joint venture on the Volex cost structure is not expected until FY2018.
Underlying operating expenditure fell by 12.8% from $53.2 million in FY2016 to $46.4 million in FY2017 primarily due to the full year impact of restructuring actions taken in the prior year. As a result underlying profit was $9.1 million in FY2017 versus $7.2 million in FY2016.
Statutory operating loss includes the impact of severance fees paid, the impairment of assets and the fee charged by external consultants to conduct the operational efficiency reviews at our factories.
Looking forward we expect our markets to remain fiercely competitive and we will continue the practice of ensuring our factory footprint and costs are aligned with revenue performance. However, we have an encouraging set of projects in the sales pipeline and we believe several of these should ramp-up in the year ahead and offset any further loss seen in the existing customer base. As such we anticipate that our revenues have stabilised at the current level and we expect to deliver modest growth in the coming year.
Similarly we expect the full year impact of our cost reduction measures and operational improvements to offset commodity price rises and therefore we believe margins will be maintained at a similar level in the year ahead.
Leading online retailer needs an immediate supply of QSFP+ cablesDuring the year, one of the world’s leading online retailers approached Volex to ask whether we could meet their demand requirements for high speed data cables – QSFP+ cables. The existing supplier was finding it difficult to meet their demand requirements.
Volex engaged our sales and engineering experts to meet the potential client and once the retailer was convinced that Volex was a highly capable high speed data cable supplier which knew the industry well and had a clear product development roadmap to meet their future needs, we were engaged.
Our Suzhou facility had to scale production rapidly whilst responding to product and pricing queries from the retailer. Samples were rapidly shipped and following their qualification, the first production run was made only three months after initial contact.
With Volex providing a first class customer experience, this account is expected to grow to a multi-million USD account in FY2018.
Case Study
www.volex.com STRATEGIC REPORT
Volex plc 13
Volex AR2017 Front.indd 13 22/06/2017 11:57:21

25431.02 22 June 2017 11:48 AM Proof 8
Power Cords
$’000
52 weeks ending
2 April 2017
52 weeks ending
3 April 2016
Revenue 188,256 230,205Underlying* gross profit 27,523 29,750Underlying* gross margin 14.6% 12.9%Operating costs (24,295) (27,457)Underlying* operating profit 3,228 2,293Underlying* operating margin 1.7% 1.0%
* Before non-recurring items and share-based payments credit / charge
Volex designs and manufactures power cords, duck heads and related products that are sold to manufacturers of a broad range of electrical and electronic devices and appliances. Volex products are used in laptops, PCs, tablets, printers, TVs, games consoles, power tools, kitchen appliances and vacuum cleaners. Volex is one of the world’s top two global power cable suppliers with an estimated 7% market share in a fragmented market worth an estimated $2.4bn.
The market for power cords is highly competitive with customers deploying multi-sourcing strategies and expecting regular productivity improvements with price reductions over the product lifecycle. In order to compete effectively, suppliers in the market require efficient large scale production facilities in low-cost regions.
The Power Cords division’s key manufacturing facilities are located in South-East China, Indonesia and India. However, all the Group’s facilities throughout the world can be utilised to manufacture power cable products if required. With the key raw materials produced in China, our manufacturing tends to be concentrated in the two South-East China factories.
The Power division revenue for FY2017 was $188.3 million, down 18.2% on the prior period. This downturn reflected further softening in Volex’s core end markets as well as the impact of competing technologies, intense competition and a lower copper price.
The global PC market continues to shrink with global shipments in the year to December 2016 down 7% on the corresponding period in the prior year. This decline has been attributed to further market cannibalisation by the smartphone and a strong USD. Similarly the global PC hardware peripherals market has contracted with a 4% reduction in shipments (for the period January to June 2016). Our largest customer has seen its tablet sales volume reduce by 12% year on year and its laptop sales reduce by 6%. Our largest customer has also recently announced that its newly designed laptop range will be sold with a USB-C charger rather than a traditional power cord. This marks a trend in the industry towards product miniaturisation and lower power-consumption, which allows for devices to dispense with a traditional mains power cord charger.
In addition to the problems faced in the PC and PC peripherals end markets, a significant revenue decline was also observed from customers manufacturing household cleaning appliances.
As battery technology has improved, the need for retractable power cables is declining with vacuum manufacturers instead favouring a charging station for their unit. Whilst this charging station still requires a power cable, its greater simplicity and shorter length means that the value of the cable is significantly reduced.
Falling PC sales, product miniaturisation and the move to cordless household products are just three factors that have led to a reduction in the size of Volex’s end markets. Consequently competition has continued to intensify. For Volex to be successful, it must compete aggressively on price with every dollar saved from the production and procurement processes helping protect already thin margins. Volex has the capability to compete – during the year the sales team has successfully grown business with a well-known branded coffee capsule machine manufacturer such that it now represents a significant revenue stream for the Group.
However, for significant improvements in divisional profitability, the Power division needs to improve utilisation in its factories. Volex is therefore seeking new end markets in which Volex’s expert knowledge in the manufacture of power distribution cables and its reputation for quality and safety are best recognised. In this regard, the first shipment of vehicle charging cables to a key manufacturer of electric cars, due in FY2018, represents an exciting development for Volex. With forecasts predicting electric vehicles could make up to 35% of global new car sales by 2040, and with each of these requiring a sizeable power cable, the opportunity for Volex is significant.
The underlying Power Cord gross profit has reduced to $27.5 million from $29.8 million, representing a gross margin of 14.6% (FY2016: 12.9%). The principal reason for the improvement in gross margin is a more favourable product mix following the exiting of low margin sales to our largest customer coupled with the cost reduction measures previously discussed.
Operating costs have reduced by $3.2 million to $24.3 million following the actions taken in FY2016 to remove the Power Cord divisional management team. As a result of the above, underlying divisional operating profit for the period increased from $2.3 million in FY2016 to $3.2 million in FY2017.
Revenue growth FY2016 to FY2017
Power Sales by end market
FY 2017FY 2016
-6%
-38%
-18%
134,364
53,892
188,256
143,213
86,992
230,205
Declining top 3 Other
Progress in the yearSignificant structural challenges faced with the traditional markets for Volex power cords in decline.
PC
Largest customerDomestic
Printers
$136.3mRevenue
140.2m unitsVolume
PVC
$35.0mRevenue
9.0m unitsVolume
Halogen-free
$1.3mRevenue
Other
$15.7mRevenue
18.7m unitsVolume
Duck heads
Annual Report and Accounts 2017 Stock code: VLX
Volex plc14
Divisional Review
Volex AR2017 Front.indd 14 22/06/2017 11:57:22

25431.02 22 June 2017 11:48 AM Proof 8
Cable Assemblies
Revenue growth FY2016 to FY2017
FY 2017FY 2016
11%
-35%
-4%
101,423
29,905
131,328
91,403
45,926
137,329
Declining top 3 Other
Cable Assembly Sales by end market
Medical
Industrial/TransportDomestic/Consumer Electronics
Datacoms/Telecom
$’000
52 weeks ending
2 April 2017
52 weeks ending
3 April 2016
Revenue 131,328 137,329Underlying* gross profit 27,936 30,617Underlying* gross margin 21.3% 22.3%Operating costs (17,408) (20,775)Underlying* operating profit 10,528 9,842Underlying* operating margin 8.0% 7.2%
*Before non-recurring items and share-based payments credit / charge
Volex designs and manufactures a broad range of cables and connectors (ranging from high-speed copper and fibre-optic cables to complex customised optical cable assemblies) that transfer electronic, radio-frequency and optical data. Volex products are used in a variety of applications including data networking equipment, data centres, wireless base stations and cell site installations, mobile computing devices, medical equipment, factory automation, vehicle telematics, agricultural equipment and alternative energy generation.
The Cable Assemblies division has its manufacturing facilities in Mexico, Poland, India and China, all within close proximity to many existing and potential new customers. It operates in a fragmented market that is growing rapidly and Volex has several strong niche positions within data centres and the telecoms and healthcare sectors where customers utilise Volex expertise and manufacturing competencies.
The division’s product range is split into two categories:
• High Speed – primarily copper, but also optical, passive and active cabling solutions that transmit data at rapid rates. High speed products are used extensively in telecom and data centre environments.
• Interconnect – bespoke cabling solutions designed to transmit data and DC power in the most effective means for our customers’ needs. Volex competes by producing highly engineered, high performance, application specific cables, in close collaboration with its customers.
Revenue for FY2017 was $131.3 million, down 4.4% on the prior period. Revenue from the largest Cable Assemblies customer, operating in the Healthcare sector, was actually up 16% due to their strategy to consolidate a fragmented supply chain, with Volex benefiting from this effect. However, this growth was offset by a fall in sales to a leading legacy European mobile telecommunications customer which continues to see its market share decline, a fall in sales to our largest transportation customer which is suffering from a cyclical drop in truck sales (US truck sales for the 2016 calendar year are down 15% on the prior year) and a fall in sales of internal cables used within the laptop computer range of our largest customer.
The revenue from the remaining customers was up by $3.5 million to $52.7 million reflecting growth in high margin end customers within the Data Centre, Industrial and Medical Robotic end markets, each of which place a premium on reliability and signal integrity. Future sales projects currently within the pipeline are encouraging and include awarded business such as wiring harnesses for a commercial food service equipment manufacturer and data cables for a large player in the on-line retail sector.
The underlying gross profit has reduced to $27.9 million from $30.6 million, representing a gross margin of 21.3% (FY2016: 22.3%). This fall in margin reflects lost sales of complex cable harnesses on which a higher premium can be charged plus the deleveraging effect of passing fewer cables through the factories to absorb the fixed overheads.
Operating costs have reduced by $3.4 million to $17.4 million. This saving is primarily in headcount with activities taken in the second half of FY2016 to remove the divisional management team reducing the cost base.
As a result of the above, underlying divisional operating profit for the period increased from $9.8 million in FY2016 to $10.5 million in FY2017.
Despite the restructuring efforts made to our Brazilian operation in FY2016, it continued to generate losses in the first half of FY2017. With little improvement forecast in either the Brazilian economy or the factory outlook, the tough decision was taken to suspend local operations. A non-recurring charge of $1.0 million has been recognised in respect of the closure of the factory.
$44.1mRevenue
4.9m unitsVolume
Multi conductor I/O
$20.4mRevenue
1.4m unitsVolume
High Speed solutions
$54.7mRevenue
36.5m unitsVolume
Wiring Harness
$12.1mRevenue
5.0m unitsVolume
Other Data
Progress in the yearStrong sales to Volex’s largest healthcare customer offset by difficulties in the telecoms and transportation sectors.
www.volex.com STRATEGIC REPORT
Volex plc 15
Volex AR2017 Front.indd 15 22/06/2017 11:57:23

25431.02 22 June 2017 11:48 AM Proof 8
Reduction in working capital and lower capital investment help return
Volex to a net cash position at year end.
Following a downturn in trade with our largest customer, a significant non-cash
impairment charge was taken.
52 weeks to2 April 2017
52 weeks to3 April 2016
Revenue$’000
Profit/(loss) $’000
Revenue$’000
Profit/(loss)$’000
Power Cords division 188,256 3,228 230,205 2,293Cable Assemblies division 131,328 10,528 137,329 9,842Unallocated central costs (4,677) (4,963)Divisional underlying results 319,584 9,079 367,534 7,172Non-recurring operating items (15,232) (4,742)Share-based payments (468) 1,009Statutory operating profit/(loss) (6,621) 3,439Net finance costs (1,879) (1,897)Profit/(loss) before taxation (8,500) 1,542Taxation 1,452 (3,854)Profit/(loss) after taxation (7,048) (2,312)Basic earnings/(loss) per share: Statutory (7.9) cents (2.6) centsUnderlying 9.5 cents 1.5 cents
Measuring financial performanceThe Group continues to use a number of specific measures to assess its performance and these are referred to throughout this Annual Report in the discussion of the performance of the business. These measures are not defined in IFRS, but are used by the Board to assess the underlying operational performance of the Group and as such the Board believes these performance measures are important and should be considered alongside the IFRS measures. These measures include:
Measure Definition
Underlying profit Profit before non-recurring items and share-based payment expense/credit
Underlying EPS Earnings per share adjusted for the impacts of non-recurring items and share-based payment expense/credit
Free cash flow Net cash flow before financing activities and transactions in own shares
Annual Report and Accounts 2017 Stock code: VLX
Volex plc16
Financial ReviewDaren Morris / Chief Financial Officer
Volex AR2017 Front.indd 16 22/06/2017 11:57:29

25431.02 22 June 2017 11:48 AM Proof 8
Trading performanceGroup revenue for the year fell by 13.0%, from $367.5 million in FY2016 to $319.6 million in FY2017, with both divisions contracting. Power Cords revenue decreased by 18.2%, from $230.2 million in FY2016 to $188.3 million whilst Cable Assemblies revenue fell by 4.4%, from $137.3 million to $131.3 million. The revenue fall was primarily due to the contraction of our key power cord markets (PC, laptops, tablets and printers fared poorly) and difficulties experienced by two of our largest Cable Assembly customers.
The Group’s underlying gross profit for FY2017 was $55.5 million, yielding an underlying gross margin of 17.4%. This compared to a FY2016 underlying gross profit of $60.4 million and an underlying gross margin of 16.4%. The improvement in underlying gross margin was due to the efficiency gains made following external manufacturing reviews, cost reduction measures on the factory floor and favourable foreign exchange movements.
The Group’s underlying operating profit for FY2017 was $9.1 million, up 26.6% on the prior year. This was driven by the $6.8 million reduction in underlying operating expenses year on year that arose due to the cost reduction measures taken both in the current and prior years and favourable foreign exchange movements.
Non-recurring operating items and share-based paymentsThe Group has incurred non-recurring operating costs of $15.2 million in FY2017 (FY2016: $4.7 million).
Of this $12.5 million (FY2016: $1.5 million) relates to non-cash impairment charges taken against the Group’s fixed asset base. As a result of the downturn in Power Cord revenue (particularly with the Group’s largest customer) highlighted previously, significant surplus capacity arose within our Power Cord division. In response to this, the largest Power Cord factory was downsized with one of the three available buildings returned to the landlord. This resulted in an impairment of the associated fit-out costs. Further the number of production lines running in the remaining two buildings was reduced resulting in the impairment of the redundant plant, machinery and tooling. Finally, given the reduced sales from the largest customer and the already thin margins, the forecast
profitability from the continuing lines was assessed and deemed insufficient to support the associated fixed asset cost base. As a consequence of the above factors, an impairment charge of $12.0 million (FY2016: $0.9 million) was recorded in the Power Cords division. In the Cable Assemblies division, a $0.5 million (FY2016: $0.6 million) impairment charge was recognised on the closure of Volex Do Brasil Ltda.
As a further consequence of the declining revenues and the reduced factory footprint, a number of personnel left from the Group during the year. The cost associated with this restructuring was $1.6 million (FY2016: $2.7 million). The majority of these exits were from the factory floor with approximately 175 staff leaving the Group. Also included within the $1.6 million charge is $0.2 million of stock and debtor write-offs that arose on the closure of Volex Do Brasil Ltda. The prior year cost related to labour cost reductions.
As highlighted previously in these accounts, following his appointment in November 2015, the Executive Chairman sought to address the production issues facing our factories across the globe in order to make them more cost competitive. To support the management function, an external manufacturing consultancy was employed on a fixed term contract of 9 months, to advise on manufacturing best practice and implementation. This contract expired in December 2016 and has therefore been classified as non-recurring. Costs associated with this contract totalled $0.8 million.
The Group has incurred an onerous lease charge in the period of $0.3 million primarily in relation to the sub-let of a property in North America. The sub-lease is for the full head lease term and mirrors the head lease clauses with the exception of an initial quarter rent free period which has been expensed as non-recurring.
The prior year onerous lease charge of $1.2 million related to the old UK head office near Manchester and was as a result of changes to the underlying provision assumptions. At prior year end, a provision of $3.1 million was held against this property. In the current year, Volex negotiated its early exit from this lease in return for a surrender premium payment of $2.5 million. Following other associated costs, there was a small release of the provision at current year end.
The cash impact of the above non-recurring operating items is a cash outflow of $5.7 million (FY2016: $4.5 million).
The share-based payments charge in the year was £0.5 million (FY2016: credit of $1.0 million) with the prior year credit arising through the reversal of charge on lapsed options held by outgoing executive management.
Net finance costsTotal net finance costs in FY2017 were $1.9 million (FY2016: $1.9 million). The prior year benefitted from a one-off credit of $0.2 million following an interest settlement with our debt providers. The underlying reduction in net finance costs is due to the lower average net debt level in FY2017, particularly in the last quarter of the year when Volex began repaying the loans drawn under the senior credit facility.
RefinancingAt the start of the year, the Group completed an “amend and extend” renegotiation with the banking syndicate which extended the existing $45.0 million facility to June 2018 (previously due to expire in June 2017). All other terms were maintained. The cost of this extension was $0.6 million which included legal, banking and audit fees. This amount has been capitalised and is being expensed over the period to June 2018.
Post year end, the Group has successfully completed a further one year extension of its senior credit facility, now to June 2019. As part of this extension, Clydesdale Bank plc exited the syndicate. Lloyds Banking Group plc and HSBC Bank plc have both retained their positions and credit offering with the size of the facility duly reducing from $45.0 million to $30.0 million. Given the cash generation in the year, management is confident that the Group can operate within this facility level.
www.volex.com STRATEGIC REPORT
Volex plc 17
Volex AR2017 Front.indd 17 22/06/2017 11:57:29

25431.02 22 June 2017 11:48 AM Proof 8
TaxThe Group incurred a tax credit of $1.5 million (FY2016: charge of $3.9 million) representing an effective tax rate (ETR) of 17% (FY2016: 250%). The underlying tax credit of $1.2 million (FY2016: $3.9 million) represents an ETR of -17% (FY2016: 75%).
The underlying tax credit of $1.2 million arose due to the recognition of deferred tax assets totalling $2.7 million. This recognition was based upon the forecast profitability of the Group in regions where trading losses are available for offset and therefore are now believed to have some value in the short to medium term.
Excluding the deferred tax asset recognition, the underlying current tax charge is $1.5 million (FY2016: $3.9 million) representing an ETR of 21% (FY2016: 74%). The reduction in current tax ETR follows the restructuring initiatives taken across the Group and it is planned that with the majority of restructuring now complete, the long-term ETR will grow steadily in line with the expected growth of the group.
As at the reporting date the Group has recognised a deferred tax asset in relation to tax losses of $2.9 million (FY2016: $0.8 million).
Earnings per shareBasic loss per share for FY2017 was 7.9 cents compared to a loss per share of 2.6 cents in FY2016 reflecting the impairment charge taken in FY2017. The underlying fully diluted earnings per share was 9.5 cents compared to an earnings per share of 1.5 cents in FY2016.
Cash flow and net debtOperating cash flow before movements in working capital in FY2017 was an inflow of $8.3 million (FY2016: $10.1 million) with the $1.8 million decrease partially explained by the $2.5 million surrender premium paid to exit the lease on the old UK headquarters near Manchester. This has been treated as a non-recurring cash flow item.
The impact of working capital movements in the cash flow in FY2017 was an inflow of $10.8 million (FY2016: outflow of $1.9 million). As the revenue has declined during the year, the working capital needed to service the reduced level of business has also reduced but in addition to this improved stock management has helped generate $5.4 million of cash inflow from inventory. The $3.1 million cash inflow from payables is largely due to timing.
After aggregate outflows for tax and interest of $3.3 million (FY2016: $6.3 million), the net cash inflow from operating activities was $15.9 million (FY2016: $1.8 million). Of this $24.9 million had been generated from normal trading activity (FY2016: $12.6m) with $5.7 million spent on non-recurring items (FY2016: $4.5 million). These non-recurring items include restructuring fees such as severance payments, payments made to exit onerous properties and in the current year payments to external consultants to complete a discrete project on operational efficiency.
Capital expenditure in FY2017 was $2.5 million (FY2016: $6.0 million). Our largest customer has historically been one of our more capital intensive customers with significant expenditure on tooling and production lines. With their decline in business, the level of capital expenditure in the year has reduced dramatically.
At the start of the year the Group extended its senior banking facility for a further year. The fees associated with this extension, including legal, banking and audit fees, totalled $0.6 million.
Under the senior credit facility, the Group repaid $9.2 million (FY2016: net drawing of $3.4 million) in the year.
As a result of the above cash flows, the Group generated a $3.8 million net cash inflow (FY2016: $1.4 million net cash outflow) for the year. As at 2 April 2017, the Group held net funds of $11.3 million compared with net debt of $3.2 million at 3 April 2016.
The above cash flows have resulted in the following free cash for the period:
Annual free cash flowFY2017
$’mFY2016
$’m
Net cash generated from operating activities 15.9 1.8Cash flow from investing activities (2.3) (6.5)
13.6 (4.7)Add back:Utilisation of own shares – –
13.6 (4.7)
Banking facilities, covenants and going concernDuring the year, the Group utilised a $45.0 million multi-currency combined revolving credit, overdraft and guarantee facility (“RCF”). This facility was provided by a syndicate of three banks (Lloyds Banking Group plc, HSBC Bank plc and Clydesdale Bank plc).
The key terms of the facility were as follows:
• Available until June 2018;
• No scheduled facility amortisation; and
• Interest cover and net debt: EBITDA leverage covenants.
As at 2 April 2017, amounts drawn under the loan facility totalled $18.7 million (FY2016: $29.3 million) with no further drawings under the cash pool facility (FY2016: $5.2 million). After accounting for bonds, guarantees and letters of credit, the remaining headroom as at 2 April 2017 was $24.7 million (FY2016: $8.7 million).
Under the terms of the facility, the two covenant tests above must be performed at each quarter end date. At year end both covenants are met. Breach of these covenants would have resulted in cancellation of the facility.
Subsequent to year end, the Group has extended the credit facility to June 2019. As part of this extension, Clydesdale Bank plc left the banking syndicate and the leverage covenant calculation was amended to include total debt rather than net debt. Management believes that the extension to June 2019 gives the Group further time to progress with the turnaround strategy and provides it with the financial flexibility required in order that the Group be better placed to carry out a later full refinancing once revenue stability can be demonstrated.
The Group’s forecast and projections, taking reasonable account of possible changes in trading performance, show that the Group should operate within the level of the proposed facility for the period in which the facility is available and should comply with the revised covenants over this period. The Group also has access to and uses additional uncommitted facilities. Further the Group has a number of mitigating actions available to it, should actual performance fall below the current financial forecasts. The Directors have the financial controls and monitoring available to them
Annual Report and Accounts 2017 Stock code: VLX
Volex plc18
Financial Review continued
Volex AR2017 Front.indd 18 22/06/2017 11:57:31

25431.02 22 June 2017 11:48 AM Proof 8
to put in place those mitigating actions in a timely fashion if they see the need to do so. The Directors therefore believe that the Group has effective plans in place to manage its business within its covenants.
The Directors have, at the time of approving the financial statements, a reasonable expectation that the Company and the Group have adequate resources to continue in operational existence for at least 12 months from the date of these accounts. Accordingly, they continue to adopt the going concern basis in preparing the financial statements.
Financial instruments and cash flow hedge accountingThe Group enters into contracts with financial institutions which are linked to the average copper price as published by the London Metal Exchange (“LME”). The purpose of these contracts is to mitigate the Group’s exposure to copper price volatility observed in the Group’s cost of sales (see page 23 where rising commodity prices has been identified as a key risk).
These contracts act as an economic hedge against the impact of copper price movements. They meet the technical requirements of IAS 39 and therefore are accounted for as cash flow hedges of forecast future purchases of copper. As at 2 April 2017, a financial asset of $0.4 million (FY2016: a liability of $0.1 million) has been recognised in respect of the fair value of open copper contracts with a corresponding $0.4 million debit recognised in reserves. This debit is retained in reserves until such time as the forecast copper consumption takes place at which point it will be recycled through the income statement.
A charge of $0.2 million has been recognised in cost of sales in FY2017 (FY2016: $2.1 million) in respect of closed out contracts. This charge has arisen since the average LME copper price in the period has been below the contracted price.
Defined benefit pension schemesThe Group’s net pension deficit under IAS 19R as at 2 April 2017 was $4.4 million (FY2016: $3.3 million). The increase is primarily due to a $2.1 million actuarial increase in the liability arising from reduced corporate bond yields used to discount the forecast pension cash outflows.
UK referendum on EU membershipAs a global business with over 98% of the Group’s revenues generated outside of the UK, Volex’s trading is less likely to be affected by Brexit than many UK plcs, and current results are benefiting from the weaker Sterling. With so little information on the likely shape of future relationships between the UK, the EU and beyond, we are engaged in developing a deeper understanding of the implications of the changes as they emerge, in particular relating to customs and duties.
Daren Morris Chief Financial Officer and Company Secretary
Pictured: Volex high speed data cables at work
www.volex.com STRATEGIC REPORT
Volex plc 19
Volex AR2017 Front.indd 19 22/06/2017 11:57:34

25431.02 22 June 2017 11:48 AM Proof 8
Risk GovernanceThe Group operates in a complex global environment where risks and uncertainties offer opportunities as well as challenges. Understanding and managing these uncertainties is therefore essential to the long term success and sustainability of the Group.
The Board has the overall responsibility of the Group’s risk management and views that effective risk management is part of its role in providing strategic oversight of the Group. The Board is supported by the Audit Committee which has the delegated responsibility to review the effectiveness of the Group’s system of internal controls and risk management.
Risk Management ProcessThe Group takes a two-fold approach to risk management where risk identification, assessment and mitigation are performed both “bottom-up” with detailed assessment at operational or functional level, as well as through “top-down” assessment of strategic risks at the executive management and Board level. Major risks are categorised on a matrix reflecting impact and likelihood on the business from a strategic, operational, compliance and financial perspective.
The assessment of impact is measured before allowing for mitigation, such as insurance recoveries, whilst likelihood is considered after allowing for the effect of mitigation. The impact scale is determined in relation to the Group as a whole based on financial, operational, reputational and behavioural measures.
Risk management processes are established within business practices across the organisation whenever possible. For identified risks, a mitigation plan is established and progress against this plan is reviewed, discussed and re-assessed at least annually. Risk reporting and monitoring is incorporated into periodic business and financial reviews by the executive team and the Board.
The Directors believe that this process with regards to risk management provides them with a robust assessment of the principal risks faced by the Group.
Principal RisksThe Group’s principal risks and how they are managed at group level are summarised in the following section and are not listed in any order of priority. The Board considers these the most significant risks that could materially affect the future prospects or reputation of the Group, including those that would threaten its business model, future performance, solvency or liquidity. It is however important to understand that risk management and internal controls provide reasonable but not absolute assurance against risks.
Our principal risks are further classified as follows:
• Strategic – Risks that potentially may affect the Group in delivering its strategy or achieve its strategic objectives.
• Operational – Risks arising out of operational activities relating to areas such as sales and operations planning, procurement, warehousing and logistics and product development.
• Financial – Risks relating to the finances of the business that may arise externally such as financial market risk or internally from the perspective of internal controls and processes.
• Compliance – Risks relating to compliance with applicable laws and regulations.
DevelopmentsThe Group regularly assesses its risk appetite to ensure alignment with business strategy. In general, there has been no change in the Group’s risk appetite from last year with the board continuing to hold different levels of acceptable risk for the different risk classifications, namely strategic (open to moderate risk), operational (cautious) , financial and compliance (minimal risk appetite). The risks considered during the risk management process cover all aspects of the Group’s activities and include a wider range of areas such as human resource, information technology, supply chain or financial risks but not all of these areas are identified as principal risks.
During the year the group identified three further principal risks being the impact of disruptive technologies, foreign currency exposure and taxation risk which are discussed in detail in the table opposite.
Top Down RisksStrategic Risk assessment at
Executive and Board level
Audit Committee
Supports the Board
The Board
Overall responsibility for risk management
Principal Risks
Strategic Operational
Compliance Financial
Bottom Up RisksRisks assessed at operational
and functional level
Annual Report and Accounts 2017 Stock code: VLX
Volex plc20
Group Risk Management
Volex AR2017 Front.indd 20 22/06/2017 11:57:35

25431.02 22 June 2017 11:48 AM Proof 8
Risk and Possible Impact Risk Mitigation Activities Trend
Strategic – Competitor Risk
With the presence of competitors that are vertically integrated, financially stronger and with ability to invest in newer technology and capabilities, the Group is highly susceptible to increased competition and price pressures.
The Group’s business and future results may be adversely impacted if it is unable to compete adequately and secure new business in the markets in which it operates.
The Group intends to focus on markets and customers where we can differentiate on factors other than price including engineering know-how and quality.
During the year, various projects have been undertaken to optimise manufacturing efficiency and identify process improvements with the aim of driving cost reductions and cash generation.
In the coming year, it is planned that the joint venture Volex has entered into with Joinsoon Electronics Mfg Co Ltd will begin producing lower cost raw materials for Volex to use in its product offering, thereby becoming more cost competitive.
Strategic – Customer Concentration Risk
With the Group’s top ten customers accounting for 64% (2016: 68%) of total revenue, the Group is exposed to customer concentration risk where its performance, financial condition and future prospects may be significantly impacted if there is a shift in allocation on a key customer account.
The Group’s largest customer accounted for 18% of total revenue, down from 26% in the previous year.
The decline in revenues with our largest customer had a significant impact on Group performance. Whilst the concentration of business with this customer had long been highlighted a risk, the business was unable to diversify the customer base due to an uncompetitive cost structure, high staff turnover and slow response times.
During the year the above obstacles have been addressed and a new sales strategy developed. We are optimistic that this new strategy will lead to new revenue opportunities and a further reduction in reliance on the historic customers. We have already received firm purchase orders from a number of new premium brand customers and we hope to scale these accounts in FY2018.
Operational – Supplier Dependency Risk
The Group’s delivery of the strategy is dependent on the availability and timely receipt of raw materials. As it continues to be heavily reliant on single-source suppliers for key materials or critical components, any disruptions may impact production and the Group’s ability to meet customer commitments, win future business or achieve operational results.
Disruption to key supplies may be a result of insolvency of the supplier, scarcity of materials or the suppliers’ inability to meet our standards such as quality, reliability and cost reductions. In turn, the Group’s inability to drive cost reductions may also result in a lack of competitiveness.
Single-source supplier risks are identified during the year and where operationally feasible, dual sources and local multi-sourcing for key materials and critical components are being developed.
Strategic relationships with key suppliers are established to enable flexible sourcing arrangements that are balanced with appropriate levels of inventory. The Group continues to monitor financial and operational viability of key suppliers periodically.
As noted above, the joint venture agreement Volex has entered into should reduce the reliance on several Chinese raw material suppliers.
Trend KeyNo change Increased Risk Reduced Risk
www.volex.com STRATEGIC REPORT
Volex plc 21
Volex AR2017 Front.indd 21 22/06/2017 11:57:35

25431.02 22 June 2017 11:48 AM Proof 8
Risk and Possible Impact Risk Mitigation Activities Trend
Operational – Quality Risk
Our customers specify quality, performance and reliability standards. Should our quality systems fail, the risk of customers receiving unsafe, faulty or non-performing products is increased. Consequently, the Group may experience delays in shipment and product rework or replacement costs.
Subsequent customer complaints, warranty claims and product recall or replacement may result in reputational damage and reduced allocation.
The Group recognises that the quality of our products is critical. Quality assurance processes are embedded in the entire supply chain and every stage of the manufacturing process across all sites, supporting compliance with safety and customer quality standards.
New moulds, tooling and technology are acquired as part of our quality continuous improvement programme to sustain high quality output.
The Group has developed new internal KPI’s that include quality metrics and which will be reviewed by the Board.
Operational – Product Development to Combat Disruptive Technology
Power and data cable markets are impacted by disruptive technologies which include wireless data transmission, improved battery lives and new industry standards such as USB-C.
Failure to adapt could lead to the loss of key accounts.
Volex may not be leveraging advancements in technology in its business model to achieve or sustain competitive advantage.
Close communication with all key customers on their product roadmap takes place. Volex continually investigates partnerships/co-operation for technology gaps.
During the year the engineering function has been recognised to assist in the better sharing of information and knowledge. Now all engineering functions including R&D engineers, production engineers (responsible for the running of the lines and tooling) and “field application engineers” (engineers close to customers who are responsible for feeding back challenges faced) report up to a single head of engineering. Under the new long term strategy there will be significant investment in the engineering function.
Operational – Key People
After several years of poor performance and a major restructuring the Group is more reliant than ever on the small number of key executives who are leading the turnaround.
Until we can establish a more sustainable business model and organisation this risk will remain and therefore the turnaround itself is at risk.
The fact that our Executive Chairman is the largest shareholder provides considerable assurance to other stakeholders that Executive management’s goals are aligned with their own. Other key managers have been given PSP awards, allowing them to participate directly in the impact of the turnaround.
The Group has recently added senior sales and operational expertise in Asia and North America.
Financial – Going Concern
The Group has a $30 million multi-currency revolving credit facility which has been renewed to June 2019. The facility is subject to a quarterly assessment of two financial covenants, namely the leverage covenant and interest covenant.
Whilst the Group’s forecasts have indicated that both covenants will be met, any unforeseen downturn may result in failure to meet the covenant test. Consequently, this may result in an ‘event of default’ where immediate repayment is requested.
The Group reviews its performance against budget to ensure that funding is balanced against economic results.
The Group continues to maintain an open and transparent dialogue with the facility providers to ensure that they are well aware of the developments in the business.
During the year, a number of loans drawn under the senior credit facility have been repaid and net debt has reduced.
The Group’s forecasts indicate that it will meet the covenant tests under the facility. If performance was not in line with the forecast, the Group has a number of mitigating actions that could be implemented.
Annual Report and Accounts 2017 Stock code: VLX
Volex plc22
Group Risk Management continued
Volex AR2017 Front.indd 22 22/06/2017 11:57:36

25431.02 22 June 2017 11:48 AM Proof 8
Risk and Possible Impact Risk Mitigation Activities Trend
Financial – Copper Price Volatility Risk
Many of the Group’s products, in particular power cords are manufactured from wire components that contain significant amounts of copper. Wire components accounted for approximately 50% of the Group’s purchases for the year. As copper price volatility is the single largest commodity price exposure facing the Group and driven by market volatility, failure to manage the impact of copper price changes may result in erosion of profit margins and loss of competitive advantage.
Whilst copper price movements are passed on to customers, delays in passing through the costs may create short term volatility in the Group’s gross margins.
Copper price movements are continuously monitored and where appropriate, are reflected in the pricing of our products. Whilst copper prices are fixed quarterly with major suppliers based on average LME rate over the prior quarter, approx. 55% of our power cord related revenues are covered by copper clauses which provide for quarterly adjustments to our selling prices based on our material costs.
The Group maintains forward copper purchase contracts extending out twelve months and are refreshed on a rolling monthly basis.
Financial – Foreign Exchange
The Group is exposed to currency transactional risk relating to day-to-day sales and purchases with customers and suppliers.
Reported results of overseas subsidiaries are subject to translational risk which may cause volatility in earnings and the balance sheet.
The Group’s financial results may be impacted by the fluctuation of the US Dollar against foreign currencies, exchange rate controls or regulatory restrictions on transfers of funds.
The group’s central finance function closely monitors the exposure to key currencies such as the Chinese Renminbi, EURO and Pound Sterling. Hedging is undertaken where appropriate.
Billing currencies have been adjusted to achieve a high level of natural hedging where possible.
In order to minimise foreign exchange fluctuations in the income statement of the Group, drawdowns on the senior credit facility in currencies other than the functional currency of the drawing entity will be treated where possible as a net investment hedge.
The Group Treasury Policy Statement sets out procedures on exchange rate risk management.
Compliance – Legal, Tax and Regulatory Compliance Risk
The Group is subject to diverse laws and regulations in the global markets in which it operates, particularly in certain territories where the risk is elevated due to jurisdictions with immature business practices and/or systems.
The areas include but are not limited to those related to product safety, environmental, health and safety, export controls or customs, tax laws and anti-bribery and corruption.
Non-compliance with legislation or other regulatory requirements may compromise the Group’s ability to conduct business in certain jurisdictions. They may expose the Group to potential reputational damage, financial penalties and/or suspension of business activities, any of which could have a material adverse effect.
The Group takes an uncompromising approach towards non-compliance. The group’s Code of Conduct provides a framework to general compliance and governance policies that have been established to ensure compliance with laws, regulations and standards.
The Group continually monitors developments in applicable laws and regulations in the jurisdictions in which it operates and external advice is sought where necessary.
Regular monitoring programs are in place at all sites to enable continuous improvement.
Irrespective of our own internal controls and advice provided by external consultants, we have noted in the past year that certain taxation authorities facing local funding shortfalls are becoming more aggressive in their application of tax law to the point of imposing significant penalties on minor offences and even in some cases imposing tax demands that have little basis in the local tax rules. In these instances, we continue to engage with local independent consultants and on their advice appeal these findings to a higher office.
Trend KeyNo change Increased Risk Reduced Risk
www.volex.com STRATEGIC REPORT
Volex plc 23
Volex AR2017 Front.indd 23 22/06/2017 11:57:36

25431.02 22 June 2017 11:48 AM Proof 8
During the year, with the departure of Martin Geh, the then Chairman of the Corporate and Social Responsibility Committee (the ‘Committee’), the responsibilities of the Committee were absorbed into the Board. Pursuant to the Committee’s terms of reference, the Board considered the Group’s strategy on matters including, health and safety, diversity and compliance with ethical trading practices. Further during the year the Board approved the Group’s policy on Human Rights and the statement for public release on the Modern Slavery Act 2015.
Our peopleThe commitment, enthusiasm and skill of our people are critical if we are to successfully transform Volex. The voices of these people have not always been listened to in the past, however, the Executive Chairman and his team are passionate that this turnaround should continue to be led from the factory floor with all of Volex’s people owning the plan. Communication is key and in this respect the Executive Chairman regularly tweets to his Volex followers as well as using the more traditional modes of communication to ensure all staff are aware of the developments in the business.
Equality and Human RightsVolex recognises that discrimination still operates to the disadvantage of many groups. As a responsible business Volex is committed to generating mutual stakeholder benefits and ensuring that we do not infringe on the human rights of others. We recognize that our employees are crucial to the on-going success of the business and to how the company is regarded by the wider market. Furthermore, we believe that all employees should be treated equally, fairly and with respect. Our Equality & Human Rights Policy is guided by the International Human Rights principles encompassed in the Universal Declaration of Human Rights which states all persons should have equal rights to recognition of their human dignity, and to have equal opportunities to be educated, to work, receive services and to participate in society.
Modern SlaveryModern slavery is a fundamental violation of human rights and takes various forms all of which serve to deprive a person of their liberty for another’s commercial or personal gain. These forms include, but are not limited to; compulsory labour, servitude, slavery and human trafficking.
Volex has a zero tolerance approach to any form of modern slavery. We are committed to ensuring there is no modern slavery or human trafficking in our supply chains or in any part of our business. Moreover, we undertake to ensure transparency throughout the business with a commitment to build on that undertaking year on year. We expect the same high standards from all of our contractors, suppliers and other business partners and in addition to this, all persons working for Volex in any capacity, including employees at all levels.
DiversityOur success is reflected in our diverse global workforce. To maintain our competitive edge we believe it is important to maintain diversity in gender, ethnicity, age, thinking and background. Our gender breakdown demonstrates our commitment to encouraging women in the workplace.
Approximately 3,051 (or 51%) of our employees are female and 2,951 (or 49%) are male. Our senior management team comprises 7 (or 19%) females and 30 (or 81%) males.
Health and safetyWe prioritise our people, maintain stringent safety practices and implement industry best practice across the Group. Each site conducts programme training, risk assessments and regular management reviews to identify safety risks and ensure compliance with industry best practice.
Relationship with the communityWe encourage our employees to be active participants in their local communities. Such participation includes volunteering to repair and upgrade local village schools, rubbish and litter removal programmes, working with disabled children and donating blood.
Relationship with the stakeholdersWe believe our business is built on the confidence and commitment of our stakeholders.
Customers and SuppliersSupply-chain integration continues to develop and is essential to the operation of our business. Through being proactive around corporate responsibility issues, Volex is able to meet the rigorous standards of its customers. In addition to complying with all relevant statutory and regulatory requirements (including EU RoHS and EU REACH) we support our customers’ specific requirements and implement stringent controls to eliminate the use of hazardous substances to protect the environment and reduce the risk of chemical exposure to humans.
All sites are ISO9001 certified, comply with OHSAS18001 (or its equivalent) and have adopted the Electronics Industry Supply Chain (EICC) Code of Conduct.
Our products are free from MCCP, Phthalate, Lead and DINP. Furthermore we offer a range of Halogen-Free cables.
Our impact on the environmentWe monitor the environmental impact of our business activities and encourage employee awareness of waste reduction, recycling and responsible disposal. All manufacturing sites are ISO14001, certified and have specific, local waste reduction programmes.
Carbon reportingOur emissions have been calculated using the GHG Protocol Corporate Accounting and Reporting Standard (revised edition), together with the latest emission factors from recognised public sources including, but not limited to, DEFRA, the International Energy Agency, the United States Energy Information Administration, the United States Environmental Protection Agency and the Intergovernmental Panel on Climate Change. Emissions reported correspond to our financial year.
The Volex Board is committed to the Group having a positive impact on the environment and society.
Annual Report and Accounts 2017 Stock code: VLX
Volex plc24
Corporate and Social Responsibility
Volex AR2017 Front.indd 24 22/06/2017 11:57:37

25431.02 22 June 2017 11:48 AM Proof 8
Actual data has been supplied for 94% of the reported emissions and the remainder estimated using floor area data and projected office consumption of gas, LPG, diesel and district heating, as well as refrigerants/fire extinguisher, business car travel and vehicle fuel usage (truck and forklift).
This year, our carbon footprint assessment includes Scope 3 transmission and distribution emissions from electricity and district heating consumption, which provides a more holistic representation of the emissions produced from energy consumption. However, our previous carbon footprint assessments only included Scope 1 and 2 emissions, therefore it should be noted that the Scope 3 figures below have no data comparison.
FY17 Global GHG Emissions Data
Scope 1 & 2 Direct Emissions from:Tonnes of
CO2e
Combustion of fuel and operations of facilities (GHG Protocol Scope 1) 851Electricity, heat, steam and cooling purchased for own use (GHG Protocol Scope 2) 15,786Total 16,637Intensity metric (tonnes CO2e / Full Time Equivalent employee) 2.70
Scope 3 Indirect Emissions from:Tonnes of
CO2e
Supply chain, logistics & outsourced services (GHG Protocol Scope 3) 1,369Intensity metric (tonnes CO2e per employee) 0.22
Year on Year Comparison
Emissions From:
Tonnes of CO2e
2015-2016
Tonnes of CO2e
2016-2017% change
2016-2017
Scope 1 744 851 14.4%Scope 2 17,264 15,786 –8.6%Total 18,008 16,637 –7.6%Intensity metric (tonnes CO2e / Full Time Equivalent employee) 2.65 2.70 1.9%Scope 3 No data 1,369Intensity metric (tonnes CO2e per employee) No data 0.22
Pictured: Preparation of fibre optic cables for the Telecoms industry.
www.volex.com STRATEGIC REPORT
Volex plc 25
Volex AR2017 Front.indd 25 22/06/2017 11:57:44

25431.02 22 June 2017 11:48 AM Proof 8
Daren Morris,Chief Financial Officer and Company Secretary
Daren was appointed as interim Chief Financial Officer on 11 December 2014 and Chief Financial Officer on 8 June 2015. Daren has spent the majority of his career in the financial
services industry where he was a managing director at UBS Investment Bank and Morgan Stanley, advising manufacturing and technology companies on their expansion and financing
strategies. Daren is a qualified chartered accountant and holds a degree in Physics from Oxford University.
Key areas of expertiseAll aspects of financial management, cost control, corporate finance, commercial and legal contract
risk, company secretarial duties and investor relations.
Bob Beveridge, Non-Executive DirectorBob Beveridge was appointed as a non-executive Director on 15 April 2015. He is Chairman
of the Audit Committee, a member of the Remuneration Committee and Nominations Committee and has since November 2015 been acting Senior Independent Director.
Bob has wide ranging non-executive director and public company experience, and currently sits on the Boards and is Chairman of the Audit Committee of Brady plc, InternetQ plc and
Inspiration Healthcare plc. He is a chartered accountant with extensive and relevant financial experience, having previously been Group Finance Director of McBride plc, Marlborough Stirling plc
and Cable and Wireless Communications Plc.
Key areas of expertiseGovernance, Risk Management, Mergers & Acquisitions, Managerial Finance, Strategy.
Adrian Chamberlain, Non-Executive DirectorAdrian Chamberlain was appointed to the Board of Directors as a non-executive
Director on 16 June 2016. He is Chairman of the Remuneration Committee and a member of the Audit Committee and the Nominations Committee.
Adrian is Executive Chairman of Hurley Innovations, a start-up cloud based medical diagnostics and prescription company. Adrian is a proven director with experience in technology
markets, customer development and business turnaround strategy. He holds an MA in History from Trinity College, Cambridge and an MSc in Business Studies from London Business School.
Key areas of expertiseTechnology and telecoms markets, customer development, product management, marketing and
business turnaround strategies.
The Honourable Nathaniel Rothschild,Executive Chairman
Nathaniel Rothschild was appointed to the Board as a Non-Executive Director on 15 October 2015 and became Executive Chairman on 1 December 2015. He was previously Non-
Executive Director of Barrick Gold Corporation, the world’s largest gold company, Genel Energy plc, Asia Resource Minerals plc and RIT Capital Partners plc.
Key areas of expertiseSales & marketing, strategic planning and business development in developed and emerging markets.
Volex plc
Annual Report and Accounts 2017 Stock code: VLX
26
Board of Directors
Volex AR2017 Front.indd 26 22/06/2017 11:57:55

25431.02 22 June 2017 11:48 AM Proof 8
27GovernanceChairman’s Introduction 28
Corporate Governance Report 29
Audit Committee Report 34
Remuneration Report 37
Directors’ Report FY17 52
Independent Auditor’s Report 56
www.volex.com GOVERNANCE
Volex AR2017 Front.indd 27 22/06/2017 11:57:58

25431.02 22 June 2017 11:48 AM Proof 8
“The purpose of this corporate governance report is to explain what
governance means to Volex plc in terms of its impact on decision making in the
operation of our business and to ensure as far as possible that the values you would expect
from the Group are in place and adhered to.”
As a Board and as a Group, we continue to believe that corporate governance is more than just a set of guidelines; rather it is a framework which underpins the core values for running the business in which we all believe. It enables us to test whether we do the right things in the right way, with the right safeguards, checks and balances, and whether the right considerations underpin every decision we take.
During the past year we have continued to streamline our organisation and focus on driving the values of open communication and teamwork in order to create a culture where people come forward with ideas for improvement and respect it as if it were their own business. The top team of two executives was awarded shares conditional upon three year Total Shareholder Return and Underlying Operating Profit targets and we are on track against these objectives after the first year. The senior team has recently been strengthened by the appointment of John Molloy, an experienced senior operational executive who is based in the Asia region and heads up our Power business. The non-executive directors have been valuable and committed advisors and mentors to the executive directors throughout the year, providing high levels of informal engagement in addition to the formal meetings.
To maintain the momentum of necessary cultural change the Board intends to retain the role of Executive Chairman for the forthcoming year. We acknowledge that this does not comply with the requirements of the UK Corporate Governance Code (the “Code”). However, since my personal interests are closely aligned with other shareholders and the progress to date has been encouraging, the Board continues to believe that it is in the best interests of the business for this arrangement to continue for at least another year.
During the year Adrian Chamberlain joined the board as non-executive director and chair of the remuneration committee, following an extensive and thorough recruitment process. Bob Beveridge has continued to act as senior independent director and I thank him for this additional commitment at such a critical time for the company. He has asked not to be
reappointed at the forthcoming AGM and his successor as Audit Committee Chairman and Senior Independent Director will be Dean Moore, who joined the Board in April 2017.
With the exception of the combined roles of Chairman and Chief Executive Officer, the Group is in full compliance with the Code. Our Corporate Governance Report is set out on pages 29 to 33 and explains how we manage the Group and comply with the provisions of the Code. It also sets out further details about the activity of the Board and its various Committees during the year.
Key areas of focus for the Board this year have involved the re-alignment of our organisational responsibilities, the downsizing of factory facilities, and driving new commercial opportunities, many of which are starting to bear fruit. We have secured a one year extension to the senior credit facility which given our strong cash generation in the year, we have been able to reduce from $45 million to $30 million. We expect to perform a full refinancing later on in the forthcoming year.
We trust that you will find this Annual Report to be fair, balanced and understandable. We believe our practical approach will support our performance for the long term and should thus protect the integrity of our values and the Volex brand. On your behalf, as our shareholders, we will continue to work hard to improve further our governance and Board performance. As a Board of Directors we are committed to maintaining high standards of governance and effective leadership of the business, which are already starting to deliver improved financial performance and confidence amongst the senior management team. There is much more still to do in order to achieve a strong, sustainable business but our commitment and confidence are resolute.
Yours sincerely,
Nathaniel RothschildExecutive Chairman
Executive Chairman’s IntroductionNathaniel Rothschild
Volex plc
Annual Report and Accounts 2017 Stock code: VLX
28
Volex AR2017 Front.indd 28 22/06/2017 11:58:03

25431.02 22 June 2017 11:48 AM Proof 8
“The Board provides leadership within a framework of prudent and
effective controls for risk assessment and management.”
Statement of complianceThis report, together with the Directors’ Remuneration Report on pages 37 to 51, describes how the main principles of good corporate governance have been applied throughout our business. The Company has complied with all relevant provisions of the Code for the year ended 2 April 2017 and from that date up to the date of publication of this Annual Report and Accounts other than as highlighted in the Introduction to Governance on page 28.
The role of the Board is to ensure the Company can generate sustainable growth and deliver long term value for shareholders and stakeholders. The Board is also charged with establishing the governance, values and strategic aims of the Company and is responsible for its management, direction and performance. The names, biographical details and dates of appointment of the members of the Board are set out on page 26.
The Board provides leadership within a framework of prudent and effective controls for risk assessment and management. While the Board has a formal list of matters specifically reserved for its decisions, it delegates its authority to its various Committees to assist in meeting its business objectives while ensuring a sound system of internal control and risk management.
The Executive Chairman, Nathaniel Rothschild, is responsible for the leadership of the Company and the Board and ensuring its effectiveness in all aspects of its role. The Chairman is jointly responsible with the Senior Independent Director for creating the right Board dynamics and for ensuring that all important matters, in particular strategic decisions, receive adequate time and attention at Board meetings.
The Executive Chairman and Chief Financial Officer (“CFO”) are, together, responsible for the day-to-day running of the business, developing corporate strategy and implementing Board decisions.
The role of Senior Independent non-executive Director (“SID”) was fulfilled by Bob Beveridge. He acts as a sounding board to the Executive Chairman when necessary and is able to chair Boards in the absence of the Chairman. He is available to shareholders to address concerns regarding governance and, if necessary, other issues where resolution through the normal channels is inappropriate.
Non-executive Directors are responsible for exercising independent and objective judgement to constructively challenge the decisions of executive management in order to satisfy themselves that the systems of business risk management and internal financial controls are robust.
The CFO & Company Secretary reports to the Chairman and Senior Independent Director on governance matters and is responsible for keeping the Board up to date on all legislative, regulatory and governance matters. With an assistant he is also responsible for supporting the Chairman and other Board members as necessary, including the management of Board and Committee meetings, advising on Directors’ duties and facilitating appropriate information flows between the business and the Board.
29Volex plc
www.volex.com GOVERNANCE
Corporate Governance ReportDaren Morris / Chief Financial Officer
Volex AR2017 Front.indd 29 22/06/2017 11:58:10

25431.02 22 June 2017 11:48 AM Proof 8
Operation of the BoardThe Board is responsible for the Company achieving its business objectives, oversight of risk, strategic development, and effective corporate governance. The Board discharges these responsibilities through scheduled meetings, which include regular reviews of financial and operational performance. During the financial year, the Board considered a wide variety of matters including the Company’s strategy for the coming 3 years, the Company’s budget for the coming year, the programme to introduce modern lean manufacturing operations, organisational development, risk management and shareholder feedback as well as reviewing ongoing performance.
Audit Committee
RemunerationCommittee
NominationsCommittee
Volex plc Board
Matters reserved for the Board and activity during the yearThere are certain matters reserved for Board decision only. The Board schedule of reserved matters is regularly reviewed to ensure it continues to be appropriate for the Company. These matters include:
• approval of the Company’s objectives and setting its long term strategy;
• approval of material capital expenditure projects;
• approval of half-yearly reports, trading updates and preliminary announcement of year end results;
• internal control and risk management; and
• material contracts, expenditure and Group borrowings.
The Board delegates day-to-day management of the Company to the executive Directors who, as appropriate, delegate to executive management.
Attendance at Meetings / Board processThe Board met eight times during the year, following a timetable of subject matter which is set on an annual basis, plus additional ad hoc meetings as required. The size of the Board allows flexibility to meet on short notice in response to the needs of the business and non-executive Directors are encouraged to communicate directly with executive Directors and executive management between Board meetings.
Directors attended all meetings of the Board and of those Committees of which they are members. They are expected to devote sufficient time to the Company’s affairs to enable them to fulfil their duties as Directors.
Directors’ attendance at the Board and committee meetings during the financial year is as set out below1:
Number of scheduled meetingsBoard
(8 meetings)
Nominations Committee(1 meeting)
Audit Committee
(4 meetings)
Remuneration Committee
(5 meetings)
Chairman Nathaniel Rothschild5 N/AExecutive DirectorsDaren Morris5
Non-Executive DirectorsBob BeveridgeAdrian Chamberlain3 0/0Martin Geh4 2
1 This table records Directors’ attendance for the financial year or from their date of appointment / until their date of resignation.2 On the departure of Martin Geh, the then Chair of the Corporate and Social Responsibility Committee, the Board assumed the responsibility of the Committee.3 Appointed as Non-Executive Director 16 June 2016.4 Resigned as Non-Executive Director 16 June 2016.5 Attended Nominations Committee by invite.
Volex plc
Annual Report and Accounts 2017 Stock code: VLX
30
Corporate Governance Report continued
Volex AR2017 Front.indd 30 22/06/2017 11:58:12

25431.02 22 June 2017 11:48 AM Proof 8
Board focusThe most important focus for the Board was to review progress against the revised strategy outlined in last year’s Strategic Report. In November, the Board visited our factory in Mexico for a major review of lean manufacturing progress and to agree strategic priorities for the forthcoming year. A plan for refinancing the debt facility with the banks was agreed and the refinancing completed in June 2017. With the help of an external coach the Board carried out an effectiveness review in February which led to a number of improvements in internal communications and processes.
Other matters the Board considered during the financial year included:
• budget for 2017/18 Financial Year (in February);
• detailed review of short term trading and forecasts;
• monitoring banking covenants;
• board resignations, appointments and executive responsibilities;
• risk management processes;
• cost reduction initiatives;
• results of internal board effectiveness review;
• shareholder communication; and
• Information and support.
Directors receive comprehensive briefing papers in advance of Board and Committee meetings. The new Board meetings include periods of informal discussion and dinners to take time to properly discuss and evaluate alternative actions.
Directors have access to independent professional advice at the Company’s expense and have access to the services of the Company Secretary and other external advice if needed.
Committees of the BoardThe Board has delegated certain responsibilities to the committees set out below:
• the Nominations Committee;
• the Audit Committee; and
• the Remuneration Committee.
Each of the above committees operates pursuant to individual, defined terms of reference and the chair of each committee reports to the Board at each Board meeting. The terms of reference for each committee are reviewed on an annual basis and updated to include changes to the Code. Copies of the main committee terms
of reference are available on the Company’s website. The committees comprise the independent non-executive Directors of the Company who are appointed by the Board. The Nominations Committee was chaired by Nathaniel Rothschild. The assistant Company Secretary serves as secretary to each of the Board Committees.
Nominations CommitteeThe members of the Nominations Committee are Nathaniel Rothschild (Chairman), Bob Beveridge and Adrian Chamberlain.
The Committee met on one occasion during the year.
The Committee is responsible for reviewing the size and composition of the Board (including whether the balance of executive Directors and non-executive Directors continues to be appropriate), succession planning and recommending suitable candidates for membership of the Board when such posts arise. The Committee has applied the Code provisions in developing the Company’s policies on succession planning and appointment.
In appointing a new Board member, the Committee evaluates the balance of skills, knowledge and experience of the Board and prepares a clear description of the role and the capabilities and strengths required to fulfil a particular appointment. An external search consultant was engaged to assist with the recruitment of non-executive directors in the year.
As part of its review, the Committee considers the time each non-executive Director would have to commit to in order to fulfil his / her responsibilities and any other significant commitments of the Chairman. Positions held by non-executive Directors are set out on page 26 and the 2017 review indicated that each of the non-executive Directors is able to devote sufficient time to the Company’s business. Non-executive Directors are advised on appointment, of the time required to perform the role and are also asked to confirm that they are able to carry out the required commitment.
Audit CommitteeThe members of the Audit Committee are Bob Beveridge (Chairman) and Adrian Chamberlain.
The Committee met on four occasions during the year.
Details of the Committee’s activities and composition are contained in the Audit Committee Report set out on pages 34 to 36.
Remuneration CommitteeThe members of the Remuneration Committee are Adrian Chamberlain (Chairman) and Bob Beveridge.
The Committee met on five occasions during the year.
Details of the Committee’s activities are contained in the Directors’ Remuneration Report set out on pages 37 and 51.
Board effectivenessComposition, independence and diversity on the BoardDuring the year the Board comprised the executive Chairman, CFO and two non-executive Directors. The Code requirement for at least two independent non-executive Directors has been met. Bob Beveridge and Adrian Chamberlain are considered by the Board to be independent of management and free from any business or other relationship that could materially interfere with the exercise of their judgement.
The composition of the Board represents a mixture of skills, background and experience gained from varied commercial backgrounds and is essential to the long term success and strategic growth of the Company.
Female representation on the Board is zero. The Board recognises the importance of gender diversity in the Company and is committed to promoting gender diversity throughout the organisation. Further information on the total female representation in our workforce is provided in our Corporate and Social Responsibility Report on page 24.
31Volex plc
www.volex.com GOVERNANCE
Volex AR2017 Front.indd 31 22/06/2017 11:58:12

25431.02 22 June 2017 11:48 AM Proof 8
Re-election of DirectorsDirectors are elected by shareholders at the first Annual General Meeting (“AGM”) after their appointment and, thereafter, may offer themselves up for re-election by shareholders at regular intervals and in any event at least once every three years. The Company intends to continue with this practice but will review this regularly. Dean Moore will be offered for election to the Board and Bob Beveridge will step down at this time.
Conflicts of interestUnder the Companies Act 2006, a Director must avoid a situation where a direct or indirect conflict of interest may occur and procedures are in place to manage any circumstance where a conflict may be perceived. The Company’s Articles of Association allow the Board of Directors to authorise potential and actual conflicts of interest where appropriate.
Performance evaluationThe Board recognises that a robust performance evaluation is important to maximise Board effectiveness. An external review of board skills and behaviours was carried out this year by an external consultant, Dobson Lyle. The Chairman of the Audit Committee conducted an internal performance review of the Committee, considering a range of factors.
During the year, pursuant to the Code, the Executive Chairman met with the non-executive Directors without the CFO present, and the acting Senior Independent Director met with the other non-executive Director without the Executive Chairman or CFO present.
DevelopmentAll new Directors receive an induction programme tailored to their background and experience and the Company Secretary is charged with organising such programmes. In addition, all Directors are regularly informed of changes to relevant legislation or regulations and receive regular briefings on areas such as Directors’ duties and corporate governance guidelines and best practice.
Individual Directors, with the support of the Company Secretary, are also expected to take responsibility for identifying their own training needs and to ensure that they are adequately informed about the Group and their responsibilities as a Director.
AccountabilityFinancial reportingThe Board is responsible for presenting a fair, balanced and understandable assessment of the Company. The Company has a comprehensive annual budgeting process and the annual budget is approved by the Board. Reforecasts are presented to the Board during the year. The statement that gives the reasons why the Directors continue to adopt the going concern basis for preparing the financial statements is given in the Directors’ Report on page 55.
Internal controls and risk managementThe Board has overall responsibility for the Group’s system of internal control and risk management and for reviewing the effectiveness of this system. Such a system is designed to identify, evaluate and control the significant risks associated with delivering the Group’s strategy with a view to safeguarding shareholders’ investments and the Group’s assets. Due to the limitations that are inherent in any system of internal control, this system is designed to meet the Group’s particular needs and the risks to which it is exposed and is designed to manage rather than eliminate risk. Accordingly, such a system can provide reasonable, but not absolute, assurance against material misstatement or loss.
There is an on-going process for identifying, evaluating and managing the significant risks faced by the Group which has been in place for the year up to and including the date of approval of this report. During the year the Board continued to revisit its risk identification and assessment processes, inviting Board members and senior management to identify the Company’s key risks and mitigating controls. The output from this process is the Group’s risk register which explains the key risks faced by the Company, their potential impact, likelihood and how these risks are being managed
Read more about our Principal Risk and Uncertainties on pages 20 to 23
Key features of the Company’s system of internal controlsKey elements of the Company’s system of internal controls which have operated throughout the year are:
• a system of regular reports from management setting out key performance and risk indicators;
• rigorous short term management and forecasting of cashflow;
• a schedule of specific, key matters reserved for decision by the Board;
• a framework for reporting and escalating matters of significance;
• Group-wide procedures, policies and standards which incorporate statements of required behaviour;
• continuous review of operating performance and monitoring of monthly results against annual budgets, and periodic forecasts; and
• a well-publicised process and policy for employees to raise concerns and regular reports to the Audit Committee of all material disclosures made, the results of investigations and actions taken.
During the year, the Head of Internal Audit resigned and was not immediately replaced due to the corporate re-organisation in the early part of the year. An internal replacement was identified and commenced in the role before year-end with a full internal audit plan in place for FY 2018.
Through its risk management process and the review of effectiveness of the system of internal controls, the Board believes the control environment is adequate for a Group the size of Volex.
Viability statement1) Assessment of prospectsThe context for assessmentFY2017 proved a challenging year with a downturn in trade from several significant customers, in particular our largest customer, resulting in further restructuring activities having to be taken. The loss of low margin business, however, was more than compensated by the cost savings leading to improved underlying profitability and the reduced working capital demand and capital investment gave rise to cash generation and a net cash position for the Group at year end.
Whilst significant progress has been made in developing a new sales strategy with a number of new accounts identified and set to scale in FY2018, the outlook for the Group’s traditional key markets remains tough with falling demand in the PC and laptop markets leading to intensified competition. Going forward we plan to compete not solely on cost but also identify those premium brand customers for whom quality and reliability are equally as important as low cost.
Volex plc
Annual Report and Accounts 2017 Stock code: VLX
32
Corporate Governance Report continued
Volex AR2017 Front.indd 32 22/06/2017 11:58:12

25431.02 22 June 2017 11:48 AM Proof 8
The assessment process and key assumptionsThe Group’s prospects are assessed primarily through its annual budgeting process through to March 2018, supplemented by a higher level forecast for the following 2 years (the ‘3 year strategic plan’).
The annual budget for FY 2018 was prepared through a group wide bottom up process: the sales account managers prepared detailed sales forecasts by customer and factory managers prepared operational costings, with the full support and engagement of the procurement and finance functions. These forecasts were then reviewed and challenged by the executive directors and the Board. The CFO led budgeting workshops with each function to ensure all opportunities and risks were addressed. The FY 2018 budgeting cycle concluded in February 2017. The budget assumptions have been assessed against the revised financial covenants and the Board is confident that we will be able to operate within them.
The recent extension of the senior credit facility to June 2019 will allow the Group to demonstrate the positive impact of the turnaround strategy prior to a full refinancing; as a result, in accordance with the UK Corporate Governance Code the Directors have assessed the viability of the Group over this two year period.
The key assumptions in this forecast are:
• Power Cord revenues decline due to continued loss of business from our largest customer;
• Cable Assemblies revenue to grow by 16% pa as we win new business, largely in the high speed data cabling markets; and
• Gross margins to remain flat as aggressive pricing and commodity price increases offset the natural mix improvement.
The Board carried out a robust assessment of the principal risks facing the Group as outlined on pages 20 to 23, including those that would threaten the future performance, solvency or liquidity of the Group. Part of the Board’s role was to consider whether both the Budget and the Forecast took appropriate account of the external environment and mitigations for those principal risks identified. These risks could prevent the Group from delivering on its forecast performance, however, management believes it has a number of mitigating actions available to it such that the impact of a reasonable downside could be controlled.
2) Assessment of viabilityAlthough the budget and forecast represent the directors’ best estimate of the future prospects of the business, they have also tested the potential impact on the Group of a number of downside scenarios. These scenarios, which take into account the principal risks faced by the Group, represent ‘severe but possible’ circumstances that the Group could experience.
Key sensitivities include:
• A further revenue reduction from our largest customer of 20%; and
• Only half of the forecast new business is achieved.
The results of this stress testing showed that, given the available headroom on the existing financing and further cost reduction plans available to management, the Group would be able to withstand the impact of these scenarios occurring over the period to June 2019.
3) Viability statementBased on their assessment of prospects and viability above, the directors confirm that they have a reasonable expectation that the Group will be able to continue in operation and meet its liabilities as they fall due over the two year period to June 2019.
Relations with shareholdersThe Board is responsible for effectively engaging with shareholders. The Board achieves this through regular dialogue with shareholders, brokers and analysts, with the Chairman and CFO leading these relationships.
The Board takes steps to understand the views of major shareholders of the Company, including receiving feedback from shareholder meetings at each Board meeting and analyst / broker briefings. The Board always takes account of the corporate governance guidelines of institutional shareholders and their representative bodies such as the Investment Association and the National Association of Pension Funds. In addition, the Chairman and CFO are available to meet with major and prospective shareholders. The SID and other non-executive Directors are available to attend Shareholder meetings as necessary.
Annual General Meeting (“AGM”)The Notice of AGM will be dispatched to shareholders, together with explanatory notes or a circular on items of special business, at least 21 clear days before the meeting. Separate resolutions will be proposed on each substantially separate issue including a resolution relating to the Annual Report and Accounts.
The non-executive directors will attend the forthcoming Annual General Meeting and are, with the other Directors, available to meet shareholders and answer questions; the Board welcomes questions from shareholders who are given the opportunity to raise issues in the AGM itself or informally before or after the meeting.
For each resolution, the proxy appointment forms provide shareholders with the option to direct their proxy vote either for or against the resolution or to withhold their vote.
The Company will ensure that the proxy form and any announcement of the results of a vote will make it clear that a ‘vote withheld’ is not a vote in law and will not be counted in the calculation of the proportion of the votes for and against the resolution.
All valid proxy appointments are properly recorded and counted. For each resolution, after the vote has been taken, information on the number of proxy votes for and against the resolution, and the number of shares in respect of which the vote was withheld, are given at the meeting and are made available on the Company’s website at www.volex.com
By Order of the Board
Daren Morris Chief Financial Officer and Company Secretary 8 June 2017
33Volex plc
www.volex.com GOVERNANCE
Volex AR2017 Front.indd 33 22/06/2017 11:58:13

25431.02 22 June 2017 11:48 AM Proof 8
“To support the Board’s duty of stewardship, the Committee aims to
ensure appropriate corporate governance is applied to the Group’s systems of
internal control, risk management and other compliance matters.”
Key objectiveFurther to the above, the Committee also monitors the integrity of financial information published externally for use by shareholders. We ensure that the integrity of the financial statements is supported by an effective external audit.
GovernanceThe role of the Audit Committee is defined by its terms of reference which can be found on the Volex website.
The Audit Committee is responsible for:
• Monitoring the integrity of the financial statements of the Group and any formal announcements relating to the Group’s financial performance and reviewing significant financial reporting judgements contained therein;
• Reporting to the Board as to whether the processes in place to confirm that the Annual Report and Accounts, when taken as a whole, is fair, balanced and understandable and contains the information necessary to allow shareholders to assess the Group’s performance, business model and strategy;
• Reviewing and challenging where necessary the appropriateness of accounting policies and the manner in which they are applied across the group;
• Reviewing the Group’s internal financial controls and the Group’s internal control and risk management systems;
• Monitoring and reviewing the effectiveness of the Group’s internal audit function in the context of the Group’s overall risk management system;
• Reviewing the Group’s procedures for detecting and responding to fraud, bribery and the handling of allegations made by employees with respect to financial malpractice or other forms of whistle-blowing and oversight of any and all reports on such incidents; and
• Oversight of the relationship with the external auditor including where appropriate the recommendation of appointment or reappointment of the external auditor.
The Audit Committee reports its findings to the Board, identifying any matters on which it considers that action or improvement is needed, and makes recommendations on the steps to be taken.
Composition of the Audit CommitteeThe members of the Audit Committee were:
Name Date of appointment
Robert Beveridge (Chairman)
15 April 2015
Adrian Chamberlain 16 June 2016Martin Geh 26 March 2015
resigned 16 June 2016
The Committee members have the appropriate range of financial, commercial and risk management experience to fulfil its duties.
Appointments are for a period of three years and are extendable by no more than two additional three-year terms. The Committee must consist of independent non-executives and requires a minimum of two independent non-executive members at any time.
Volex plc
Annual Report and Accounts 2017 Stock code: VLX
34
Audit Committee ReportBob Beveridge
Volex AR2017 Front.indd 34 22/06/2017 11:58:19

25431.02 22 June 2017 11:48 AM Proof 8
The Audit Committee Chairman has recent and relevant financial experience, in line with the Code and Committee terms of reference. Biographical details are set out on page 26.
MeetingsThe Audit Committee met four times in the year, in accordance with an agenda linked to events in the Group’s financial calendar. The agenda is predominantly cyclical and is therefore approved by the Audit Committee Chairman on behalf of his fellow members. Each Audit Committee member has the right to request reports on matters of interest in addition to the cyclical items.
The Audit Committee invites the Group CFO, the Group Financial Controller and senior representatives of the external auditor to attend all of its meetings in full, although it reserves the right to request any of these individuals to withdraw. Other Directors can be invited to attend.
Main activities of the Committee during the yearFinancial reportingThe primary role of the Audit Committee in relation to financial reporting is to review with both management and the external auditors (PricewaterhouseCoopers LLP, ‘PwC’), and report to the Board where required, the appropriateness of the half-year and annual financial statements concentrating on, amongst other matters;
• The quality and acceptability of accounting policies and practices;
• The clarity of the disclosures and compliance with financial reporting standards and relevant financial and governance reporting requirements;
• Material areas in which significant judgements have been applied or there has been discussion with PwC;
• Whether the processes to ensure that the Annual Report and Accounts, taken as a whole, is fair, balanced and understandable and provides the information necessary for shareholders to assess the Company’s performance, business model and strategy; and
• Any correspondence from regulators in relation to our financial reporting.
To aid our review the Committee considers reports from the Chief Financial Officer and the Group Financial Controller and reports from the external auditors. In addition, the Committee following their review of the Annual Report and Accounts, has challenged management on its content to
ensure that the Report as a whole is fair, balanced and understandable.
The Committee has reviewed papers on the critical judgements and estimates outlined in Note 2 of the accounts on pages 76 to 77. The primary areas of judgement considered and discussed by the Committee in relation to the FY2017 financial statements and how these have been addressed are listed below.
• Going concern – The Committee has reviewed the Group’s budget and three year plan and considered its compliance with bank facility covenants. The Committee has also considered sensitivities to the forecasts and reviewed the mitigations available to the Group. The Committee concluded that the Accounts should be prepared on a Going concern basis;
• Non-recurring expenditure – Management has presented a breakdown of the non-recurring expenditure and explanations as to why the expense should be analysed as such. The Audit Committee has reviewed and discussed this analysis with management. Details are shown in Note 4 on page 79. Non-recurring expenditure during the year was $15.2 million. The Committee agreed that these costs were suitably disclosed as non-recurring;
• Fixed asset impairment – The continued downturn in trade with our major Power Cords customer provided indications of impairment. The committee has reviewed the impairment analysis prepared by management and agreed that an impairment charge of $12.0 million within the Power Cords division is reasonable. A further $0.5 million of impairment has been recognised with respect to the closure of the Brazil subsidiary. Both of these amounts are included within the non-recurring expenditure of £$15.2 million. Since there is no future use for these assets, the Committee agreed with the impairment charge; and
• Inventory Provisions – the Committee reviewed the level of provision held against inventory in light of the Group’s provisioning policy, the ageing of the stock and forecast future demand. Specific items one-off in nature or material due to their size were also considered. In light of this, the Committee believes the $4.3 million provision is reasonable.
Internal control, risk and complianceThe Audit Committee is required to assist the Board in its annual assessment of the effectiveness of the Volex risk management and internal control systems. To fulfil these duties, the Committee reviewed:
• The results, by exception, of the Annual Certificate of Compliance completed by all senior personnel in the organisation;
• The updated risk register prepared by Board members and senior management; and
• Investigations performed on all whistle-blowing, control breakdowns and fraudulent issues.
Details of our internal controls and risk management systems including controls over the financial reporting process can be found on page 32 in the Corporate Governance Report with our risk factors in full in the Strategic report on pages 20 to 23.
Internal auditThe Head of Internal Audit resigned during the year and was not immediately replaced due to the corporate reorganisation in the early part of the year. An internal replacement was identified and commenced in the role before year-end; actions from previous audits have been revisited and an internal audit plan for FY2018 has been prepared. The Committee will continue to monitor the effectiveness of this function during the coming year.
The Group’s Whistleblowing Policy contains arrangements for the Audit Committee to review in confidence all complaints.
External auditThe Audit Committee is responsible for the monitoring of the independence, objectivity and compliance with ethical and regulatory requirements of the external auditors. Details of the total remuneration for the auditors for the year can be found in Note 8 on page 82 of the consolidated financial statements.
The auditors’ independence and objectivity is safeguarded by limiting the value and nature of external services provided by the auditors. The group also has a policy of not recruiting employees of the external auditors who have worked on the audit in the last two years to senior positions in the Group. There is a rotation policy for the lead engagement partner.
35Volex plc
www.volex.com GOVERNANCE
Volex AR2017 Front.indd 35 22/06/2017 11:58:19

25431.02 22 June 2017 11:48 AM Proof 8
Non-audit services provided by the auditorsThe Audit Committee maintains a non-audit services policy which sets out the categories of non-audit services that the external auditors will and will not be allowed to provide to the Group, including those that are pre-approved by the Audit Committee and those that require specific approval before they are contracted for, subject to de-minimis levels. Non-audit fees for the year were $Nil (FY2016: $Nil).
Audit tenderThe Audit Committee considers the reappointment of the external auditors each year. PwC has been our auditors since 4 April 2010 following a tender process. There are no contractual obligations that restrict the Committee’s choice of external auditors.
To fulfil its responsibility regarding the independence and effectiveness of the external auditor, the Audit Committee:
• Reviewed the external auditors’ plan for the current year (approving a change of the senior statutory audit partner and changes in key audit staff) and agreed the scope of the audit work to be performed;
• Agreed the fees to be paid to PwC for their audit of the 2 April 2017 financial statements and other non-audit fees;
• Reviewed a report from PwC describing their arrangements to identify, report and manage any conflicts of interest and confirming the basis of their independence;
• Reviewed the output from an Audit Effectiveness Questionnaire completed by Audit Committee members and senior members of the finance team who regularly interact with the external auditors;
• Assessed PwC’s fulfilment of the agreed audit plan and any variations from that plan; and
• Assessed the robustness and perceptiveness of PwC in their handling of the key accounting and audit judgements.
The Audit Committee, having considered the length of PwC’s audit tenure and the results of the above, continue to consider PwC to be independent and therefore have provided the Board with its recommendation that PwC be reappointed as external auditors for the 52 weeks ending 1 April 2018.
This will continue to be assessed on an annual basis considering the provisions outlined in the revised UK Corporate Governance code in respect of external audit tendering and the likely changes resulting from the European Commission’s Competition Review.
SummaryAs a result of its work during the year, the Audit Committee has concluded that it has acted in accordance with its terms of reference and has ensured the independence and objectivity of the external auditors.
The Chairman of the Audit Committee will be available at the Annual General Meeting to answer any questions about the work of the Committee. We would welcome feedback from shareholders on this report.
On behalf of the Audit Committee
Bob Beveridge Chairman of the Audit Committee 8 June 2017
Volex plc
Annual Report and Accounts 2017 Stock code: VLX
36
Audit Committee Report continued
Volex AR2017 Front.indd 36 22/06/2017 11:58:21

25431.02 22 June 2017 11:48 AM Proof 8
Annual StatementOverview From Chairman of the Remuneration CommitteeI am pleased to introduce the Directors’ Remuneration Report for the year ended 2 April 2017, which includes my statement, the Directors’ remuneration policy and the Annual Report on Remuneration for the year.
FY2017 was a year in which we started to see an improvement in our underlying business performance with improved pre-exceptional operating profits and relatively strong cash flow generation.
In last year’s remuneration report we disclosed that the bonus payment level would be determined with reference to Company performance against two key financial targets: Group Operating Profit and Group Return on Capital Employed. We are pleased to report that the Company has met the Group Return on Capital Employed target of 18% and bonuses will be paid under the annual bonus plan at the level of 50% of maximum. The Remuneration Committee decided to exercise its discretion and require that one-third of the annual bonus for Executive Directors is deferred into shares for a period of one year. Nathaniel Rothschild has agreed to defer 100% of his bonus for FY2017 into shares.
In FY2018 Executive Directors will continue to have the opportunity to earn up to 100% of annual salary under the plan, and the payment level will be determined with reference to Company performance against a mixture of our key financial targets used in FY2017 together with the addition of a revenue growth target and other qualitative measures. The purpose of this is to incentivise the Executive Directors to focus on growth, operational and quality improvements following a number of years of cost cutting and footprint rationalisation. Financial measures will continue to make up 80% of the total opportunity for Executive Directors in accordance with the current remuneration policy.
During the year we reviewed the salary of Nathaniel Rothschild and increased his base salary to reflect his level of involvement in the business. The Remuneration Committee consulted with the Company’s major shareholders in respect of this increase.
On 1 December 2016 both Daren Morris and Nathaniel Rothschild were issued with an award under the PSP of 86% of base salary in accordance with approved Remuneration Policy as outlined in this report. It is envisaged that an award of shares under the PSP will be made during the coming year, such award being in line with the policy.
Base salaries of the Executive Directors for FY2018 were reviewed and increased 2.1% in line with employee salary increases.
The Remuneration Committee is continually aware and mindful of any potential risks associated with our remuneration programmes. We seek to provide a structure that encourages an acceptable level of risk taking through key performance measures and an optimal remuneration mix. The committee undertakes annual third party evaluations to ensure our reward programmes achieve the correct balance and do not encourage excessive risk taking. The Committee has considered the risk involved in the short and long term incentive schemes and is satisfied that the governance procedures mitigate these risks appropriately.
During the year the Committee reviewed the Remuneration Policy, and considered that it continues to be appropriate. As such, we will be seeking approval for a Policy which is unchanged from that approval by our shareholders in 2014 save for the introduction of the flexibility to defer a portion of the annual bonus into Volex shares, vesting after at least one year, as approved at the 2015 AGM. Additionally, no substantial changes are proposed to the implementation of the Policy in FY2018. The Committee continues to welcome feedback from shareholders, and I hope we can continue to receive your support on the remuneration-related votes at our AGM.
On behalf of the Remuneration Committee
Adrian Chamberlain Chairman of the Remuneration Committee 8 June 2017
37Volex plc
www.volex.com GOVERNANCE
Directors’ Remuneration ReportAdrian Chamberlain
“With Return on Capital Employed bonus targets achieved, the
Directors have been awarded a 50% payout of their bonus entitlement.”
Volex AR2017 Front.indd 37 22/06/2017 11:58:26

25431.02 22 June 2017 11:48 AM Proof 8
Compliance statementThis report has been prepared in accordance with the requirements of the Large and Medium Sized Companies and Groups (Accounts and Reports) (Amendment) Regulations 2013, the UK Listing Authority Listing Rules and applies the principles set out in the UK Code on Corporate Governance (the “Code”).
The following parts of the Annual Report on Remuneration are audited: the single total figure of remuneration for Directors, including annual bonus and PSP outcomes for the financial year ended 2 April 2017; scheme interests awarded during the year; payments to past directors and payments for loss of office; and Directors’ shareholdings and share interests.
IntroductionThe Company’s Remuneration Policy (‘Policy’) is designed to reinforce the Company’s goals, providing effective incentives for exceptional Group and individual performance. The Committee regularly reviews the remuneration structure in place at Volex to ensure it remains aligned with our business strategy and reinforces our success, and aligns reward with the creation of shareholder value. The Committee strives to ensure that shareholders’ interests are served by creating an appropriate balance between fixed and performance-related pay. A considerable part of the reward package is linked to share price performance and is delivered in shares.
This section of the report sets out the remuneration policy for Executive and Non-Executive Directors which shareholders are asked to approve at the 2017 AGM. The Committee intends that this Policy will formally come into effect from the date of the AGM on 25 July 2017.
Policy reportVolex’s future remuneration policy for executive directorsThe Policy Table below sets out the remuneration policy for which the Committee is seeking shareholder approval. This policy is unchanged from that which was approved by shareholders at the 2014 AGM except for the introduction of Remuneration Committee discretion to require, at its discretion, deferral of a portion of the annual bonus into Volex shares, vesting after at least one year, as approved at the 2015 AGM. The Committee believes that the proposed change, which was implemented for FY17 bonuses, will support retention and provide greater alignment with shareholders.
Purpose and link to strategy Operation Opportunity Performance metrics
Base salary
To reflect market value of the role and individual’s performance and contribution.
Reviewed on an annual basis, with any adjustments taking effect from 1 April.
The Committee reviews base salaries with reference to:
• The individual’s performance, responsibility, skills and experience;
• Company performance and market conditions;
• Salary levels for similar roles at relevant comparators, including companies of similar market capitalisation to Volex and companies in a similar sector; and
• Wider pay levels and salary increases across the Group.
Payable in cash.
Base salary increases are applied in line with the outcome of the review as part of which the Committee also considers average increases across the Group.
In respect of existing Executive Directors, it is anticipated that salary increases will generally be in line with those of salaried employees as a whole. In exceptional circumstances (including, but not limited to, a material increase in job size or complexity) the Committee has discretion to make appropriate adjustments to salary levels to ensure they remain market competitive.
Company and individual performance are considerations in setting Executive Director base salaries.
Pension
To provide a market competitive pension.
Executives participate in a money purchase scheme or other scheme as may be appropriate from time to time (e.g. taking into account location).
Executive Directors receive a contribution of up to 20% of salary. This may be exceeded in exceptional circumstances (e.g. recruitment).
Not performance related.
Volex plc
Annual Report and Accounts 2017 Stock code: VLX
38
Directors’ Remuneration Report continued
Volex AR2017 Front.indd 38 22/06/2017 11:58:27

25431.02 22 June 2017 11:48 AM Proof 8
Purpose and link to strategy Operation Opportunity Performance metrics
Benefits
To provide market competitive benefits.
Benefits may include fuel costs, travel allowances, private medical insurance, critical life and death in service cover. Other benefits may be awarded as appropriate and include relocation and other expatriate benefits.
Benefits may vary by role and individual circumstance and are reviewed periodically.
Benefits are not anticipated to exceed 10% of salary over three financial years.The Committee retains the discretion to approve a higher cost in exceptional circumstances (e.g. relocation) or in circumstances where factors outside of the Company’s control have materially changed (e.g. increases in medical insurance premiums).
Not performance related.
Annual bonus
To incentivise delivery of the Group’s annual financial and strategic goals.
Performance is measured on an annual basis for each financial year.
KPIs are established at the start of the year that are directly related to and reinforce the business strategy. Stretch targets are set for each KPI; at the end of the year the Committee determines the extent to which these were achieved.
The Remuneration Committee has discretion to require a proportion of any annual bonus award to be deferred into shares for at least one year, subject to continued employment. Annual bonus amounts paid and vested deferred bonus awards are subject to clawback. Malus may be applied to the in-year bonus (i.e. the bonus opportunity for the year may be reduced) and to unvested deferred bonus awards.
The maximum bonus for Executive Directors is 100% of salary p.a.
For threshold performance, 20% of the bonus is payable.
For performance between threshold and maximum, the bonus pay-out will increase straight-line.
KPIs selected and their respective weightings may vary from year to year depending on strategic priorities. Measures may include financial and non-financial metrics.
Corporate measures will be weighted each year according to business priorities. Measures will include a measure of operating profit. The range of performance required under each measure is calibrated with reference to Volex’s internal budgets. Financial measures will make up at least 80% of the total opportunity.
The Committee has discretion to adjust the formulaic bonus outcome both upwards and downwards to ensure alignment of pay with the underlying performance of the business over the financial year, and to take into account personal performance over the course of the year.
Further details of performance conditions are provided in the Annual Report on Remuneration on page 49.
PSP
To drive performance, aid retention and align the interests of Executive Directors with shareholders.
The Committee may grant annual awards in the form of shares or nominal value options which vest after at least three years, subject to performance conditions.
The award levels and performance conditions are reviewed in advance of grant to ensure they remain appropriate.
Unvested awards under the PSP are subject to malus and vested awards are subject to clawback.
PSP awards will have a performance period of at least three years and a minimum vesting period of three years. If no entitlement has been earned at the end of the relevant performance period, awards will lapse.
The PSP provides for annual awards of performance shares of up to 100% of salary for the Executive Directors. This limit may be exceeded in circumstances in which the Committee, at its absolute discretion, deems appropriate.
Under each measure, threshold performance will result in 30% of maximum vesting for that element, rising on a straight-line to full vesting.
Awards vest subject to continued employment and Company performance. The performance measures are currently relative Total Shareholder Return (“TSR”) and cumulative operating profit but the Committee may also include additional measures. The weighting on TSR for any PSP award will be at least 50%.
The Committee reviews the comparator group(s) against which TSR performance is measured from time to time to ensure it remains aligned with shareholder interests.
As under the annual bonus, the Committee has discretion to adjust the formulaic PSP outcomes to ensure alignment of pay with performance, i.e. to ensure the outcome is a true reflection of the performance of the company.
Further details of performance conditions are provided in the Annual Report on Remuneration on page 49.
39Volex plc
www.volex.com GOVERNANCE
Volex AR2017 Front.indd 39 22/06/2017 11:58:27

25431.02 22 June 2017 11:48 AM Proof 8
Notes to the Policy TablePerformance measurement selectionThe aim of the annual bonus plan is to reward key executives over and above base salary for the achievement of business objectives. The bonus criteria are selected annually to reflect the Group’s main KPIs for the year and are designed to encourage continuous performance improvement for the Group. Group financial performance targets relating to the annual bonus plan are set from the Company’s annual budget, which is reviewed and signed off by the Board prior to the start of each financial year. Operating profit is used as a key performance indicator for the annual bonus plan because it is a clear measure of the underlying financial performance of the Group.
Long term share-based incentives (“LTI”) are designed to align the interests of key executives with the longer term interests of the Company’s shareholders by rewarding them for delivering sustained, increased shareholder value. Accordingly, the vesting of LTI share awards is linked to performance conditions, in particular to the Company’s relative total shareholder return and operating profit. Relative TSR has been selected as it is directly aligned with shareholder interests. Operating profit has been selected as it is a key measure of long term performance for Volex and is closely aligned with the Company’s strategic plans. The Committee believes that the minimum three-year performance period is in line with market and therefore aids the recruitment of senior hires. For the LTI, performance measures and targets are reviewed by the Committee ahead of each grant and must be considered by the Committee to be challenging but achievable.
Targets applying to the bonus and PSP are reviewed annually, based on a number of internal and external reference points. Performance targets are set to be stretching but achievable, with regard to the particular strategic priorities and economic environment in a given year.
Remuneration policy for other employeesVolex’s approach to annual salary reviews is consistent across the Group, with consideration given to the level of experience, responsibility, individual performance and salary levels in comparable companies. The majority of employees are eligible to participate in an annual bonus scheme. Opportunities and specific performance conditions vary by organisational level with business area-specific metrics incorporated where appropriate. Executive Committee members are eligible to participate in the LTI. Performance conditions are consistent for all participants, while award sizes vary by organisational level. Specific cash incentives are also in place to motivate, reward and retain staff below Board level.
Shareholding guidelinesThe Committee continues to recognise the importance of Executive Directors aligning their interests with shareholders through building up a significant shareholding in the Company. Shareholding guidelines are in place that require Executive Directors to acquire over time a holding, equivalent to 100% of base salary. Other executives are required to acquire a holding over time equivalent to 50% of base salary. Executives are expected to retain at least 50% of any LTI shares acquired on vesting (net of tax) until the guideline level is achieved.
Volex’s future remuneration policy for the Non-Executive DirectorsThe Board determines the remuneration policy and level of fees for the Non-Executive Directors, within the limits set out in the Articles of Association. The Remuneration Committee recommends the remuneration policy and level of fees for the Executive Chairman. Non-Executive Directors are not eligible to participate in the annual bonus, PSP or pension schemes. The current Policy is:
Purpose and link to strategy Operation Opportunity Performance metrics
Fees
To reflect market competitive rates for the role, as well as individual performance and contribution.
Non-Executive Directors receive a basic fee for their respective roles. Additional fees are paid to Non-Executive Directors for additional services, e.g. such as chairing a Board Committee, supporting the Board on matters that require significant time commitment over and above that expected to fulfil the normal duties, etc.
Fees are reviewed annually with reference to information provided by remuneration surveys, the extent of the duties performed, and the size and complexity of the Company. Fee levels are benchmarked against sector comparators and FTSE-listed companies of similar size and complexity.
Payable in cash.
Fee increases are applied in line with the outcome of the annual review.
There is no prescribed maximum fee. It is expected that increases to non-executive director fee levels will be in line with salaried employees over the life of the policy. However, in the event that there is a material misalignment with the market or a change in the complexity, responsibility or time commitment required to fulfil a non-executive director role, the Board has discretion to make an appropriate adjustment to the fee level.
Not applicable.
Volex plc
Annual Report and Accounts 2017 Stock code: VLX
40
Directors’ Remuneration Report continued
Volex AR2017 Front.indd 40 22/06/2017 11:58:27

25431.02 22 June 2017 11:48 AM Proof 8
Pay scenario chartsThe charts below provide estimates of the potential future reward opportunity for the current Executive Directors, and the potential split between the different elements of remuneration under three different performance scenarios: ‘Minimum’, ‘On Target/Threshold’ and ‘Maximum’.
Potential reward opportunities illustrated below are based on the remuneration policy, applied to the base salary as at 3 April 2017. For the annual bonus, the amounts illustrated are those potentially receivable in respect of performance for FY2018. For the PSP, the award opportunities are based on those PSP awards which are expected to be granted in FY2018. It should be noted that PSP awards granted in a year normally vest on the third anniversary of the date of grant, and the projected value of PSP amounts excludes the impact of share price movement over the vesting period.
In illustrating potential reward opportunities the following assumptions have been made:
Component ‘Minimum’ ‘On-target’ ‘Maximum’
Fixed Base salary Last known salary
Pension Contribution rate applied to latest known salary
Other benefits Benefits as provided in the single figure table (excluding relocation allowances)
Annual bonus No bonus payable Target bonus (20% of max)
Maximum bonus
PSP No LTIP vesting Threshold vesting (30% of max)
Maximum vesting
CFO – Daren MorrisExecutive Chairman – Nat Rothschild
0 200 400 600 800 1000 1200
Minimum
On-target/Threshold
Maximum £987,000
£528,000
£375,000
Salary STIP LTIP
£’000s0 200 400 600 800 1000 1200
Minimum
On-target/Threshold
Maximum £919,000
£459,000
£306,000
Salary STIP LTIP
£’000s
Approach to recruitment remunerationExternal appointmentIn the cases of hiring or appointing a new Executive Director from outside the Company, the Committee may make use of any or all of the existing components of remuneration, as follows:
Component Approach Maximum Value
Base salary The base salaries of new appointees will be determined by reference to the individual’s role and responsibilities, experience and skills, relevant market data, internal relativities and their current basic salary. Where new appointees have initial basic salaries set below market, any shortfall may be managed with phased increases over a period of one to two years subject to their development in the role.
Not applicable.
Pension New appointees will be eligible to participate in the Group’s defined contribution pension plan or to receive a cash allowance.
Benefits New appointees will be eligible to receive benefits in line with the Policy.
Annual bonus The annual bonus described in the Policy Table will apply to new appointees with the relevant maximum being pro-rated to reflect the proportion of employment over the year. Targets for the individual element will be tailored to the Executive.
Up to 100% of salary p.a.
PSP New appointees will be eligible for awards under the PSP which will normally be on the same terms as other Executive Directors, as described in the Policy Table.
Up to 200% of salary p.a.
41Volex plc
www.volex.com GOVERNANCE
Volex AR2017 Front.indd 41 22/06/2017 11:58:27

25431.02 22 June 2017 11:48 AM Proof 8
In determining an appropriate remuneration package, the Remuneration Committee will take into consideration all relevant factors (including quantum, nature of remuneration and the jurisdiction from which the candidate was recruited) to ensure that arrangements are in the best interests of both Volex and its shareholders. In addition to the above elements of remuneration, the Committee may consider it appropriate to grant an award under a different structure in order to facilitate the recruitment of an individual, exercising the discretion available under the relevant Listing Rule to replace incentive arrangements forfeited on leaving a previous employer. Such ‘buyout awards’ would have a fair value no higher than that of the awards forfeited. In doing so, the Committee will consider relevant factors including any performance conditions attached to these awards, the likelihood of those conditions being met and the proportion of the vesting period remaining.
Internal promotionIn cases of appointing a new Executive Director by way of internal promotion, the Remuneration Committee will be consistent with the policy for external appointees detailed above. Where an individual has contractual commitments made prior to their promotion to Executive Director level, the Company will continue to honour these arrangements.
Non-Executive DirectorsIn the case of hiring or appointing a new Non-Executive Director, the Committee will follow the Policy as set out in the table on page 40. A base fee in line with the prevailing fee schedule would be payable for Board membership, with additional fees payable for additional services, such as chairing a Board Committee or acting as a Senior Independent Director.
Service contractsThe Code and guidelines issued by institutional investors recommend that notice periods of no more than one year be set as an objective for Executive Directors and that any payments to a departing Executive Director should be determined having full regard to the duty of mitigation. It is the Company’s intention to meet these guidelines and the Company policy is that Executive Director’s service contracts may be terminated by either party on not more than 12 months’ notice.
The Executive Directors are employed under contracts of employment with Volex Plc. The principal terms of the Executive Directors’ service contracts are as follows:
Notice Period
Executive Director Position Effective date of contract From Company From Director
Nathaniel Rothschild Executive Chairman 1 December 2015 6 months 6 monthsDaren Morris Chief Financial Officer 8 June 2015 6 months 6 months
Letters of appointment are provided to the Non-Executive Directors. Non-executive directors have letters of appointment effective for a period of three years. Non-Executive Directors’ letters of appointment are available to view at the company’s registered office.
Directors’ letters of appointment and the unexpired period of their appointments (where appropriate after extension by re-election) are set out below:
Non-Executive Director Date of letterUnexpired term as at 2 April 2017
Date of Appointment/Last reappointment at AGM Notice Period
Robert Beveridge 15 April 2015 12 months 15 April 2015 3 monthsAdrian Chamberlain 16 June 2016 27 months 16 June 2016 3 monthsDean Moore 18 April 2017 n/a n/a 3 months
Payment policy on exit and / or change of controlThe Company’s Policy is to limit any payment made to a departing Director to contractual arrangements and to honour any pre-established commitments. As part of this process, the Committee will take into consideration the Executive Director’s duty to mitigate their loss.
If employment is terminated by the Company, the departing Executive Director may have a legal entitlement (under statute or otherwise) to certain payments, which would be met. In addition, the Committee retains discretion to settle any other amounts reasonably due to the Executive Director, for example to meet the legal fees incurred by the Executive Director in connection with the termination of employment, where the Company wishes to enter into a settlement agreement (as provided for below) and the individual must seek independent legal advice.
Volex plc
Annual Report and Accounts 2017 Stock code: VLX
42
Directors’ Remuneration Report continued
Volex AR2017 Front.indd 42 22/06/2017 11:58:28

25431.02 22 June 2017 4:31 PM Proof 8
In certain circumstances, the Committee may approve new contractual arrangements with departing Executive Directors including (but not limited to) settlement, confidentiality, restrictive covenants and/or consultancy arrangements. These will be used sparingly and only entered into where the Committee believes that it is in the best interests of the Company and its shareholders to do so.
In addition to the contractual provisions regarding payment on termination set out above, the table below summarises how the awards under the annual bonus and PSP are typically treated in different leaver scenarios and a change of control. Whilst the Committee retains overall discretion on determining ‘good leaver’ status, it typically defines a ‘good leaver’ in circumstances such as injury or disability, death, redundancy, retirement with the consent of the company or any other reason as the Committee decides. Final treatment is subject to the Committee’s discretion.
Event Timing of vesting / award Calculation of vesting / payment
Annual bonus
‘Good leaver’ Paid at the same time as continuing employees. Eligible for an award to the extent that performance targets are satisfied and the award is pro-rated for the proportion of the financial year served.
‘Bad leaver’ No annual bonus payable. Not applicable.
Change of control Generally paid immediately on the effective date of change of control, with Committee’s discretion to treat otherwise.
Eligible for an award to the extent that performance targets are satisfied up to the change of control, subject to Remuneration Committee discretion, and the award is pro-rated for the proportion of the financial year served to the effective date of change of control.
Deferred bonus
‘Good leaver’ Continue until the normal vesting date or earlier, at the discretion of the Committee. In the event of death of a participant, the award would vest immediately.
Outstanding awards vest in full.
‘Bad leaver’ Outstanding awards are forfeited. Not applicable.
Change of control Vest immediately on the effective date of change of control.
Outstanding awards vest in full.
PSP
‘Good leaver’ Continue until the normal vesting date or earlier, at the discretion of the Committee. In the event of death of a participant, the award would vest immediately.
Outstanding awards vest to the extent the performance conditions are satisfied and the awards are pro-rated to reflect the length of the vesting period served unless the Board decides otherwise. In the event of the death of a participant during the performance period, the award would vest in full.
‘Bad leaver’ Outstanding awards are forfeited. Not applicable.
Change of control Vest immediately on the effective date of change of control.
Outstanding awards vest subject to the satisfaction of performance conditions as at the effective date of change of control, subject to Remuneration Committee discretion, and the award is pro-rated for the proportion of the vesting period served to the effective date of change of control unless the Board decides otherwise.
External AppointmentsWith the approval of the Board in each case, and subject to the overriding requirements of the Group, Executive Directors may act as Non-Executive Directors to other companies and retain any fees received.
43Volex plc
www.volex.com GOVERNANCE
Volex AR2017 Front.indd 43 22/06/2017 16:31:34

25431.02 22 June 2017 4:31 PM Proof 8
Annual Report on RemunerationThe following section provides details of how the remuneration policy was implemented during the year.
Remuneration Committee membership in FY2017The Committee met five times during the year under review. Attendance by individual Committee members at meetings is detailed below.
Committee member Member throughout 2016/17 Number of meetings attended
Robert Beveridge Yes 5Adrian Chamberlain1 No 3Martin Geh2 No 2
1 appointed on 16 June 2016.2 resigned on 16 June 2016.
During the year, the Committee sought internal support from the Executive Chairman and Chief Financial Officer who attended Committee meetings by invitation from the Chairman, to advise on specific questions raised by the Committee and on matters relating to the performance and remuneration of senior managers. No individuals are involved in decisions relating to their own remuneration. The assistant to the Company Secretary attended each meeting as Secretary to the Committee.
Agenda during FY2017The agenda during FY2017 included:
• Approval of the FY2016 Directors’ remuneration report;
• Evaluation of PSP proposals;
• Review of Executive Directors’ shareholdings;
• Consideration of advisory bodies’ and institutional investors’ current guidelines on executive compensation;
• Review and ratification of Remuneration Policy and remuneration packages for Directors for FY18, incorporating institutional investor feedback; and
• Evaluation of proposal for FY2017 annual bonus plan.
AdvisersIn undertaking its responsibilities, the Committee seeks independent external advice as necessary. To this end, for the year under review, the Committee continued to retain the services of Kepler, a brand of Mercer (‘Kepler’) as the principal external advisers to the Committee. The Committee evaluates the support provided by its advisers annually and is comfortable that the Kepler team provides independent remuneration advice to the Committee and does not have any connections that may impair independence.
The Committee continually assesses ongoing advice provided by its advisers on remuneration matters.
The fees paid to advisers in respect of work carried out for the year under review are shown in the table below:
Company Service Fee
Kepler1 Remuneration Committee support £4,175
1 Fees received are on the basis of time and materials.
Summary of shareholder voting at the FY2016 AGMThe table below shows the results of the vote on the advisory FY2016 Remuneration Report at the AGM on 26 July 2016 and the binding vote on the Remuneration Policy at the 18 July 2014 AGM. It is the Remuneration Committee’s policy to consult with major shareholders prior to any major changes to its Executive Directors’ remuneration structure.
FY16 Remuneration Report Remuneration Policy
Total number of votes
% of votes cast
Total number of votes
% of votes cast
For (including discretionary) 55,587,021 99.80% 48,759,076 98.40%Against 93,599 0.20% 777,929 1.60%Total votes cast (excluding withheld1 votes) 55,680,620 100% 49,537,005 100%Votes withheld 5,473,838 148,284Total votes cast (including withheld votes) 61,154,458 49,685,289
1 A withheld vote is not a vote in law and is not counted in the calculation of the proportion of votes cast for and against a resolution.
Volex plc
Annual Report and Accounts 2017 Stock code: VLX
44
Directors’ Remuneration Report continued
Volex AR2017 Front.indd 44 22/06/2017 16:31:34

25431.02 22 June 2017 11:48 AM Proof 8
Single figure of Executive Director remuneration (audited)The table below sets out a single figure for the total remuneration received by each Executive Director for the year ended 02 April 2017 and the prior year:
Name YearSalary
(£)Benefits1
(£)Pension2
(£)
Cashannual bonus3
(£)PSP4
(£)
Other (severance)5
(£)
Deferred annual bonus
(restricted shares)3
(£)Total
(£)
Nathaniel Rothschild 2017 £241,665 – – – – – £150,000 £391,6652016 £47,105 – – – – – £47,105
Daren Morris 2017 £300,000 £7,209 £60,030 £100,000 – – £50,000 £517,2392016 £333,212 £3,917 £48,922 – – – – £386,051
Christoph Eisenhardt 2017 – – – – – – – –2016 £211,575 £35,298 £42,315 – – £180,683 – £469,871
1 Taxable value of benefits received in the year by Executives includes healthcare and life assurance.2 Pension: During the year, Daren Morris participated in a money purchase scheme into which the Company contributed 20% of salary.3 Cash annual bonus: The FY2017 targets were partially met and a 50% of maximum bonus was awarded. In respect of Daren Morris, one-third of the bonus was
deferred into shares for one year. In respect of Nathaniel Rothschild, one hundred per cent of his bonus was deferred into shares for one year. No bonuses were payable in respect of the FY2016 annual bonus plan. Details can be found on page 46 of this report.
4 None of the Executive Directors incumbent in the relevant years were party to PSPs that vested in the year.5 During the prior year Christoph Eisenhardt was provided with a severance payment, details of which can be found on page 47 of this report.
Single figure of Non-Executive Director remuneration and non-executive director fees (Audited)The table below sets out a single figure for the total remuneration received by each Non-Executive Director for the year ended 02 April 2017 and the prior year:
Non-Executive Director YearBase fee
(£)Committee fee
(£)Additional fee
(£)Benefits in kind
(£) Total
Robert Beveridge 2017 35,700 6,800 – – 42,5002016 40,787 7,769 – – 48,556
Adrian Chamberlain 2017 26,621 5,071 – – 31,6922016 – – – – –
Martin Geh 2017 10,500 2,000 – – 12,5002016 42,000 8,000 – 432 50,432
Karen Slatford 2017 – – – – –2016 83,333 – – 1,135 84,468
Geraint Anderson1 2017 – – – – –2016 20,000 5,000 29,850 4,143 58,993
1 Following the resignation of Christoph Eisenhardt as Group Chief Executive Officer, Geraint Anderson became interim Chief Executive Officer. The additional fee shown in the table above relates to the period as interim CEO.
The Non-Executive Directors are not eligible for bonuses, retirement benefits and cannot participate in any share scheme operated by the Company. The base fees during the year and for FY2018 (effective from the date of the AGM) are:
Fee1
FY2018 FY20172
Non-Executive Director base fee £50,000 £42,000Senior Independent Director fee £10,000 –Committee Chairman additional fee £10,000 £8,000
1 Remuneration comprises an annual fee for acting as a Non-Executive Director of the Company. Additional fees are paid to Non-Executive Directors in respect of service as Chairman of the Audit, Remuneration and CSR Committees.
2 During the year the Non-Executive Directors agreed to reduce their fees to £40,000 per annum including a fee to Chair one committee each.
45Volex plc
www.volex.com GOVERNANCE
Volex AR2017 Front.indd 45 22/06/2017 11:58:28

25431.02 22 June 2017 11:48 AM Proof 8
Incentive outcomes for the year ended 02 April 2017Annual bonus in respect of FY2017 performanceFor FY2017, the maximum bonus potential for the Executive Directors was set at 100% of basic annual salary and was 50% based on achieving an Operating Profit target and 50% on achieving a Return on Capital Employed.
The performance against the criteria as defined determined that bonuses would be earned under the annual bonus plan at the level of 50% of maximum. The Remuneration Committee has decided to exercise its discretion and require that one-third of the annual bonus for Executive Directors is deferred into shares for a period of one year. Nathaniel Rothschild has agreed to defer 100% of his bonus into shares.
Annual bonus in respect of FY2015 and FY2016 performanceThe targets included in the FY2015 bonus plan were not met and as a result no bonus payments were paid.
The targets included in the FY2016 bonus plan were not met and as a result no bonus payments were paid.
Annual bonus target for FY2018 performanceCorporate targets set by the Committee require Executive Directors to deliver significant stretch performance. The Committee has taken the decision to publish performance targets prospectively, for FY2018 targets see page 49.
PSP SchemesNo PSP awards held by the executive directors were due to vest based on performance periods ending in the year under review.
Scheme Interests awarded in FY2017 (AUDITED)The following awards were granted during the year under the PSP:
PSP Award
Date of grantNumber of
sharesMarket price at date of award Face value
Executive Chairman 1 December 2016(1) 600,000 43.0p £258,000CFO 1 December 2016(1) 600,000 43.0p £258,000
1 The awards will vest on the third anniversary of the grant date. The performance condition is 50% based on TSR outperformance of the constituents of the FTSE ASX index and 50% based on cumulative operating profit. The three-year performance period over which operating profit performance will be measured began on 4 April 2016 and will end on 31 March 2019. The three-year performance period over which TSR performance will be measured began on 4 April 2016 and will end on 31 March 2019.
The FY2017 award to the Executive Chairman and to the CFO amounts to 86% of their respective base salaries.
There is no retest provision. In addition, for any shares to vest on TSR, the Committee must satisfy itself that the recorded TSR is a genuine reflection of the underlying business performance of Volex.
A summary of performance measures, weightings and targets for awards granted during the year is provided below:
Performance condition
TSR (share price growth plus reinvested dividends) relative to companies in the
FTSE ASX IndexCumulative operating profit
Weighting 50% 50%
Level of performance
Company’s TSR outperformance of the index % of award vesting1 % of award vesting1
Threshold Index 30% 30%Maximum Index + 15% p.a. 100% 100%
1 There is straight-line vesting between the ‘threshold’ and ‘maximum’ performance levels.
Specific targets for operating profit are deemed to be commercially sensitive and will not be published until such time that the Committee is confident there will be no adverse impact on the Company of such disclosure. At this time the Committee believes that disclosure of targets within three years of the determination of bonuses is appropriate (i.e. not later than the 2020 Directors’ Remuneration Report).
Volex plc
Annual Report and Accounts 2017 Stock code: VLX
46
Directors’ Remuneration Report continued
Volex AR2017 Front.indd 46 22/06/2017 11:58:29
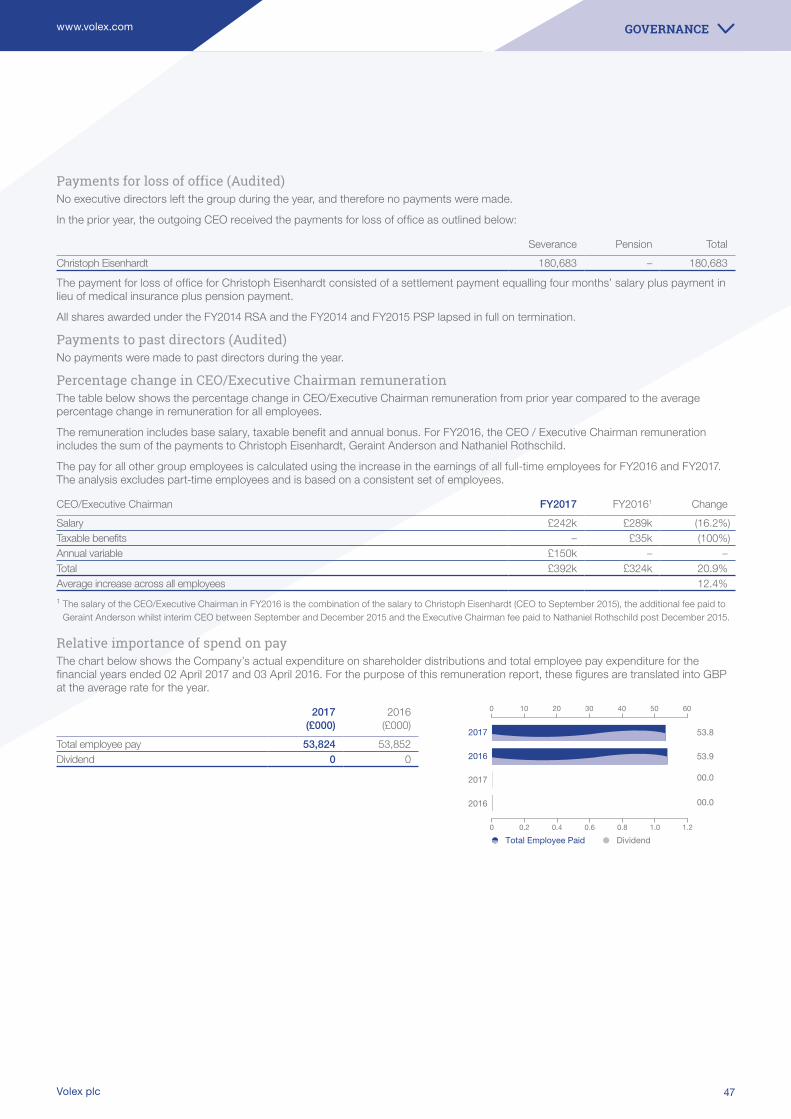
25431.02 22 June 2017 11:48 AM Proof 8
Payments for loss of office (Audited)No executive directors left the group during the year, and therefore no payments were made.
In the prior year, the outgoing CEO received the payments for loss of office as outlined below:
Severance Pension Total
Christoph Eisenhardt 180,683 – 180,683
The payment for loss of office for Christoph Eisenhardt consisted of a settlement payment equalling four months’ salary plus payment in lieu of medical insurance plus pension payment.
All shares awarded under the FY2014 RSA and the FY2014 and FY2015 PSP lapsed in full on termination.
Payments to past directors (Audited)No payments were made to past directors during the year.
Percentage change in CEO/Executive Chairman remunerationThe table below shows the percentage change in CEO/Executive Chairman remuneration from prior year compared to the average percentage change in remuneration for all employees.
The remuneration includes base salary, taxable benefit and annual bonus. For FY2016, the CEO / Executive Chairman remuneration includes the sum of the payments to Christoph Eisenhardt, Geraint Anderson and Nathaniel Rothschild.
The pay for all other group employees is calculated using the increase in the earnings of all full-time employees for FY2016 and FY2017. The analysis excludes part-time employees and is based on a consistent set of employees.
CEO/Executive Chairman FY2017 FY20161 Change
Salary £242k £289k (16.2%)Taxable benefits – £35k (100%)Annual variable £150k – –Total £392k £324k 20.9%Average increase across all employees 12.4%
1 The salary of the CEO/Executive Chairman in FY2016 is the combination of the salary to Christoph Eisenhardt (CEO to September 2015), the additional fee paid to Geraint Anderson whilst interim CEO between September and December 2015 and the Executive Chairman fee paid to Nathaniel Rothschild post December 2015.
Relative importance of spend on payThe chart below shows the Company’s actual expenditure on shareholder distributions and total employee pay expenditure for the financial years ended 02 April 2017 and 03 April 2016. For the purpose of this remuneration report, these figures are translated into GBP at the average rate for the year.
2017(£000)
2016(£000)
Total employee pay 53,824 53,852Dividend 0 0
53.82017
2016
2017
2016
53.9
00.0
00.0
Total Employee Paid Dividend
0 10 20 30 40 50 60
0 0.2 0.4 0.6 0.8 1.0 1.2
47Volex plc
www.volex.com GOVERNANCE
Volex AR2017 Front.indd 47 22/06/2017 11:58:29

25431.02 22 June 2017 11:48 AM Proof 8
Seven-year TSR performance review and CEO single figureThe following graph charts the TSR of the Company and the FTSE All Share and FTSE All Share Electronic and Electrical Equipment indices over the seven year period from April 2010 to March 2017. In the opinion of the Directors, these indices are the most appropriate against which the total shareholder return of Volex should be measured. The table below details the single figure remuneration for the CEOs and Executive Chairman over the same period.
0
200
400
600
800
1000
1200
1400
1600
1800
Mar-10 Mar-11 Mar-12 Mar-13 Mar-14 Mar-15 Mar-16 Mar-17
Volex
FTSE All Share
FTSE All Share Electronic & Electrical Equipment
Source: Bloomberg
Note: TSR is calculated on a common currency basis.
2011 2012 2013 20141 2015 20163 2017
CEO / Executive Chairman single figure of remuneration (£’000) 472 481 1,667 1,654 906 547 392Annual bonus pay-out(% of maximum) 0% 0% 0% 0%2 76%2 0% 50%PSP vesting(% of maximum) 0% 0% 100% 0% 0% 0% 0%
1 The comparison of CEO remuneration is made complex by the change in CEO during the year. Christoph Eisenhardt replaced Ray Walsh on 1 July 2013. For the purposes of the table above, the FY2014 CEO remuneration was calculated on a pro-rata basis based on three months of Ray Walsh up to 30 June 2013 and nine months of Christoph Eisenhardt from 1 July 2013.
2 Note that no bonus was payable in FY2014 as the Committee linked payment to revenue performance in the first quarter of FY2015. These targets were met. No additional bonuses was payable in respect of the FY2015 annual bonus plan.
3 The comparison of CEO remuneration is made complex by the change in CEO during the year. Christoph Eisenhardt resigned in September 2015 and the position was temporarily filled by Geraint Anderson as interim CEO before the position of CEO was replaced by an Executive Chairman, Nathaniel Rothschild. The single figure above is an aggregate of the amounts due to each individual during their time in the relevant role.
Implementation of Executive Director Remuneration Policy for FY 2018Base salaryMarket positioning of base salary is approached on an individual basis, taking account of advice received from the Committee’s independent advisors on the rates of salary for similar roles in selected groups of comparable companies and the individual performance and experience of each Executive. The aim is for base salary to be set with reference to the market median, dependent on the Committee’s view of individual and Group performance.
The Committee reviewed salaries during the year and agreed that there would be an increase approximately in line with UK inflation of 2.1%.
Executive Director
Base salary in place prior to
review1
Base salary effective from 1 April 2017
Percentage increase from
1 April 2017
Nathaniel Rothschild £300k £306.3k 2.1%Daren Morris £300k £306.3k 2.1%
1 During the year the remuneration committee reviewed the salary of Nathaniel Rothschild and increased his base salary from £125,000 to £300,000 to reflect his seniority and level of day-to-day involvement in the business. The Remuneration Committee consulted with the Company’s major shareholders in respect of this increase.
A salary increase averaging 2.1% across the UK employee population Group was awarded at the annual pay review.
Volex plc
Annual Report and Accounts 2017 Stock code: VLX
48
Directors’ Remuneration Report continued
Volex AR2017 Front.indd 48 22/06/2017 11:58:30

25431.02 22 June 2017 11:48 AM Proof 8
PensionThe Chief Financial Officer will continue to receive a pension contribution of 20% of salary. The Executive Chairman does not receive a pension benefit.
Annual bonus The annual bonus for FY2018 will operate on the criteria set out in the Policy. The Committee has approved a maximum annual bonus opportunity of 100% of salary for the Executive Directors. At the discretion of the Committee up to 50% of any annual bonus award will be deferred into Volex shares, with vesting deferred for one year.
As outlined above, going forward, the Committee has committed to disclose targets on a prospective basis. For FY2018, the annual bonus will be based 25% on Underlying Operating Profit, 25% on Return on capital Employed, 30% on Revenue and 20% on other qualitative measures. Proposed target levels have been set to be challenging relative to the 2018 business plan and are as follows:
Threshold (20%)
Maximum (100%)
Group Operating Profit $10.0m $11.5mGroup Revenue $320.0m $327.5mGroup Return on Capital Employed 21% 25%
PSPThe Executive Directors will receive an award of up to 100% of salary. Final vesting of any grant will depend on the achievement of three-year relative TSR outperformance vs. the FTSE ASX Index and cumulative operating profit, as follows:
Performance condition
TSR (share price growth plus reinvested dividends) relative to companies in the
FTSE ASX IndexCumulative operating profit
Weighting 50% 50%
Level of performance
Company’s TSR outperformance of the index % of award vesting1 % of award vesting1
Threshold Index 30% 30%Maximum Index + 15% p.a. 100% 100%
1 There is straight-line vesting between the ‘threshold’ and ‘maximum’ performance levels.
Specific targets for the Operating Profit are deemed to be commercially sensitive and will not be published until such time that the Committee is confident there will be no adverse impact on the Company of such disclosure. At this time the Committee believes that disclosure of targets within three years of vesting the determination of vesting, i.e. not later than the 2021 Directors’ Remuneration Report, is appropriate.
Awards will vest three years from the grant date. Further details of the grant date and number of interests awarded will be disclosed in the 2018 Annual Report on Remuneration.
Chairman and Non-Executive Director feesThe Board determined that Non-Executive remuneration should be increased for FY2018, and the increase will take affect after the AGM. Fee levels will continue to be reviewed on an annual basis.
FY17 fees FY18 fees
Base feesChairman N/a N/aNon-Executive Director £42k £50kAdditional feesAudit Committee Chair £8k £10kRemuneration Committee Chair £8k £10k
49Volex plc
www.volex.com GOVERNANCE
Volex AR2017 Front.indd 49 22/06/2017 11:58:30

25431.02 22 June 2017 4:02 PM Proof 8
Directors’ interests (Audited)The table below shows the Directors’ interests in shares and the extent to which Volex’s shareholding guidelines are achieved. There have been no changes in the Directors’ interests as set out in the table since 02 April 2017.
Number of shares held as at 02 April
2017 (or date of resignation)
Currentshareholding
(% salary / fees)
Shareholding1
guideline(as % of salary) Guideline met
Nathaniel Rothschild2 23,015,771 3,126% 100% YesDaren Morris 375,000 51% 100% NoBob Beveridge 30,000 0% N/a N/aAdrian Chamberlain – 0% N/a N/aMartin Geh – 0% N/a N/a
1 The shareholding guidelines were approved by the Remuneration Committee in March 2014. The guidelines require the Executive Directors to acquire over time (to the extent they have not already done so) and maintain an ownership level of holdings of shares in Volex plc. There is no time limit defined for achieving the target level. The Executive Directors must (unless a waiver is obtained from the Remuneration Committee) retain a minimum of 50% of net shares (i.e. after statutory deductions) acquired under the relevant Employee Equity Plans until the relevant ownership level is met.
2 Nathaniel Rothschild’s shareholding is held directly and through NR Holdings Limited.
The table below shows the Executive and Non-Executive Directors’ interests in shares which includes all shares owned beneficially together with those interests in shares which have vested and are no longer subject to deferral or performance conditions and may be included as an interest in shares under Volex’s shareholding guidelines plus those shares and options over which future performance conditions remain.
Shares owned outright
Vested but unexercised
Not subject to performance
Subject to performance1 Total
Nathaniel Rothschild 23,015,771 – – 1,256,168 24,271,939Daren Morris 375,000 – – 1,619,057 1,994,057Bob Beveridge 30,000 – – – 30,000
1 Post year end Nathaniel Rothschild has been awarded 352,941 deferred shares and Daren Morris 117,647 deferred shares as part of the FY17 bonus plan.
Volex plc
Annual Report and Accounts 2017 Stock code: VLX
50
Directors’ Remuneration Report continued
Volex AR2017 Front.indd 50 22/06/2017 16:02:50

25431.02 22 June 2017 11:48 AM Proof 8
Directors’ interests in shares and options under Volex PSP, RSP and LTISDetails of the Directors’ interest in long-term incentive schemes are set out below. Details, including explanation of movements during FY2017 are set out on page 46 of this Remuneration Report.
Volex Group plc Performance Share Plan (PSP)Number of shares
subject to PSP options held at 03
April 2016
Number of shares subject to PSP
options granted during FY2017
Number of shares subject to PSP
options exercised during FY2017
Number of shares subject to PSP options lapsed during FY2017
Number of shares subject to PSP options held
at 02 April 2017
Exercise price of shares subject to
PSP options(£)
Nathaniel Rothschild 656,168 600,000 – – 1,256,168 0.25Daren Morris 1,019,057 600,000 – – 1,619,057 0.25
External appointmentsDuring FY2017, Nathaniel Rothschild was a Non-Executive Director of Genel Energy plc. His director fees from Genel Energy plc, which he retained were £57,978.
The directors’ remuneration report was approved by the board of directors on 8 June 2017 and signed on its behalf by:
Adrian Chamberlain Chairman of the Remuneration Committee 8 June 2017
51Volex plc
www.volex.com GOVERNANCE
Volex AR2017 Front.indd 51 22/06/2017 11:58:31

25431.02 22 June 2017 11:48 AM Proof 8
Statement of the Directors’ responsibilitiesThe Directors of Volex plc (the ‘Company’) are responsible for preparing the Annual Report, the Directors’ Remuneration Report and the financial statements in accordance with applicable law and regulations.
Company law requires the Directors to prepare financial statements for each financial year. Under that law the Directors have prepared the Group and parent Company financial statements in accordance with International Financial Reporting Standards (‘IFRSs’) as adopted by the European Union. In preparing these financial statements, the Directors have also elected to comply with IFRSs, issued by the International Accounting Standards Board (‘IASB’). Under company law the Directors must not approve the financial statements unless they are satisfied that they give a true and fair view of the state of affairs of the Group and the Company and of the profit or loss of the Company and Group for that period. In preparing these financial statements, the Directors are required to:
• Select suitable accounting policies and then apply them consistently;
• Make judgements and accounting estimates that are reasonable and prudent;
• State whether applicable IFRSs as adopted by the European Union and IFRSs issued by IASB have been followed, subject to any material departures disclosed and explained in the financial statements; and
• Prepare the financial statements on the going concern basis unless it is inappropriate to presume that the Company will continue in business.
The Directors are responsible for keeping adequate accounting records that are sufficient to show and explain the Company’s transactions and disclose with reasonable accuracy at any time the financial position of the Company and the Group and enable them to ensure that the financial statements and the Directors’ remuneration report comply with the Companies Act 2006 and, as regards the Group financial statements, Article 4 of the IAS Regulation. They are also responsible for safeguarding the assets of the Company and the Group and hence for taking reasonable steps for the prevention and detection of fraud and other irregularities.
The Directors are responsible for the maintenance and integrity of the Company’s website. Legislation in the United Kingdom governing the preparation and dissemination of financial statements may differ from legislation in other jurisdictions.
The Directors consider that the Annual Report and Accounts, taken as a whole, is fair, balanced and understandable and provides the information necessary for shareholders to assess the Company’s performance, business model and strategy.
Each of the Directors, whose names and functions are listed on page 26 confirm that, to the best of their knowledge:
• The Group and Company financial statements, which have been prepared in accordance with IFRSs as adopted by the EU, give a true and fair view of the assets, liabilities, financial position and profit or loss of the Group;
• The Strategic Report, on pages 04 to 25, includes a fair review of the development and performance of the business and the position of the Group, together with a description of the principal risks and uncertainties that it faces; and
• The Annual Report and financial statements, taken as a whole, are fair, balanced and understandable and provide the information necessary for shareholders to assess the Group’s performance, business model and strategy.
By order of the Board
Nathaniel RothschildExecutive Chairman
Daren Morris Chief Financial Officer and Company Secretary
Volex plc
Annual Report and Accounts 2017 Stock code: VLX
52
Directors’ Report
Volex AR2017 Front.indd 52 22/06/2017 11:58:32

25431.02 22 June 2017 11:48 AM Proof 8
The Directors of the Company present their Annual Report for the year ended 2 April 2017. Certain information required for disclosure in this report is provided in other appropriate sections of the Annual Report and Accounts. These include the Corporate Governance Statement, the Directors’ Remuneration Report, the Strategic Report and the financial statements together with the notes to those financial statements and accordingly these are incorporated into this report by reference.
Results and dividendResults for the year ended 2 April 2017 are set out in the consolidated income statement on page 64.
The Board is not recommending payment of a final dividend for the 52 weeks ended 2 April 2017 (2016: nil).
Post balance sheet eventsThe Group has successfully completed an extension of its senior credit facility to June 2019 (previously due to expire in June 2018). As part of this extension, Clydesdale Bank plc exited the syndicate. Lloyds Banking Group plc and HSBC Bank plc have both retained their positions and credit offering with the size of the facility duly reducing from $45.0 million to $30.0 million. Given the cash generation in the year, management is confident that the Group can operate within this facility level.
On 12 April 2017, the Group entered into a shareholder agreement with Kepler Signaltek Limited to establish a new joint venture and acquired 26.09% of the voting shares of the company for consideration of $300,000. This amount was paid on 19 April 2017. A commitment to subscribe for $1,700,000 of preference shares which accrue interest at 10% per annum was also made with $700,000 due to be paid on 1 August 2017 and $1,000,000 on 1 April 2018. The preference shares are redeemable at any point after April 2019 and before April 2022. Kepler Signaltek Limited will manufacture both power cords and high speed data cables exclusively for the healthcare sector and provides Volex with access to an enhanced healthcare product offering.
DirectorsThe Directors who were in office during the year and up to the date of signing the financial statements are as follows:
Executive Director Non-Executive Directors
Nathaniel Rothschild Robert BeveridgeDaren Morris Adrian Chamberlain1
Martin Geh2
Dean Moore3
1 Appointed Non-Executive Director on 16 June 20162 Resigned as Non-Executive Director on 16 June 20163 Appointed as Non-Executive Director on 18 April 2017
Biographical details of the Directors who served on the Board and their dates of appointment are set out on page 26.
Powers of DirectorsThe Directors may exercise all the powers of the Company, subject to any restrictions in the Company’s Articles of Association, any relevant legislation and any directions given by the Company by passing a special resolution at a general meeting.
In particular, the Directors may exercise all the powers of the Company to borrow money, subject to the limitation that the aggregate amount of all moneys borrowed by the Group and owing to persons outside the Group, shall not, without the sanction of an ordinary resolution of the Company, exceed an amount equal to three times the aggregate of the Group’s capital and reserves calculated in the manner prescribed by the Company’s Articles of Association.
Appointment and replacement of DirectorsThe Company’s approach to the appointment and replacement of Directors is governed by its Articles of Association (together with relevant legislation).
Directors shall be no less than three and no more than 15 in number. Directors may be appointed by the Company by ordinary resolution or by the Board of Directors.
At each Annual General Meeting, all Directors who (i) were appointed by the Board since the last Annual General Meeting, (ii) held office at the time of the two preceding Annual General Meetings and who did not retire at either of them, or (iii) have held office (other than employment or executive office) for a continuous period of nine years or more, shall automatically retire.
At the meeting at which the Director retires, the members may pass an ordinary resolution to fill the office being vacated by electing the retiring Director or some other person eligible for appointment to that office. In default, the retiring Director shall be deemed to have been elected or re-elected (as the case may be) unless (i) it is expressly resolved at the meeting not to fill the vacated office or the resolution of such election or re-election is put to the meeting and lost, or (ii) such Director has given notice that he or she is unwilling to be elected or re-elected, or (iii) the procedural requirements set out in the Company’s Articles of Association are contravened.
The Company may, by ordinary resolution, remove any Directors before the expiration of his or her term of office.
As set out in the Company’s Articles of Association, there are also circumstances where a Director will immediately cease to hold office. These circumstances include where he or she is prohibited by law from being or acting as a Director or where a Director has been made bankrupt.
53Volex plc
www.volex.com GOVERNANCE
Volex AR2017 Front.indd 53 22/06/2017 11:58:32

25431.02 22 June 2017 11:48 AM Proof 8
Directors’ indemnities and insuranceIn accordance with the Companies Act 2006 and the Company’s Articles of Association, the Company has purchased Directors and Officers Liability Insurance. The indemnity was in force throughout the last financial year and is currently in force at the date of this report. The Company reviews its insurance policies on an annual basis in order to satisfy itself that its level of cover remains adequate.
Directors’ share interestsThe number of Ordinary shares of the Company in which the Directors are beneficially interested at 2 April 2017 (or date of resignation) is set out in the Directors Remuneration Report on page 50.
Articles of AssociationAny amendments to the Articles of Association of the Company may be made by special resolution of the shareholders.
Share capitalDetails of the Company’s share capital are set out in Note 22 to the financial statements. The Company’s share capital consists of one class of Ordinary shares which do not carry rights to fixed income. As at 2 April 2017, there were 90,251,892 ordinary shares of 25p each in issue.
A new authority to allot shares will be sought at the forthcoming Annual General Meeting.
Voting rightsOrdinary shareholders are entitled to receive notice and to attend and speak at general meetings. Each shareholder present in person or by proxy (or by duly authorised corporate representative) shall, on a show of hands, have one vote. On a poll, each shareholder present in person or by proxy shall have one vote for each share held.
Restrictions on transfer of sharesOther than the general provisions of the Articles of Association (and prevailing legislation) there are no specific restrictions on the size of a holding or on the transfer of the Ordinary shares.
The Directors are not aware of any agreements between the Company’s shareholders that may result in the restriction of the transfer of securities or on voting rights. No shareholder holds securities carrying any special rights or control over the Company’s share capital.
Significant shareholdersThe Company had been advised of the following notifiable direct and indirect interest in 3% or more of its issued share capital as at 22 May 2017.
Notification received from:Ordinary
shares% of total
voting rights
NR Holdings Limited 23,015,771 25.50Ruffer LLP 17,812,372 19.74Artemis Investment Management 4,060,000 4.50Herald Investment Management 3,730,666 4.13GoldenPeaks Capital 3,627,761 4.02River and Mercantile Asset Management 3,130,344 3.47UBS Wealth Management 3,025,058 3.35Quaero Capital 2,982,788 3.30Standard Life Investments 2,765,869 3.06
Authority to purchase own sharesThe Company was authorised by shareholder resolution at the 2016 Annual General Meeting to purchase up to 10% of its issued share capital. No shares were purchased pursuant to this authority during the year. A resolution to renew this authority will be proposed at the forthcoming Annual General Meeting. Under this authority, any shares purchased will either be cancelled resulting in a reduction of the Company’s issued share capital or held in treasury.
Employee share schemesThe Company does not have any employee share schemes with shares which have rights with regard to the control of the Company that are not exercisable directly by the employees.
Significant agreements / change of controlThe Company is a party to a revolving credit facility in which the counterparties can determine whether or not to cancel the agreement where there has been a change of control of the Company.
Details of the Directors’ service contracts can be found in the Directors’ Remuneration Report on page 42.
Future developmentsThe development of the business is detailed in the Strategic Report on pages 04 to 25.
Volex plc
Annual Report and Accounts 2017 Stock code: VLX
54
Directors’ Report continued
Volex AR2017 Front.indd 54 22/06/2017 11:58:32

25431.02 22 June 2017 11:48 AM Proof 8
Research and developmentThe Company’s research and development activities are focused on driving innovation throughout the product portfolio, to enable it to deliver new or enhanced customer-specific connection solutions. We have continued to recruit design and development expertise.
EmployeesThe Company’s disclosures on employee policies and involvement can be found in the Strategic Report on page 24.
Political donationsThe Company made no political donations during the year.
Greenhouse gas emissionsThe Directors are required to provide details on greenhouse gas emissions in their report; such disclosures are made within the Corporate and Social Responsibility Report on pages 24 to 25.
Financial risk managementThe Company’s objectives and policies on financial risk management including information on the exposure of the Company to customer concentration, commodity price fluctuations, foreign exchange rates, pricing, credit, liquidity and cash flow risks are set out in note 29 to the accounts and in the Group Risk Management section on pages 20 to 23.
Going Concern statementThe considerations made by the Directors with regards to Going Concern are set out in the Financial Review on pages 18 to 19.
Having taken these into account, the Directors have, at the time of approving the financial statements, a reasonable expectation that the Company and the Group have adequate resources to continue in operational existence for at least 12 months from the date of these accounts. Accordingly, they continue to adopt the going concern basis in preparing the financial statements.
Overseas BranchesDuring the year the company established an overseas branch in Sweden.
Takeover directive disclosureThe Company has in issue, as at 8 June 2017, 90,251,892 fully paid-up shares of 25p each. The rights to these shares are set out in the Company’s articles of association. There are no restrictions on the transfer of these shares or their attached voting rights.
Details of significant shareholdings and as at 22 May 2017 are given on page 54.
No person holds shares with specific rights regarding control of the company.
The Company is not aware of any agreements among holders of securities known to the Company which may result in restrictions on the transfer of securities or voting rights.
Auditors and disclosure of information to auditorsEach of the persons who is a Director at the date of approval of this Annual Report confirms that:
• So far as the Director is aware, there is no relevant audit information of which the Company’s auditors are unaware; and
• The Director has taken all the reasonable steps that he ought to have taken as a Director in order to make himself aware of any relevant audit information and to establish that the Company’s auditors are aware of that information.
The above confirmation is given and should be interpreted in accordance with the provisions of Section 418 of the Companies Act 2006.
PricewaterhouseCoopers LLP has expressed their willingness to continue in office as auditors and a resolution seeking to reappoint them will be proposed at the forthcoming Annual General Meeting.
Annual General MeetingThe Company’s Annual General Meeting will be held on 25 July 2017. Details of the venue and the resolutions to be proposed are set out in a separate Notice of Annual General Meeting.
This report was approved by the Board of Directors of Volex plc and signed on its behalf by:
Daren Morris Chief Financial Officer and Company Secretary 8 June 2017
55Volex plc
www.volex.com GOVERNANCE
Volex AR2017 Front.indd 55 22/06/2017 11:58:32

25431.02 22 June 2017 11:48 AM Proof 8
Report on the financial statementsOur opinionIn our opinion:
• Volex Plc’s group financial statements and company financial statements (the “financial statements”) give a true and fair view of the state of the group’s and of the company’s affairs as at 2 April 2017 and of the group’s loss and the group’s and the company’s cash flows for the 52 week period (the “period”) then ended;
• the group financial statements have been properly prepared in accordance with International Financial Reporting Standards (“IFRSs”) as adopted by the European Union;
• the company financial statements have been properly prepared in accordance with IFRSs as adopted by the European Union and as applied in accordance with the provisions of the Companies Act 2006; and
• the financial statements have been prepared in accordance with the requirements of the Companies Act 2006 and, as regards the group financial statements, Article 4 of the IAS Regulation.
What we have auditedThe financial statements, included within the Annual Report and Accounts (the “Annual Report”), comprise:
• The Consolidated and Company statement of financial position as at 2 April 2017;
• The Consolidated income statement for the period then ended;
• The Consolidated statement of comprehensive income for the period then ended;
• The Consolidated and Company statement of cashflows for the period then ended;
• The Consolidated and Company statement of changes in equity for the period then ended; and
• The notes to the financial statements, which include a summary of significant accounting policies and other explanatory information.
Certain required disclosures have been presented elsewhere in the Annual Report, rather than in the notes to the financial statements. These are cross-referenced from the financial statements and are identified as audited.
The financial reporting framework that has been applied in the preparation of the financial statements is IFRSs as adopted by the European Union, and applicable law and, as regards the company financial statements, as applied in accordance with the provisions of the Companies Act 2006.
Our audit approach Overview
Materiality
Audit scope
Areasof focus
• Overall group materiality: $454,000 which represents 5% of current year profit before tax, interest, non-recurring items (as defined in note 4 to the financial statements) and share based payments.
• The group operates two main divisions, ‘Power Cords’ and ‘Cable Assemblies’. Our approach gives us sufficient coverage of both divisions.
• We conducted a full scope audit of 5 components and specified procedures on 2 components, which provided us with the following coverage: 78% of revenue, 68% of profit before tax, interest and non-recurring items and share based payments, 100% of non-recurring items, 81% of interest payable and over 72% of net assets. Furthermore, desktop reviews were performed on a further 14 components.
• We made visits to the manufacturing facilities in Batam, Shenzhen, Zhongshan, Tijuana and Bydgoszcz and the Volex sales office in Singapore. We also visited component audit teams in China, Poland, Mexico and Singapore and attended planning and clearance calls with all component teams.
Our specific areas of focus were:
• Going concern.
• Non-recurring items.
• Adequacy of the inventory provisions.
Volex plc
Annual Report and Accounts 2017 Stock code: VLX
56
Independent Auditors’ Report
Volex AR2017 Front.indd 56 22/06/2017 11:58:32

25431.02 22 June 2017 11:48 AM Proof 8
The scope of our audit and our areas of focusWe conducted our audit in accordance with International Standards on Auditing (UK and Ireland) (“ISAs (UK & Ireland)”).
We designed our audit by determining materiality and assessing the risks of material misstatement in the financial statements. In particular, we looked at where the directors made subjective judgements, for example in respect of significant accounting estimates that involved making assumptions and considering future events that are inherently uncertain. As in all of our audits we also addressed the risk of management override of internal controls, including evaluating whether there was evidence of bias by the directors that represented a risk of material misstatement due to fraud.
The risks of material misstatement that had the greatest effect on our audit, including the allocation of our resources and effort, are identified as “areas of focus” in the table below. We have also set out how we tailored our audit to address these specific areas in order to provide an opinion on the financial statements as a whole, and any comments we make on the results of our procedures should be read in this context. This is not a complete list of all risks identified by our audit.
Area of focus How our audit addressed the area of focus
Going concern
Going concern remained a key focus area during the FY17 audit of Volex plc. As discussed on page 17 of the Strategic report, the group faces challenges as a result of operating in a highly competitive market, pricing pressures and the lack of a diversified customer base, which have had a direct effect on revenue, profit margins, cash flow and bank covenant compliance in the year.
In June 2017, management renegotiated their senior credit facility, extending it to June 2019 with some amendments to existing covenants. The net cash position has improved but the challenges discussed above remain, potentially impacting future growth and cash flows.
Details of considerations made by management and the Audit Committee of the longer term viability of Volex plc are given on page 32 of the Annual Report.
Our audit of management’s going concern assessment focused on the assessment of their budgeted cash flows and the resultant ability to meet covenants. Management’s budgeted cash flows and our assessment were based on the new senior credit facility described on page 17.
We obtained the FY18 budget and FY19 forecast with cash flows for the period to 30 June 2018 and:
• Re-calculated the calculations of forecast compliance with financial covenants and cash flow headroom, and assessed the sensitivity of cash flows to changes in key inputs, in particular sales projections;
• Challenged the assumptions used in building the revenue and costs forecast by considering the historical accuracy of forecasts, latest information available in FY2018 and the latest customer trends. As part of this we discussed the budget and forecast with the Chief Financial Officer and the Group finance team. This also included the assessment of working capital assumptions in light of the FY2017 actuals and period 1 of FY2018. The results of these discussions were used to sensitise the cash flows as discussed above; and
• Considered the feasibility of the Directors’ plans to manage cash flows and working capital requirements, including potential mitigating actions in the event of under-performance against forecast. These included the ability of management to manage discretionary expenditure, stretch the working capital cycle and manage headcount and other associated costs.
Based on our work we have concluded that the directors’ use of the going concern basis in preparing the financial statements is appropriate.
57Volex plc
www.volex.com GOVERNANCE
Volex AR2017 Front.indd 57 22/06/2017 11:58:33

25431.02 22 June 2017 11:48 AM Proof 8
Area of focus How our audit addressed the area of focus
Non-recurring items
The Directors’ have classified $15.2m of net expenses as non-recurring in the Consolidated income statement, the disclosure of which they believe more accurately reflects the underlying position of the business.
The Directors have assessed the costs included in note 4 to be both one-off in nature and significant in size and have classified these as non-recurring in-line with their accounting policy in note 2.
These items primarily relate to costs incurred as a result of asset impairment, restructuring costs and associated consulting costs and provisions for onerous leases.
We focused on this area because of the magnitude of these items, and the impact that they have on the presentation of the underlying profit in comparison to the statutory measure of profit before tax. Non-recurring items are discussed in the Financial Review on page 17.
We obtained management’s detailed listing of non-recurring items and our procedures included the following:
• Testing that they met the group’s accounting policy for non-recurring items, as given on page 74, and applying professional scepticism as to the appropriateness of the classification of these items as non-recurring;
• For impairments, we assessed management’s calculations and assessed the reasonableness of the underlying assumptions. These included assessing forecasts in light of recent market and customer trade and considering whether assets have alternative resale value or uses within the group;
• For restructuring costs, we agreed a sample of costs to severance agreements or external invoices, focusing on the nature and origination of these costs. Management were consistent in their approach to the classification of non-recurring restructuring costs, only including costs for positions that were eliminated as part of the rationalisation or closure of facilities or operations;
• For consulting costs, we assessed whether the costs related to restructuring of the group’s manufacturing processes and hence were non- recurring in nature and agreed a sample of costs to invoice;
• For non-recurring items that were previously provided for, we traced all movements relating to these provisions, checking that they were either utilised or released against non-recurring items in the consolidated income statement. Items tested were appropriately accounted for; and
• We tested that the reconciliation to statutory measures as shown on page 81 is accurate.
Adequacy of the inventory provision
Volex plc has a material inventory balance ($36.0m) on the balance sheet which is primarily made up of raw materials and finished goods. $4.2m (10%) of inventory is provided for.
Volex maintains its inventory levels based on forecast demand volumes from customers. This poses an element of risk as products are customer specific and, for key customers, there is no legal obligation to purchase the inventory.
At year end, a material amount of slow moving inventory was on hand. Management have not provided for this inventory as the customer has confirmed that they intend to utilise the inventory in the foreseeable future. However, as discussed above, there is no legal obligation to purchase the inventory.
The group’s accounting policy, as described on page 73 is to provide for obsolete, slow moving or defective items where appropriate. Accordingly, there is a level of judgement in assessing the inventory provision.
Details of considerations made by management and the Audit Committee are given on page 35 of the Annual Report.
We assessed the adequacy of the inventory provision at material inventory locations and also assessed the provision at the consolidated group level. We attended inventory counts, remaining aware of any potentially slow moving or obsolete inventory. We also obtained and assessed management’s inventory provision schedule, comparing it to the group’s accounting policy and assessing management’s judgements.
The details of our work performed are as follows:
• We assessed the provisioning process and levels of provisions held against inventory, concluding that the current methodology remains appropriate.
• We tested the inventory ageing reports on a sample basis in order to place reliance on the group’s ageing report as a basis for provisions made.
• We attended physical inventory counts at all locations within scope.
We have considered the following in assessing management’s judgement not to provide for specifically identified slow moving inventory:
• We have reviewed the movement of the associated inventory balance in the year as the inventory is utilised.
• We have also reviewed the evidence to support the customer’s intention to purchase this inventory in the foreseeable future.
Volex plc
Annual Report and Accounts 2017 Stock code: VLX
58
Independent Auditors’ Report continued
Volex AR2017 Front.indd 58 22/06/2017 11:58:33

25431.02 22 June 2017 11:48 AM Proof 8
How we tailored the audit scopeWe tailored the scope of our audit to ensure that we performed enough work to be able to give an opinion on the financial statements as a whole, taking into account the geographic structure of the group, the accounting processes and controls, and the industry in which the group operates. We obtained the following coverage over the group: 78% of revenue, 68% of profit before tax, interest, non-recurring items and share based payments, 100% of non-recurring items, 81% of interest payable and over 72% of net assets.
The group is multinational with production facilities and sales offices around the world. The group consists of two main divisions, ‘Power Cords’ and ‘Cable Assemblies’, and within each division there are a number of reporting units that are consolidated to produce the group financial statements. Our approach provides us with sufficient coverage over the group.
In establishing the overall approach to the group audit, we determined the type of work that needed to be performed at the reporting units by us, as the group engagement team, and component auditors from other PwC network firms operating under our instruction. As part of this process, we identified five full scope components and one component requiring specified procedures. Furthermore, we performed desktop reviews over 14 additional components. Component auditors performed the work for 4 out of the 5 full scope components and the specified procedures component.
Where the work was performed by component auditors, we determined the level of involvement we needed to have in the audit work at those reporting units to be able to conclude whether sufficient appropriate audit evidence had been obtained as a basis for our opinion on the group financial statements as a whole. This included visits to the key facilities in Batam, Shenzhen, Zhongshan, Tijuana and Bydgoszcz where we met with local management and performed a review of the component audit teams’ audit approach. We also held audit close meetings to discuss the work performed by the component auditors and conclude on any follow up points we previously raised.
MaterialityThe scope of our audit was influenced by our application of materiality. We set certain quantitative thresholds for materiality. These, together with qualitative considerations, helped us to determine the scope of our audit and the nature, timing and extent of our audit procedures on the individual financial statement line items and disclosures and in evaluating the effect of misstatements, both individually and on the financial statements as a whole.
Based on our professional judgement, we determined materiality for the financial statements as a whole as follows:
Overall group materiality $454,000 (2016: $409,000).
How we determined it 5% of profit before tax, non-recurring items, interest expense and share based payments.
Rationale for benchmark applied In the prior years, our materiality was based on 5% of profit before tax, interest and non-recurring items. We have changed this in the current year to exclude share based payments as these have been highly volatile over recent years.
We agreed with the Audit Committee that we would report to them misstatements identified during our audit above $25,000 (2016: $20,000) as well as misstatements below that amount that, in our view, warranted reporting for qualitative reasons. Specific materialities used were 5% of non-recurring items, capped at $454,000, and 5% of interest payable, $94,000. A separate materiality has been calculated for non-recurring items because these items are separately reported as Volex believe these items should be reported separately as they are considered one off and significant. The classification of non-recurring items is important because it directly impacts the underlying profitability measure.
Going concernUnder the Listing Rules we are required to review the directors’ statement, set out on page 52, in relation to going concern. We have nothing to report having performed our review.
Under ISAs (UK & Ireland) we are required to report to you if we have anything material to add or to draw attention to in relation to the directors’ statement about whether they considered it appropriate to adopt the going concern basis in preparing the financial statements. We have nothing material to add or to draw attention to.
As noted in the directors’ statement, the directors have concluded that it is appropriate to adopt the going concern basis in preparing the financial statements. The going concern basis presumes that the group and company have adequate resources to remain in operation, and that the directors intend them to do so, for at least one year from the date the financial statements were signed. As part of our audit we have concluded that the directors’ use of the going concern basis is appropriate. However, because not all future events or conditions can be predicted, these statements are not a guarantee as to the group’s and company’s ability to continue as a going concern.
59Volex plc
www.volex.com GOVERNANCE
Volex AR2017 Front.indd 59 22/06/2017 11:58:33
25431.02 22 June 2017 11:48 AM Proof 8
Other required reportingConsistency of other information and compliance with applicable requirementsCompanies Act 2006 reportingIn our opinion, based on the work undertaken in the course of the audit:
• the information given in the Strategic Report and the Directors’ Report for the financial period for which the financial statements are prepared is consistent with the financial statements; and
• the Strategic Report and the Directors’ Report have been prepared in accordance with applicable legal requirements.
In addition, in light of the knowledge and understanding of the group, the company and their environment obtained in the course of the audit, we are required to report if we have identified any material misstatements in the Strategic Report and the Directors’ Report. We have nothing to report in this respect.
In our opinion, based on the work undertaken in the course of the audit:
• the information given in the Corporate Governance Statement set out on page 32 with respect to internal control and risk management systems and about share capital structures is consistent with the financial statements and has been prepared in accordance with applicable legal requirements; and
• the information given in the Corporate Governance Statement set out on page 31 with respect to the company’s corporate governance code and practices and about its administrative, management and supervisory bodies complies with rules 7.2.2, 7.2.3 and 7.2.7 of the Disclosure Guidance and Transparency Rules sourcebook of the Financial Conduct Authority.
In addition, in light of the knowledge and understanding of the group, the company and their environment obtained in the course of the audit, we are required to report if we have identified any material misstatements in the information referred to above in the Corporate Governance Statement. We have nothing to report in this respect.
ISAs (UK & Ireland) reporting
Under ISAs (UK & Ireland) we are required to report to you if, in our opinion:
• information in the Annual Report is:
— materially inconsistent with the information in the audited financial statements; or
— apparently materially incorrect based on, or materially inconsistent with, our knowledge of the group and company acquired in the course of performing our audit; or
— otherwise misleading.
We have no exceptions to report.
• the statement given by the directors on page 52, in accordance with provision C.1.1 of the UK Corporate Governance Code (the “Code”), that they consider the Annual Report taken as a whole to be fair, balanced and understandable and provides the information necessary for members to assess the group’s and company’s position and performance, business model and strategy is materially inconsistent with our knowledge of the group and company acquired in the course of performing our audit.
We have no exceptions to report.
• the section of the Annual Report on page 34, as required by provision C.3.8 of the Code, describing the work of the Audit Committee does not appropriately address matters communicated by us to the Audit Committee.
We have no exceptions to report.
Volex plc
Annual Report and Accounts 2017 Stock code: VLX
60
Independent Auditors’ Report continued
Volex AR2017 Front.indd 60 22/06/2017 11:58:33

25431.02 22 June 2017 11:48 AM Proof 8
The directors’ assessment of the prospects of the group and of the principal risks that would threaten the solvency or liquidity of the group
Under ISAs (UK & Ireland) we are required to report to you if we have anything material to add or to draw attention to in relation to:
• the directors’ confirmation on page 33 of the Annual Report, in accordance with provision C.2.1 of the Code, that they have carried out a robust assessment of the principal risks facing the group, including those that would threaten its business model, future performance, solvency or liquidity.
We have nothing material to add or to draw attention to.
• the disclosures in the Annual Report that describe those risks and explain how they are being managed or mitigated.
We have nothing material to add or to draw attention to.
• the directors’ explanation on page 33 of the Annual Report, in accordance with provision C.2.2 of the Code, as to how they have assessed the prospects of the group, over what period they have done so and why they consider that period to be appropriate, and their statement as to whether they have a reasonable expectation that the group will be able to continue in operation and meet its liabilities as they fall due over the period of their assessment, including any related disclosures drawing attention to any necessary qualifications or assumptions.
We have nothing material to add or to draw attention to.
Under the Listing Rules we are required to review the directors’ statement that they have carried out a robust assessment of the principal risks facing the group and the directors’ statement in relation to the longer-term viability of the group. Our review was substantially less in scope than an audit and only consisted of making inquiries and considering the directors’ process supporting their statements; checking that the statements are in alignment with the relevant provisions of the Code; and considering whether the statements are consistent with the knowledge acquired by us in the course of performing our audit. We have nothing to report having performed our review.
Adequacy of accounting records and information and explanations receivedUnder the Companies Act 2006 we are required to report to you if, in our opinion:
• we have not received all the information and explanations we require for our audit; or
• adequate accounting records have not been kept by the company, or returns adequate for our audit have not been received from branches not visited by us; or
• the company financial statements and the part of the Directors’ Remuneration Report to be audited are not in agreement with the accounting records and returns.
We have no exceptions to report arising from this responsibility.
Directors’ remunerationDirectors’ remuneration report - Companies Act 2006 opinionIn our opinion, the part of the Directors’ Remuneration Report to be audited has been properly prepared in accordance with the Companies Act 2006.
Other Companies Act 2006 reportingUnder the Companies Act 2006 we are required to report to you if, in our opinion, certain disclosures of directors’ remuneration specified by law are not made. We have no exceptions to report arising from this responsibility.
Corporate governance statementUnder the Companies Act 2006 we are required to report to you if, in our opinion, a corporate governance statement has not been prepared by the company. We have no exceptions to report arising from this responsibility.
Under the Listing Rules we are required to review the part of the Corporate Governance Statement relating to ten further provisions of the Code. We have nothing to report having performed our review.
Responsibilities for the financial statements and the auditOur responsibilities and those of the directorsAs explained more fully in the Statement of the Directors’ responsibilities set out on page 52, the directors are responsible for the preparation of the financial statements and for being satisfied that they give a true and fair view.
Our responsibility is to audit and express an opinion on the financial statements in accordance with applicable law and ISAs (UK & Ireland). Those standards require us to comply with the Auditing Practices Board’s Ethical Standards for Auditors.
This report, including the opinions, has been prepared for and only for the company’s members as a body in accordance with Chapter 3 of Part 16 of the Companies Act 2006 and for no other purpose. We do not, in giving these opinions, accept or assume responsibility for any other purpose or to any other person to whom this report is shown or into whose hands it may come save where expressly agreed by our prior consent in writing.
61Volex plc
www.volex.com GOVERNANCE
Volex AR2017 Front.indd 61 22/06/2017 11:58:33

25431.02 22 June 2017 11:48 AM Proof 8
What an audit of financial statements involvesAn audit involves obtaining evidence about the amounts and disclosures in the financial statements sufficient to give reasonable assurance that the financial statements are free from material misstatement, whether caused by fraud or error. This includes an assessment of:
• whether the accounting policies are appropriate to the group’s and the company’s circumstances and have been consistently applied and adequately disclosed;
• the reasonableness of significant accounting estimates made by the directors; and
• the overall presentation of the financial statements.
We primarily focus our work in these areas by assessing the directors’ judgements against available evidence, forming our own judgements, and evaluating the disclosures in the financial statements.
We test and examine information, using sampling and other auditing techniques, to the extent we consider necessary to provide a reasonable basis for us to draw conclusions. We obtain audit evidence through testing the effectiveness of controls, substantive procedures or a combination of both.
In addition, we read all the financial and non-financial information in the Annual Report to identify material inconsistencies with the audited financial statements and to identify any information that is apparently materially incorrect based on, or materially inconsistent with, the knowledge acquired by us in the course of performing the audit. If we become aware of any apparent material misstatements or inconsistencies we consider the implications for our report. With respect to the Strategic Report, Directors’ Report and Corporate Governance Statement, we consider whether those reports include the disclosures required by applicable legal requirements.
Timothy McAllister (Senior Statutory Auditor)for and on behalf of PricewaterhouseCoopers LLPChartered Accountants and Statutory AuditorsLondon8 June 2017
• The maintenance and integrity of the Volex plc website is the responsibility of the directors; the work carried out by the auditors does not involve consideration of these matters and, accordingly, the auditors accept no responsibility for any changes that may have occurred to the financial statements since they were initially presented on the website.
• Legislation in the United Kingdom governing the preparation and dissemination of financial statements may differ from legislation in other jurisdictions.
Volex plc62
Annual Report and Accounts 2017 Stock code: VLX
Independent Auditors’ Report continued
Volex AR2017 Front.indd 62 22/06/2017 11:58:36

25431.02 22 June 2017 11:48 AM Proof 8
63FINANCIAL STATEMENTSConsolidated Income Statement 64
Consolidated Statement of Comprehensive Income
65
Consolidated and Company Statement of Financial Position
66
Consolidated and Company Statements of Changes in Equity
67
Consolidated and Company Statement of Cash Flows
68
Notes to the Financial Statements 69
FINANCIAL STATEMENTSwww.volex.com
Volex AR2017 Front.indd 63 22/06/2017 11:58:41

25431.02 22 June 2017 11:48 AM Proof 8
Group2017 2016
Notes
Before non-recurring
items and share-based
payments $’000
Non-recurring items and
share-based payments
$’000Total
$’000
Before non-recurring
items and share-based
payments $’000
Non-recurring items and
share-based payments
$’000Total
$’000Revenue 3 319,584 – 319,584 367,534 – 367,534Cost of sales (264,125) (13,112) (277,237) (307,167) (1,848) (309,015)Gross profit 55,459 (13,112) 42,347 60,367 (1,848) 58,519Operating expenses (46,380) (2,588) (48,968) (53,195) (1,885) (55,080)Operating profit/(loss) 9,079 (15,700) (6,621) 7,172 (3,733) 3,439Finance income 5 19 – 19 18 – 18Finance costs 6 (1,898) – (1,898) (1,915) – (1,915)Profit/(loss) on ordinary activities before taxation 7,200 (15,700) (8,500) 5,275 (3,733) 1,542Taxation 10 1,238 214 1,452 (3,942) 88 (3,854)Profit/(loss) for the period attributable to the owners of the parent 7 8,438 (15,486) (7,048) 1,333 (3,645) (2,312)Earnings/(loss) per share (cents)Basic 11 9.5 (7.9) 1.5 (2.6)Diluted 11 9.5 (7.9) 1.5 (2.6)
Annual Report and Accounts 2017 Stock code: VLX
Volex plc64
Consolidated income statement For the 52 weeks ended 2 April 2017 (52 weeks ended 3 April 2016)
Volex AR2017 Financials.indd 64 22/06/2017 11:57:08

25431.02 22 June 2017 11:48 AM Proo 8
Notes
Group2017$’000
2016 $’000
Profit/(loss) for the period (7,048) (2,312)
Items that will not be reclassified subsequently to profit or lossActuarial gain/(loss) on defined benefit pension schemes 28 (2,143) (405)Tax relating to items that will not be reclassified – –
(2,143) (405)Items that may be reclassified subsequently to profit or lossGain/(loss) on hedge of net investment taken to equity (350) (135)Gain/(loss) arising on cash flow hedges during the period 317 1,097Exchange gain/(loss) on translation of foreign operations 3,743 (360)Tax relating to items that may be reclassified – –
3,710 602
Other comprehensive income/(loss) for the period 1,567 197
Total comprehensive income/(loss) for the period attributable to the owners of the parent (5,481) (2,115)
www.volex.com
65Volex plc
FINANCIAL STATEMENTS
Consolidated statement of comprehensive incomeFor the 52 weeks ended 2 April 2017 (52 weeks ended 3 April 2016)
Volex AR2017 Financials.indd 65 22/06/2017 11:57:08

25431.02 22 June 2017 11:48 AM Proof 8
Notes
Group Company2017
$’0002016
$’0002017
$’0002016
$’000Non-current assetsGoodwill 12 2,414 2,741 – –Other intangible assets 13 593 986 85 199Property, plant and equipment 14 18,085 33,338 4 12Investments 15 – – 106,113 123,427Other receivables 17 843 1,539 17 29Derivative financial instruments 29 22 – 22 –Deferred tax asset 20 2,948 823 – –
24,905 39,427 106,241 123,667Current assetsInventories 16 36,040 41,505 1,844 2,032Trade receivables 17 53,448 55,210 2,214 1,990Other receivables 17 7,703 8,378 7,416 19,329Current tax assets 505 367 40 30Derivative financial instruments 29 380 144 380 –Cash and bank balances 25 29,565 30,738 40 4
127,641 136,342 11,934 23,385Total assets 152,546 175,769 118,175 147,052Current liabilitiesBorrowings 18 – 5,164 6,068 11,934Trade payables 19 51,156 53,814 462 722Other payables 19 24,993 20,784 12,300 15,771Current tax liabilities 5,346 6,183 – –Retirement benefit obligation 28 719 763 719 763Provisions 21 358 1,771 32 1,152Derivative financial instruments 29 – 76 – 76
82,572 88,555 19,581 30,418Net current assets/(liabilities) 45,069 47,787 (7,647) (7,033)Non-current liabilitiesBorrowings 18 18,230 28,823 2,510 6,058Other payables 19 432 393 39,572 48,461Deferred tax liabilities 20 1,239 2,133 – –Retirement benefit obligation 28 3,682 2,567 3,682 2,567Provisions 21 84 1,946 – 1,946
23,667 35,862 45,764 59,032Total liabilities 106,239 124,417 65,345 89,450Net assets 46,307 51,352 52,830 57,602Equity attributable to owners of the parentShare capital 22 39,755 39,755 39,755 39,755Share premium account 7,122 7,122 7,122 7,122Non-distributable reserve 23 2,455 2,455 1,186 1,186Hedging and translation reserve (4,254) (7,964) (26,012) (17,335)Own shares 23 (867) (867) – –Merger reserve – – 15,540 15,540Retained earnings 2,096 10,851 15,239 11,334Total equity 46,307 51,352 52,830 57,602
The financial statements on pages 64 to 104 were approved by the Board of Directors and authorised for issue on 8 June 2017.
They were signed on its behalf by:
Nathaniel Rothschild Executive Chairman Volex plc Company Number: 158956
Daren Morris Chief Financial Officer
Annual Report and Accounts 2017 Stock code: VLX
Volex plc66
Consolidated and Company statement of financial positionAs at 2 April 2017 (3 April 2016)
Volex AR2017 Financials.indd 66 22/06/2017 11:57:12

25431.02 22 June 2017 11:48 AM Proo 8
Group
Share capital $’000
Share premium account
$’000
Non-distributable
reserves $’000
Hedging and translation
reserve $’000
Own shares $’000
Retained earnings
$’000
Total equity $’000
Balance at 5 April 2015 39,755 7,122 2,455 (8,566) (867) 14,609 54,508Profit/(loss) for the period attributable to the owners of the parent – – – – – (2,312) (2,312)Other comprehensive income/(loss) for the period – – – 602 – (405) 197Total comprehensive income/(loss) for the period – – – 602 – (2,717) (2,115)Reserve entry for share option charge/(credit) – – – – – (1,041) (1,041)Balance at 3 April 2016 39,755 7,122 2,455 (7,964) (867) 10,851 51,352Profit/(loss) for the period attributable to the owners of the parent – – – – – (7,048) (7,048)Other comprehensive income/(loss) for the period – – – 3,710 – (2,143) 1,567Total comprehensive income/(loss) for the period – – – 3,710 – (9,191) (5,481)Reserve entry for share option charge/(credit) – – – – – 436 436Balance at 2 April 2017 39,755 7,122 2,455 (4,254) (867) 2,096 46,307
Company
Share capital $’000
Share premium account
$’000
Non-distributable
reserves $’000
Hedging andtranslation
reserve $’000
Merger reserve
$’000
Retained earnings
$’000
Total equity $’000
Balance at 5 April 2015 39,755 7,122 – (14,256) 15,540 14,420 62,581Profit/(loss) for the year attributable to the owners of the parent – – – – – (1,640) (1,640)Other comprehensive income/(loss) for the period – – – (3,079) – (405) (3,484)Total comprehensive income/(loss) for the period – – – (3,079) – (2,045) (5,124)Transfer from Volex Trust – – 1,186 – – – 1,186Reserve entry for share option charge/(credit) – – – – – (1,041) (1,041)Balance at 3 April 2016 39,755 7,122 1,186 (17,335) 15,540 11,334 57,602Profit/(loss) for the year attributable to the owners of the parent – – – – – 5,612 5,612Other comprehensive income/(loss) for the period – – – (8,677) – (2,143) (10,820)Total comprehensive income/(loss) for the period – – – (8,677) – 3,469 (5,208)Reserve entry for share option charge/(credit) – – – – – 436 436Balance at 2 April 2017 39,755 7,122 1,186 (26,012) 15,540 15,239 52,830
www.volex.com
67Volex plc
FINANCIAL STATEMENTS
Consolidated and Company statements of changes in equityFor the 52 weeks ended 2 April 2017 (52 weeks ended 3 April 2016)
Volex AR2017 Financials.indd 67 22/06/2017 11:57:12

25431.02 22 June 2017 11:48 AM Proof 8
Notes
Group Company2017 $’000
2016 $’000
2017 $’000
2016 $’000
Net cash generated from/(used in) operating activities 25 15,897 1,798 9,707 (3,510)
Cash flow generated from/(used in) investing activities Interest received 5 19 18 1 –Proceeds on disposal of intangible assets, property, plant and equipment 201 22 – –Purchases of property, plant and equipment (2,464) (5,961) – –Purchases of intangible assets 13 (68) (626) (47) (179)Transactions in own shares – – – 1,186Net cash inflow/(outflow) on intercompany funding – – (246) 2,185Net cash generated from/(used in) investing activities (2,312) (6,547) (292) 3,192
Cash flows before financing activities 13,585 (4,749) 9,415 (318)Cash generated/(used) before non-recurring items 19,326 (281) 12,425 1,443Cash utilised in respect of non-recurring items (5,741) (4,468) (3,010) (1,761)
Cash flow generated from/(used in) financing activities Refinancing costs paid (582) – (582) –Repayment of borrowings (9,240) (3,500) (3,500) (2,500)New bank loans raised – 6,872 – –Net cash generated from/(used in) financing activities (9,822) 3,372 (4,082) (2,500)
Net increase/(decrease) in cash and cash equivalents 3,763 (1,377) 5,333 (2,818)
Cash and cash equivalents at beginning of period 24 25,574 26,203 (11,930) (9,806)Effect of foreign exchange rate changes 24 228 748 569 694Cash and cash equivalents at end of period 24 29,565 25,574 (6,028) (11,930)
Annual Report and Accounts 2017 Stock code: VLX
Volex plc68
Consolidated and Company statement of cash flowsFor the 52 weeks ended 2 April 2017 (52 weeks ended 3 April 2016)
Volex AR2017 Financials.indd 68 22/06/2017 11:57:12

25431.02 22 June 2017 11:48 AM Proo 8
1. Presentation of financial statementsVolex plc (‘the Company’ and together with its subsidiaries ‘the Group’) is a public limited company incorporated and domiciled in the United Kingdom under the Companies Act 2006 and listed on the London Stock Exchange. The address of the registered office is given on page 108. The nature of the Group’s operations and its principal activities are set out in the Strategic Review on pages 04 to 25.
Financial statements are prepared for the period ending on the Sunday following the Friday that falls closest to the accounting reference date of 31 March each year.
These financial statements are presented in US Dollars (‘USD’) as it is the currency of the primary economic environment in which the Group operates.
The Company has elected to take the exemption under section 408 of the Companies Act 2006 to not present the parent company statement of comprehensive income (and separate income statement). The profit for the parent company for the period was $5,612,000 (2016: loss of $1,640,000).
2. Significant accounting policiesThe principal accounting policies applied in the preparation of these consolidated financial statements are set out below. These policies have been consistently applied to all the periods presented, unless otherwise stated.
Basis of accountingThe financial statements have been prepared in accordance with IFRSs as adopted by the European Union, IFRSIC interpretations and the Companies Act 2006, applicable to companies reporting under IFRS.
The financial statements have been prepared on the historical cost basis except for the revaluation of financial instruments that are measured at fair values at the end of each reporting period, as explained in the accounting policies below. Historical cost is generally based on the fair value of the consideration given in exchange for goods and services.
Adoption of new and revised International Financial Reporting Standards (‘IFRSs’)In the current period, there are no new standards, amendments or interpretations which have a material impact on the Group’s Financial Statements.
At the date of authorisation of these financial statements, the Group has not applied the following new and revised IFRSs that have been issued but are not yet effective (and in some cases have not yet been adopted by the EU):
• IAS 7 ‘Statement of Cash Flow’ (effective year ended December 2017) – amendment
• IAS 12 ‘Income Taxes’ (effective year ended December 2017) – amendment
• IFRS 2 ‘Share-based Payment’ (effective year ended December 2018) – amendment
• IFRS 9 ‘Financial Instruments’ (effective year ended December 2018)
• IFRS 15 ‘Revenue from Contracts with Customers’ (effective year ended December 2018)
• IFRS 16 ‘Leases’ (effective year ended December 2019)
The Directors do not expect that the adoption of IFRS 9 and IFRS 15 will have a material impact on the financial statements of the Group in future periods, except that IFRS 9 will impact both the measurement and disclosures of financial instruments. IFRS 16 specifies how to recognise, measure, present and disclose leases. The standard provides a single lessee accounting model, requiring lessees to recognise assets and liabilities on the balance sheet for all leases unless the lease term is 12 months or less or the underlying asset has a low value. The adoption of IFRS 16 will have an impact on the Group’s balance sheet and reported results, however will not reflect any changes in the underlying economics of the business.
Basis of consolidationThe consolidated financial statements of Volex plc incorporate the financial statements of the Company and entities which it controls (its subsidiaries), (together the ‘Group’), and are drawn up to the relevant period end date. Control is achieved where the Company has the power to govern the financial and operating policies so as to be able to obtain benefits from its activities.
Where necessary, adjustments are made to the financial statements of subsidiaries to bring the accounting policies used into line with those used by the Group.
All intra-group assets and liabilities, equity, income, expenses and cash flows relating to transactions between the members of the Group are eliminated in full on consolidation.
www.volex.com
69Volex plc
FINANCIAL STATEMENTS
Notes to the Financial StatementsFor the 52 weeks ended 2 April 2017 (52 weeks ended 3 April 2016)
Volex AR2017 Financials.indd 69 22/06/2017 11:57:12

25431.02 22 June 2017 11:48 AM Proof 8
2. Significant accounting policies continuedGoing concernThe Group’s business activities, together with the factors likely to affect its future developments, performance and position are set out in the Strategic Report on pages 04 to 25. The financial position of the Group, its cash flows, liquidity position and borrowing facilities are described in the Finance Review on pages 16 to 19. In addition note 29 to the financial statements includes the Group objectives, policies and processes for managing its capital; its financial risk management objectives; details of its financial instruments and hedging activities; and its exposures to credit risk, liquidity risk, interest rate risk, commodity price risk and foreign exchange risk.
As highlighted in note 18 to the financial statements, during the year under review the Group met its day-to-day working capital requirements through a $45,000,000 multi-currency revolving credit facility (‘RCF’) with a syndicate of three banks. The principal terms of this financing facility are given in note 18. Post year end, the RCF has reduced to $30,000,000 with the syndicate reducing from three banks to two. The new facility requires the Group to perform quarterly financial covenant calculations with respect to leverage (adjusted total debt to adjusted rolling 12-month EBITDA) and interest cover (adjusted rolling 12-month EBITDA to adjusted rolling 12-month interest). Breach of these covenants would result in cancellation of the facility. This facility expires on 30 June 2019.
The Group’s forecast and projections, taking reasonable account of possible changes in trading performance, show that the Group should operate within the level of the proposed facility for at least 12 months from the date of these accounts and should comply with covenants over this period. The Group also has access to and uses additional uncommitted facilities. Further, the Group has a number of mitigating actions available to it, should actual performance fall below the current financial forecasts. The Directors have the financial controls and monitoring available to them to put in place those mitigating actions in a timely fashion if they see the need to do so. The Directors therefore believe that the Group is well placed to manage its business within its covenants.
The Directors have, at the time of approving the financial statements, a reasonable expectation that the Company and the Group have adequate resources to continue in operational existence for at least 12 months from the date of these accounts. Accordingly, they continue to adopt the going concern basis in preparing the financial statements.
Business combinationsAcquisitions of subsidiaries and businesses are accounted for using the acquisition method. The consideration transferred in a business combination is measured at fair value, which is calculated as the sum of acquisition-date fair values of assets transferred by the Group, liabilities incurred by the Group to the former owners of the acquiree and the equity interest issued by the Group in exchange for control of the acquiree. Acquisition-related costs are recognised in profit or loss as incurred.
Goodwill is measured as the excess of the sum of the consideration transferred and the amount of any non-controlling interests in the acquiree over the net of the acquisition-date amounts of the identifiable assets acquired and liabilities assumed.
Where the consideration for the acquisition includes any asset or liability resulting from a contingent consideration arrangement, it is measured at its acquisition date fair value and included as part of the consideration transferred. Subsequent changes in the fair value of contingent consideration that qualify as measurement period adjustments are adjusted retrospectively, with corresponding adjustments against goodwill. Measurement period adjustments are adjustments that arise from additional information obtained during the ‘measurement period’ (which cannot exceed one year from the acquisition date) about facts and circumstances that existed at the acquisition date.
GoodwillGoodwill is initially recognised and measured as set out above.
Goodwill is not amortised but is tested annually for impairment. For the purpose of impairment testing, goodwill is allocated to cash-generating units. The allocation is made to those cash-generating units or groups of cash-generating units that are expected to benefit from the business combination in which the goodwill arose. If the recoverable amount of the cash-generating unit is less than the carrying amount of the unit, the impairment loss is allocated first to reduce the carrying amount of any goodwill allocated to the unit and then to the other assets of the unit pro-rata on the basis of the carrying amount of each asset in the unit. The impairment loss is recognised immediately in profit and loss and is not reversed in subsequent periods.
On disposal of a subsidiary, the attributable amount of goodwill is included in the determination of the profit or loss on disposal.
Goodwill arising on acquisitions before the date of transition to IFRS has been retained at the previous UK GAAP amounts. Goodwill arising on acquisitions prior to 31 March 1998 has been written off to reserves and has not been reinstated in the statement of financial position and will not be included in determining any subsequent profit or loss on disposal.
Investment in subsidiary undertakingsIn the Company statement of financial position, investments in subsidiary undertakings are recorded at cost less provision for impairment.
The excess of fair value over the nominal value of shares issued in consideration for investments in which ownership exceeds 90% is recorded in the Company’s merger reserve.
Foreign currenciesThe individual financial statements of each Group company are prepared in the currency of the primary economic environment in which it operates (its functional currency). For the purpose of the consolidated financial statements, the results and financial position of each Group company are expressed in USD, which is the presentation currency for the consolidated financial statements.
Annual Report and Accounts 2017 Stock code: VLX
Volex plc70
Notes to the Financial Statements continuedFor the 52 weeks ended 2 April 2017 (52 weeks ended 3 April 2016)
Volex AR2017 Financials.indd 70 22/06/2017 11:57:13

25431.02 22 June 2017 11:48 AM Proo 8
2. Significant accounting policies continuedIn preparing the financial statements of the individual companies, transactions in currencies other than the entity’s functional currency (foreign currencies) are recognised at the rates of exchange prevailing on the dates of the transactions. At each reporting date, monetary assets and liabilities that are denominated in foreign currencies are retranslated at the rates prevailing at that date. Non-monetary items carried at fair value that are denominated in foreign currencies are translated at the rates prevailing at the date when the fair value was determined. Nonmonetary items that are measured in terms of historical cost in a foreign currency are not retranslated.
Exchange differences are recognised in profit or loss in the period in which they arise except for:
• Exchange differences on transactions entered into to hedge certain foreign currency risks (see below under financial instruments/hedge accounting); and
• Exchange differences on monetary items receivable from or payable to a foreign operation for which settlement is neither planned nor likely to occur in the foreseeable future (therefore forming part of the net investment in the foreign operation), which are recognised initially in other comprehensive income and reclassified from equity to profit or loss on disposal or partial disposal of the net investment.
For the purpose of presenting consolidated financial statements, the assets and liabilities of the Group’s foreign operations are translated at exchange rates prevailing on the reporting date. Income and expense items are translated at the average exchange rates for the period, unless exchange rates fluctuate significantly during that period, in which case the exchange rates at the date of transactions are used. Exchange differences arising, if any, are recognised in other comprehensive income and accumulated in equity.
Revenue recognitionRevenue is measured at the fair value of the consideration received or receivable for goods and services provided in the normal course of business, net of discounts, VAT and other sales related taxes.
Revenue from the sale of goods is recognised when all of the following conditions are satisfied:
• Significant risks and rewards of ownership have been transferred to the buyer determined with reference to the specific contract in place;
• The amount of revenue can be measured reliably;
• It is probable that the economic benefits associated with the transaction will flow to the Group; and
• The costs incurred or to be incurred in respect of the transaction can be measured reliably.
Revenue from the provision of engineering services is recognised by reference to the stage of completion of the contracted services.
Interest income is accrued on a timely basis by reference to the principal outstanding and the effective interest rate applicable.
Dividend income from investments is recognised when the shareholder’s right to receive payment has been established.
TaxationThe tax expense for the period comprises current and deferred tax. Tax is recognised in the income statement, except to the extent that it relates to items recognised in other comprehensive income or directly in equity. In this case the tax is recognised in other comprehensive income or directly in equity, respectively.
The tax currently payable is based on taxable profit for the period. Taxable profit differs from profit as reported in the income statement because it excludes items of income or expense that are taxable or deductible in other periods and it further excludes items that are never taxable or deductible. The Group’s liability for current tax is calculated using tax rates and laws that have been enacted or substantively enacted by the reporting date.
Deferred tax is the tax expected to be payable or recoverable on differences between the carrying amounts of assets and liabilities in the financial statements and the corresponding tax bases used in the computation of taxable profit and is accounted for using the liability method. Deferred tax liabilities are generally recognised for all taxable temporary differences and deferred tax assets are recognised to the extent that it is probable that taxable profits will be available against which deductible temporary differences can be utilised. Such assets and liabilities are not recognised if the temporary differences arise from goodwill or from the initial recognition (other than in a business combination) of other assets and liabilities in a transaction that affects neither the taxable profit nor the accounting profit.
Deferred tax liabilities are recognised for taxable temporary differences arising on investments in subsidiaries and associates and interests in joint ventures, except where the Group is able to control the reversal of the temporary difference and it is probable that the temporary difference will not reverse in the foreseeable future.
The carrying amount of deferred tax assets is reviewed at each reporting date and reduced to the extent that it is no longer probable that sufficient taxable profits will be available to allow all or part of the asset to be recovered.
Deferred tax is calculated at the tax rates that are expected to apply in the period when the liability is settled or the asset is realised based on tax rates and laws that have been enacted or substantively enacted by the reporting date. Deferred tax is charged or credited in the income statement, except when it relates to items charged or credited in other comprehensive income, in which case the deferred tax is also dealt with in other comprehensive income.
Deferred tax assets and liabilities are offset when there is a legally enforceable right to set off current tax assets against current liabilities and when they relate to income taxes levied by the same taxation authority and the Group intends to settle its current tax assets and liabilities on a net basis.
www.volex.com
71Volex plc
FINANCIAL STATEMENTS
Volex AR2017 Financials.indd 71 22/06/2017 11:57:13

25431.02 22 June 2017 11:48 AM Proof 8
2. Significant accounting policies continuedProperty, plant and equipmentProperty, plant and equipment are stated at cost less accumulated depreciation and any recognised impairment loss. Cost includes the original purchase price of the asset and any further costs attributable to bringing the asset to its working condition for its intended use.
Depreciation is recognised so as to write off the cost or valuation of assets (other than freehold land) less their residual values over their useful lives, using the straight-line method, on the following bases:
Long leasehold buildings up to 50 years or period of lease, if shorter
Plant and machinery up to 15 years
An item of property, plant and equipment is derecognised upon disposal or when no future economic benefits are expected to arise from the continued use of the asset. The gain or loss arising on the disposal of an asset is determined as the difference between the sales proceeds and the carrying amount of the asset and is recognised in income.
Intangible assets – computer software and licencesComputer software is stated at cost less accumulated depreciation and any recognised impairment loss. Acquired computer software licences are capitalised on the basis of the costs incurred to acquire and use the specific software. These costs are included in the statement of financial position within intangible assets and are amortised straight-line over their estimated useful lives, not exceeding five years.
Costs associated with maintaining computer software are recognised as an expense as incurred.
Intangible assets – patentsPatents are stated at cost less accumulated amortisation. Patents are amortised on a straight-line basis over their estimated useful lives.
Intangible assets – internally generated intangible assets – research and development expenditureExpenditure on research activities is recognised as an expense in the period in which it is incurred.
The Group is engaged in development activities which include both general product development and specific customer development projects. An internally generated intangible asset arising from these development activities is recognised only if all of the following conditions are met:
• An asset is created that can be identified;
• It is probable that the asset created will generate future economic benefits; and
• The development cost of the asset can be measured reliably.
Internally generated intangible assets are amortised on a straight-line basis over their useful lives. Where no internally generated intangible asset can be recognised, development expenditure is recognised as an expense in the period in which it is incurred.
Impairment of property, plant and equipment and intangible assets excluding goodwillAt each reporting date, the Group reviews the carrying amounts of its property, plant and equipment and intangible assets to determine whether there is any indication that those assets have suffered an impairment loss. If any such indication exists, the recoverable amount of the asset is estimated in order to determine the extent of the impairment loss (if any). Where the asset does not generate cash flows that are independent from other assets, the Group estimates the recoverable amount of the CGU to which the asset belongs.
Recoverable amount is the higher of fair value less costs to sell and value in use. In assessing value in use, the estimated future cash flows are discounted to their present value using a pre-tax discount rate that reflects current market assessments of the time value of money and the risks specific to the asset for which the estimates of future cash flows have not been adjusted.
If the recoverable amount of an asset (or CGU) is estimated to be less than its carrying amount, the carrying amount of the asset (or CGU) is reduced to its recoverable amount. An impairment loss is recognised as an expense immediately, unless the relevant asset is carried at a revalued amount, in which case the impairment loss is treated as a revaluation decrease.
Where an impairment loss subsequently reverses, the carrying amount of the asset (or CGU) is increased to the revised estimate of its recoverable amount, but so that the increased carrying amount does not exceed the carrying amount that would have been determined had no impairment loss been recognised for the asset (or CGU) in prior periods. A reversal of an impairment loss is recognised as income immediately, unless the relevant asset is carried at a revalued amount, in which case the reversal of the impairment loss is treated as a revaluation increase.
LeasesLeases are classified as finance leases whenever the terms of the lease transfer substantially all the risks and rewards of ownership to the lessee. All other leases are classified as operating leases.
Annual Report and Accounts 2017 Stock code: VLX
Volex plc72
Notes to the Financial Statements continuedFor the 52 weeks ended 2 April 2017 (52 weeks ended 3 April 2016)
Volex AR2017 Financials.indd 72 22/06/2017 11:57:13

25431.02 22 June 2017 11:48 AM Proo 8
2. Significant accounting policies continuedThe Group as lesseeAssets held under finance leases are recognised as assets of the Group at their fair value or, if lower, at the present value of the minimum lease payments, each determined at the inception of the lease. The corresponding liability to the lessor is included in the balance sheet as a finance lease obligation. Lease payments are apportioned between finance expenses and reduction of the lease obligation so as to achieve a constant rate of interest on the remaining balance of the liability.
Rentals payable under operating leases are charged to income on a straight-line basis over the term of the relevant lease except where another more systematic basis is more representative of the time pattern in which economic benefits from the lease asset are consumed. Lease incentives are recognised as a liability and are allocated on a straight-line basis as a reduction of rental expense over the lease term.
The Group as lessorRental income from operating leases, which have arisen from the sublet of vacant premises, is recognised on a straight-line basis over the term of the relevant lease.
InventoriesInventories are stated at the lower of cost and net realisable value. Cost is measured at standard and adjusted for material variances such that the adjusted figure represents direct materials, direct labour and an attributable proportion of manufacturing overheads based on normal levels of activity. Net realisable value is based on estimated selling price, less all estimated costs of completion and costs to be incurred in marketing, selling and distribution. Provision is made for obsolete, slow moving or defective items where appropriate.
Cash and cash equivalentsCash and cash equivalents comprise cash on hand and demand deposits and other short term highly liquid investments that are readily convertible to a known amount of cash and are subject to an insignificant risk of change in value less bank overdrafts.
Bank borrowingsInterest bearing bank loans and overdrafts are recorded at the proceeds received, net of direct issue costs. Finance charges, including premiums on settlement or redemption and direct issue costs, are accounted for on an accruals basis in the consolidated income statement using the effective interest rate method and are added to the carrying amount of the instrument to the extent that they are not settled in the period in which they arise.
ProvisionsProvisions are recognised when the Group has a present obligation (legal or constructive) as a result of a past event, it is probable that the Group will be required to settle the obligation, and a reliable estimate can be made of the amount of the obligation.
The amount recognised as a provision is the best estimate of the consideration required to settle the present obligation at the reporting date, taking into account the risks and uncertainties surrounding the obligation. Where a provision is measured using the cash flows estimated to settle the present obligation, its carrying value is the present value of those cash flows (when the effect of the time value of money is material).
Present obligations arising under onerous lease contracts are recognised and measured as provisions. An onerous contract is considered to exist where the Group has a contract under which the unavoidable costs of meeting the obligations under the contract exceed the economic benefits expected to be received under it.
A restructuring provision is recognised when the Group has developed a detailed formal plan for restructuring and has raised a valid expectation in those affected that it will carry out the restructuring by starting to implement the plan or announcing its main features to those affected by it. The measurement of a restructuring provision includes only the direct expenditures arising from the restructuring, which are those amounts that are both necessarily entailed by the restructuring and not associated with ongoing activities of the entity.
Provisions for the expected cost of warranty obligations under local sales of goods legislation are recognised at the date of sale of the relevant products, at the Directors’ best estimate of the expenditure required to settle the Group’s obligation.
Retirement benefitsThe Group has both defined benefit and defined contribution retirement benefit schemes, the former of which is now closed to new entrants. The retirement benefit obligation recognised in the consolidated balance sheet represents the deficit or surplus in the Group’s defined benefit scheme.
For defined benefit schemes, the cost of providing benefits is determined using the Projected Unit Credit Method, with actuarial valuations carried out at the end of each reporting period.
Defined benefit costs are split into three categories:
• Remeasurement;
• Net interest expense or income; and
• Past service cost and gains and losses on curtailments and settlements.
www.volex.com
73Volex plc
FINANCIAL STATEMENTS
Volex AR2017 Financials.indd 73 22/06/2017 11:57:13

25431.02 22 June 2017 11:48 AM Proof 8
2. Significant accounting policies continuedRemeasurement comprises actuarial gains and losses, the effect of the asset ceiling (where applicable) and the return on scheme assets (excluding interest). These costs are recognised immediately in the balance sheet with a charge or credit to the statement of comprehensive income in the period in which they occur. Remeasurement recorded in the statement of comprehensive income is not recycled.
Net interest is calculated by applying a discount rate to the net defined benefit liability or asset and is recognised within finance costs (see note 6). As the defined benefit scheme is now closed, no service cost is incurred.
Payments to defined contribution retirement benefit schemes are recognised as an expense when employees have rendered service entitling them to the contributions. Payments to state-managed schemes are treated as payments to defined contribution schemes where the Group’s obligations under the schemes are equivalent to those arising in a defined contribution scheme.
Share-based paymentsEquity-settled share-based payments are issued to certain employees and are measured at the fair value of the equity instruments at the date of grant. The fair value excludes the effect of non-market-based vesting conditions. Details regarding the determination of the fair value of equity-settled share-based transactions are set out in note 27.
The fair value determined at the date of grant of the equity-settled share-based payments is expensed to the income statement on a straight-line basis over the vesting period, based on the estimate of the number of options that will eventually vest. At each reporting date, the Group revises its estimate of the number of equity instruments expected to vest as a result of the effect of non-market-based vesting conditions. The impact of the revision of the original estimates, if any, is recognised in profit or loss such that the cumulative expense reflects the revised estimate, with a corresponding adjustment to reserves.
For cash-settled share-based payments, including bonus schemes to be settled in shares, a liability is recognised, measured initially at fair value. At each reporting date until the liability is settled, and at the date of settlement, the fair value of the liability is remeasured, with any changes in fair value recognised in profit or loss for the period.
Non-recurring itemsCosts that are one-off in nature and significant, such as restructuring costs or impairment charges, are deemed to be non-recurring by virtue of their nature and size. Only those restructuring costs that result in a permanent reduction in capabilities are treated as non-recurring. Non-recurring costs are included under the statutory classification appropriate to their nature but are separately disclosed on the face of the income statement to assist in understanding the financial performance of the Group and the Company.
Share capitalOrdinary shares are classified as equity. Incremental costs directly attributable to the issue of new shares or options are shown in equity as a deduction from the proceeds, net of tax.
Financial instrumentsFinancial assets and financial liabilities are recognised in the Group’s statement of financial position when the Group becomes a party to the contractual provisions of the instrument.
Financial assetsAll financial assets are recognised and derecognised on a trade date where the purchase or sale of a financial asset is under a contract whose terms require delivery of the financial asset within the time frame established by the market concerned, and are initially measured at fair value, plus transaction costs except for those financial assets classified as fair value through profit or loss which are initially measured at fair value.
Financial assets are classified into the following specified categories: financial assets ‘at fair value through profit or loss’, ‘held-to-maturity’ investments, ‘available-for-sale’ financial assets and ‘loans and receivables’. The classification depends on the nature and purpose of the financial assets and is determined at the time of initial recognition.
Effective interest methodThe effective interest method is a method of calculating the amortised cost of a financial asset or liability and of allocating interest income or expense over the relevant period. The effective interest rate is the rate that exactly discounts estimated future cash payments through the expected life of the financial asset/liability, or, where appropriate, a shorter period, to the net carrying amount on initial recognition.
Financial assets at ‘fair value through profit or loss’ (‘FVTPL’)Financial assets are classified as at FVTPL when the financial asset is either held for trading or it is designated as at FVTPL. Financial assets at FVTPL are stated at fair value, with any gains or losses arising on remeasurement recognised in profit or loss. The net gain or loss recognised in profit or loss incorporates any dividend or interest earned on the financial asset.
Annual Report and Accounts 2017 Stock code: VLX
Volex plc74
Notes to the Financial Statements continuedFor the 52 weeks ended 2 April 2017 (52 weeks ended 3 April 2016)
Volex AR2017 Financials.indd 74 22/06/2017 11:57:13

25431.02 22 June 2017 11:48 AM Proo 8
2. Significant accounting policies continuedHeld-to-maturity investmentsHeld-to-maturity investments are non-derivative financial assets with fixed or determinable payments and fixed maturity dates that the Group has the positive intent and ability to hold to maturity. Subsequent to initial recognition, held-to-maturity investments are measured at amortised cost using the effective interest method less any impairment.
Available-for-sale financial assets (‘AFS’)AFS financial assets are non-derivatives that are either designated as AFS or are not classified as (a) loans and receivables, (b) held-to-maturity investments or (c) financial assets at fair value through profit or loss.
Changes in the carrying amount of AFS monetary financial assets relating to changes in foreign currency rates, interest income calculated using the effective interest method and dividends on AFS equity investments are recognised in profit or loss. Other changes in the carrying amount of available-for-sale financial assets are recognised in other comprehensive income and accumulated under the heading of investments revaluation reserve. Where the investment is disposed of or is determined to be impaired, the cumulative gain or loss previously accumulated in the investments revaluation reserve is reclassified to profit or loss.
Loans and receivablesTrade receivables, loans and other receivables that have fixed or determinable payments that are not quoted in an active market are classified as ‘loans and receivables’. Loans and receivables are measured at amortised cost using the effective interest method less impairment. Interest is recognised by applying the effective interest rate, except for short term receivables when the recognition of interest would be immaterial.
Impairment of financial assetsFinancial assets are assessed for indicators of impairment at each reporting date. Financial assets are impaired where there is objective evidence that as a result of one or more events that occurred after the initial recognition of the financial asset, the estimated future cash flows of the investment have been impacted. For loans and receivables the amount of the impairment is the difference between the asset’s carrying amount and the present value of estimated future cash flows, discounted at the original effective interest rate.
The carrying amount of the financial asset is reduced by the impairment loss directly for all financial assets with the exception of trade receivables where the carrying amount is reduced through the use of an allowance account. A provision for impairment of trade receivables is recognised in the income statement within operating expenses. When a trade receivable is uncollectable, it is written off against the allowance account. Subsequent recoveries of amounts previously written off are credited against operating expenses in the income statement.
Derecognition of financial assetsThe Group derecognises a financial asset only when the contractual rights to the cash flows from the asset expire, or when it transfers the financial asset and substantially all the risks and rewards of ownership of the asset to another entity. If the Group neither transfers nor retains substantially all the risks and rewards of ownership and continues to control the transferred asset, the Group recognises its retained interest in the asset and an associated liability for amounts it may have to pay. If the Group retains substantially all the risks and rewards of ownership of a transferred financial asset, the Group continues to recognise the financial asset and also recognises a collateralised borrowing for the proceeds received.
Financial liabilities and equity Debt and equity instruments are classified as either financial liabilities or as equity in accordance with the substance of the contractual arrangement.
Financial liabilitiesFinancial liabilities are classified as either financial liabilities ‘at fair value through profit or loss’ or other financial liabilities.
Financial liabilities at fair value through profit or lossFinancial liabilities at fair value through profit or loss are initially measured at fair value and subsequently stated at fair value, with any resultant gain or loss recognised in profit or loss. The net gain or loss recognised in profit or loss incorporates any interest paid on the financial liability.
Other financial liabilitiesOther financial liabilities are initially measured at fair value, net of transaction costs. Other financial liabilities are subsequently measured at amortised cost using the effective interest method, with interest expense recognised on an effective yield basis.
Derecognition of financial liabilitiesThe Group derecognises financial liabilities when, and only when, the Group’s obligations are discharged, cancelled or they expire.
www.volex.com
75Volex plc
FINANCIAL STATEMENTS
Volex AR2017 Financials.indd 75 22/06/2017 11:57:14

25431.02 22 June 2017 11:48 AM Proof 8
2. Significant accounting policies continuedDerivative financial instrumentsThe Group’s activities expose it to the financial risks of changes in foreign exchange rates, interest rates and commodity prices. The Group enters into a variety of derivative financial instruments to manage its exposure to these risks. The use of financial derivatives is governed by a Group policy approved by the Board of Directors which provides written principles on the use of financial derivatives to hedge certain risk exposures. The Group does not use derivative financial instruments for speculative purposes. Further details of derivative financial instruments are disclosed in note 29 to the financial statements.
Derivatives are initially recognised at fair value on the date a derivative contract is entered into and are subsequently remeasured to their fair value at each reporting date. The resulting gain or loss is recognised in profit or loss immediately unless the derivative is designated and effective as a hedging instrument, in which event, the timing of the recognition in profit or loss depends on the nature of the hedge relationship. The Group designates certain derivatives as either fair value hedges, cash flow hedges or hedges of net investments in foreign operations.
A derivative is classified as a non-current asset or a non-current liability if the remaining maturity of the instrument is more than 12 months and it is not expected to be realised or settled within 12 months. Other derivatives are presented as current assets or current liabilities.
Hedge accountingThe Group designates certain hedging instruments, which include derivatives and non-derivatives in respect of foreign currency and commodity risk as either cash flow hedges or hedges of net investments in foreign operations.
At the inception of the hedge relationship the entity documents the relationship between the hedging instrument and hedged item, along with its risk management objectives and its strategy for undertaking various hedge transactions. Furthermore, at the inception of the hedge and on an ongoing basis, the Group documents whether the hedging instruments that are used in hedging transactions are highly effective in offsetting changes in fair values or cash flows of hedged items.
Cash flow hedgeHedges of foreign exchange risk on firm commitments are accounted for as cash flow hedges. Similarly, commodity derivative contracts which are entered into to mitigate commodity price fluctuations on firm purchasing commitments are accounted for as cash flow hedges.
The effective portion of changes in the fair value of derivatives that are designated and qualify as cash flow hedges is recognised in other comprehensive income. The gain or loss relating to the ineffective portion is recognised immediately in profit or loss.
Hedges of net investments in foreign operationsAny gain or loss on the hedging instrument relating to the effective portion of the hedge is recognised in other comprehensive income and accumulated in the hedging and translation reserve. The gain or loss relating to the ineffective portion is recognised immediately in profit or loss.
Gains and losses deferred in the hedging and translation reserve are recognised immediately in profit or loss when the foreign operation is disposed of.
Critical judgements and estimates in applying the accounting policiesThe preparation of financial statements in conformity with IFRSs requires the use of certain critical accounting estimates. It also requires management to exercise its judgement in the process of applying the Group’s accounting policies. The Directors consider the following to be the key judgements and estimates that have the most significant effect on the amounts recognised in the financial statements.
Annual Report and Accounts 2017 Stock code: VLX
Volex plc76
Notes to the Financial Statements continuedFor the 52 weeks ended 2 April 2017 (52 weeks ended 3 April 2016)
Volex AR2017 Financials.indd 76 22/06/2017 11:57:14

25431.02 22 June 2017 11:48 AM Proo 8
2. Significant accounting policies continued Non-recurring items The Group identifies significant non-recurring items separately in order to be able to compare trading performance year on year and in comparison with other businesses. During the period under review the items identified in this way totalling $15,232,000 (2016: $4,742,000) comprised impairment of long lived assets, restructuring costs where roles were not replaced, consultancy costs associated with a specific, one-off manufacturing optimisation project and movements in onerous lease provisions. See note 4 for further details.
Impairment of long lived assetsAs at 2 April 2017, the Group had experienced a downturn in its Power Cords business of 18.2%. This was primarily in relation to the Group’s largest customer and followed a number of years over which that customer’s revenues had reduced and margins declined. Due to the significant plant & machinery and capitalised tooling associated with this customer an impairment assessment was conducted. This assessment considered future performance (including the budget for the forthcoming year and longer term forecasts), the transferability of certain fixed assets between customers and products and potential asset resale value. Based upon these assumptions an impairment charge of $11,987,000 (2016: $900,000) was booked in the Power Cords division and identified as a non-recurring item. A further $504,000 (2016: $598,000) was recognised in the Cable Assemblies division in relation to the closure of the Brazil operations.
Inventory provisionsInventories are carried at the lower of cost and net realisable value, which is calculated as the estimated sales proceeds less costs of sale. Factors considered in the determination of net realisable value are the ageing, category and condition of inventories, recent inventory utilisation and forecasts of projected inventory utilisation. Reviews of provisions held against damaged, obsolete and slow moving inventory are carried out at least quarterly by management and these reviews require the application of judgement and estimates. Changes to these estimates could result in changes to the net valuation of inventory. At 2 April 2017, the Group had net inventories of $36,040,000 (2016: $41,505,000).
TaxationThe Group operates in a large number of different tax jurisdictions. The Directors are required to exercise significant judgement in determining the Group’s provision for taxes. Amounts provided are based on management’s interpretation of country specific tax law. Tax benefits are not recognised unless the tax positions are capable of being sustained. In arriving at this position, management reviews each material tax benefit to assess whether a provision should be taken against full recognition of the benefit.
Deferred tax assets and liabilities require management judgement in determining the amounts to be recognised. In particular, significant judgement is used when assessing the extent to which deferred tax assets should be recognised, with consideration given to the timing and level of future taxable income, time limits on the availability of taxable losses for carry forward and any future tax planning strategies.
3. Segment InformationThe internal reporting provided to the Group’s Board for the purpose of resource allocation and assessment of Group performance is based upon the nature of the products supplied. In addition to the operating divisions, a Central division exists to capture all of the corporate costs incurred in supporting the operations.
Power Cords The sale and manufacture of electrical power products to manufacturers of electrical/electronic devices and appliances. These include laptop/desktop computers, printers, televisions, power tools and floor cleaning equipment.
Cable Assemblies The sale and manufacture of cables permitting the transfer of electronic, radio-frequency and optical data. These cables can range from simple USB cables to complex high speed cable assemblies. Data cables are used in numerous devices including medical equipment, data centres, telecoms networks and the automotive industry.
Central Corporate costs that are not directly attributable to the manufacture and sale of the Group’s products but which support the Group in its operations. Included within this division are the costs incurred by the executive management team and the corporate head office.
The Board believes that the segmentation of the Group based upon product characteristics allows it to best understand the Group’s performance and profitability.
www.volex.com
77Volex plc
FINANCIAL STATEMENTS
Volex AR2017 Financials.indd 77 22/06/2017 11:57:14

25431.02 22 June 2017 11:48 AM Proof 8
3. Segment Information continuedThe following is an analysis of the Group’s revenues and results by reportable segment.
52 weeks to 2 April 2017 52 weeks to 3 April 2016Revenue
$’000Profit/(loss)
$’000 Revenue
$’000Profit/(loss)
$’000 Power Cords 188,256 3,228 230,205 2,293Cable Assemblies 131,328 10,528 137,329 9,842Unallocated central costs – (4,677) – (4,963)Divisional results before share-based payments and non-recurring items 319,584 9,079 367,534 7,172Non-recurring operating items (15,232) (4,742)Share-based payment credit/(charge) (468) 1,009Operating profit/(loss) (6,621) 3,439Finance income 19 18Finance costs (1,898) (1,915)Profit/(loss) before taxation (8,500) 1,542Taxation 1,452 (3,854)Profit/(loss) after taxation (7,048) (2,312)
The accounting policies of the reportable segments are in accordance with the Group’s accounting policies.
The non-recurring items charge of $15,232,000 (2016: $4,742,000) was split $12,740,000 (2016: $1,802,000) to Power Cords, $1,754,000 (2016: $1,349,000) to Cable Assemblies and $738,000 (2016: $1,591,000) to Central.
Divisional profit represents the profit earned by each division before the allocation of central operating expenses, non-recurring items, share-based payments, finance income, finance costs and income tax expense. This is the measure reported to the Group’s Board for the purpose of resource allocation and assessment of performance.
The divisional profits above are shown after the following charges for depreciation and amortisation:
Depreciation and amortisation2017$’000
2016$’000
Power Cords 3,981 5,077Cable Assemblies 1,237 1,358Central 150 745
5,368 7,180
Impairment charges recognised within non-recurring items are allocated between divisions as follows:
Impairment charge2017$’000
2016$’000
Power Cords 11,987 900Cable Assemblies 504 598Central – –
12,491 1,498
Asset and liability information is not provided to the Board on a divisional basis. In order to maximise the efficiency of asset utilisation, the Group’s assets are employed cross-division and the Board believes that there is no meaningful basis in which such assets and liabilities can be allocated.
Information about major customersTwo (2016: two) of the Group’s customers individually account for more than 10% of total Group revenue with the Group’s largest customer operating in the Power Cords division and accounting for 18% (2016: 26%) of total Group revenue. The other customer operates in the Cable Assemblies division and accounts for 17% (2016: 13%) of total Group revenue.
Annual Report and Accounts 2017 Stock code: VLX
Volex plc78
Notes to the Financial Statements continuedFor the 52 weeks ended 2 April 2017 (52 weeks ended 3 April 2016)
Volex AR2017 Financials.indd 78 22/06/2017 11:57:14

25431.02 22 June 2017 11:48 AM Proo 8
3. Segment Information continued Geographical informationThe Group’s revenue from external customers and information about its non-current assets (excluding deferred tax assets) by geographical location are provided below:
Revenue Non-current assets2017$’000
2016$’000
2017$’000
2016$’000
Asia (excluding India) 182,079 225,053 16,914 32,068North America 78,084 80,802 1,090 1,532Europe 52,752 50,305 3,179 3,614India 4,929 6,878 774 897South America 1,740 4,496 – 493
319,584 367,534 21,957 38,604
Revenue is attributed to countries on the basis of the geographical location of the Group entity recording the sale.
4. Non-recurring itemsGroup
2017$’000
2016$’000
Impairment/Product portfolio realignment 12,491 1,498Restructuring costs 1,656 2,693Manufacturing optimisation consultancy 815 –Movement in onerous lease provision 270 1,151Provision for historic sales tax claims – (600)Total non-recurring items 15,232 4,742
Following a further downturn in Power revenue (particularly with the Group’s largest customer) resulting in significant surplus capacity at our Power factories, a full review of the Group’s cost base was performed. As a result of this, the largest Power factory was downsized with one of the three available buildings returned to the landlord. This resulted in impairment of the associated fit-out costs. Further the number of production lines running in the remaining two buildings was reduced resulting in the impairment of the redundant plant, machinery and tooling. Finally, given the reduced sales from the largest customer and the already thin margins, the forecast profitability from the continuing lines was assessed and deemed insufficient to support the associated fixed asset cost base. As a consequence of the above factors, an impairment charge of $11,987,000 was recorded in the Power Cords division. In the Cable Assemblies division, $491,000 of impairment charge has been recorded following the closure of Volex Do Brasil Ltda.
During the current year, the Group has incurred $1,656,000 (2016: $2,693,000) of restructuring spend in response to the reduced revenues of the Group. The non-recurring cost can be split into several distinct elements:
• An operational element of $1,604,000 (2016: $1,372,000) which included reductions to the direct and indirect manufacturing headcount in a number of our factories following the downturn in volumes, the removal of certain middle-management roles and redundancies associated with the closure of our Brazil, Ireland, Austin and Jakarta operations.
• An executive and senior management change element of $52,000 (2016: $1,321,000). The current year charge relates to the departure of the Head of Engineering. The prior period charge relates to the departure of the Group Chief Executive Officer, the removal of the divisional management structure and the removal of certain other executive management positions (e.g. Chief Information Officer).
Following his appointment in November 2016, the Executive Chairman sought to address the production issues facing our factories across the globe in order to make them more cost competitive. To support the management function, an external manufacturing consultancy was employed on a fixed term contract of 9 months, to advise on manufacturing best practice and implementation. This contract expired in December 2016 and has therefore been classified as non-recurring. Costs associated with this contract totalled $815,000.
The Group has incurred an onerous lease charge in the period of $270,000 primarily in relation to the sub-let of a property in North America. The sub-lease is for the full head lease term and mirrors the head lease clauses with the exception of an initial quarter rent free period. The prior year charge of $1,151,000 followed a revision to underlying assumptions included in the provision calculation of a UK onerous property. The lease on this UK property was exited in the current year with a $50,000 credit arising from the release of surplus provision.
Several years ago, the Group booked a $1,100,000 provision against a recoverable sales tax asset held in its Indian subsidiary since doubt existed over the full recovery of this asset. Subsequent to this decision, the Indian subsidiary’s trading performance had exceeded the then forecast. As a consequence, a greater amount of the asset has been recovered than initially believed possible. Following a reassessment of future recovery, $600,000 was released in the prior year.
www.volex.com
79Volex plc
FINANCIAL STATEMENTS
Volex AR2017 Financials.indd 79 22/06/2017 11:57:14

25431.02 22 June 2017 11:48 AM Proof 8
5. Finance incomeGroup
2017$’000
2016$’000
Interest on bank deposits 19 18
Finance income earned on financial assets was derived from loans and receivables (including cash and bank balances) only. No other gains or losses have been recognised in respect of loans and receivables other than those disclosed above and impairment losses recognised in respect of trade receivables (see note 17).
6. Finance costs
Notes
Group2017$’000
2016$’000
Interest on bank overdrafts and loans 1,208 1,192Net interest expense on defined benefit obligation 28 94 107Unwinding of discount on long term provisions 21 79 52Other 96 189Total interest costs 1,477 1,540Amortisation of debt issue costs 24 421 375Total finance costs 1,898 1,915
No gains or losses have been recognised on financial liabilities measured at amortised cost (including bank overdrafts and loans) other than those disclosed above.
Annual Report and Accounts 2017 Stock code: VLX
Volex plc80
Notes to the Financial Statements continuedFor the 52 weeks ended 2 April 2017 (52 weeks ended 3 April 2016)
Volex AR2017 Financials.indd 80 22/06/2017 11:57:15

25431.02 22 June 2017 11:48 AM Proo 8
7. Profit/loss for the periodProfit for the period has been arrived at after charging/(crediting):
Notes
Group2017$’000
2016$’000
Net foreign exchange (gain)/losses 126 194Research and development costs 3,303 2,948Depreciation of property, plant and equipment 14 4,927 6,162Impairment of property, plant and equipment 14 12,491 1,498Amortisation of intangible assets 13 441 1,018Cost of inventories recognised as an expense 191,656 223,478Write-down of inventories recognised as an expense 298 291Reversal of write-down of inventories recognised in the period – (8)Staff costs 9 68,605 78,172Impairment loss recognised on trade receivables 17 158 97Reversal of impairment losses recognised on trade receivables 17 (74) (57)Loss/(gain) on disposal of property, plant and equipment 61 25Operating lease payments 26 3,930 4,816
Research and development costs disclosed on the previous page comprise the following:
Group2017$’000
2016$’000
Employment costs 2,197 1,828Raw materials and consultancy 1,005 989Other 101 131
3,303 2,948
In the current year no development costs were capitalised. In the prior year $425,000 of development costs were capitalised in respect of a specific cable development for a key customer new product launch.
Reconciliation of operating profit/(loss) to underlying EBITDA (earnings before interest, tax, depreciation and amortisation), non-recurring items and share-based payment charge:
Group2017$’000
2016$’000
Operating profit/(loss) (6,621) 3,439Add back:Non-recurring items 15,232 4,742Share-based payment charge/(credit) 468 (1,009)Underlying operating profit 9,079 7,172Depreciation of property, plant and equipment 4,927 6,162Amortisation of acquired intangible assets 441 1,018Underlying EBITDA 14,447 14,352
www.volex.com
81Volex plc
FINANCIAL STATEMENTS
Volex AR2017 Financials.indd 81 22/06/2017 11:57:15

25431.02 22 June 2017 11:48 AM Proof 8
8. Auditors’ remunerationThe analysis of auditors’ remuneration is as follows:
Group2017$’000
2016$’000
Fees payable to the Company’s auditors for the audit of the Company’s annual financial statements 268 302Fees payable to the Company’s auditors and their associates for other audit services to the Group – the audit of the Company’s subsidiaries pursuant to legislation 284 279Total audit fees 552 581
Total non-audit fees – –
A description of the work of the Audit Committee is set out in the Audit Committee Report on pages 34 to 36 which includes an explanation of how the objectivity and independence of the auditors is safeguarded when the auditors provide non-audit services.
9. Staff costsThe average monthly number of employees (including Executive Directors) was:
Group2017
No. 2016
No. Production 5,598 6,307Sales and distribution 418 456Administration 372 421
6,388 7,184
Their aggregate remuneration comprised:
Group2017$’000
2016$’000
Wages and salaries 60,328 69,341Social security costs 7,514 9,273Share-based payment (credit)/charge (note 27) 468 (1,009)Other pension costs (note 28) 295 567
68,605 78,172
In addition to the above $1,421,000 (2016: $2,626,000) has been paid in severance costs. This is included within the restructuring cost of $1,656,000 (2016: $2,693,000) shown in note 4.
Details of Directors’ remuneration, share options, pension contributions, pension entitlements, fees for consulting services and interests for the period required by the Companies Act 2006 are provided in the audited part of the Directors’ Remuneration Report on pages 37 to 51 and form part of the financial statements.
2017No.
2016No.
Production 1 2Sales and distribution 2 2Administration 10 15
13 19
Company2017$’000
2016$’000
Wages and salaries 1,744 2,414Social security costs 231 399Share-based payment (credit)/charge (note 27) 468 (1,222)Other pension costs (note 28) 211 389
2,654 2,080
Annual Report and Accounts 2017 Stock code: VLX
Volex plc82
Notes to the Financial Statements continuedFor the 52 weeks ended 2 April 2017 (52 weeks ended 3 April 2016)
Volex AR2017 Financials.indd 82 22/06/2017 11:57:15

25431.02 22 June 2017 11:48 AM Proo 8
10. TaxationGroup
2017$’000
2016$’000
Current tax – expense for the period 1,328 3,376Current tax – adjustment in respect of previous periods (58) 452Total current tax 1,270 3,828Deferred tax – origination and reversal of temporary differences (note 20) (2,722) 26Income tax expense (1,452) 3,854
UK corporation tax is calculated at 20% (2016: 20%) of the estimated assessable profit for the period. Taxation for other jurisdictions is calculated at the rates prevailing in the respective jurisdictions.
The expense for the period can be reconciled to the profit/(loss) per the income statement as follows:
2017$’000
2017%
2016$’000
2016 %
Profit/(loss) before tax (8,500) 100 1,542 100Tax at the UK corporation tax rate (1,700) 20 308 20Tax effect of expenses that are not deductible and income that is not taxable in determining taxable profit 1,925 (23) 1,144 74Tax effect of non-utilisation of tax losses 2,114 (25) 2,056 134Adjustment in respect of previous periods (58) 1 452 29Effect of different tax rates of subsidiaries operating in other jurisdictions 812 (10) 1,358 88Tax effect of recognised deferred tax (2,722) 32 26 2Tax effect of loss utilisation (1,609) 19 (1,402) (91)Tax expense and effective tax rate for the period before non-recurring items and share-based payments (1,238) 15 3,942 256Tax effect of non-recurring items and share-based payments (214) 3 (88) (6)Tax expense and effective tax rate for the period (1,452) 17 3,854 250
www.volex.com
83Volex plc
FINANCIAL STATEMENTS
Volex AR2017 Financials.indd 83 22/06/2017 11:57:16

25431.02 22 June 2017 11:48 AM Proof 8
11. Earnings/(loss) per Ordinary shareThe calculation of the basic and diluted earnings per share is based on the following data:
Notes
Group2017$’000
2016$’000
Profit/(loss) for the purpose of basic and diluted earnings/(loss) per share being net profit attributable to equity holders of the parent (7,048) (2,312)Adjustments for:Non-recurring items 4 15,232 4,742Share-based payment charge/(credit) 27 468 (1,009)Tax effect of above adjustments (214) (88)Underlying earnings/(loss) 8,438 1,333
No. shares No. sharesWeighted average number of Ordinary shares for the purpose of basic earnings per share 88,956,532 88,956,532Effect of dilutive potential Ordinary shares/share options 281,330 27,370Weighted average number of Ordinary shares for the purpose of diluted earnings per share 89,237,862 88,983,902
Due to the Group loss for the year, all share options are anti-dilutive and are therefore excluded from the diluted basic loss per share calculation and underlying basic earnings per share.
Basic earnings per share2017
cents2016 cents
Basic earnings/(loss) per share (7.9) (2.6)Adjustments for:Non-recurring items 17.1 5.3Share-based payment charge/(credit) 0.5 (1.1)Tax effect of above adjustments (0.2) (0.1)Underlying basic earnings/(loss) per share 9.5 1.5
Diluted earnings per share2017
cents2016 cents
Diluted earnings/(loss) per share (7.9) (2.6)Adjustments for:Non-recurring items 17.1 5.3Share-based payment charge/(credit) 0.5 (1.1)Tax effect of above adjustments (0.2) (0.1)Underlying diluted earnings/(loss) per share 9.5 1.5
The underlying earnings/(loss) per share has been calculated on the basis of profit/(loss) before non-recurring items and share-based payments, net of tax. The Directors consider that this calculation gives a better understanding of the Group’s earnings/(loss) per share in the current and prior period.
Annual Report and Accounts 2017 Stock code: VLX
Volex plc84
Notes to the Financial Statements continuedFor the 52 weeks ended 2 April 2017 (52 weeks ended 3 April 2016)
Volex AR2017 Financials.indd 84 22/06/2017 11:57:16

25431.02 22 June 2017 11:48 AM Proo 8
12. GoodwillGroup
2017$’000
2016$’000
CostAt the beginning of the period 5,394 5,667Exchange differences (644) (273)At the end of the period 4,750 5,394Accumulated impairment lossesAt the beginning of the period 2,653 2,787Exchange differences (317) (134)At the end of the period 2,336 2,653Carrying amount at the end of the period 2,414 2,741Carrying amount at the beginning of the period 2,741 2,880
Goodwill acquired in a business combination is allocated, at acquisition, to the business units that are expected to benefit from that business combination. After recognition of impairment losses, the carrying amount of goodwill had been allocated as follows:
2017$’000
2016$’000
Volex North America 1,793 2,035Volex Europe 555 631Volex India 66 75
2,414 2,741
The Group annually tests goodwill for impairment, or more frequently if there are indications that goodwill might be impaired. The recoverable amount of goodwill is determined from value in use calculations. The key assumptions used in the value in use calculations are those regarding the discount rates, revenue and costs growth. Management estimates discount rates using pre-tax rates that reflect current market assessments of the time value of money and the risks specific to the business unit. The growth rates are based upon industry growth forecasts.
The Group prepares cash flow forecasts derived from the most recently approved annual budget and the divisional long term forecasts. No growth has been forecast subsequent to March 2020.
The rate used to discount the forecast cash flows is a pre-tax discount rate of 14.1% (2016: 15.0%), which reflects the Group’s estimated cost of capital.
www.volex.com
85Volex plc
FINANCIAL STATEMENTS
Volex AR2017 Financials.indd 85 22/06/2017 11:57:16

25431.02 22 June 2017 11:48 AM Proof 8
13. Other intangible assets
Group
Acquired patents
$’000
Capitalised development
costs $’000
Software and licences
$’000 Total
$’000CostAt 5 April 2015 1,427 3,017 5,277 9,721Additions – 425 201 626Disposals – – (59) (59)Exchange differences (69) (118) (191) (378)At 3 April 2016 1,358 3,324 5,228 9,910Additions – – 68 68Disposals – – (369) (369)Exchange differences (162) (278) (401) (841)At 2 April 2017 1,196 3,046 4,526 8,768Accumulated amortisation and impairmentAt 5 April 2015 1,427 2,449 4,458 8,334Amortisation charge for the period – 269 749 1,018Disposals – – (59) (59)Exchange differences (69) (118) (182) (369)At 3 April 2016 1,358 2,600 4,966 8,924Amortisation charge for the period – 269 172 441Disposals – – (369) (369)Exchange differences (162) (278) (381) (821)At 2 April 2017 1,196 2,591 4,388 8,175Carrying amountAt 2 April 2017 – 455 138 593At 3 April 2016 – 724 262 986At 5 April 2015 – 568 819 1,387
The capitalised development costs balance primarily relates to a Power Cord product range, the “V-Novus” range, which was developed in FY2015 and is now in commercial production. The capitalised balance included engineering hours directly attributable to the product and safety certification costs. The asset is being amortised over the projected commercial life of the range.
In the prior period, the Power Cords division also developed a new cable for one of its largest customers. Significant engineering time was involved in the design and production of this cable and this time along with raw materials consumed in the development process were capitalised. The cable is now in commercial production and the asset has been fully amortised in the current year.
Computer software is amortised over the estimated useful life, not exceeding five years. The amortisation charge for the period is fully expensed within operating expenses.
Company
Software and licences2017$’000
2016$’000
CostAt the beginning of the period 3,297 3,274Additions 47 179Exchange differences (400) (156)At the end of the period 2,944 3,297Accumulated amortisationAt the beginning of the period 3,098 2,533Amortisation charge for the period 143 718Exchange differences (382) (153)At the end of the period 2,859 3,098Carrying amount at the end of the period 85 199Carrying amount at the beginning of the period 199 741
Annual Report and Accounts 2017 Stock code: VLX
Volex plc86
Notes to the Financial Statements continuedFor the 52 weeks ended 2 April 2017 (52 weeks ended 3 April 2016)
Volex AR2017 Financials.indd 86 22/06/2017 11:57:16

25431.02 22 June 2017 11:48 AM Proo 8
14. Property, plant and equipment
Group
Long leasehold buildings
$’000
Plant and machinery
$’000 Total
$’000CostAt 5 April 2015 15,629 60,317 75,946Additions 122 5,894 6,016Disposals – (558) (558)Exchange differences (80) (530) (610)At 3 April 2016 15,671 65,123 80,794Additions 327 2,091 2.418Disposals (3,115) (6,713) (9,828)Exchange differences (23) (32) (55)At 2 April 2017 12,860 60,469 73,329Accumulated depreciation and impairmentAt 5 April 2015 6,899 33,815 40,714Depreciation charge for the period 1,302 4,860 6,162Impairment loss – 1,498 1,498Disposals – (511) (511)Exchange differences (58) (349) (407)At 3 April 2016 8,143 39,313 47,456Depreciation charge for the period 1,002 3,925 4,927Impairment loss 442 12,049 12,491Disposals (3,104) (6,462) (9,566)Exchange differences (13) (51) (64)At 2 April 2017 6,470 48,774 55,244Carrying amountAt 2 April 2017 6,390 11,695 18,085At 3 April 2016 7,528 25,810 33,338At 5 April 2015 8,730 26,502 35,232
At 2 April 2017, the Group had $829,000 (2016: $1,321,000) contractual commitments for the acquisition of property, plant and equipment.
Of the $4,927,000 (2016: $6,162,000) depreciation charge for the period, $4,604,000 (2016: $5,666,000) was expensed through cost of sales and $323,000 (2016: $496,000) was expensed through operating expenses. The impairment charge of $12,491,000 (2016: $1,498,000) was expensed as a non-recurring item (see note 4).
Company
Plant and machinery2017$’000
2016$’000
CostAt the beginning of the period 466 490Exchange differences (56) (24)At the end of the period 410 466Accumulated depreciation and impairmentAt the beginning of the period 454 451Depreciation charge for the period 7 27Exchange differences (55) (24)At the end of the period 406 454Carrying amount at the end of the period 4 12Carrying amount at the beginning of the period 12 39
www.volex.com
87Volex plc
FINANCIAL STATEMENTS
Volex AR2017 Financials.indd 87 22/06/2017 11:57:17

25431.02 22 June 2017 11:48 AM Proof 8
15. InvestmentsThe Company’s fixed asset investments comprise investments in wholly-owned subsidiary undertakings and permanent loans as follows:
CompanyShares $’000
Loans $’000
Total $’000
CostAt 5 April 2015 51,225 101,221 152,446Additions – 1,136 1,136Repayment – (8,524) (8,524)Exchange differences (2,466) (474) (2,940)At 3 April 2016 48,759 93,359 142,118Additions – 2,490 2,490Repayment – (11,411) (11,411)Exchange differences (5,818) (3,399) (9,217)At 2 April 2017 42,941 81,039 123,980Accumulated depreciation and impairmentAt 5 April 2015 7,552 10,295 17,847Impairment – 907 907Exchange differences (364) 301 (63)At 3 April 2016 7,188 11,503 18,691Impairment 161 – 161Exchange differences (858) (127) (985)At 2 April 2017 6,491 11,376 17,867Carrying amountAt 2 April 2017 36,450 69,663 106,113At 3 April 2016 41,571 81,856 123,427At 5 April 2015 43,673 90,926 134,599
In the United Kingdom, the Company includes an operational division, Volex Powercords Europe. Details of the Company’s subsidiary undertakings are set out on page 106. Investments in subsidiaries are all stated at cost less provision for impairment.
All loans are carried at amortised cost. In the 52 weeks to 2 April 2017, the Company loans with Volex Group Holdings Limited and Volex Poland SP z.o.o accrued interest at 2.4% and 6% respectively. All other loans did not accrue interest. Repayments were also received from Volex Inc.
16. InventoriesGroup Company
2017$’000
2016$’000
2017$’000
2016$’000
Raw materials 15,825 17,276 – –Work-in-progress – 60 – –Finished goods 20,215 24,169 1,844 2,032
36,040 41,505 1,844 2,032
Annual Report and Accounts 2017 Stock code: VLX
Volex plc88
Notes to the Financial Statements continuedFor the 52 weeks ended 2 April 2017 (52 weeks ended 3 April 2016)
Volex AR2017 Financials.indd 88 22/06/2017 11:57:17

25431.02 22 June 2017 11:48 AM Proo 8
17. Trade and other receivables
Trade receivables
Group Company2017$’000
2016$’000
2017$’000
2016$’000
Amounts receivable for the sale of goods 54,056 55,822 2,214 1,990Allowance for doubtful debts (608) (612) – –
53,448 55,210 2,214 1,990
Other receivablesAmounts due from Group undertakings – – 7,210 18,660Other debtors 6,892 7,658 81 244Prepayments 1,654 2,259 142 454
8,546 9,917 7,433 19,358
Due for settlement within 12 months 7,703 8,378 7,416 19,329Due for settlement after 12 months 843 1,539 17 29
8,546 9,917 7,433 19,358
Trade receivables are classified as loans and receivables and are therefore measured at amortised cost. All inter-company balances are interest free and repayable on demand.
The Directors consider that the carrying amount of trade and other receivables approximates their fair value.
Two (2016: two) of the Group’s customers individually account for more than 10% of total Group revenue. The largest customer operates in the Power Cords division and accounts for 18% (2016: 26%) of total Group revenue. The other customer operates in the Cable Assemblies division and accounts for 17% (2016: 13%) of total Group revenue. Other than these customers, the Group has no significant concentration of credit risk, with exposure spread over a large number of counterparties and customers. At 2 April 2017, these two customers represented 29% of the net trade receivables (2016: 30%).
The average credit period taken on sales of goods is 65 days (2016: 63 days). An allowance has been made for estimated irrecoverable amounts from the sale of goods. This allowance has been determined by reference to past default experience and an analysis of the counterparty’s current financial position.
Included in trade receivables are receivables with a carrying value of $9,074,000 (2016: $7,865,000) and $396,000 (2016: $212,000) for the Group and Company respectively which are past due at the reporting date for which no provision has been made as there has not been a significant change in credit quality and the amounts are still considered recoverable. The Group and Company do not hold any collateral over these balances.
Ageing of past due but not impaired receivables
Group Company2017$’000
2016$’000
2017$’000
2016$’000
0–60 days 8,416 7,371 373 21260–90 days 373 222 16 –90–120 days 147 45 7 –120+ days 138 227 – –
9,074 7,865 396 212
www.volex.com
89Volex plc
FINANCIAL STATEMENTS
Volex AR2017 Financials.indd 89 22/06/2017 11:57:17

25431.02 22 June 2017 11:48 AM Proof 8
17. Trade and other receivables continued
Movement in the allowance for doubtful debts
Group Company2017$’000
2016$’000
2017$’000
2016$’000
Balance at the beginning of the period 612 651 – –Amounts written off during the period (71) (72) – –Amounts recovered during the period (20) – – –Increase/(decrease) in allowance recognised in profit or loss 84 40 – –Exchange differences 3 (7) – –Balance at the end of the period 608 612 – –
Of the $84,000 charge recognised in the income statement, $77,000 is included within non-recurring items as it relates to the write off of debt in Volex do Brasil Ltda following its closure during the year.
In determining the recoverability of trade receivables, the Group considers any change in the credit quality of the trade receivable from the date credit was initially granted up to the reporting date. With the exception of the two customers noted above, the concentration of credit risk is limited due to the customer base being large and unrelated. Accordingly, the Directors believe that there is no further credit provision required in excess of the allowance for doubtful debts.
Ageing of impaired trade receivables
Group Company2017$’000
2016$’000
2017$’000
2016$’000
0–60 days – – – –60–90 days – – – –90–120 days 13 3 – –120+ days 595 609 – –
608 612 – –
18. BorrowingsGroup Company
2017$’000
2016$’000
2017$’000
2016$’000
Unsecured borrowings at amortised costBank overdrafts – 5,164 6,068 11,934Secured borrowings at amortised costBank loans 18,230 28,823 2,510 6,058Total borrowings at amortised cost 18,230 33,987 8,578 17,992
Amount due for settlement within 12 months – 5,164 6,068 11,934Amount due for settlement after 12 months 18,230 28,823 2,510 6,058
18,230 33,987 8,578 17,992
The weighted average interest rates paid on the Group’s borrowings during the period were as follows:
2017%
2016%
Bank loans and overdrafts 2.7 2.5
Annual Report and Accounts 2017 Stock code: VLX
Volex plc90
Notes to the Financial Statements continuedFor the 52 weeks ended 2 April 2017 (52 weeks ended 3 April 2016)
Volex AR2017 Financials.indd 90 22/06/2017 11:57:18
25431.02 22 June 2017 11:48 AM Proo 8
18. Borrowings continuedDuring the 52 weeks ended 2 April 2017 the Group utilised a $45,000,000 multi-currency combined revolving overdraft and guarantee facility provided by a syndicate of three banks (Lloyds Banking Group plc, HSBC Bank plc and Clydesdale Bank plc – together ‘the Syndicate’).
The amount available under the facility at 2 April 2017 was $45,000,000 (2016: $45,000,000). The facility was secured by fixed and floating charges over the assets of certain Group companies.
The terms of the facility required the Group to perform quarterly financial covenant calculations with respect to leverage (adjusted net debt to adjusted rolling 12-month EBITDA) and interest cover (adjusted rolling 12-month EBITDA to adjusted rolling 12-month interest). Breach of these covenants could result in cancellation of the facility.
Post year end the facility has been extended to 30 June 2019. As part of the extension, Clydesdale Bank plc exited the syndicate with the total facility reducing from $45.0 million to $30.0 million. The leverage covenant has been amended to calculate using total debt rather than net debt with the ratios adjusted accordingly.
In the current year, professional fees of $582,000 were incurred during the period in relation to the one year extension of the facility. Of this $135,000 was paid to the Syndicate to agree to the extension. The $582,000 was capitalised and is being charged to the income statement on a straight line basis over the remaining period to facility expiry.
At 2 April 2017, the facility incurred interest at a margin of 2.79% (2016: 2.25%) above LIBOR.
Also drawn under the facilities, and not included above, are bonds, guarantees and letters of credit amounting to $1,613,000 (2016: $1,852,000).
Drawings under the facilities were made in various currencies. Total borrowings for the Group at 2 April 2017 can be analysed by currency as follows:
Group2017$’000
2016$’000
USD 3,000 (401)Euro 15,720 20,056Pound Sterling – 14,774
18,720 34,429Less: debt issue costs (note 24) (490) (442)
18,230 33,987
Undrawn borrowing facilitiesAt 2 April 2017, the Group had undrawn committed borrowing facilities available of $24,666,000 (2016: $8,718,000).
19. Trade and other payables
Trade payables
Group Company2017$’000
2016$’000
2017$’000
2016$’000
Trade payables 51,156 53,814 462 722
Other payablesAmounts owed to Group undertakings – – 50,186 62,818Other taxes and social security 3,420 3,116 118 90Accruals and deferred income 22,005 18,061 1,568 1,324
25,425 21,177 51,872 64,232
Due for settlement within 12 months 24,993 20,784 12,300 15,771Due for settlement after 12 months 432 393 39,572 48,461
25,425 21,177 51,872 64,232
Trade payables and accruals principally comprise amounts outstanding for trade purchases and ongoing costs. The average credit period taken for trade purchases is 87 days (2016: 84 days).
The Directors consider that the carrying amount of trade and other payables approximates to their fair value.
www.volex.com
91Volex plc
FINANCIAL STATEMENTS
Volex AR2017 Financials.indd 91 22/06/2017 11:57:18

25431.02 22 June 2017 11:48 AM Proof 8
20. Deferred taxGroupThe following are the major deferred tax assets and liabilities recognised by the Group and movements thereon during the current and prior reporting periods.
Unremitted earnings
$’000
Trading losses $’000
Accelerated tax
depreciation $’000
Other short term timing differences
$’000 Total
$’000At 5 April 2015 (2,184) 843 (23) 27 (1,337)(Charge)/credit to income – (26) 45 (45) (26)Exchange differences 52 6 – (5) 53At 3 April 2016 (2,132) 823 22 (23) (1,310)(Charge)/credit to income 639 2,083 – – 2,722Exchange differences 299 – – (2) 297At 2 April 2017 (1,194) 2,906 22 (25) 1,709
Certain deferred tax assets and liabilities have been offset. The following is the analysis of the deferred tax balances (after offset) for financial reporting purposes:
2017$’000
2016$’000
Deferred tax assets 2,948 823Deferred tax liabilities (1,239) (2,133)
1,709 (1,310)
At the balance sheet date, the group had unused tax losses of $139,155,000 (2016: $139,254,000) available for offset against future profits. During 2017 the group undertook a strategic review and as a consequence of this believes that some of the losses existing in the US will be utilised in the foreseeable future and as a result has recognised the tax value of these losses as a deferred tax asset, thus increasing the recognised deferred tax asset to $2,876,000 (2016: $769,000). Of this we expect to utilise $1,382,000 within the next 12 months. Included in unrecognised tax losses are losses of $40,758,000 (2016: $39,650,000) that cannot be carried forward indefinitely. Of this amount $12,142,000 (2016: $9,839,000) expires during the next five accounting periods. Other losses may be carried forward to future periods. The carrying amount of deferred tax assets is reviewed at each reporting date and recognised to the extent that it is probable that there are sufficient taxable profits to allow all or part to be recovered. Deferred tax assets have been recognised based on future forecast taxable profits.
At the reporting date a deferred tax liability of $1,194,000 (2016: $2,133,000) has been recognised relating to the unremitted earnings of overseas subsidiaries as the Group is able to control the reversal of these temporary differences and it is probable that they will reverse in the foreseeable future. The temporary differences at 2 April 2017 represent only the unremitted earnings of those overseas subsidiaries where remittance to the UK of those earnings may still result in a tax liability, principally as a result of dividend withhold taxes levied by the overseas tax jurisdictions in which those subsidiaries operate. The significant reduction in the deferred tax liability from 2016 results from losses arising in some of the overseas subsidiaries materially impacting their ability to pay a dividend.
CompanyAt the reporting date, the company had unused tax losses of $51,798,000 (2016: $75,130,000) available for offset against future profits. The company has not recognised any deferred tax assets in respect of these unused tax losses or other temporary differences as the future use of these assets is uncertain. The losses may be carried forward indefinitely.
Annual Report and Accounts 2017 Stock code: VLX
Volex plc92
Notes to the Financial Statements continuedFor the 52 weeks ended 2 April 2017 (52 weeks ended 3 April 2016)
Volex AR2017 Financials.indd 92 22/06/2017 11:57:18

25431.02 22 June 2017 11:48 AM Proo 8
21. Provisions
GroupProperty
$’000
Corporate restructuring
$’000Other $’000
Total $’000
At 5 April 2015 3,826 259 584 4,669Charge/(credit) in the period 1,151 (6) 142 1,287Utilisation of provision (1,652) (181) (343) (2,176)Unwinding of discount (note 6) 52 – – 52Exchange differences (83) (5) (27) (115)At 3 April 2016 3,294 67 356 3,717Charge/(credit) in the period (39) – 18 (21)Utilisation of provision (3,014) – (20) (3,034)Unwinding of discount (note 6) 79 – – 79Exchange differences (268) (3) (28) (299)At 2 April 2017 52 64 326 442Less: included in current liabilities 32 – 326 358Non-current liabilities 20 64 – 84
CompanyProperty
$’000
Corporate restructuring
$’000Other $’000
Total $’000
At 5 April 2015 3,236 99 173 3,508Charge/(credit) in the period 1,151 (6) – 1,145Utilisation of provision (1,255) (93) (173) (1,521)Unwinding of discount 49 – – 49Exchange differences (83) – – (83)At 3 April 2016 3,098 – – 3,098Charge/(credit) in the period (50) – – (50)Utilisation of provision (2,860) – – (2,860)Unwinding of discount 78 – – 78Exchange differences (234) – – (234)At 2 April 2017 32 – – 32Less: included in current liabilities 32 – – 32Non-current liabilities – – – –
Property provisionsDuring the 52 weeks ended 2 April 2017, the Group negotiated the early release from its contractual commitments under the lease on Greenfold Way (‘GFW’), the old UK headquarters and factory based in Leigh. In return for the early release, the Group paid a surrender premium of $2,481,000. At prior year end, an onerous lease provision was held against GFW and following this payment, surplus provision of $50,000 was released through the non-recurring items charge. The remaining provision of $32,000 has been retained to cover any incidental costs associated with this property.
In the prior year, following revisions to assumptions in the onerous lease provision calculations, a further $1,151,000 onerous lease charge was booked as a non-recurring item.
OtherOther provisions include the Directors’ best estimate, based upon past experience, of the Group’s liability under specific product warranties, purchase commitments and legal claims. The timing of the cash outflow with respect to these claims is uncertain.
www.volex.com
93Volex plc
FINANCIAL STATEMENTS
Volex AR2017 Financials.indd 93 22/06/2017 11:57:19

25431.02 22 June 2017 11:48 AM Proof 8
22. Share capital
Group and Company2017$’000
2016$’000
Issued and fully paid:90,251,892 (2016: 90,251,892) Ordinary shares of 25p each 39,755 39,755
Under the terms of the Group’s various share schemes, the following rights to subscribe for Ordinary shares are outstanding:
Number of sharesDate of grant Option price (p) Exercise period 2017 2016Performance Share Plan18 June 2015 25 June 2018 – June 2025 362,889 362,88931 March 2016 25 March 2019 – March 2026 2,809,139 3,468,9751 December 2016 25 December 2019 – December 2026 3,457,357 –23 February 2017 25 February 2020 – February 2027 990,512 –Deferred Bonus Plan18 June 2015 – June 2016 – December 2016 – 37,56618 June 2015 – June 2017 – December 2017 32,358 37,566
7,652,255 3,906,996
For further details of the Group’s share option schemes see note 27.
Post year end 470,588 shares have been awarded to the Executive Management Team in lieu of a cash bonus award. The shares vest in March 2018 providing continuous employment with the group.
23. Own shares and non-distributable reserves
Own shares2017$’000
2016$’000
At beginning and end of the period 867 867
The own shares reserve represents both the cost of shares in the Company purchased in the market and the nominal share capital of shares in the Company issued to the Volex Group plc Employee Share Trust to satisfy future share option exercises under the Group’s share option schemes (see note 27).
The number of Ordinary shares held by the Volex Group plc Employee Share Trust at 2 April 2017 was 1,295,360 (2016: 1,295,360). The market value of the shares as at 3 April 2016 was $660,000 (2016: $708,000).
Unless and until the Company notifies a trustee of the Volex Group plc Employee Share Trust, in respect to shares held in the trust in which a beneficial interest has not vested, rights to dividends in respect to the shares held in the trust are waived.
During the year no (2016: nil) shares were utilised on the exercise of share awards.
During the prior year the Volex Group Guernsey Purpose Trust was closed and all assets held at the time of closure transferred to Volex plc.
In December 2013, the Volex Group plc Employee Share Trust sold 3,378,582 shares at £1.16 per share to the open market. The average price of shares held by the Trust at the time was £0.70 with a number of the shares having been issued by Volex plc to the Trust at nominal value. In accordance with the Accounting Standards, the difference between the sales price of £1.16 and the average share price of £0.70 was recorded as a non-distributable reserve, giving rise to the $2,455,000 non-distributable reserve balance.
Annual Report and Accounts 2017 Stock code: VLX
Volex plc94
Notes to the Financial Statements continuedFor the 52 weeks ended 2 April 2017 (52 weeks ended 3 April 2016)
Volex AR2017 Financials.indd 94 22/06/2017 11:57:19

25431.02 22 June 2017 11:48 AM Proo 8
24. Analysis of net debt
Group
Cash and cash
equivalents $’000
Bank loans $’000
Debt issue costs $’000
Total $’000
At 5 April 2015 26,203 (25,159) 836 1,880Cash flow (1,377) (3,372) – (4,749)Exchange differences 748 (734) (19) (5)Amortisation of debt issue costs – – (375) (375)At 3 April 2016 25,574 (29,265) 442 (3,249)Cash flow 3,763 9,240 582 13,585Exchange differences 228 1,305 (113) 1,420Amortisation of debt issue costs – – (421) (421)At 2 April 2017 29,565 (18,720) 490 11,335
Debt issue costs relate to bank facility arrangement fees.
During the year $582,000 of professional fees were capitalised in relation to the one year extension obtained on the senior credit facility. The resulting debt issue cost is being amortised over the remaining life of the facility.
25. Notes to the statement of cash flowsGroup Company
2017$’000
2016$’000
2017$’000
2016$’000
Profit/(loss) for the period (7,048) (2,312) 5,612 (1,640)Adjustments for:Finance income (19) (18) (215) (432)Finance costs 1,898 1,915 502 (65)Income tax expense (1,452) 3,854 1 221Depreciation on property, plant and equipment 4,927 6,162 7 27Amortisation of intangible assets 441 1,018 143 718Impairment loss 12,491 1,498 – –(Gain)/loss on disposal of property, plant and equipment 61 25 – –Impairment of investments – – 161 907Share-based payment (credit)/charge 468 (1,009) 468 (1,123)(Decrease)/increase in provisions (3,837) (1,203) (3,672) (684)Effects of foreign exchange rate changes 407 126 (748) (262)Operating cash flow before movement in working capital 8,337 10,056 2,259 (2,333)(Increase)/decrease in inventories 5,382 1,897 184 215(Increase)/decrease in receivables 2,376 10,609 10,828 3,624Increase/(decrease) in payables 3,070 (14,433) (3,175) (3,943)Movement in working capital 10,828 (1,927) 7,837 (104)Cash generated from/(used in) operations 19,165 8,129 10,096 (2,437)Cash generated from/(used in) operations before operating non-recurring items 24,906 12,597 13,106 (676)Cash utilised by operating non-recurring items (5,741) (4,468) (3,010) (1,761)Taxation paid (2,102) (4,489) (16) (253)Interest paid (1,166) (1,842) (373) (820)Net cash generated from/(used in) operating activities 15,897 1,798 9,707 (3,510)
www.volex.com
95Volex plc
FINANCIAL STATEMENTS
Volex AR2017 Financials.indd 95 22/06/2017 11:57:19

25431.02 22 June 2017 11:48 AM Proof 8
25. Notes to the statement of cash flows continued Cash and cash equivalents
Group Company2017$’000
2016$’000
2017$’000
2016$’000
Cash and bank balances 29,565 30,738 40 4Bank overdrafts – (5,164) (6,068) (11,934)
29,565 25,574 (6,028) (11,930)
Cash and cash equivalents comprise cash held by the Group, short term bank deposits with an original maturity of three months or less and bank overdrafts. The carrying amount of these assets approximates their fair value. Included within cash and cash equivalents is $157,000 (2016: $178,000) held in trust which can only be used for Volex employees.
26. Operating lease arrangementsThe following have been recognised during the period:
Group Company2017$’000
2016$’000
2017$’000
2016$’000
Minimum lease payments made under operating leases Paid 7,238 5,863 3,011 999Recognised in operating profit 3,930 4,816 151 275
Payments made under operating leases net of sublease receipts and charged against the onerous lease provision in the period were $3,308,000 (2016: $1,047,000) for the Group and $2,860,000 (2016: $725,000) for the Company.
At the reporting date, the Group and Company had outstanding commitments for future minimum lease payments under non-cancellable operating leases, which fall due as follows:
Group Company2017$’000
2016$’000
2017$’000
2016$’000
Within one year 3,429 5,099 28 708In the second to fifth years inclusive 4,116 7,113 – 1,968After five years 1,826 3,275 – –
9,371 15,487 28 2,676
Operating lease payments primarily represent rentals payable by the Group for its office and manufacturing properties. Leases are negotiated for an average term of three years (2015: four years).
At the reporting date, the Group had contracted with tenants under non-cancellable subleases for the following future minimum lease payments:
Group Company2017$’000
2016$’000
2017$’000
2016$’000
Within one year 468 355 – –In the second to fifth years inclusive 1,872 – – –After five years 819 – – –
3,159 355 – –
Annual Report and Accounts 2017 Stock code: VLX
Volex plc96
Notes to the Financial Statements continuedFor the 52 weeks ended 2 April 2017 (52 weeks ended 3 April 2016)
Volex AR2017 Financials.indd 96 22/06/2017 11:57:20

25431.02 22 June 2017 11:48 AM Proo 8
27. Share-based paymentsGroup
2017$’000
2016$’000
Share-based payment charge/(credit) 436 (1,041)National insurance charge/(credit) in relation to share awards 32 32
468 (1,009)
During the period the Group had two types of equity-settled share option schemes in operation: a Performance Share Plan (‘PSP’) and a Deferred Bonus Plan (‘DBP’).
Options issued under the PSP are exercisable between three and ten years from the date of grant, subject to the continued employment of the participant and achievement of performance targets. All awards under the PSP have an exercise price of 25p, which is equivalent to the nominal value of the underlying Ordinary share. Full details of how the scheme operates are explained on page 39 of the Directors’ Remuneration Report.
The DBP shares are nil cost and vest, subject to continued employment, after a predetermined length of time.
Details of the share awards outstanding and the weighted average exercise price of those awards are as follows:
2017 2016
Number of share awards
Weighted average exercise price (p)
Number of share awards
Weighted average exercise price (p)
Outstanding at the beginning of the period 3,906,996 25 3,557,757 20Granted during the period 4,510,148 25 3,947,608 24Exercised during the period (32,358) – – –Expired during the period (732,531) (25) (3,598,369) (20)Outstanding at the end of the period 7,652,255 25 3,906,996 25Exercisable at the end of the period – – – –
Of the share awards that expired during the period, 732,531 (2016: 3,598,369) lapsed in respect of leavers and no options (2016: nil) expired due to failure to meet performance conditions.
The awards outstanding at 2 April 2017 had a weighted average remaining contractual life of nine years (2016: nine years).
Of the 7,652,255 awards outstanding at 2 April 2017, 7,619,897 had an exercise price of £0.25 and 32,358 had an exercise price of £nil.
Of the 3,906,996 awards outstanding at 3 April 2016, 3,831,864 had an exercise price of £0.25 and 75,132 had an exercise price of £nil.
The aggregate of the estimated fair values of the options granted during the period was $1,021,000 (2016: $1,265,000).
The fair value of awards granted in the period was calculated at the date of grant using a Monte Carlo binomial model or a Black-Scholes model, depending on the vesting criteria of each award. Valuation model inputs were as follows:
2017 2016Weighted average share price £0.42 £0.42Weighted average exercise price £0.25 £0.25Expected volatility 45% 50%Expected life (years) 3.50 3.50Risk-free rate 0.15% 0.52%Expected dividends 0.0% 0.0%
Expected volatility was determined with reference to historical volatility of the Group’s share price over the previous three years. The expected life used in the model has been adjusted, based on management’s best estimate, for the effects of non-transferability, exercise restrictions and behavioural considerations.
The DBP awards were valued at their market price on the day of grant, being £0.83 on 18 June 2015. Post year end 470,588 shares have been awarded to the Executive Management Team in lieu of a cash bonus award. The shares vest in March 2018 providing continuous employment with the group.
www.volex.com
97Volex plc
FINANCIAL STATEMENTS
Volex AR2017 Financials.indd 97 22/06/2017 11:57:20

25431.02 22 June 2017 11:48 AM Proof 8
28. Retirement benefit schemesDefined contribution schemesThe Company operates two HMRC approved defined contribution schemes and makes contributions to a Group pension plan. Overseas the Group operates three defined contribution schemes, one in the USA, one in Ireland and one in Brazil.
The total cost charged to the Group’s income statement in the period was $295,000 (2016: $567,000). The total cost charged to the Company’s income statement in the period was $211,000 (2016: $389,000).
Defined benefit schemesThe Company operates a UK defined benefit pension arrangement called the Volex Executive Pension Scheme (the ‘Scheme’). The Scheme provides benefits on retirement or death, based on final salary and length of service up to 31 March 2003 or earlier date of leaving service. Future accrual of retirement benefits under the scheme(s) ceased on 31 March 2003 when the scheme(s) were replaced with defined contribution arrangements.
The Scheme is subject to the Statutory Funding Objective under the Pensions Act 2004. A full actuarial valuation of the Scheme is carried out at least once every three years to determine whether the Statutory Funding Objective is met. As part of the process the Company must agree with the Trustee of the Scheme the contributions to be paid to address any shortfall against the Statutory Funding Objective. The last full actuarial valuation of the scheme was carried out by a qualified independent actuary on 31 July 2013, and the assumptions used and results from this valuation have been incorporated, as appropriate, in the following IAS 19 disclosures. This valuation has been updated on an approximate basis to 2 April 2017 and utilises the projected unit credit valuation method.
There were no scheme amendments, curtailments or settlements during the period.
The key assumptions utilised are:
Valuation at2017 2016
Discount rate 2.5% 3.4%Future pension increases 2.4% 2.0%Revaluation in deferment 2.4% 2.0%Inflation assumption (RPI) 3.4% 3.0%Inflation assumption (CPI) 2.4% 2.0%
The following mortality assumptions have been made:
2017 Years
2016 Years
Future life expectancy for a pensioner currently aged 65 – Male 22.7 22.9– Female 23.8 24.0Future life expectancy at age 65 for a non-pensioner currently aged 55 – Male 23.5 23.8– Female 24.7 24.9
Significant actuarial assumptions for the determination of the defined benefit obligation are discount rate, inflation and life expectancy. The sensitivity analysis below has been determined based on reasonably possible changes of the assumptions occurring at the end of the reporting period assuming that all other assumptions are held constant:
Assumption Change in assumption Impact on scheme liabilitiesDiscount rate Increase/decrease by 0.5% ($1,407,000)/$1,582,000Inflation Increase/decrease by 0.5% $1,026,000/($1,026,000)Life expectancy Increase/decrease by 1 year $807,000/($800,000)
In reality one might expect interrelationships between the assumptions, especially between discount rate and inflation. The above analysis does not take the effect of these interrelationships into account.
Amounts recognised in income statement (note 6)2017$’000
2016$’000
Interest cost (674) (758)Expected return on scheme assets 580 651Finance income/(costs) (94) (107)
Annual Report and Accounts 2017 Stock code: VLX
Volex plc98
Notes to the Financial Statements continuedFor the 52 weeks ended 2 April 2017 (52 weeks ended 3 April 2016)
Volex AR2017 Financials.indd 98 22/06/2017 11:57:20

25431.02 22 June 2017 11:48 AM Proo 8
28. Retirement benefit schemes continuedNo other amounts have been recognised in the income statement in the current or prior year.
An actuarial loss of $2,143,000 (2016: $405,000) has been reported in the statement of comprehensive income.
Cumulative actuarial gains/(losses) recognised in equity2017$’000
2016$’000
At the beginning of the period (1,565) (1,160)Net actuarial gains/(losses) recognised in the period (2,143) (405)At the end of the period (3,708) (1,565)
Amounts recognised in the statement of financial position2017$’000
2016$’000
Fair value of scheme assets 16,969 18,295Present value of defined benefit obligations (21,370) (21,625)Deficit in scheme recognised in the statement of financial position (4,401) (3,330)Current liabilities (719) (763)Non-current liabilities (3,682) (2,567)
(4,401) (3,330)
The Company has contributed $708,000 to its defined benefit pension plans in the period ended 2 April 2017 (2016: $681,000).
Movements in the present value of defined benefit obligations2017$’000
2016$’000
At the beginning of the period (21,625) (23,599)Interest cost (674) (758)Experience gain/(loss) on liabilities 13 –(Losses)/gains from changes to demographic assumptions 600 –Remeasurement gain/(loss) (3,417) 576Benefits paid 1,044 988Foreign exchange 2,689 1,168At the end of the period (21,370) (21,625)
Movements in the fair value of scheme assets2017$’000
2016$’000
At beginning of period 18,295 19,981Interest on assets 580 651Actuarial gains/(losses) 661 (981)Contributions from the sponsoring company 708 681Benefits paid (1,044) (988)Foreign exchange (2,231) (1,049)At end of period 16,969 18,295
Assets
Asset category2017$’000
2016$’000
Equity instruments 10,012 10,794Debt instruments 6,957 7,501Cash – –Total 16,969 18,295
None of the fair values of the assets shown above include any of the Company’s own financial instruments or any property occupied or other assets used by the Company (2016: $nil).
The actual return on scheme assets for the period was a gain of $1,228,000 (2016: a loss of $408,000).
The estimated amount of contributions expected to be paid to the scheme during the 52 weeks to 1 April 2018 is $719,000 (2016: $763,000).
www.volex.com
99Volex plc
FINANCIAL STATEMENTS
Volex AR2017 Financials.indd 99 22/06/2017 11:57:21

25431.02 22 June 2017 11:48 AM Proof 8
29. Financial instrumentsCapital risk managementThe Group manages its capital to ensure that entities in the Group will be able to continue as going concerns while maximising the return to stakeholders through the optimisation of the debt and equity balance.
The capital structure of the Group consists of debt, which includes the borrowings disclosed in note 18, cash and cash equivalents and equity attributable to equity holders of the parent, comprising issued capital, reserves and retained earnings as contained in the statement of changes in equity.
The Board reviews the capital structure on a regular basis including facility headroom, forecast working capital and capital expenditure requirements.
The Group has a multi-currency revolving credit facility (‘RCF’), which had an available limit of $45,000,000 as at 2 April 2017 (2016: $45,000,000). At this date the amounts drawn under this facility included term loans of $3,000,000 and €14,700,000 (2016: $6,500,000 and €20,000,000). Under the RCF, a cash pool facility exists denominated in a variety of currencies. At 2 April 2017, the cash pool was in a net cash position of $438,000 (2016: net overdraft of $5,164,000). The average combined utilisation during the period was $29,318,000 (2016: $37,096,000).
Included in note 18 is a description of undrawn facilities as at the reporting date.
The terms of the RCF require the Group to perform quarterly financial covenant calculations with respect to leverage (adjusted net debt to adjusted rolling 12-month EBITDA) and interest cover (adjusted rolling 12-month EBITDA to adjusted rolling 12-month interest). Breach of these covenants could result in cancellation of the facility.
Post year end, this facility has been extended and is due to expire on 30 June 2019. As part of this extension, the facility was reduced from $45,000,0000 to $30,000,000 and the covenant calculations redefined.
The Group’s forecast and projections, taking reasonable account of possible changes in trading performance, show that the Group should operate within the level of the contracted and committed facility for the period to June 2019 (the period considered for the Viability Statement) and should comply with covenants over this period. The Group also has access to and uses additional uncommitted facilities. Further, the Group has a number of mitigating actions available to it, should actual performance fall below the current financial forecasts. The Directors have the financial controls and monitoring available to them to put in place those mitigating actions in a timely fashion if they see the need to do so. The Board are therefore confident that the combination of the above facilities provides adequate liquidity headroom for the successful execution of the Group’s operations and that the Group will be able to operate in agreement with the required covenant levels.
The Group is not subject to externally imposed capital requirements.
Financial instrumentsThe Group’s principal financial instruments comprise bank borrowings and overdrafts, cash and short term deposits, trade and other receivables and trade and other payables. The Group also enters into derivative transactions, principally copper forward contracts to manage the commodity price risk arising from its operations and forward currency contracts to manage the currency risks arising from its operations.
Set out below is a comparison by category of carrying amounts and fair values of all the Group’s financial instruments that are carried in the financial statements. Except as detailed below, the Directors consider that the carrying amounts of the financial assets and financial liabilities recorded at amortised cost approximate their fair values.
Book value 2017$’000
Book value 2016$’000
Fair value 2017$’000
Fair value 2016$’000
Financial assets – loans and receivablesCash 29,565 30,738 29,565 30,738Trade and other receivables 58,339 56,594 58,339 56,594Financial liabilities – amortised costInterest-bearing loans and borrowings 18,230 (33,987) (18,720) (34,429)Trade and other payables (65,218) (70,960) (65,218) (70,960)Financial derivatives for which hedge accounting has been appliedDerivative financial instruments 402 68 402 68Financial derivatives for which hedge accounting has not been appliedDerivative financial instruments – – – –
The financial derivatives above fall into level 3, as defined by IFRS 7: Financial Instruments Disclosures. The fair value has been calculated as the present value of future cash flows estimated and discounted based on the applicable yield curves derived from quoted interest rates.
Annual Report and Accounts 2017 Stock code: VLX
Volex plc100
Notes to the Financial Statements continuedFor the 52 weeks ended 2 April 2017 (52 weeks ended 3 April 2016)
Volex AR2017 Financials.indd 100 22/06/2017 11:57:21

25431.02 22 June 2017 11:48 AM Proo 8
29. Financial instruments continuedFinancial risk managementThe Group’s Corporate Treasury function provides services to the business, co-ordinates access to domestic and international financing, monitors and manages the financial risks relating to the operations of the Group. These risks include market risk (interest rate risk, currency risk and commodity price risk), credit risk and liquidity risk.
The Group seeks to minimise these risks by using derivative financial instruments to hedge these risk exposures and external borrowings denominated in currencies that match the net asset currency profile of the Group. The Board reviews and agrees policies for managing these risks and they are summarised below. The Group also monitors the market price risk arising from all financial instruments. It is, and has been throughout the periods under review, the Group’s policy that no trading in financial instruments shall be undertaken.
Market riskThe Group’s activities expose it primarily to the financial risks of changes in interest rates, foreign currency exchange rates and copper commodity prices.
Interest rate riskThe Group’s interest rate risk arises principally from borrowings issued at variable rates which expose the Group to cash flow interest rate risk.
The following table sets out the carrying amount, by maturity, of the Group’s financial instruments that are exposed to interest rate risk:
2017
Within 1 year$’000
1—2 years $’000
2—3 years $’000
3—4 years $’000
4—5 years $’000
More than 5 years
$’000Total
$’000Fixed rateFloating rateCash assets 29,565 – – – – – 29,565Bank loans and borrowings – (18,230) – – – – (18,230)
2016
Within 1 year$’000
1—2 years $’000
2—3 years $’000
3—4 years $’000
4—5 years $’000
More than 5 years
$’000Total
$’000Fixed rateFloating rateCash assets 30,738 – – – – – 30,738Bank loans and borrowings (5,164) (28,823) – – – – (33,987)
Interest rate and sensitivityThe Group manages its exposure to interest rate risk by maintaining an appropriate mix between fixed and floating rate borrowings, and by the use of interest rate swap contracts. Hedging activities are evaluated regularly to align with interest rate views and defined risk appetite, ensuring the most cost effective hedging strategies are applied.
Management regularly review the interest rate risk exposure and are currently of the view that the Group should not fix its interest rate. At 2 April 2017, the Group is exposed to floating rate interest on borrowings at a margin of 2.79% (3 April 2016: 2.25%) above LIBOR.
Had interest rates been 0.5% higher/ 0.25% lower in the period, and all other variables were held constant, Group profit before tax would have been $139,000 lower/$70,000 higher (2016: $180,000 lower/$90,000 higher ). A 0.5% increase/0.25% decrease interest rate sensitivity test has been performed since this represents the Directors’ assessment of a reasonably possible change in interest rates.
Foreign currency riskThe Group operates internationally and is exposed to foreign exchange risk arising from various currency exposures, primarily with respect to the Euro and Pound Sterling. Foreign exchange risk arises from future commercial transactions, recognised assets and liabilities and net investments in foreign operations.
The Group has certain investments in foreign operations, whose net assets are exposed to foreign currency translation risk. The Group’s policy is to hedge its related translation exposures through the designation of certain amounts of its foreign currency denominated debt as a hedging instrument.
www.volex.com
101Volex plc
FINANCIAL STATEMENTS
Volex AR2017 Financials.indd 101 22/06/2017 11:57:21

25431.02 22 June 2017 11:48 AM Proof 8
29. Financial instruments continuedThe carrying amounts of the Group’s foreign currency denominated monetary assets and monetary liabilities at the reporting date are as follows:
Liabilities Assets2017$’000
2016$’000
2017$’000
2016$’000
USD 44,420 45,708 76,397 69,153Euro 20,456 23,528 5,404 3,253Chinese Renminbi 13,648 13,116 7,823 7,276Pound Sterling* 421 16,626 (8,079) 498Indian Rupee 290 778 2,685 2,414Other 4,262 5,267 4,076 4,881
* Under the RCF, a cash pool facility exists over two entities, denominated in a variety of currencies. At 2 April 2017, the overall cash pool was in a net cash position of $438,000 (2016: overdraft of $5,164,000), however, within the cash pool the GBP account was overdrawn by $8,508,000.
Foreign currency sensitivityThe following table details the Group’s sensitivity to a 10% increase and decrease in USD against the relevant foreign currencies. The 10% rate used represents management’s assessment of the reasonably possible change in foreign exchange rates. The sensitivity analysis includes only outstanding foreign currency denominated monetary items and adjusts their translation at the period end for a 10% change in foreign currency rates. The sensitivity analysis includes both external loans and loans to foreign operations within the Group where the denomination of the loan is in a currency other than the currency of the lender or the borrower. A 10% change in foreign exchange rate sensitivity test has been performed since this represents the Directors’ assessment of a reasonably possible change in foreign exchange rates.
GBP impact EURO impact2017$’000
2016$’000
2017$’000
2016$’000
10% depreciation of USD against foreign currency(i) Profit before tax (368) (633) (428) (587)(ii) Equity* (10,280) (11,344) (713) (1,271)10% appreciation of USD against foreign currency(i) Profit before tax 301 518 350 (479)(ii) Equity* 8,411 9,281 584 1,041
i. This is mainly attributable to the exposure on GBP/EURO monetary assets and liabilities in the Group at the reporting date.ii. This is mainly attributable to changes in the carrying value of external loans designated as a hedge of overseas investments and of intercompany loans for
which settlement is not planned.* Excludes any deferred tax impact.
Copper commodity price riskCopper price volatility is the single largest commodity price exposure facing the Group. Many of the Group’s products, in particular power cords used in the Power Cords division, are manufactured from components that contain significant amounts of copper. Where possible the Group will pass on copper price movements to its customers. In order to mitigate the remaining volatility associated with copper, the Group has entered into arrangements with its key suppliers to purchase copper. Coupled with these purchases, the Group has entered into a number of contracts with financial institutions which are linked to the average copper price as published by the London Metal Exchange (‘LME’). These contracts have been deemed cash flow hedges of forecast future copper purchases. At the reporting date, the open copper contracts are as follows:
Copper cash flow hedges 2017 2016
Contracted copper priceContracted
volume (MT)Fair value
$’000Contracted
volume (MT)Fair value
$’000$4,500 – $5,000 – – 300 9$5,000 – $5,500 – – 300 (85)$5,500 – $6,000 1,350 402 – –$6,000 – $6,500 – – – –
1,350 402 600 (76)
Of the contracts above, contracts over 250 MT with an aggregate fair value of $18,000 expire in more than 12 months.
Annual Report and Accounts 2017 Stock code: VLX
Volex plc102
Notes to the Financial Statements continuedFor the 52 weeks ended 2 April 2017 (52 weeks ended 3 April 2016)
Volex AR2017 Financials.indd 102 22/06/2017 11:57:22

25431.02 22 June 2017 11:48 AM Proo 8
29. Financial instruments continuedCredit riskThe Group’s principal financial assets are bank balances and cash, trade and other receivables. Credit risk refers to the risk that a counterparty will default on its contractual obligations resulting in financial loss to the Group.
Bank and cash balances comprise cash held by the Group and short term bank deposits with an original maturity of three months or less. The carrying amount of these assets approximates to their fair value. The credit risk on these assets is limited because the counterparties are predominantly financial institutions with investment grade credit ratings assigned by international credit rating agencies.
The Group’s credit risk is therefore primarily attributable to its trade receivables. The Group’s customers are predominantly large blue chip OEMs, contract equipment manufacturers and distributors. The Group regularly reviews the credit worthiness of significant customers and credit references are sought for major new customers where relevant. The Board recognises that credit risk is a feature of all businesses, especially international businesses. However, it believes that all reasonable steps to mitigate any loss are taken.
The net amount of trade receivables reflects the maximum credit exposure to the Group. No other guarantees or security have been given. For further information on the credit risk associated with trade and other receivables, see note 17.
Liquidity riskThe Group manages liquidity risk by maintaining adequate banking facilities, regular monitoring of forecast and actual cash flows and matching the maturity profiles of financial assets and liabilities. Included in note 18 is a description of undrawn facilities as at the reporting date.
In addition to the banking facilities available to the Group, the Group has access to a non-recourse invoice discounting facility. Under the terms of the arrangement, the Group can sell up to $15 million of trade receivables associated with a specific customer. As at 2 April 2017, the Group had utilised $2.3 million (2016: $5.0 million) of this facility.
The following table analyses the Group’s financial liabilities into relevant maturity groupings to show the timing of cash flows associated with the financial liabilities from the reporting date to the contracted maturity date. The amounts disclosed represent the contracted undiscounted cash flows (based on the earliest date on which the Group may be required to pay).
2017
Carrying amount
$’000
Contractual cash flows
$’000
Within 1 year $’000
1—2 years $’000
2—5 years $’000
More than 5 years
$’000Non-derivative financial liabilitiesTrade and other payables (65,218) (65,218) (64,797) – – (421)Bank overdrafts and loans (18,230) (18,720) – (18,720) – –Derivative financial liabilitiesCopper commodity contracts – – – – – –
2016
Carrying amount
$’000
Contractual cash flows
$’000
Within 1 year $’000
1—2 years $’000
2—5 years $’000
More than 5 years
$’000Non-derivative financial liabilitiesTrade and other payables (70,960) (70,960) (70,581) (80) (3) (296)Bank overdrafts and loans (33,987) (34,429) (5,164) (29,265) – –Derivative financial liabilitiesCopper commodity contracts (76) (76) (76) – – –
www.volex.com
103Volex plc
FINANCIAL STATEMENTS
Volex AR2017 Financials.indd 103 22/06/2017 11:57:22

25431.02 22 June 2017 3:25 PM Proof 8
30. Contingent liabilitiesAs a global Group, subsidiary companies, in the normal course of business, engage in significant levels of cross-border trading. The customs, duties and sales tax regulations associated with these transactions are complex and often subject to interpretation. While the Group places considerable emphasis on compliance with such regulations, including appropriate use of external legal advisors, full compliance with all customs, duty and sales tax regulations cannot be guaranteed.
Through the normal course of business, the Group provides manufacturing warranties to its customers and assurances that its products meet the required safety and testing standards. When the Group is notified that there is a fault with one of its products, the Group will provide a rigorous review of the defective product and its associated manufacturing process and if found at fault and contractually liable will provide for costs associated with recall and repair as well as rectify the manufacturing process or seek recompense from its supplier. The Group does not provide for such costs where fault has not yet been determined and investigations are ongoing.
The Company enters into financial guarantee contracts to guarantee the indebtedness of other Group companies. The Company considers these to be insurance arrangements and treats the guarantee contract as a contingent liability until such time as it becomes probable that the Company will be required to make a payment under the guarantee.
31. Related party transactionsGroupTransactions between the Company and its subsidiaries, which are related parties, have been eliminated on consolidation and are not disclosed in this section of the note.
Remuneration of key management – Directors of parent Company2017$’000
2016$’000
Short term employee benefits 913 1,312Post-employment benefits – 137Share-based payment charge/(credit) 282 32
1,195 1,481
In the prior year $271,000 was expensed in the period for severance costs relating to directors. Details of Directors’ remuneration for the period are provided in the audited part of the Directors’ Remuneration Report on page 45. A family member of one of the directors received $1,000 for services provided during the year.
Company
During the period the Company levied the following charges on its subsidiary undertakings:
2017$’000
2016$’000
Management fees 1,324 2,266Royalty fees – 3,579Interest 214 432
1,538 6,277
Amounts due to and from subsidiary undertaking are shown in notes 17 and 19.
Remuneration of Directors of the Company is discussed above.
32. Events after the balance sheet dateThe Group has successfully completed an extension of its senior credit facility to June 2019 (previously due to expire in June 2018). As part of this extension, Clydesdale Bank plc exited the syndicate. Lloyds Banking Group plc and HSBC Bank plc have both retained their positions and credit offering with the size of the facility duly reducing from $45.0 million to $30.0 million. Given the cash generation in the year, management is confident that the Group can operate within this facility level.
On 12 April 2017, the Group entered into a shareholder agreement with Kepler Signaltek Limited to establish a new joint venture and acquired 26.09% of the voting shares of the company for consideration of $300,000. This amount was paid on 19 April 2017. A commitment to subscribe for $1,700,000 of preference shares which accrue interest at 10% per annum was also made with $700,000 due to be paid on 1 August 2017 and $1,000,000 on 1 April 2018. The preference shares are redeemable at any point after April 2019 and before April 2022. Kepler Signaltek Limited will manufacture both power cords and high speed data cables exclusively for the healthcare sector and provides Volex with access to an enhanced healthcare product offering.
Volex plc104
Annual Report and Accounts 2017 Stock code: VLX
Notes to the Financial Statements continuedFor the 52 weeks ended 2 April 2017 (52 weeks ended 3 April 2016)
Volex AR2017 Financials.indd 104 22/06/2017 17:21:39

25431.02 22 June 2017 3:25 PM Proo 8
Results
Unaudited IFRS 2017
$’000
Unaudited IFRS 2016
$’000
Unaudited IFRS 2015
$’000
Unaudited IFRS 2014
$’000
Unaudited IFRS 2013
$’000Revenue – total Group 319,584 367,534 423,409 400,177 473,154 Gross profit – total Group 42,347 58,519 70,627 66,022 83,171 Operating expenses – total Group (48,968) (55,080) (75,180) (70,844) (78,976) Normalised operating profit(i) – total Group 9,079 7,172 8,832 4,532 12,342 Operating exceptional items (15,232) (4,742) (12,528) (11,642) (7,966) Share-based payment (charge)/credit (468) 1,009 (857) 2,288 (181) Profit/(loss) on ordinary activities before taxation (8,500) 1,542 (7,179) (7,562) 1,926 Depreciation and amortisation – continuing operations 5,368 7,180 7,212 7,972 5,943
Cents Cents Cents Cents CentsBasic underlying earnings/(loss) per share – total Group(ii) 9.5 1.5 2.8 (8.6) 10.8 Basic earnings/(loss) per share – total Group (7.9) (2.6) (12.8) (22.6) (1.5)
Statement of financial position $’000 $’000 $’000 $’000 $’000Non-current assets 24,905 39,427 41,384 48,670 52,107 Net cash/(debt) 11,335 (3,249) 1,880 (32,220) (19,500)Other assets and liabilities 10,067 15,174 11,244 20,275 13,039 Net assets 46,307 51,352 54,508 36,725 45,646 Gearing – 6% – 88% 43%
i. Defined as operating profit before non-recurring items and share-based payments.ii. Defined as earnings/(loss) per share before share-based payments and non-recurring items.
105Volex plc
www.volex.com
Five year summary
OTHER FINANCIAL INFORMATION
Volex AR2017 Financials.indd 105 22/06/2017 17:21:40

25431.02 22 June 2017 11:48 AM Proof 825431.02 22 June 2017 11:48 AM Proof 3
The consolidated financial statements include those of the Company, Volex plc, and all of its subsidiaries. Volex Powercords Europe is a trading division of Volex plc. In accordance with Section 409 of the Companies Act 2006 the subsidiaries owned at 2 April 2017 are disclosed below. The following entities are 100% owned unless otherwise stated.
Name of entity FootnoteCountry of
incorporation AddressVolex Pte Ltd 1 Singapore 35 Tampines Street 92, Singapore 528880Volex International Korea LLC 1 South Korea 6th Floor, 100 Toegye-ro (Hoehyun-dong 2-ga, State Tower
Namsan), Jung-gu, SeoulVolex Holdings Inc 2 USA 84 State Street, Boston MA 02109Volex Canada Inc 1 Canada 1565 Carling Avenue, Fourth floor, Ottawa On K1Z 8R1Volex do Brasil Ltda 1 Brazil Rod. Geraldo Scavone 2.080, Unidade 13 A 16, Jacarei, 12305-
490, BrazilVolex Poland SP z.o.o. 1 Poland Podłuzna 11-13, 85-790, Bydgoszcz, Kuyavian-Pomeranian
Voivodeship, PolandVolex France Sarl 1 France Citco France Sarl, 8 avenue Hoche, 75008 Paris, FranceVolex Germany GmbH 1 Germany Zu den Mühlen 19, 35390 Gießen, DeutschlandVolex Sweden AB 1 Sweden SE-831 48 Östersund, Jämtland CountyVolex Group Holdings Limited 2 UK Holbrook House, 34-38 Hill Rise, Richmond, Surrey TW10 6UAVolex (No.4) Ltd 3 UK Holbrook House, 34-38 Hill Rise, Richmond, Surrey TW10 6UAVolex (No.3) Ltd 3 UK Holbrook House, 34-38 Hill Rise, Richmond, Surrey TW10 6UAVolex (No.2) Ltd 3 UK Holbrook House, 34-38 Hill Rise, Richmond, Surrey TW10 6UAVolex (No.1) Ltd 3 UK Holbrook House, 34-38 Hill Rise, Richmond, Surrey TW10 6UACable products Limited 3 UK Holbrook House, 34-38 Hill Rise, Richmond, Surrey TW10 6UAPencon Limited 3 UK Holbrook House, 34-38 Hill Rise, Richmond, Surrey TW10 6UAVolex Executive Pension Scheme Trustee 3 UK Holbrook House, 34-38 Hill Rise, Richmond, Surrey TW10 6UAVolex Electrical Products 3 UK Holbrook House, 34-38 Hill Rise, Richmond, Surrey TW10 6UAVolex Group Pension Scheme Trustee Limited 3 UK Holbrook House, 34-38 Hill Rise, Richmond, Surrey TW10 6UAWard and Goldstone Limited 3 UK Holbrook House, 34-38 Hill Rise, Richmond, Surrey TW10 6UAVolex Interconnect products Limited 3 UK Holbrook House, 34-38 Hill Rise, Richmond, Surrey TW10 6UAVolex Electronics Limited 3 UK Holbrook House, 34-38 Hill Rise, Richmond, Surrey TW10 6UAIonix Development Company Limited 3 UK Holbrook House, 34-38 Hill Rise, Richmond, Surrey TW10 6UAPendle Connectors Limited 3 UK Holbrook House, 34-38 Hill Rise, Richmond, Surrey TW10 6UAMayor (UK) Limited 3 UK Holbrook House, 34-38 Hill Rise, Richmond, Surrey TW10 6UAVolex Interconnect Systems Limited 3 UK Holbrook House, 34-38 Hill Rise, Richmond, Surrey TW10 6UAIndirectly Held Holbrook House, 34-38 Hill Rise, Richmond, Surrey TW10 6UAVolex (Asia) Pte Ltd 1 Singapore 35 Tampines Street 92, Singapore 528880PT Volex Indonesia 1 Indonesia JL. Ir. Sutami Kawasan Industri Sekupang, Batam, Indonesia
29422, Indonesia
Volex plc
slugline
Annual Report and Accounts 2017 Stock code: VLX
106
Subsidiaries
Volex plc106
Volex AR2017 Financials.indd 106 22/06/2017 11:57:23

25431.02 22 June 2017 11:48 AM Proo 8
Name of entity FootnoteCountry of
incorporation AddressPT Volex Cable Assembly 1 Indonesia Kawasan EJIP Industrial Park Plot 8M-1, Lemah Abang – Cikarang
Selatan, Bekasi 17550, IndonesiaVolex Cable Assemblies (Phils) Inc 1 Philippines Unit 1 Lot 10 Phase 4 East Science Ave. corner Trade Ave.,
Laguna Technopark Inc., Binan, Laguna. Philippines 4024Volex Japan KK 1 Japan 9th floor Kannai Tosei Building II, Sumiyoshi-cho 4-45-1, Naka-Ku,
Yokohama-shi, KangawaVolex (Taiwan) Co. Ltd 1 Taiwan 11F-2, No.6, Sec.2, Daxing W. Rd., Taoyuan City, Taoyuan Hsien
33046, Taiwan (R.O.C.)Volex (Thailand) Co. Ltd 1 Thailand No. 99/349 Moo 2, Chaengwattana Road, Thungsong-Hong,
Laksi, Bangkok 10210Volex Cable Assembly (Vietnam) Pte Ltd 1 Vietnam Plot D-5B, Thanglong Industrial Park, Dong Anh District, Hanoi,
VietnamVolex Cable Assemblies Sdn Bhd 1 Malaysia 16th Fllor, Wisma Sime Darby, Jalan Raja Laut, 50350 Kuala
LumpurVolex Cables (HK) Ltd 1 Hong Kong Rooms 805-806 8th Floor, Tai Yau Building, 181 Johnston Road
Wanchai, Hong KongVolex Interconnect (India) Pvt Ltd 1 India No.22/1-A 1st Street, Kazura Garden, Neelankarai, Chennai, Tamil
Nadu, 600041, IndiaVolex Interconnect Systems (Suzhou) Co. Ltd 1 China Weiting North Industrial Zone, Weixin Road, Suzhou Industrial
Park, Suzhou, Jiang-su Province 215122, ChinaVolex Cable Assembly (Shenzhen) Co. Ltd 1 China No. 6279, Henggang Section, Longgang Avenue, Bao’an Village,
Henggang Sub-district, Longgang District, Shenzhen CityVolex Cable Assembly (Zhongshan) Co. Ltd 1 China 2 Xingda Street, Torch High-tech Ind Dvpt Zone, Zhongshan,
528437, ChinaVolex Inc 1 USA 84 State Street, Boston MA 02109Volex de Mexico SA de CV 1 Mexico Av 32 Sur, No 8950 Interior G/1,D,E,F, Parque Industrial La Mesa,
Fraccionamiento Rubio, Tijuana; Baja California Mexico, CP 22116Volex Europe Ltd 1 Ireland Riverside One, 37-42 Sir John Rogerson’s Quay, Dublin 2, D02
X576Volex Europe (No.1) Limited 3 Ireland Riverside One, 37-42 Sir John Rogerson’s Quay, Dublin 2, D02
X576Volex (no.5) Ltd 3 UK 7/8 St. Martin’s Place, London, England, WC2N 4HA
1. Manufacture and/or sale of power and data cables2. Act as a holding company3. Dormant company
107Volex plc
www.volex.com OTHER FINANCIAL INFORMATION
Volex AR2017 Financials.indd 107 22/06/2017 11:57:24

25431.02 22 June 2017 2:20 PM Proof 1
Volex plc
Annual Report and Accounts 2017 Stock code: VLX
108
Shareholder Information
Registered Office and Advisors
Financial CalendarFY2018Interim Results Announced w/c 6 November 2017 Year End 1 April 2018 Final Results Announced w/c 4 June 2018
FY2019Interim Results Announced w/c 5 November 2018 Year End 31 March 2019 Final Results Announced w/c 3 June 2019
Registered OfficeHolbrook House, 34-38 Hill Rise, Richmond, Surrey TW10 6UA www.volex.com
Registered number158956 (Registered in England and Wales)
RegistrarsCapita Registrars plc, The Registry, 34 Beckenham Road, Beckenham, Kent, BR3 4TU www.capita-irg.com
Independent AuditorsPricewaterhouseCoopers LLP
BankersLloyds Bank plc HSBC Bank plc
StockbrokersLiberum Capital Ltd
SolicitorsTravers Smith LLP
Volex AR2017 Financials.indd 108 22/06/2017 14:20:43

25431.02 22 June 2017 11:48 AM Proof 8 25431.02 22 June 2017 11:48 AM Proof 8
Shareholder Notes
www.volex.com OTHER FINANCIAL INFORMATION
Volex plc
Volex AR2017 Front.indd 6 22/06/2017 11:58:41

25431.02 22 June 2017 11:48 AM Proof 8 25431.02 22 June 2017 11:48 AM Proof 8
Volex p
lc Annual R
eport and
Accounts 2017
Stock C
ode: V
LX
Volex plcHolbrook House34-38 Hill RiseRichmondSurrey TW10 6UAUnited Kingdom
www.volex.com
Volex plc
@Volex
Volex AR2017 Front.indd 1 22/06/2017 11:58:42