vodafone egypt acquisition investor presentation
TRANSCRIPT
November 2021
Enhancing Vodacom’s
growth and returns
Vodafone Egypt
acquisition
Further together
DisclaimerThe following presentation is being made only to, and is only directed at, persons to whom such presentations may lawfully be communicated
(‘relevant persons’). Any person who is not a relevant person should not act or rely on this presentation or any of its contents.
Information in the following presentation relating to the price at which relevant investments have been bought or sold in the past or the yield
on such investments cannot be relied upon as a guide to the future performance of such investments. This presentation does not constitute
an offering of securities or otherwise constitute an invitation or inducement to any person to underwrite, subscribe for or otherwise acquire
securities in any company within the Group.
Promotional material used in this presentation that is based on pricing or service offering may no longer be applicable.
This presentation contains certain non-GAAP financial information which has not been reviewed or reported on by the Group’s auditors. The
Group’s management believes these measures provide valuable additional information in understanding the performance of the Group or the
Group’s businesses because they provide measures used by the Group to assess performance. However, this additional information presented
is not uniformly defined by all companies, including those in the Group’s industry. Accordingly, it may not be comparable with similarly titled
measures and disclosures by other companies. Additionally, although these measures are important in the management of the business, they
should not be viewed in isolation or as replacements for or alternatives to, but rather as complementary to, the comparable GAAP measures.
This presentation also contains forward-looking statements which are subject to risks and uncertainties because they relate to future events.
These forward-looking statements include, without limitation, statements in relation to the Group’s projected financial results.
Vodafone, the Vodafone logo, M-Pesa, Connected Farmer, Vodafone Supernet, Vodafone Mobile Broadband, Vodafone WebBox, Vodafone
Passport, Vodafone live!, Power to You, Vodacom, Vodacom 4 Less and Vodacom Change the World are trademarks of Vodafone Group Plc (or
have applications pending). Other product and company names mentioned herein may be the trademarks of their respective owners.
Further together2
C2 General
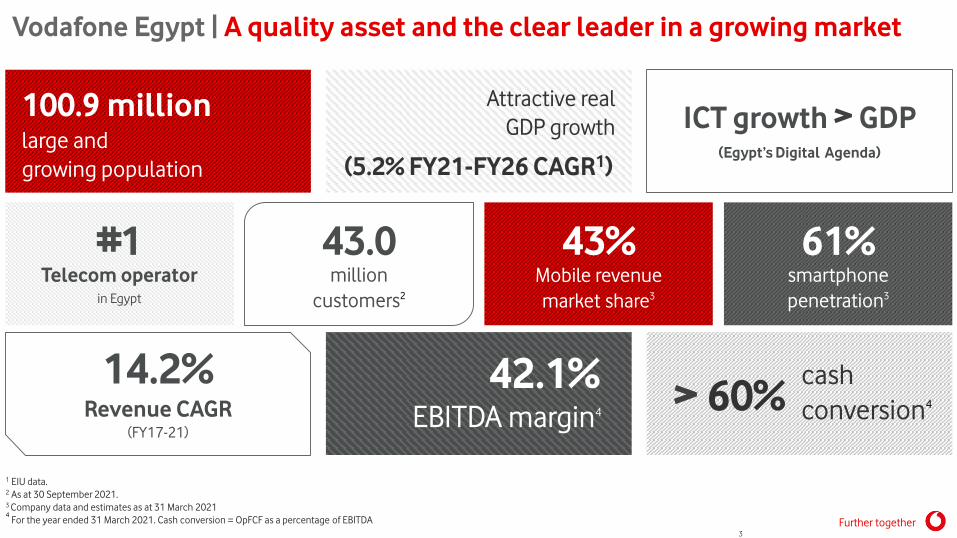
Vodafone Egypt | A quality asset and the clear leader in a growing market
1 EIU data.2 As at 30 September 2021.3 Company data and estimates as at 31 March 20214
For the year ended 31 March 2021. Cash conversion = OpFCF as a percentage of EBITDA
100.9 million large and
growing population
Attractive real
GDP growth
(5.2% FY21-FY26 CAGR1)
ICT growth > GDP(Egypt’s Digital Agenda)
43%Mobile revenue
market share3
61%smartphone
penetration3
#1Telecom operator
in Egypt
43.0million
customers2
14.2%Revenue CAGR
(FY17-21)
42.1%EBITDA margin4
> 60%cash
conversion4
Further together3
C2 General
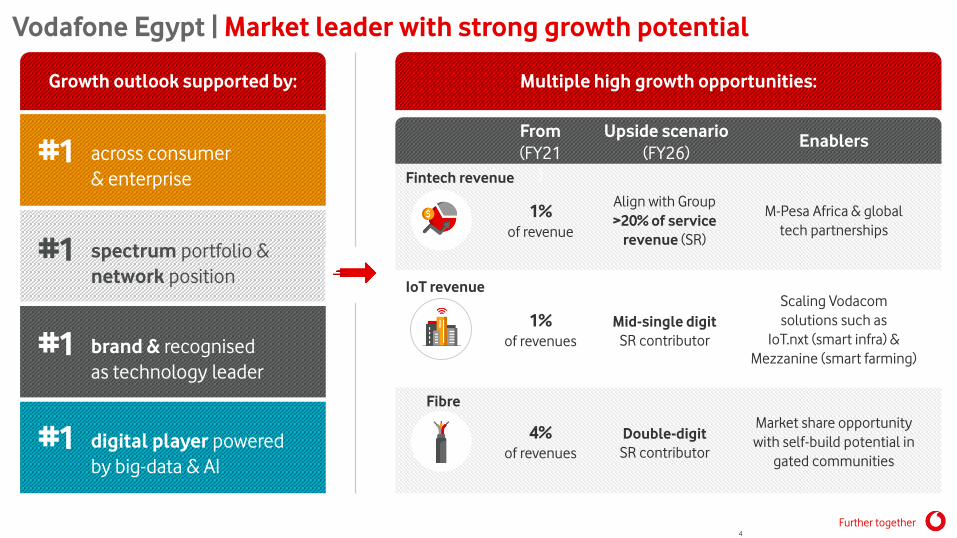
Vodafone Egypt | Market leader with strong growth potential
Growth outlook supported by:
#1 across consumer
& enterprise
#1 spectrum portfolio &
network position
#1 brand & recognised
as technology leader
#1 digital player powered
by big-data & AI
Multiple high growth opportunities:
From
(FY21
)
Upside scenario
(FY26)Enablers
M-Pesa Africa & global
tech partnerships
Scaling Vodacom
solutions such as
IoT.nxt (smart infra) &
Mezzanine (smart farming)
Market share opportunity
with self-build potential in
gated communities
Align with Group
>20% of service
revenue (SR)
Mid-single digit
SR contributor
Double-digit
SR contributor
1%of revenue
1% of revenues
4%of revenues
Fintech revenue
IoT revenue
Fibre
Further together4
C2 General
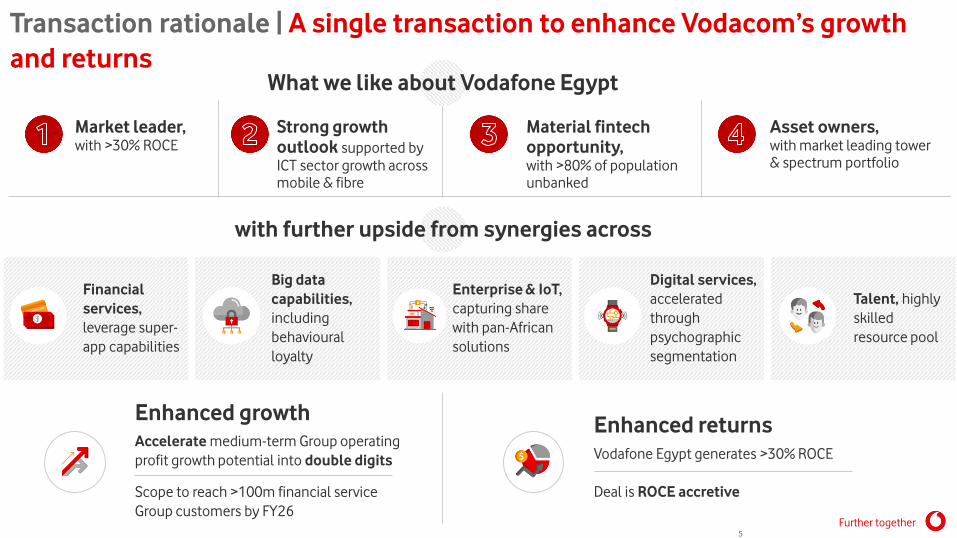
Transaction rationale | A single transaction to enhance Vodacom’s growth
and returnsWhat we like about Vodafone Egypt
Market leader, with >30% ROCE
Strong growth
outlook supported by
ICT sector growth across mobile & fibre
Material fintech
opportunity, with >80% of population unbanked
Asset owners, with market leading tower & spectrum portfolio
with further upside from synergies across
Financial
services,
leverage super-
app capabilities
Big data
capabilities,
including
behavioural
loyalty
Enterprise & IoT,
capturing share
with pan-African
solutions
Digital services,
accelerated
through
psychographic
segmentation
Talent, highly
skilled
resource pool
Enhanced returns
Vodafone Egypt generates >30% ROCE
Enhanced growth
Accelerate medium-term Group operating
profit growth potential into double digits
Scope to reach >100m financial service
Group customers by FY26
Deal is ROCE accretive
Further together5
C2 General
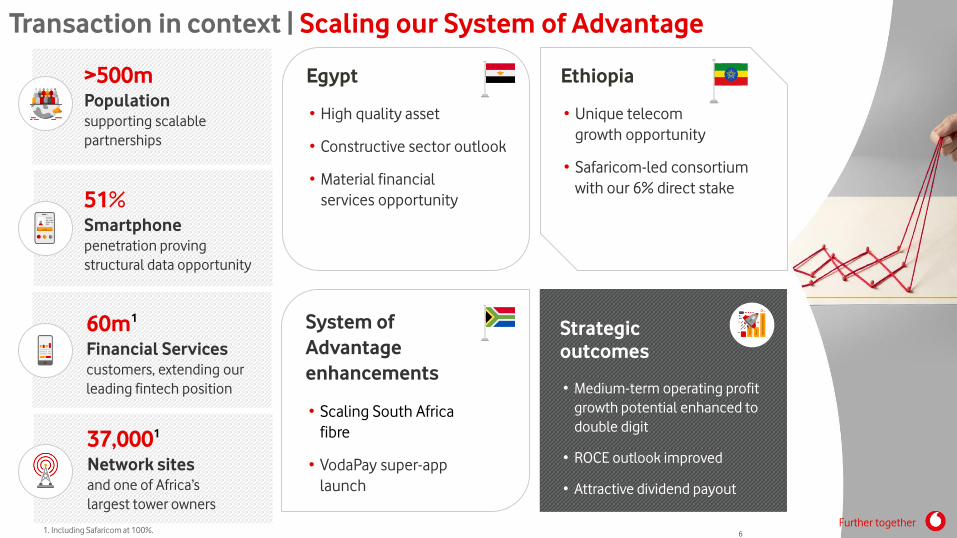
Transaction in context | Scaling our System of Advantage
>500mPopulationsupporting scalable
partnerships
51%Smartphonepenetration proving
structural data opportunity
60m1
Financial Servicescustomers, extending our
leading fintech position
37,0001
Network sitesand one of Africa’s
largest tower owners
• Unique telecom
growth opportunity
• Safaricom-led consortium
with our 6% direct stake
Ethiopia
• High quality asset
• Constructive sector outlook
• Material financial
services opportunity
Egypt
• Medium-term operating profit
growth potential enhanced to
double digit
• ROCE outlook improved
• Attractive dividend payout
Strategic
outcomes
• Scaling South Africa
fibre
• VodaPay super-app
launch
System of
Advantage
enhancements
Further together61. Including Safaricom at 100%.
C2 General
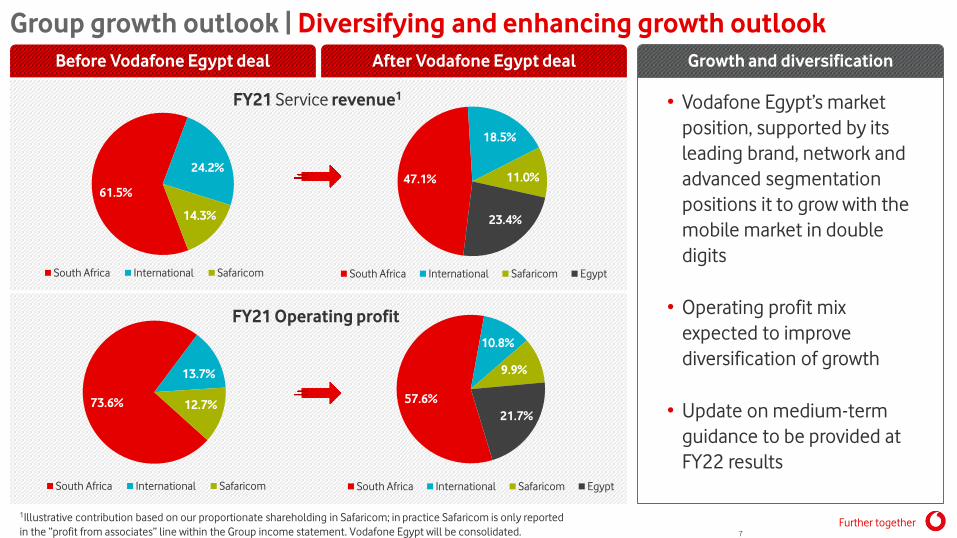
Group growth outlook | Diversifying and enhancing growth outlook
Before Vodafone Egypt deal After Vodafone Egypt deal
61.5%
24.2%
14.3%
South Africa International Safaricom
• Vodafone Egypt’s market
position, supported by its
leading brand, network and
advanced segmentation
positions it to grow with the
mobile market in double
digits
• Operating profit mix
expected to improve
diversification of growth
• Update on medium-term
guidance to be provided at
FY22 results
Growth and diversification
47.1%
18.5%
11.0%
23.4%
South Africa International Safaricom Egypt
FY21 Service revenue1
73.6%
13.7%
12.7%
South Africa International Safaricom
57.6%
10.8%
9.9%
21.7%
South Africa International Safaricom Egypt
FY21 Operating profit
1Illustrative contribution based on our proportionate shareholding in Safaricom; in practice Safaricom is only reported
in the “profit from associates” line within the Group income statement. Vodafone Egypt will be consolidated.Further together
7
C2 General
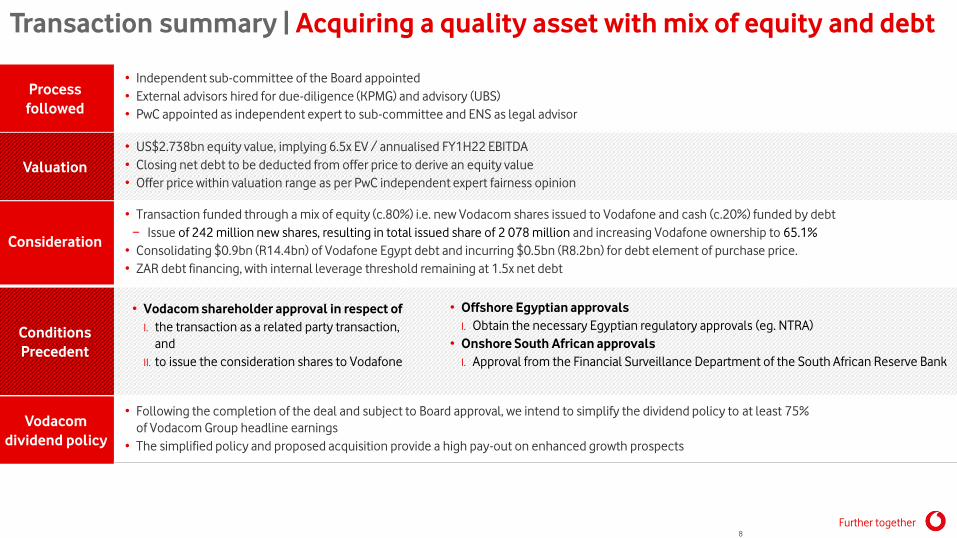
Transaction summary | Acquiring a quality asset with mix of equity and debt
Process
followed
Overview
Valuation
• US$2.738bn equity value, implying 6.5x EV / annualised FY1H22 EBITDA
• Closing net debt to be deducted from offer price to derive an equity value
• Offer price within valuation range as per PwC independent expert fairness opinion
• Independent sub-committee of the Board appointed
• External advisors hired for due-diligence (KPMG) and advisory (UBS)
• PwC appointed as independent expert to sub-committee and ENS as legal advisor
Consideration
• Transaction funded through a mix of equity (c.80%) i.e. new Vodacom shares issued to Vodafone and cash (c.20%) funded by debt
− Issue of 242 million new shares, resulting in total issued share of 2 078 million and increasing Vodafone ownership to 65.1%
• Consolidating $0.9bn (R14.4bn) of Vodafone Egypt debt and incurring $0.5bn (R8.2bn) for debt element of purchase price.
• ZAR debt financing, with internal leverage threshold remaining at 1.5x net debt
Conditions
Precedent
• Vodacom shareholder approval in respect of
I. the transaction as a related party transaction,
and
II. to issue the consideration shares to Vodafone
• Offshore Egyptian approvals
I. Obtain the necessary Egyptian regulatory approvals (eg. NTRA)
• Onshore South African approvals
I. Approval from the Financial Surveillance Department of the South African Reserve Bank
Vodacom
dividend policy
• Following the completion of the deal and subject to Board approval, we intend to simplify the dividend policy to at least 75%
of Vodacom Group headline earnings
• The simplified policy and proposed acquisition provide a high pay-out on enhanced growth prospects
Further together8
C2 General
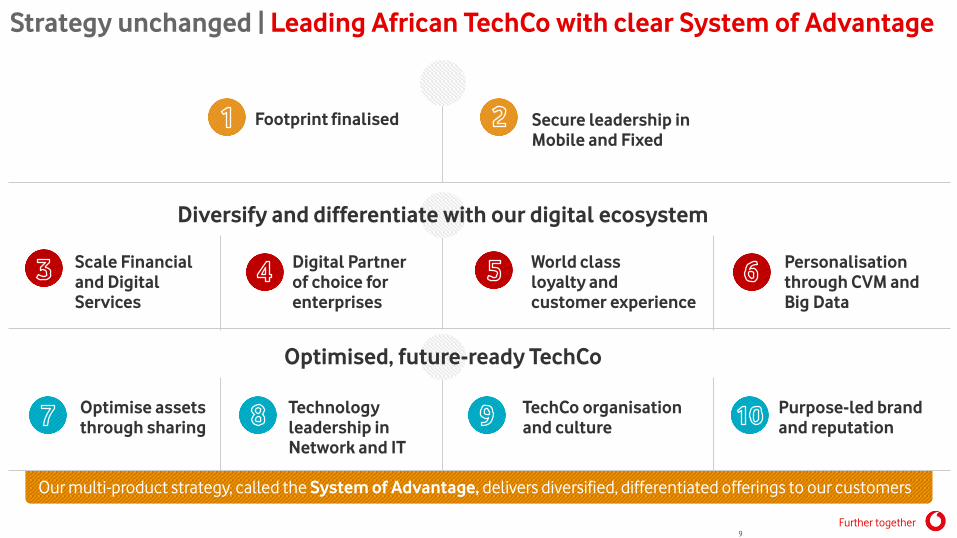
Strategy unchanged | Leading African TechCo with clear System of Advantage
Footprint finalised Secure leadership in
Mobile and Fixed
Diversify and differentiate with our digital ecosystem
Scale Financial
and Digital
Services
Digital Partner
of choice for
enterprises
World class
loyalty and
customer experience
Personalisation
through CVM and
Big Data
Optimised, future-ready TechCo
Optimise assets
through sharing
Technology
leadership in
Network and IT
TechCo organisation
and culture
Purpose-led brand
and reputation
Our multi-product strategy, called the System of Advantage, delivers diversified, differentiated offerings to our customers
Further together9
C2 General
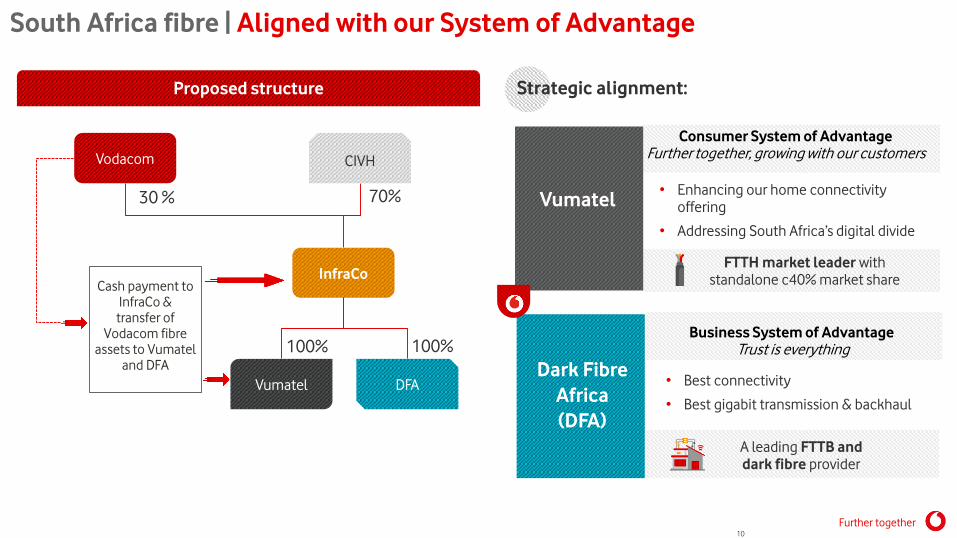
South Africa fibre | Aligned with our System of Advantage
Further together10
Proposed structure
Vodacom CIVH
30 % 70%
InfraCoCash payment to
InfraCo & transfer of
Vodacom fibreassets to Vumatel
and DFA
Vumatel DFA
100%100%
Strategic alignment:
FTTH market leader with standalone c40% market share
A leading FTTB and
dark fibre provider
Vumatel
Dark Fibre
Africa
(DFA)
• Enhancing our home connectivity offering
• Addressing South Africa’s digital divide
• Best connectivity
• Best gigabit transmission & backhaul
Business System of AdvantageTrust is everything
Consumer System of AdvantageFurther together, growing with our customers
C2 General
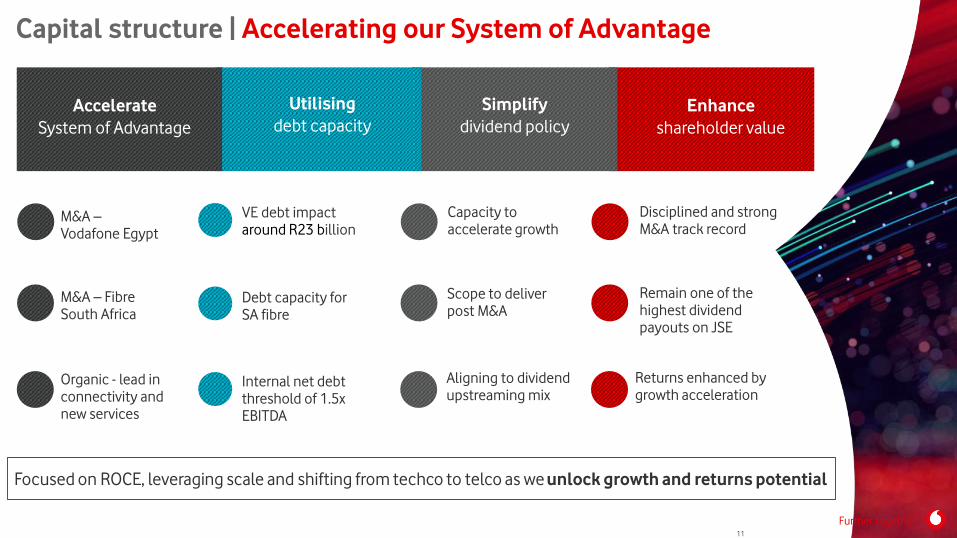
Capital structure | Accelerating our System of Advantage
M&A –Vodafone Egypt
M&A – FibreSouth Africa
Organic - lead in connectivity andnew services
VE debt impact around R23 billion
Debt capacity for SA fibre
Internal net debt threshold of 1.5x EBITDA
Capacity toaccelerate growth
Scope to deliverpost M&A
Aligning to dividend upstreaming mix
Disciplined and strongM&A track record
Remain one of the highest dividend payouts on JSE
Returns enhanced by growth acceleration
Focused on ROCE, leveraging scale and shifting from techco to telco as we unlock growth and returns potential
Enhance
shareholder value
Simplify
dividend policy
Utilising
debt capacityAccelerate
System of Advantage
Further together11
C2 General
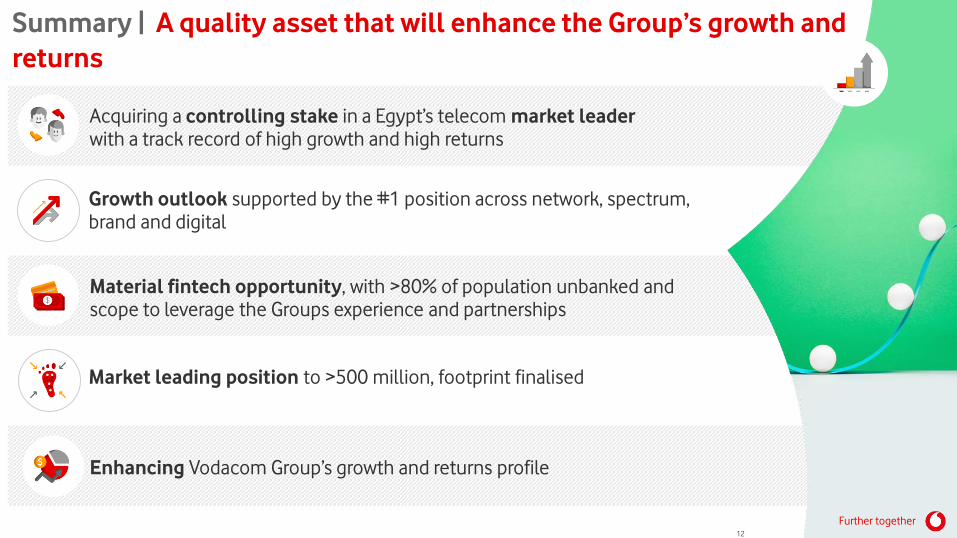
Summary | A quality asset that will enhance the Group’s growth and
returns
Acquiring a controlling stake in a Egypt’s telecom market leader
with a track record of high growth and high returns
Material fintech opportunity, with >80% of population unbanked and scope to leverage the Groups experience and partnerships
Growth outlook supported by the #1 position across network, spectrum, brand and digital
Enhancing Vodacom Group’s growth and returns profile
Market leading position to >500 million, footprint finalised
Further together12
Appendix
slides
Further together
C2 General
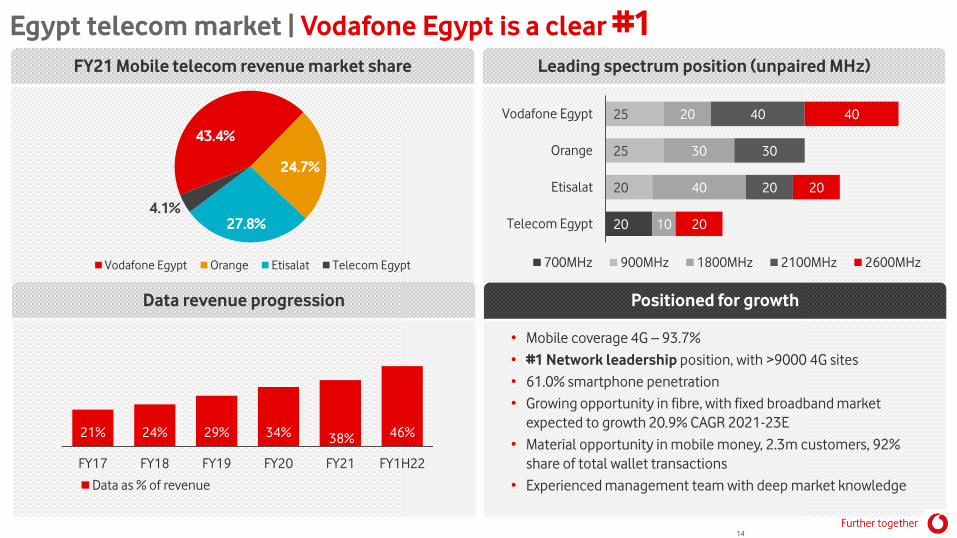
Egypt telecom market | Vodafone Egypt is a clear #1FY21 Mobile telecom revenue market share Leading spectrum position (unpaired MHz)
Data revenue progression Positioned for growth
• Mobile coverage 4G – 93.7%
• #1 Network leadership position, with >9000 4G sites
• 61.0% smartphone penetration
• Growing opportunity in fibre, with fixed broadband market
expected to growth 20.9% CAGR 2021-23E
• Material opportunity in mobile money, 2.3m customers, 92%
share of total wallet transactions
• Experienced management team with deep market knowledge
43.4%
24.7%
27.8%4.1%
Vodafone Egypt Orange Etisalat Telecom Egypt
20
25
25
20
20
30
40
10
40
30
20
40
20
20
Vodafone Egypt
Orange
Etisalat
Telecom Egypt
700MHz 900MHz 1800MHz 2100MHz 2600MHz
14
Further together
21% 24% 29% 34% 38% 46%
FY17 FY18 FY19 FY20 FY21 FY1H22
Data as % of revenue
C2 General
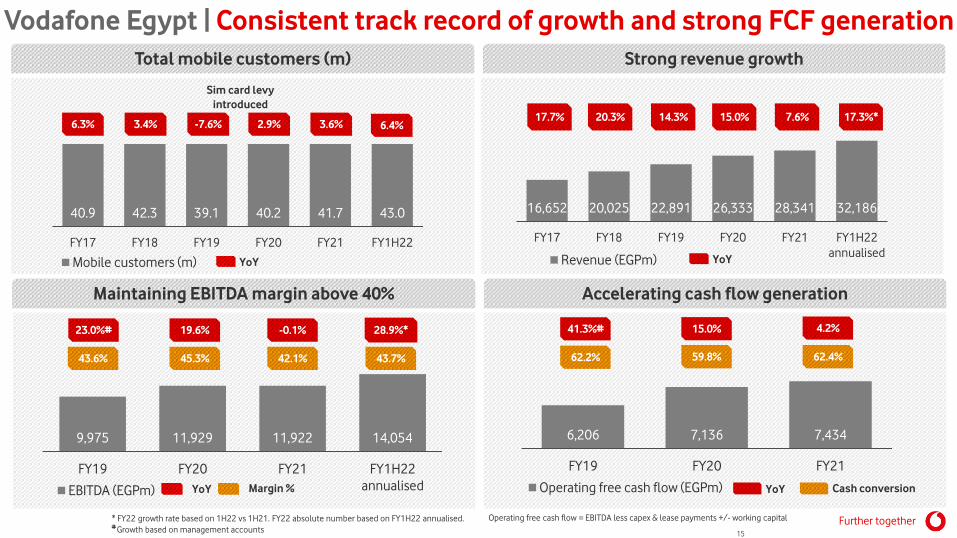
Vodafone Egypt | Consistent track record of growth and strong FCF generation
Total mobile customers (m) Strong revenue growth
Maintaining EBITDA margin above 40% Accelerating cash flow generation
40.9 42.3 39.1 40.2 41.7 43.0
FY17 FY18 FY19 FY20 FY21 FY1H22
Mobile customers (m)
3.4% -7.6% 2.9% 3.6%6.3%
Sim card levy
introduced
16,652 20,025 22,891 26,333 28,341 32,186
FY17 FY18 FY19 FY20 FY21 FY1H22
annualisedRevenue (EGPm)
20.3% 14.3% 15.0% 7.6%17.7% 17.3%*
YoY YoY
Further together
9,975 11,929 11,922 14,054
FY19 FY20 FY21 FY1H22
annualisedEBITDA (EGPm)
23.0%# 19.6% -0.1%
43.6% 45.3% 42.1%
28.9%*
43.7%
YoY Margin %
6,206 7,136 7,434
FY19 FY20 FY21
Operating free cash flow (EGPm)
41.3%# 15.0% 4.2%
62.2% 59.8% 62.4%
YoY Cash conversion
Operating free cash flow = EBITDA less capex & lease payments +/- working capital* FY22 growth rate based on 1H22 vs 1H21. FY22 absolute number based on FY1H22 annualised. # Growth based on management accounts
15
6.4%
C2 General
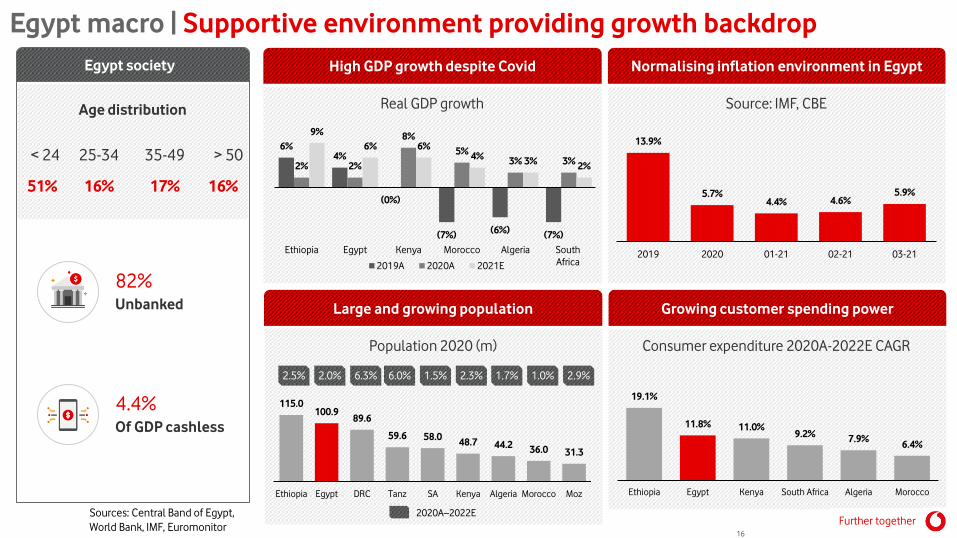
Egypt macro | Supportive environment providing growth backdrop
Sources: Central Band of Egypt,
World Bank, IMF, Euromonitor
Normalising inflation environment in Egypt
Growing customer spending power
High GDP growth despite Covid
Large and growing population
Egypt society
Age distribution
< 24
51%
25-34
16%
35-49
17%
> 50
16%
82%Unbanked
4.4%Of GDP cashless
6%4%
(0%)
(7%)(6%)
(7%)
2% 2%
8%
5%3% 3%
9%
6% 6%4%
3%2%
Ethiopia Egypt Kenya Morocco Algeria South
Africa2019A 2020A 2021E
Real GDP growth Source: IMF, CBE
13.9%
5.7%4.4% 4.6%
5.9%
2019 2020 01-21 02-21 03-21
Population 2020 (m) Consumer expenditure 2020A-2022E CAGR
115.0100.9
89.6
59.6 58.048.7 44.2
36.0 31.3
Ethiopia Egypt DRC Tanz SA Kenya Algeria Morocco Moz
2.5% 2.0% 6.3% 6.0% 1.5% 2.3% 1.7% 1.0% 2.9%
2020A–2022E
19.1%
11.8% 11.0%9.2%
7.9%6.4%
Ethiopia Egypt Kenya South Africa Algeria Morocco
Further together16
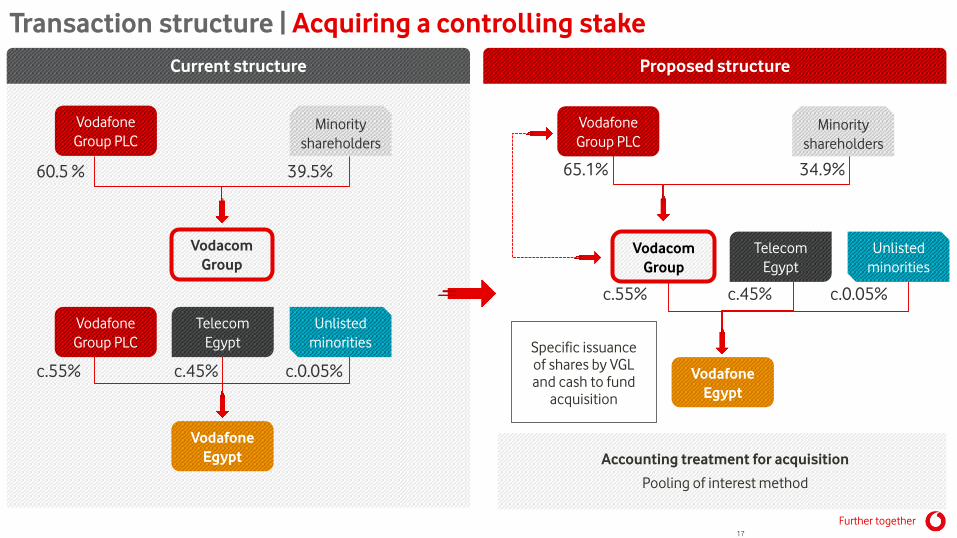
Transaction structure | Acquiring a controlling stake
Current structure
Vodafone
Group PLCMinority
shareholders
Vodacom
Group
60.5 % 39.5%
Proposed structure
Vodafone
Group PLCMinority
shareholders
65.1% 34.9%
Vodafone
Egypt
c.45% c.0.05%c.55%
Specific issuance of shares by VGL and cash to fund
acquisition
Vodacom
Group
Telecom
Egypt
Unlisted
minorities
Further together17
Accounting treatment for acquisition
Pooling of interest method
Vodafone
Group PLC
Telecom
Egypt
Unlisted
minorities
c.55% c.45% c.0.05%
Vodafone
Egypt
C2 General
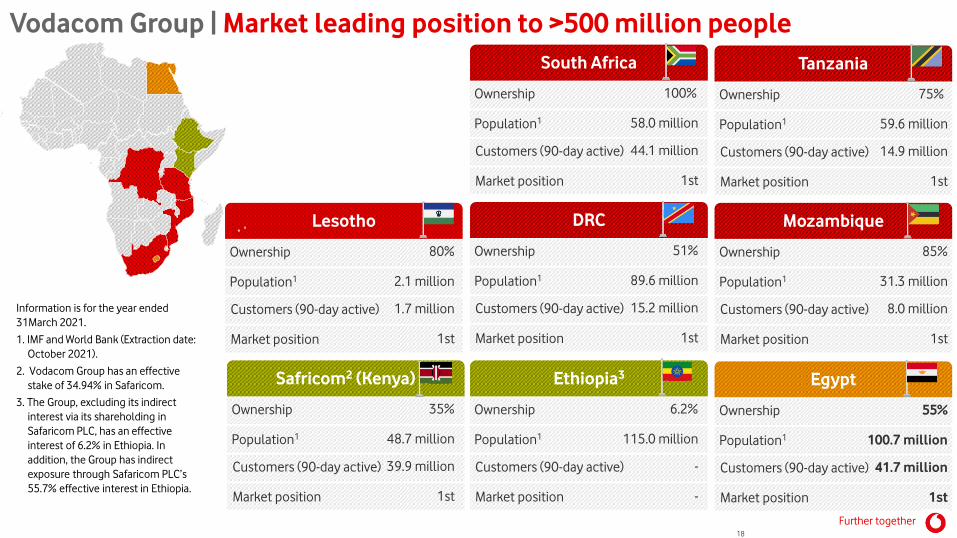
Vodacom Group | Market leading position to >500 million people
South Africa
Ownership 100%
Population1 58.0 million
Customers (90-day active) 44.1 million
Market position 1st
Tanzania
Ownership 75%
Population1 59.6 million
Customers (90-day active) 14.9 million
Market position 1st
DRC
Ownership 51%
Population1 89.6 million
Customers (90-day active) 15.2 million
Market position 1st
Mozambique
Ownership 85%
Population1 31.3 million
Customers (90-day active) 8.0 million
Market position 1st
Ethiopia3
Ownership 6.2%
Population1 115.0 million
Customers (90-day active) -
Market position -
Egypt
Ownership 55%
Population1 100.7 million
Customers (90-day active) 41.7 million
Market position 1st
Safricom2 (Kenya)
Ownership 35%
Population1 48.7 million
Customers (90-day active) 39.9 million
Market position 1st
Lesotho
Ownership 80%
Population1 2.1 million
Customers (90-day active) 1.7 million
Market position 1st
Information is for the year ended
31March 2021.
1. IMF and World Bank (Extraction date:
October 2021).
2. Vodacom Group has an effective
stake of 34.94% in Safaricom.
3. The Group, excluding its indirect
interest via its shareholding in
Safaricom PLC, has an effective
interest of 6.2% in Ethiopia. In
addition, the Group has indirect
exposure through Safaricom PLC’s
55.7% effective interest in Ethiopia.
Further together18
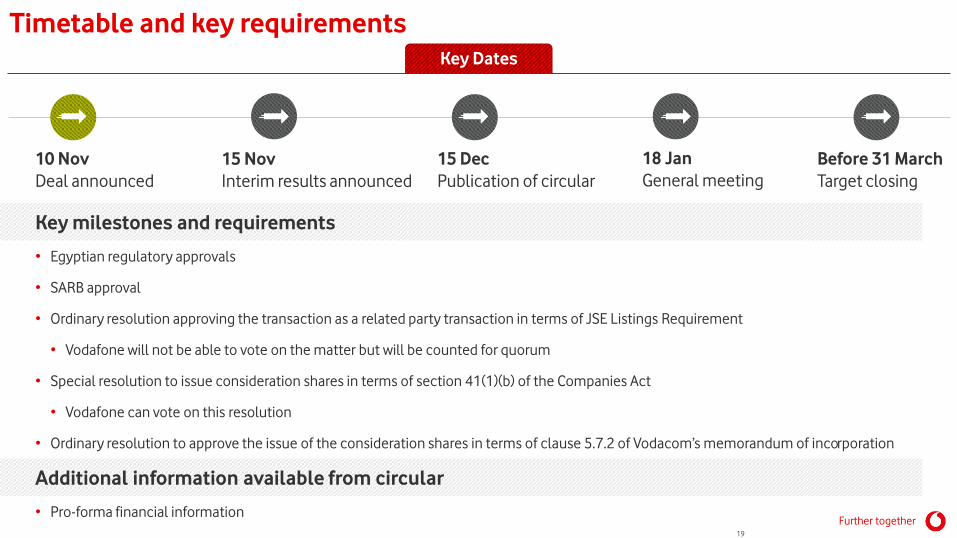
Timetable and key requirements
10 Nov
Deal announced
15 Dec
Publication of circular
18 Jan
General meeting
Before 31 March
Target closing
15 Nov
Interim results announced
Key milestones and requirements
• Egyptian regulatory approvals
• SARB approval
• Ordinary resolution approving the transaction as a related party transaction in terms of JSE Listings Requirement
• Vodafone will not be able to vote on the matter but will be counted for quorum
• Special resolution to issue consideration shares in terms of section 41(1)(b) of the Companies Act
• Vodafone can vote on this resolution
• Ordinary resolution to approve the issue of the consideration shares in terms of clause 5.7.2 of Vodacom’s memorandum of incorporation
Additional information available from circular
• Pro-forma financial information
Key Dates
Further together19
Thank you
Further together