vol. 267, no. 18, iesue of june 25, pp. 12517-12527,1992 ... · vol. 267, no. 18, iesue of june 25,...
TRANSCRIPT

Vol. 267, No. 18, Iesue of June 25, pp. 12517-12527,1992 Printed in U. S. A.
Selective Inhibitors of GTP Synthesis Impede Exocytotic Insulin Release from Intact Rat Islets*
(Received for publication, December 17, 1991)
Stewart A. MetzS, Mary E. Rabaglia, and Thomas J. Pintare From the Section of Endocrinology and the Department of Medicine, the University of Wisconsin, and the Middleton Memorial Veterans Hospital, Madison, W&onsin 53792-
To investigate whether GTP concentrations can be a regulatory step in exocytotic hormone secretion, we treated isolated rat islets with mycophenolic acid (MPA) or mizoribine, two selective inhibitors of de novo GTP synthesis. When islets were cultured over- night in purine-free medium containing the drug, MPA reduced GTP levels by up to 81 2 1%; guanine circum- vented this block via the nucleotide “salvage” pathway. MPA concomitantly inhibited glucose (16.7 mM)-in- duced insulin secretion in batch-type incubations (or perifusions), by up to 68% at 60 pg/ml. Although the inhibition of secretion occurred over a similar concen- tration range as the reduction in total GTP content, the two variables were not directly correlated. How- ever, the secretory effects also were prevented by add- ing guanine, but not hypoxanthine or xanthine, to the culture medium. Similar results for GTP content and insulin release were seen using mizoribine. Insulin con- tent was modestly (-18%) reduced by MPA but indices of fractional release (release/insulin content) were also markedly impaired. Although MPA also reduced ATP levels more modestly (-39%) and increased UTP (+87%), these were not the cause of the secretory defect since adenine restored ATP and UTP nearly to normal, but did not alter the reduction in GTP content or in- sulin secretion. MPA also inhibited secretion induced by amino acid or by a phorbol ester but had virtually no effect on release induced by a depolarizing concen- tration of K’, suggesting that GTP depletion does not merely impede Ca+ influx or directly block Ca2+-acti- vated exocytosis. However, a severe reduction of GTP content did not prevent the pertussis toxin-sensitive inhibition of insulin release induced by epinephrine, suggesting that the function of heterotrimeric GTP- binding proteins is not limited by ambient GTP concen- trations. Although these studies do not elucidate the exact site(s) in the exocytotic cascade which depend on intact GTP stores, they do provide the first direct evidence that GTP is required (and can be rate limit- ing) for insulin release.
The roles of GTP in mammalian cells have received intense
* These studies were supported by the Veterans Administration and Grant DK 37312 from the National Institutes of Health. The costs of publication of this article were defrayed in part by the payment of page charges. This article must therefore be hereby marked “advertisement” in accordance with 18 U.S.C. Section 1734 solely to indicate this fact.
$ To whom reprints should be addressed H4/554 Clinical Science Center, 600 Highland Ave., Madison, WI 53792. Tel.: 608-263-9221; Fax: 608-263-0568.
Partially supported by National Institutes of Health Short Term Training Grant 51‘35 DK-HL07389-11.
scrutiny. One such role is to replace GDP and thereby activate various GTP-binding proteins (G-proteins) such as heterotri- meric G-proteins in plasma membranes and low molecular weight G-proteins which partition between cytosol and intra- cellular membranes. Such proteins may participate in signal transduction and stimulus-secretion coupling in cells capable of exocytotic secretion, including the pancreatic islet (1-3). Other actions of GTP (and/or its deoxy derivative) which may be relevant to exocytosis include effects on microtubule assembly (4); ATP synthesis (5-7); calcium mobilization (8); membrane insertion of tRNA, translocation of the nascent secretory product across the endoplasmic reticulum and its subsequent targeting, vectorial transport, and vesicular traffic (9, 10); possibly the regulation of protein kinase activity (11- 13); potential direct effects on a plasma membrane K’ channel (14), in addition to more general effects on DNA, RNA, and protein synthesis (15-17) including insulin synthesis (10); glycoprotein formation; and the regulation of certain enzymes, including the control of gluconeogenesis (18, 19).
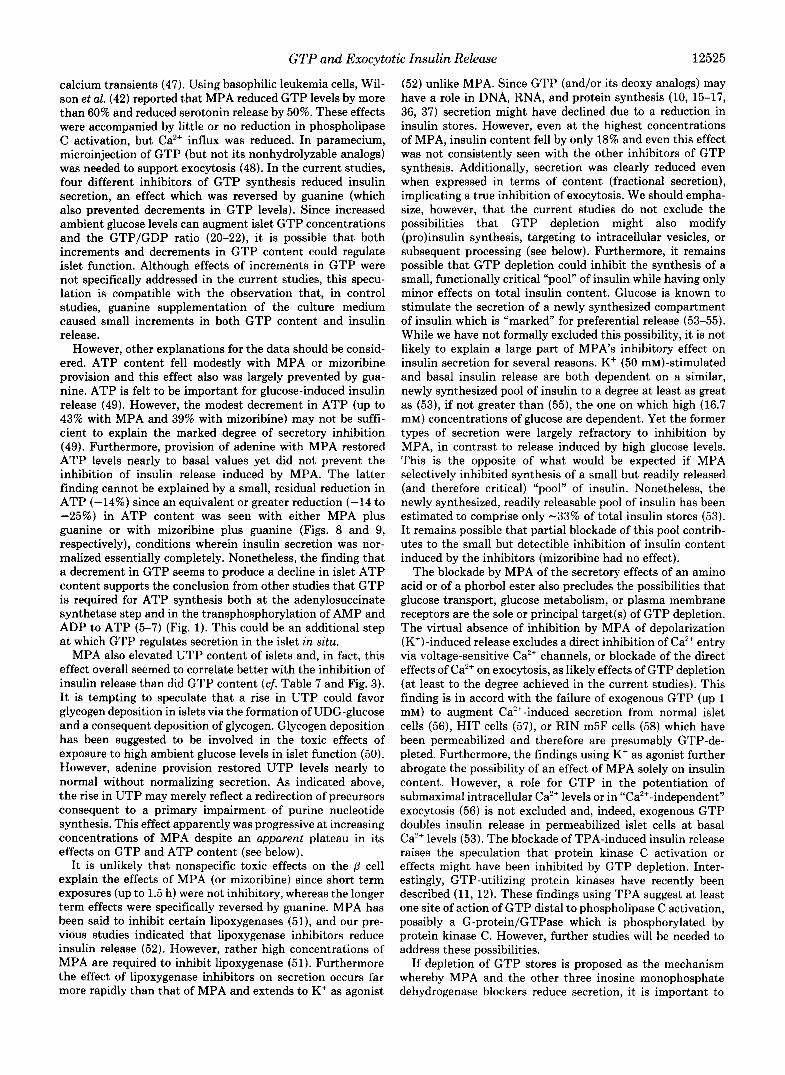
However, little data exist (20-22) on GTP levels in islets, and there have been no studies of which we are aware which assess whether GTP levels are rate-limiting for (and thus can be a site for the regulation of) exocytosis from endocrine organs. To assess this question, we treated islets with phar- macologic agents which selectively block the de m u 0 synthesis of GTP at the level of inosine monophosphate dehydrogenase (EC 1.1.1.205, IMP dehydrogenase, Fig. 1) and examined the consequent effects on islet GTP levels, and on insulin content and secretion, in the presence and absence of exogenous purine bases used to provide a “salvage” pathway for nucleo- tide synthesis.
EXPERIMENTAL PROCEDURES
Materials-Mycophenolic acid and nucleotide standards, mono- basic ammonium phosphate (for HPLC’ mobile phase) and purine bases were purchased from Sigma. Mizoribine, also referred to as bredinin (4-carbamoyl-l-~-~-ribofuranosylimidazolium-5-olate, Refs. 23-25), tiazofurin (2-~-~-ribofuranosylthiazole-4-carboxamide, Refs. 26, 27), and ribavirin (l-~-~-ribofuranosylthiazole-3-carboxamide, Refs. 26, 27) were generous gifts of Dr. N. Kazmatani (Tokyo Wom- en’s Medical College, Tokyo, Japan), Dr. D. English (Indiana Uni- versity School of Medicine, Indianapolis, IN) and Dr. R. Greene (National Cancer Institute, and Chemotherapeutics Agents Reposi- tory, Rockville, MD). The diluents used for making stock solutions of these drugs were ethanol (for mycophenolic acid), water (for mizoribine, tiazofurin, and ribavirin), MezSO (for guanine or ade- nine), and 0.1 N NaOH (for hypoxanthine or xanthine), respectively. Pertussis (PTX) toxin was from List Biologic Laboratories (Camp- bell, CA) and was diluted 0.1 M monobasic sodium phosphate buffer containing 0.5 M NaC1. In all studies, identical types and amounts of
The abbreviations used are: HPLC, high performance liquid chro- matography; MPA, mycophenolic acid; NTP, nucleoside triphos- phate; PTX, pertussis toxin (from Bordetellapertussis); IMP, inosine monophosphate; TPA, 12-0-tetradecanoylphorbol-13-acetate.
12517

12518 GTP and Exocytotic Insulin Release orottc
de novo- PRPP --+ SUMP acld ATP q g
I
Adenylosuccmate Synthetase IGuan[nej' '
Adenylosuccinate - AMP a ADP &$-m Adenylo- ?GTP GTP
P R P P P I APRT AK
1 Adenine]
FIG. 1. Schematization of the pathways for synthesis of the NTPs studied in islets. The pathways themselves have only been formally studied in non-islet cells, and their existence in islets is only presumptive but compatible with the data reported herein. Several cofactors, modulators, and intermediate steps have been omitted for the sake of clarity. Additional abbreviations: OPRT, orotate phos- phoribosyltransferase; ODC, orotic acid decarboxylase; PRPP, phos- phoribosylpyrophosphate; HGPRT, hypoxanthine-guanine phosphor- ibosyltransferase; NMPK, nucleoside monophosphokinase; NDPK, nucleoside diphosphokinase; APRT, adenine phosphoribosyltransfer- ase; AK, adenylate (AMP) kinase; XMP, xanthosine monophosphate.
the relevant diluent(s) were added to all control tubes. HPLC columns were purchased from Alltech (Deerfield, IL); HPLC water was pur- chased from Fisher (Itasca, IL). RPMI 1640 medium was purchased from GIBCO.
Isolation and Treatment of Pancreatic Islets for Studies of Insulin Release-Intact pancreatic islets were isolated from adult male Spra- gue-Dawley rats using collagenase digestion and separation from acinar tissue and debris on Ficoll gradients, as previously described (28-32). Islets were cultured overnight (32) in RPMI 1640 medium (containing 10% fetal calf serum, 11.1 mM glucose, 100 units/ml penicillin, and 100 pg/ml of streptomycin), except in studies involving freshly isolated islets (in Table I); the details for the isolation, culture, and incubation of these islets for batch-type, static assessments of insulin release have also been published (28-32). The incubation medium was Krebs-Ringer bicarbonate buffer, pH 7.4, containing 0.5% bovine serum albumin and 3.3 or 16.7 mM glucose (as indicated), gassed with 9.5% 02, 5% CO,. Except where indicated otherwise, static, hatch-type incubations were for 45 min so as to include contributions from both first and second phase secretion. Except where indicated, inosine monophosphate dehydrogenase inhibitors (and other test agents) were present during not only the culture period but also were included in any islet picking, wash, or preincu- bation steps to avoid attenuation of their effects over time. However, drugs were generally excluded from the incubation period after pre- liminary studies (see "Results") demonstrated that their effects were not rapidly dissipated after removal.
To study dynamic (phasic) insulin release, 100 islets were placed into each of two chambers and were perifused, using a previously described procedure (33). In brief, perifusion medium was pumped using a P-3 peristaltic pump (Pharmacia LKB Biotechnology Inc.) through Teflon tubing (Tygon, Fisher) to two on-line Swinney filter holders (Fisher) containing 62-pm pore size polyethylene filters (Tetko, Briarcliff Manor, NY). Islets were perifused for 18 min at 3.3 mM glucose followed by 40 min at 16.7 mM glucose in Krebs-Ringer bicarbonate buffer containing 0.5% bovine serum albumin, gassed with 95% 02, 5% COS (flow rate, 1.0-1.2 ml/min). Samples were collected for the last 9 min at the low glucose concentration every 1 min, and every 1 min for 15 min at the high glucose concentration, followed by every 2 min thereafter. After 45 min at 16.7 mM glucose alone, 50 mM K' was added (at 16.7 mM glucose) and samples were collected every minute for 22 more min. The dead space (-7 ml) was monitored by movement of an air bubble which marked the introduc- tion of any changes in media.
Insulin Content and Fractional Release-After incubations to as- sess insulin release, the tubes containing islets, still resting on their polyethylene filters (31, 32), were placed in 15-ml conical centrifuge
tubes containing 1 ml of acid alcohol (comprised of 77% absolute ethanol, 22% water, and 1% concentrated HC1 (v/v)), sonicated and left overnight at 4 "C. After 20 h, 1 ml of phosphate-buffered saline and 30 p1 of 5 N NaOH were added to raise the pH to 8.0, and the contents were vortexed after removing the glass tube but leaving the mesh filter containing the islets. Tubes were centrifuged at 4 "C for 5 min (X2000 rpm); the supernatant was removed, diluted ( 1 : l O ) in radioimmunoassay buffer (phosphate-buffered saline) to a final dilu- tion of 1:20, and assayed.
Insulin content of media or of islets was measured by radioimmuno- assay as described (31, 32).
Determination of Nucleotides-Islets were cultured overnight (as described above and in Ref. 32) except that 200 islets for each cmdition were cultured in individual dishes containing various ex- perimental substances, so that islets could be rapidly extracted the next day without the need for time-consuming counting and aliquot- ing (during which the NTP contents might change). The next morn- ing islets were placed (using siliconized Pasteur pipettes) into silicon- ized borosilicate tubes at 2-4 "C and were allowed to settle for 5 min. Culture medium was then removed and islets were resuspended in 1 ml of Krebs-Ringer buffer containing 0.5% bovine serum albumin (3.3 mM glucose) and were transferred to a 1.5-ml microcentrifuge tube. They were rapidly (1 min) spun down at 4 "C (X1000 rpm) to lightly pellet the islets. All but 20-50 p1 of Krebs-Ringer buffer was removed and discarded. To this was added 290 pl of 0.6 N trichloro- acetic acid, containing sufficient internal standard (CTP and ITP) to yield a final concentration of 0.8 nmo1/100 pl. Islets were lightly vortexed and then sonicated (2 X 20 s) on ice using a Branson 450 sonifier (Danbury, CO). All debris was pelleted at 4 "C (5 min at 10,000 rprn), and the 300 pl of supernatant was transferred to a fresh microfuge tube. Samples were extracted four times using 0.75 ml of ether (to remove the trichloroacetic acid) and vigorous vortexing. The ether phase was discarded. Any residual ether was allowed to evapo- rate at 4 "C, and then samples were directly analyzed by HPLC or frozen at -20 "C for future analysis within 2 weeks. There was no difference in results between the two handling procedures.
HPLC was carried out using a modification of the procedure of Hoenig and Matschinsky (21). A LiChrosorb-NH2 anion-exchange column (Alltech) was used without a guard column. The HPLC apparatus was comprised of a Waters M6000 pump and a Waters M45 pump, with a U6K injector and a Waters model 441 UV detector. The detector was set at 254 nM and 0.02-0.005 absorbance units at full scale. Buffer A was 0.5 mM NH4H2P04, adjusted to pH 2.65 using phosphoric acid; buffer B was 0.65 M NH4H2P04, pH 2.65. Usually 21-24% of buffer B was used but the exact proportions of buffers A and B and the pH were varied by solvent programmer (Waters model 660) each morning in order to maximize separations, which were affected by changes in columns or new batches of solvent, and especially by even minor changes in pH. Separations were achieved by isocratic elution at 1.0-1.3 ml/min. Representative retention times are shown in Fig. 2A. One-hundred p1 of sample (comprising the extract of about 70 islets) was usually injected, but 50-150 pl gave equivalent results in quantitation of the content of ATP, UTP, and GTP. All samples were analyzed using the mean of duplicate or triplicate injections. Since preliminary studies indicated that ITP and CTP were not detectable in islets under these conditions, both nucleotides were added to samples as internal standards, and results were corrected for the mean recovery of the two exogenous nucleo- tides. A standard curve was routinely run each day covering the relevant range (0.2-1.0 nmol) of ITP, CTP, GTP, ATP, and UTP.
Recoveries of CTP and ITP were 99 t 1% (n = 54) and 88 f 1% ( n = 53), respectively. Intra-assay coefficients of variation for injec- tions was low when replicate injections were made on separate days. For example, when 3 aliquots from single samples were injected in differing volumes (varying between 50 and 100 pl) on 3 sequential days, coefficients of variation averaged 5.5 k 1.3% (n = 26; range of NTP = 0.44-12.79 pmol/islet). However, coefficients of variation were lower for NTP levels above 2 pmol/islet (2.7 f 0.5%) than for very suppressed levels under 0.6 pmol/islet (18 f 2%). Interexperi- ment coefficients of variation for basal islet nucleotide contents (cf. Table VII) were 6.8, 7.2, and 10.8%, respectively, for ATP, GTP, and UTP.
Data Presentation and Statistical Analysis-Insulin secretion is expressed as microunits/lO islets/unit time (mean f S.E.) for static incubations and as microunits/ml of perifusate for perifusions. Incre- mental release is expressed as the value for insulin released under stimulated conditions (minus) the mean value for basal release (ie. a t 3.3 mM glucose) in that same study. Insulin content is expressed
GTP and Exocytotic Insulin Release 12519 A. Standards
(0.2 nrnoles) B. Control
(n:35 islets) C. +MI
251 lhenolic Acid, rnl (n=35islets)
TABLE I Effects of short-term provision of MPA (25 pg/mlj on glucose- or K+-
stimulated insulin release Islets were studied freshly isolated or cultured overnite as described
in the text. In the latter case, MPA was absent from the culture medium. MPA had no significant effect under any condition. Num- bers in parentheses = numbers of observations; mean f S.E.
Insulin
period) Condition (microunits.incubation
MPA present in 45-min preincubation and 15-min incubation periods (freshly isolated islets)
Control (3.3 mM glucose) 94 k 3 (3) Control (3.3 mM glucose + MPA) 66 k 7 (3)
16.7 mM glucose 16.7 mM glucose + MPA
481 f 54 (5) 416 f 26 (5)
MPA present present in 45-min preincubation period and 45-min incubation periods (freshly isolated islets)
Control (3.3 mM glucose) 78 f 16 (3) Control (3.3 mM glucose + MPA) 76 f 1 (3)
16.7 mM glucose 16.7 mM glucose + MPA
1054 f 47 (5) 1060 f 82 (4)
G i P G i P
Time-
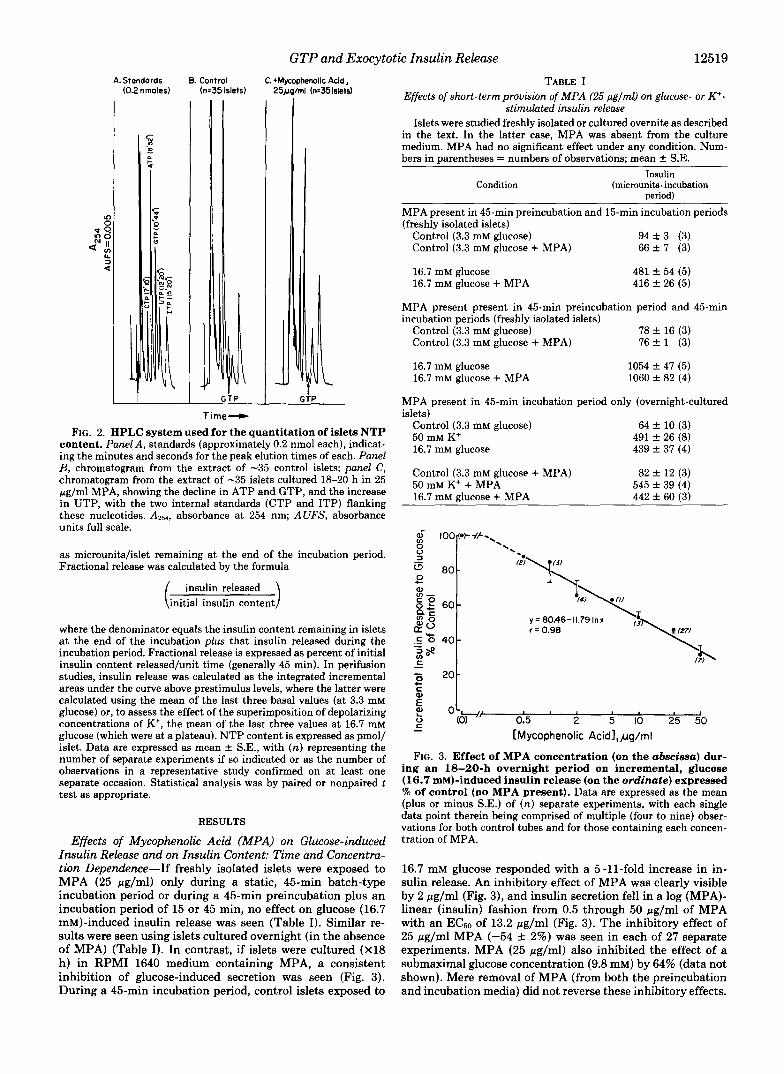
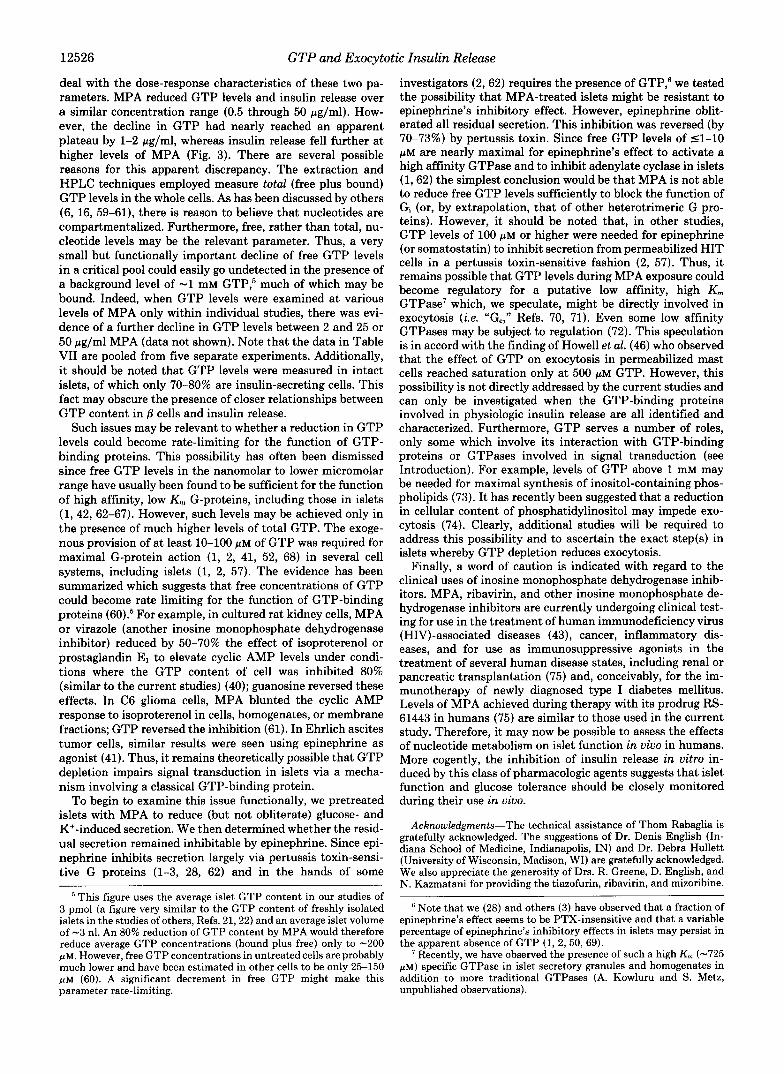
FIG. 2. HPLC system used for the quantitation of islets NTP content. Panel A, standards (approximately 0.2 nmol each), indicat- ing the minutes and seconds for the peak elution times of each. Panel B, chromatogram from the extract of -35 control islets; panel C, chromatogram from the extract of -35 islets cultured 18-20 h in 25 pg/ml MPA, showing the decline in ATP and GTP, and the increase in UTP, with the two internal standards (CTP and ITP) flanking these nucleotides. A251, absorbance at 254 nm; AUFS, absorbance units full scale.
as microunits/islet remaining at the end of the incubation period. Fractional release was calculated by the formula
insulin released initial insulin content
where the denominator equals the insulin content remaining in islets a t the end of the incubation plus that insulin released during the incubation period. Fractional release is expressed as percent of initial insulin content released/unit time (generally 45 min). In perifusion studies, insulin release was calculated as the integrated incremental areas under the curve above prestimulus levels, where the latter were calculated using the mean of the last three basal values (at 3.3 mM glucose) or, to assess the effect of the superimposition of depolarizing concentrations of K', the mean of the last three values at 16.7 mM glucose (which were at a plateau). NTP content is expressed as pmol/ islet. Data are expressed as mean k S.E., with (n) representing the number of separate experiments if so indicated or as the number of observations in a representative study confirmed on at least one separate occasion. Statistical analysis was by paired or nonpaired t test as appropriate.
RESULTS
Effects of Mycophenolic Acid (MPA) on Glucose-induced Insulin Release and on Insulin Content: Time and Concentra- tion Dependence-If freshly isolated islets were exposed to MPA (25 pg/ml) only during a static, 45-min batch-type incubation period or during a 45-min preincubation plus an incubation period of 15 or 45 min, no effect on glucose (16.7 mM)-induced insulin release was seen (Table I). Similar re- sults were seen using islets cultured overnight (in the absence of MPA) (Table I). In contrast, if islets were cultured (X18 h) in RPMI 1640 medium containing MPA, a consistent inhibition of glucose-induced secretion was seen (Fig. 3). During a 45-min incubation period, control islets exposed to
MPA present in 45-min incubation period only (overnight-cultured islets)
Control (3.3 mM glucose) 64 * 10 (3) 50 mM K+ 491 f 26 (8) 16.7 mM glucose 439 f 37 (4)
Control (3.3 mM glucose + MPA) 82 f 12 (3) 50 mM K+ + MPA 545 f 39 (4) 16.7 mM glucose + MPA 442 f 60 (3)
- [Mycophenolic Ac id l ,~g /ml
FIG. 3. Effect of MPA concentration (on the abscissa) dur- ing an 18-20-h overnight period on incremental, glucose (16.7 mM)-induced insulin release (on the ordinate) expressed % of control (no MPA present). Data are expressed as the mean (plus or minus S.E.) of (n) separate experiments, with each single data point therein being comprised of multiple (four to nine) obser- vations for both control tubes and for those containing each concen- tration of MPA.
16.7 mM glucose responded with a 5-11-fold increase in in- sulin release. An inhibitory effect of MPA was clearly visible by 2 pg/ml (Fig. 3), and insulin secretion fell in a log (MPA)- linear (insulin) fashion from 0.5 through 50 pg/ml of MPA with an EC6,, of 13.2 pg/ml (Fig. 3). The inhibitory effect of 25 pg/ml MPA (-54 f 2%) was seen in each of 27 separate experiments. MPA (25 pg/ml) also inhibited the effect of a submaximal glucose concentration (9.8 mM) by 64% (data not shown). Mere removal of MPA (from both the preincubation and incubation media) did not reverse these inhibitory effects.
12520 GTP and Exocytotic Insulin Release
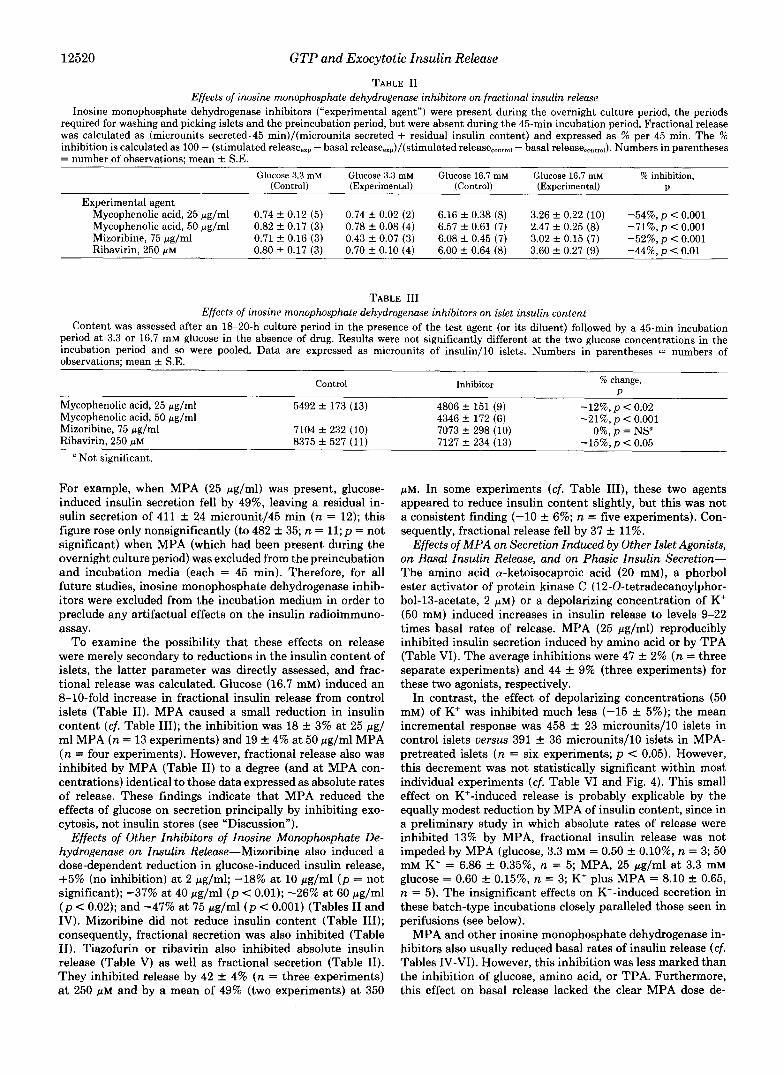
TABLE I1 Effects of inosine monophosphate dehydrogenase inhibitors on fractional insulin release
Inosine monophosphate dehydrogenase inhibitors (“experimental agent”) were present during the overnight culture period, the periods required for washing and picking islets and the preincubation period, but were absent during the 45-min incubation period. Fractional release was calculated as (microunits secreted.45 min)/(microunits secreted + residual insulin content) and expressed as % per 45 min. The % inhibition is calculated as 100 - (stimulated release,,, - basal release,,,)/(stimulated release,,.,,,l - basal release,,,,,,^). Numbers in parentheses = number of observations; mean f S.E.
Glucose 3.3 mM Glucose 3.3 mM Glucose 16.7 mM Glucose 16.7 rnM % inhibition, (Control) (Experimental) (Control) (Exuerimental) U
Experimental agent Mycophenolic acid, 25 pg/ml 0.74 f 0.12 (5) 0.74 f 0.02 (2 ) 6.16 f 0.38 (8) 3.26 f 0.22 (10) -54%,p < 0.001 Mycophenolic acid, 50 pg/ml 0.82 f 0.17 (3) 0.78 f 0.08 (4) 6.57 k 0.61 (7) 2.47 f 0.25 (8) -71%, p < 0.001 Mizoribine, 75 pg/ml 0.71 k 0.16 (3) 0.43 f 0.07 (3) 6.08 f 0.45 (7) 3.02 f 0.15 (7) -52%, p < 0,001 Ribavirin, 250 p~ 0.80 k 0.17 (3) 0.70 f 0.10 (4) 6.00 f 0.64 (8) 3.60 f 0.27 (9) -44%,p < 0.01
TABLE I11 Effects of inosine monophosphate dehydrogenase inhibitors on islet insulin content
Content was assessed after an 18-20-h culture period in the presence of the test agent (or its diluent) followed by a 45-min incubation period at 3.3 or 16.7 mM glucose in the absence of drug. Results were not significantly different at the two glucose concentrations in the incubation period and so were pooled. Data are expressed as microunits of insulin/lO islets. Numbers in parentheses = numbers of observations; mean f S.E.
Control Inhibitor % change, P
Mycophenolic acid, 25 pg/ml 5492 f 173 (13) 4806 f 151 (9) Mycophenolic acid, 50 pg/ml 4346 f 172 (6) Mizoribine, 75 pg/ml 7104 f 232 (10) 7073 f 298 (10) Ribavirin, 250 p~ 8375 f 527 (11) 7127 f 234 (13)
-12%, p < 0.02 -21%, p < 0.001
O%,p = NS” -15%,p < 0.05
a Not significant.
For example, when MPA (25 pg/ml) was present, glucose- induced insulin secretion fell by 49%, leaving a residual in- sulin secretion of 411 f 24 microunit/45 min (n = 12); this figure rose only nonsignificantly (to 482 f 35; n = 11; p = not significant) when MPA (which had been present during the overnight culture period) was excluded from the preincubation and incubation media (each = 45 min). Therefore, for all future studies, inosine monophosphate dehydrogenase inhib- itors were excluded from the incubation medium in order to preclude any artifactual effects on the insulin radioimmuno- assay.
To examine the possibility that these effects on release were merely secondary to reductions in the insulin content of islets, the latter parameter was directly assessed, and frac- tional release was calculated. Glucose (16.7 mM) induced an 8-10-fold increase in fractional insulin release from control islets (Table 11). MPA caused a small reduction in insulin content (cf. Table 111); the inhibition was 18 f 3% at 25 pg/ ml MPA (n = 13 experiments) and 19 f 4% at 50 pg/ml MPA (n = four experiments). However, fractional release also was inhibited by MPA (Table 11) to a degree (and at MPA con- centrations) identical to those data expressed as absolute rates of release. These findings indicate that MPA reduced the effects of glucose on secretion principally by inhibiting exo- cytosis, not insulin stores (see “Discussion”).
Effects of Other Inhibitors of Inosine Monophosphate De- hydrogenase on Insulin Release-Mizoribine also induced a dose-dependent reduction in glucose-induced insulin release, +5% (no inhibition) at 2 pg/ml; -18% at 10 pg/ml ( p = not significant); -37% at 40 pg/ml ( p < 0.01); -26% at 60 pg/ml ( p < 0.02); and -47% at 75 pg/ml ( p c 0.001) (Tables I1 and IV). Mizoribine did not reduce insulin content (Table 111); consequently, fractional secretion was also inhibited (Table 11). Tiazofurin or ribavirin also inhibited absolute insulin release (Table V) as well as fractional secretion (Table 11). They inhibited release by 42 f 4% (n = three experiments) at 250 pM and by a mean of 49% (two experiments) at 350
p ~ . In some experiments (cf. Table 111), these two agents appeared to reduce insulin content slightly, but this was not a consistent finding (-10 f 6%; n = five experiments). Con- sequently, fractional release fell by 37 f 11%.
Effects of MPA on Secretion Induced by Other Islet Agonists, on Basal Insulin Release, and on Phasic Insulin Secretion- The amino acid a-ketoisocaproic acid (20 mM), a phorbol ester activator of protein kinase C (12-0-tetradecanoylphor- bol-13-acetate, 2 p ~ ) or a depolarizing concentration of K’ (50 mM) induced increases in insulin release to levels 9-22 times basal rates of release. MPA (25 pg/ml) reproducibly inhibited insulin secretion induced by amino acid or by TPA (Table VI). The average inhibitions were 47 f 2% (n = three separate experiments) and 44 f 9% (three experiments) for these two agonists, respectively.
In contrast, the effect of depolarizing concentrations (50 mM) of K’ was inhibited much less (-15 f 5%); the mean incremental response was 458 f 23 microunits/lO islets in control islets versus 391 f 36 microunits/lO islets in MPA- pretreated islets (n = six experiments; p < 0.05). However, this decrement was not statistically significant within most individual experiments (cf. Table VI and Fig. 4). This small effect on K’-induced release is probably explicable by the equally modest reduction by MPA of insulin content, since in a preliminary study in which absolute rates of release were inhibited 13% by MPA, fractional insulin release was not impeded by MPA (glucose, 3.3 mM = 0.50 -+ 0.10%, n = 3; 50 mM K’ = 6.86 k 0.35%, n = 5; MPA, 25 pg/ml at 3.3 mM glucose = 0.60 -+ 0.15%, n = 3; Kf plus MPA = 8.10 f 0.65, n = 5). The insignificant effects on K’-induced secretion in these batch-type incubations closely paralleled those seen in perifusions (see below).
MPA and other inosine monophosphate dehydrogenase in- hibitors also usually reduced basal rates of insulin release (cf. Tables IV-VI). However, this inhibition was less marked than the inhibition of glucose, amino acid, or TPA. Furthermore, this effect on basal release lacked the clear MPA dose de-

GTP and Exocytotic Insulin Release 12521 TABLE IV
Effects of guanine and other purine bases on the inhibition of insulin release by inosine monophosphate dehydrogenase inhibitors
Data are expressed as . insulin released at 3.3 mM glucose Insulin released at 16.7 mM glucose'
Control Inhibitor alone
3.3 mMglucOse/ 16.7 mM glucose
MPA 25 pg/ml plus guanine 55 f 12 (3) 396 f 29 (6)
MPA 50 pg/ml plus guanine
MPA 25 pg/ml plus adenine
MPA 25 pg/ml plus xanthine or hypoxanthine
Mizoribine, 60 pg/ml plus gua-
Mizoribine, 75 pg/ml plus gua- nine
nine
40 f 7 (3) 416 f 10 (6)
50 f 2 (4) 546 + 27 (8) 60 2 1 (2)
586 f 38 (5) 67 f 3 (3)
527 k 35 (8) 60 + 1 (2)
586 f 38 (5)
47 + 8 (3) 432 f 18 (5)
3.3 mM glucose/ 16.7 mM glucose 39 f 5 (3)
239 f 13 (5)
55 f 7 (3)
39 f 3 (2) 322 f 32 (5) 31 + 5 (3)
219 f 41 (7)
Inhibitor DIUS base
Degree of reversal"
+ Guanine, 5 pMb
+ Guanine, 30 pMh
+ Guanine, 100 pMb
+ Guanine, 30 pMC
+ Guanine, 100 pM'
+ Guanine, 50 pMC
+ Adenine, 30 pMC
+ Adenine, 150 pMC
+ Xanthine, 30 pMc
+ Hypoxanthine, 30 p M C
+ Guanine, 30 pM'
+ Guanine, 30 pMC
3.3 mM glucose/ 16.7 mM glucose 45 + 8 (3)
315 f 19 (5) 43 f 11 (2)
392 f 25 (5) 55 f 10 (3)
390 f 23 (5) 32 f 1 (2)
378 f 28 (5) 41 -t 7 (2)
412 f 34 (5) 104 f 8 (3) 515 f 15 (7)
19 f 3 (2) 251 f 32 (5) 58 f 14 (3)
257 f 20 (7) 19 f 11 (2)
163 + 31 (5) 30 f 9 (2)
211 f 24 (4) 44 -+ 9 (2)
536 f 23 (5)
%
49
100
95
80
98
69
15
0
0
2
100
50 k 4 (3) 451 f 12 (8)
100
a Reversal = 100 - [(% inhibition in presence of base)/(% inhibition in absence of base)], where % inhibition is calculated as in Table 11.
' Bases were excluded from the incubation medium. Bases were included in the incubation medium.
TABLE V Effects of tiazofurin and ribavirin on glucose-induced insulin release
Drugs were present during overnight culture, washing, and picking of islets and preincubation period but not the incubation period. Numbers in parentheses = numbers of observations; mean f S.E.
Condition Insulin
3.3 mM glucose 16.7 mM glucose
3.3 mM glucose + tiazofurin, 250 p M
16.7 mM glucose + tiazofurin, 250 pM
3.3 mM glucose + ribavirin, 250 p M
16.7 mM glucose + ribavirin, 250 pM
microunit. 45 min
505 f 34 (8) A = 435 70 k 6 (3)
60 f 7 (4)
304 _t 20 (8) A = 244, -44%, p < 0.001
44 f 5 (4) A = 229, -47%, p < 0.001
273 f 31 (9)
pendence seen with glucose-stimulated insulin release.' For example, inhibition of basal secretion was not consistently seen at 2-10 pg/ml MPA whereas a similar degree of inhibi- tion was seen at 25 pg/ml(-27 f 5%, n = 25 experiments) as at 50 pg/ml(-21 f lo%, n = five experiments). Furthermore, effects of MPA on basal insulin release were attenuated or
However, it should be noted that, unlike stimulated secretion, basal insulin release in vitro probably reflects variable amounts of nonsuppressible leakage, making quantitative assessments of the degree of inhibition somewhat unreliable.
lost when expressed as fractional secretion (cf. Table 11, and data in preceding paragraph). Thus, fractional release basally in MPA-pretreated islets was 110 f 14% of control ( n = nine experiments, p = not significant) at 25 pg/ml MPA and 97 f 14% ( n = three experiments, p = not significant) at 50 pg/ ml. These findings suggest that the effects of MPA on basal release (like those on Kf-induced secretion) may have resulted at least in part from the modest reduction in insulin content induced by MPA. Compatible with this was the finding that, in preliminary studies, guanine did not seem to consistently prevent the reduction induced by MPA in basal or K'-induced insulin release (data not shown).
To examine effects of MPA on phasic insulin release, cultured islets were also perifused (Fig. 5). Glucose (16.7 mM) induced peak increases in rates of insulin release from control islets during the first phase (0-5 min) or the second phase (6- 45 min) of secretion of 7- and 9-fold, respectively. In each of four separate perifusions, islets cultured in the presence of MPA demonstrated clear inhibition of both phases of secre- tion (Fig. 5). The average inhibition of (incremental) areas under the curves for the entire 45-min perifusion period was 63 f 8%; this figure closely matches the data from the batch- type incubations described above. First-phase release was inhibited by 86 k 6% (Fig. 5, inset). In contrast, when 50 mM K+ was added after 45 min at 16.7 mM glucose, the incremental insulin response was inhibited insignificantly by MPA (-11 f 5%, Fig. 5), as had been observed in static incubations.
Effects of Exogenous Purines on Insulin Release and the
12522 GTP and Exocytotic Insulin Release
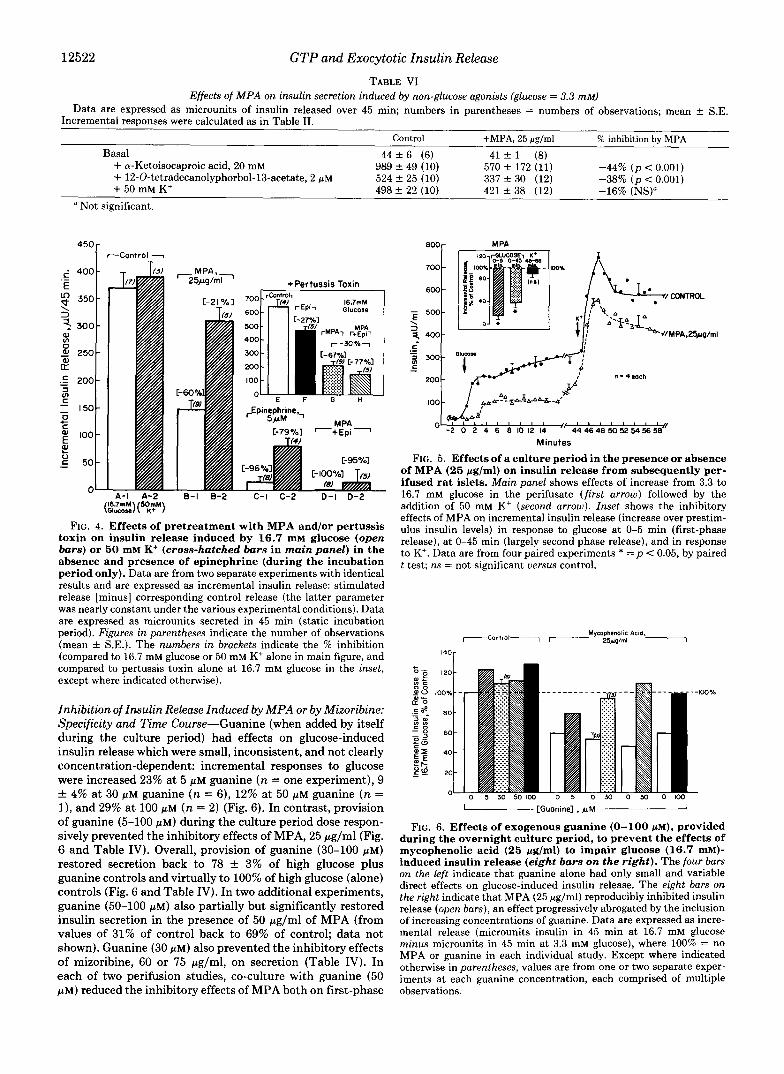
TABLE VI Effects of MPA on insulin secretion induced by non-glucose agonists (glucose = 3.3 mM)
Data are expressed as microunits of insulin released over 45 min; numbers in parentheses = numbers of observations; mean f S.E. Incremental responses were calculated as in Table 11.
Control +MPA, 25 pglml % inhibition by MPA
+ a-Ketoisocaproic acid, 20 mM 989 f 49 (10) 570 f 172 (11) -44% (p < 0.001) + 12-O-tetradecanolyphorbol-13-acetate, 2 p~ 524 f 25 (10) 337 f 30 (12) -38% (p < 0.001)
498 f 22 (10) 421 f 38 (12) -16% (NS)"
Basal 44 f 6 (6) 41 -t 1 (8)
+ 50 mM K+ a Not significant.
.- 6 400-
E 2 350-
a, v)
S! 250- 0
3 300-
B .t - 200-
Ln 3
- 150- c
0 c
- + E loo- ? V - C 5 0 -
0- A-I A-2
300
200
IO0
+Pertussis Toxin
16.7mM rEp i l Glucose [-27%1
F G H
Cpinephrine,, 5 4 M
C-79%1 -+€pi - M PA
TI4 J
8-1 8-2 116.7n" 15OiM\
C-l C-2 D - l D-2 \Glucose/\ K+ /
FIG. 4. Effects of pretreatment with MPA and/or pertussis toxin on insulin release induced by 16.7 mM glucose (open bars) or 50 mM K+ (cross-hatched bars in main panel) in the absence and presence of epinephrine (during the incubation period only). Data are from two separate experiments with identical results and are expressed as incremental insulin release: stimulated release [minus] corresponding control release (the latter parameter was nearly constant under the various experimental conditions). Data are expressed as microunits secreted in 45 min (static incubation period). Figures in parentheses indicate the number of observations (mean f S.E.). The numbers in brackets indicate the % inhibition (compared to 16.7 mM glucose or 50 mM K+ alone in main figure, and compared to pertussis toxin alone at 16.7 mM glucose in the inset, except where indicated otherwise).
Inhibition of Insulin Release Induced by MPA or by Mizoribine: Specificity and Time Course-Guanine (when added by itself during the culture period) had effects on glucose-induced insulin release which were small, inconsistent, and not clearly concentration-dependent: incremental responses to glucose were increased 23% at 5 p~ guanine (n = one experiment), 9 & 4% at 30 pM guanine (n = 6), 12% at 50 p M guanine (n = I), and 29% at 100 pM (n = 2) (Fig. 6). In contrast, provision of guanine (5-100 p ~ ) during the culture period dose respon- sively prevented the inhibitory effects of MPA, 25 pg/ml (Fig. 6 and Table IV). Overall, provision of guanine (30-100 p ~ ) restored secretion back to 78 f 3% of high glucose plus guanine controls and virtually to 100% of high glucose (alone) controls (Fig. 6 and Table IV). In two additional experiments, guanine (50-100 p ~ ) also partially but significantly restored insulin secretion in the presence of 50 pg/ml of MPA (from values of 31% of control back to 69% of control; data not shown). Guanine (30 p ~ ) also prevented the inhibitory effects of mizoribine, 60 or 75 pg/ml, on secretion (Table IV). In each of two perifusion studies, co-culture with guanine (50 PM) reduced the inhibitory effects of MPA both on first-phase
700 -
600 -
\ 3
500-
Minutes
FIG. 5. Effects of a culture period in the presence or absence of MPA (25 pg/ml) on insulin release from subsequently per- ifused rat islets. Main panel shows effects of increase from 3.3 to 16.7 mM glucose in the perifusate (first arrow) followed by the addition of 50 mM K' (second arrow). Inset shows the inhibitory effects of MPA on incremental insulin release (increase over prestim- ulus insulin levels) in response to glucose at 0-5 min (first-phase release), at 0-45 min (largely second phase release), and in response to K'. Data are from four paired experiments * = p < 0.05, by paired t test; ns = not significant uersus control.
lS0,
0 5 30 50100 0 5 O M 0 5 0 0 1 0 0
-[Guanine] , @ M A
FIG. 6. Effects of exogenous guanine (0-100 pM), provided during the overnight culture period, to prevent the effects of mycophenolic acid (25 pg/ml) to impair glucose (16.7 mM)- induced insulin release (eight bars on the right). The four bars on the left indicate that guanine alone had only small and variable direct effects on glucose-induced insulin release. The eight bars on the right indicate that MPA (25 Ng/ml) reproducibly inhibited insulin release (open bars), an effect progressively abrogated by the inclusion of increasing concentrations of guanine. Data are expressed as incre- mental release (microunits insulin in 45 min at 16.7 mM glucose
MPA or guanine in each individual study. Except where indicated minus microunits in 45 min at 3.3 mM glucose), where 100% = no
otherwise in parentheses, values are from one or two separate exper- iments at each guanine concentration, each comprised of multiple observations.

GTP and Exocytotic Insulin Release 12523 + " A T P - " G T P - r U T P - e
i 14r A 1 %
MPA,25pg/ml - - Adenine.l50pM - -
+ + + + " + + + + FIG. 7. Effects of provision of adenine (150 WM) on insulin
release (main panel; numbers in parentheses = numbers of observations) or NTP content of islets (inset, n = 3 each). The open bars in the main panel are values at a substimulatory glucose concentration (3.3 mM); the shaded or cross-hatched bars are at 16.7 mM glucose. The figures in brackets in the main panel indicating A reflect the % inhibition by MPA (25 yglml) of glucose-induced insulin release in the absence and presence of adenine, respectively, each compared to its respective control (diluent or adenine alone, respec- tively).
and on second-phase insulin release stimulated by glucose, but did not alter K+-induced secretion (data not shown). In contrast, neither adenine, xanthine, nor hypoxanthine (30 p ~ ) , nor 150 PM adenine, had any restorative effects in batch type incubations (Table IV and Fig. 7). In preliminary studies, 150 p~ adenine also failed to prevent the inhibitory effect of MPA on islet insulin content.
The effects of guanine were time-dependent. In a prelimi- nary study, wherein the purine base (50 PM) was provided only during a preincubation period of 30 min, the inhibition of glucose-induced insulin release caused by MPA (-59%) was reduced (to -39%) by guanine, whereas the addition of 50 PM guanine to the overnight culture period as well reduced the degree of inhibition considerably more (to 13% less than control).
Effects of Inhibitors of Inosine Monophosphate Dehydrogen- ase on Islets Nucleotide Triphosphate (NTP) Levels-"PA led to a concentration-dependent reduction of GTP, beginning at 50.5 pg/ml and reaching apparent saturation at an inhi- bition of 8041% (Table VII). This is the same range of concentrations over which insulin secretion was inhibited. MPA (25 rg/ml) caused a lesser inhibition (maximal inhibi- tion = 43%) in ATP levels and a stimulation (to 208% of control) in UTP levels (Table VII). All three changes were largely, albeit not totally, prevented by provision of guanine (Fig. 8). Likewise, 75 pg/ml mizoribine (a concentration which reproducibly inhibited insulin secretion; see above), caused a guanine-sensitive reduction in ATP and GTP, and an incre- ment in UTP, to 61 f 1, 32 f 1, and 201% of control, respectively (all p < 0.001) (Fig. 9). Guanine (30 p ~ ) , a concentration which totally restored insulin secretion (Table JV), restored GTP to 125 9% of control, while leaving ATP still reduced (75 f 2% of control, p < 0.001) and UTP still somewhat elevated (135 f 6%, p < 0.01) (Fig. 9). In a prelim- inary experiment, islets cultured in the presence of guanine 50 p~ (in the absence of MPA), had ATP, GTP, and UTP
"
TABLE VI1 Effect of MPA on nucleotide triphosphate content of islets
The numbers in parentheses = numbers of observations; mean f S.E. Data are from five separate experiments. The numbers in brack- ets = % reduction from control values. Data are expressed as pmol/ islet.
MPA conc., pglml ATP GTP U T P
0 (13) 12.60 f 0.22 2.71 f 0.08 3.16 f 0.08 0.5 (2) 8.6 f 0.20 0.92 f 0.04 3.54 f 0.14
1.0 (2) [-24 f 2%] [-60 f 2%] [+28 f 5%] 6.44 f 0.67 0.50 f 0.10 4.09 f 0.44
[-43 & 6%] [-78 f 5%] [+48 + 16761 2.0 (4) 7.63 2 0.50 0.55 k 0.07 5.31 f 0.19
[-36 k 3%] [-782 3%] [+87 f 8%] 25.0 (13) 7.66 & 0.26 0.52 f 0.03 5.90 f 0.21
50.0 (5) 8.04 f 0.28 0.50 f 0.02 1-32 t 3%] 1-80 f 1%1
(-39 f 2%] [-81f 1%)
ATP 16 6.4-
14 12 4.8 -
5.6 -
IO 4.0 - 8 6 2.4 -
3.2 -
4 1.6- 2 a8 - 0 a0 -
M P A , 2 5 ~ / m l - + + Guanine.MpM - - + - -
- + +
[+87 f 4%] 5.95 f 0.34
r + l o a f 15%1
UTP
- + + - - +
FIG. 8. Effects of MPA (25 Fg/ml), in the presence or ab- sence of exogenous guanine (50 WM), on NTP content of islets (expressed as pmol/islet). Numbers in parentheses reflect numbers of observations. MPA reduced the content of GTP, ATP, and UTP (eachp < 0.001). In the presence of guanine, levels of each approached control levels but GTP and ATP were still significantly reduced (by 26 and 14%, p < 0.01 and < 0.001, respectively), whereas UTP was still slightly elevated (+20%, p < 0.02).
ATP
'"1 I4
12 3 -
f 10
; e 2 - h
- "3
6
4 I -
2
0 0-
GTP UTP
" + + - + + Mlmribine,75ml- + + G u m n e . 3 0 ~ M - - + - - + " t
FIG. 9. Effects of mizoribine (75 pg/ml) in the presence or absence of exogenous guanine (30 pM) on NTP content of islets (expressed as pmol/islet). Numbers in parentheses reflect numbers of observations. Mizoribine reduced each nucleotide (eachp < 0.001). Values in the presence of mizoribine plus guanine indicated that GTP was slightly (25%, p < 0.05) greater than control values, ATP re- mained slightly (-25%, p < 0.001) reduced, and UTP remained somewhat (+35%,p < 0.01) elevated.
contents which were 98 f 3, 121 f 0.33, and 98 f 3% of control. (Note that the slight rise in GTP content of control islets when cultured in the presence of guanine seems to match a slight augmentation of glucose-induced insulin re- lease from control islets; Fig. 6.)
Since the effects of the inosine monophosphate dehydro- genase inhibitors not only reduced GTP, but also caused more minor changes in UTP and ATP, islets were cultured in the
12524 GTP and Exocytotic Insulin Release
presence of MPA (25 pg/ml) plus adenine (150 p ~ ) . The latter nearly totally vitiated the change in ATP and UTP, leaving GTP selectively inhibited (Fig. 7, inset). As indicated above, under these conditions of selective GTP depletion, insulin release was still inhibited (Table IV and Fig. 7).
Effects of MPA Pretreatment on the Inhibitory Effects of Epinephrine (Fig. 4)”Since the inhibitory effect of epineph- rine on insulin secretion involves an inhibitory GTP-binding protein (G, and/or Go, see “Discussion”) we determined whether MPA could reduce GTP levels sufficiently to limit Gi function.
MPA, as expected, significantly inhibited glucose (16.7 mM)-induced insulin secretion (by 60%, p < 0.001) and re- duced K’ (50 mM)-induced release much less (-21%,p = not significant) (Fig. 4, B versus A ) . Epinephrine (5 p ~ ) inhibited the effects of the two agonists by 96 and 79%, respectively (C versus A ) . We have previously ascertained that this effect involves an a2 adrenergic mechanism (28). When epinephrine was added to islets which had been pretreated with MPA, the residual insulin release nonetheless was totally sensitive to inhibition by epinephrine (D versus B ) . Rats were then pre- treated with pertussis toxin to determine whether the effect of epinephrine to inhibit the residual insulin release remain- ing after MPA pretreatment did, in fact, involve Gi or a related G protein, at least in part. The rats received 1.5 pg of pertussis toxin intraperitoneally 48 and 24 h prior to sacrifice; 100 ng/ml of the toxin was also added to the overnight dishes used to culture the islets. Islets from rats pretreated with pertussis toxin showed potentiated glucose-induced release ( E versus A-1 ). Furthermore, the inhibitory effect of epinephrine was reduced to 27% ( F versus E ) 3 from a control value of 96% (C versus A ) . The effect of MPA was not altered by pertussis toxin pretreatment (-67%, G versus E cf. to -60%, B-1 versus A - 1 ) . The addition of epinephrine to MPA-pretreated islets now led to only a blunted inhibition (-30%, H uersuS G), similar to that seen in epinephrine-exposed control islets from PTX-pretreated rats (-27%, F versus E ) , and, in fact, re- stored absolute insulin release to values (148 +. 23, condition H ) identical to those (148 18, condition B - I ) seen with MPA alone, indicating that PTX pretreatment has obliterated all of the additional inhibitory effect of epinephrine.
DISCUSSION
The four pharmacologic agents used all inhibit inosine monophosphate dehydrogenase (17,23-27,34,35) and are felt thereby to inhibit lymphocyte function and have immunosup- pressive properties (25, 36-38). The concentrations of MPA used are similar to those attainable i n vivo in mice or monkeys (34,39) treated with MPA (or its prodrug RS 61443, Ref. 38). Since such agents require several hours to reduce cellular levels of GTP (17, 40), the lack of an acute effect of MPA (Table I) not only is compatible with its proposed mechanism of action but also documents the absence of short term, nonspecific toxic effects. Likewise, the lack of reversibility of MPA’s inhibitory effect on secretion after simple removal from the medium for up to 45 min prior to assessments of insulin release, in conjunction with the ability of guanine (but not other purine bases) to prevent (reverse) the effects of the
,’ We (28) and others (3) have observed previously that PTX does not totally prevent epinephrine’s inhibitory effect. We have not attempted to verify that our experimental protocol achieved maximal ADP-ribosylation of the PTX substrate but only that epinephrine still was able to inhibit secretion despite a marked cellular depletion of GTP, and to verify that the major part of that inhibition was PTX- sensitive, and therefore involved, in all likelihood, an inhibitory GTP- binding protein.
test agents (MPA, mizoribine), supports a key role of guanine nucleotide availability in the mechanism(s) of action of this class of agents. The effects of mycophenolic acid and mizori- bine to inhibit inosine monophosphate dehydrogenase in a wide variety of cells are quite selective whether given in vivo or i n vitro (17, 23, 26, 27, 34, 35). However, MPA (35, 36) and possibly mizoribine (24) may also have smaller effects on GMP synthetase (Fig. l), an action which would potentiate the inhibition of guanine nucleotide levels. Tiazofurin and ribavirin also act principally to inhibit inosine monophos- phate dehydrogenase, although other minor effects have been observed (26, 27).
Although the current studies were not designed to directly characterize the pathways of NTP synthesis in pancreatic islets, and their interruption by these pharmacologic probes, the data are compatible with the following schema. Inhibition of GMP synthesis by MPA or mizoribine (Fig. 1) reduces cellular GTP levels. There is a secondary, more modest re- duction in ATP (since GTP is used to transphosphorylate ADP to ATP via nucleoside diphosphate kinase and is also required in the adenylosuccinate synthetase step, Fig. 1) (5- 7). This inhibition of ATP content is not a direct effect of MPA on ATP synthesis (35) and, in fact, in many cells (17, 27, 36, 37, 40-42) there is little change or even a modest rise in ATP, attendant presumably on the accumulation and re- direction of its precursor, IMP (Fig. 1). At the same time, in MPA-treated islets, as in other cells (36, 40), UTP increases, possibly as a result of an accumulation of phosphoribosylpy- rophosphate and/or of IMP (Fig. 1); the latter can act as a phosphoryl donor in nucleoside metabolism (431, which might favor the formation of UTP. Provision of guanine, by activat- ing the “salvage pathway” (HGPRT, Fig. 1) bypasses the block induced by MPA (or mizoribine), thereby reversing all of the secondary defects (cf. 15, 23, 26, 27, 34, 36, 37). Provision of adenine bypasses the secondary block at the adenylosuccinate synthetase reaction induced by a decline in GTP, a cofactor for this enzyme (5) (Fig. 1) and repletes ATP (but not GTP) levels (cf. Ref. 42). UTP is also restored, possibly due to phosphoribosylpyrophosphate consumption by adenine phos- phoribosyltransferase. Thus, MPA reduces GTP and to a lesser degree ATP and elevates UTP. Co-culture with guanine reverses all three defects, whereas co-culture with adenine creates a selective deficiency of GTP. We emphasize that while this formulation is compatible with and probably ex- plains the data observed, its accuracy in pancreatic islets remains to be established by formal enzymatic analysis.
The conclusion most compatible with the insulin secretory and nucleotide data is that GTP content or concentration plays a critical, heretofore overlooked role in signal transduc- tion and/or exocytosis in islet^.^ Similar conclusions have recently been reached using mast cells (46, 47), basophilic leukemia cells (42), or paramecium (48). In mast cells, “wash- out” of small cytosolic molecules blocks exocytosis, a phenom- enon reversed by providing 300 p~ GTP. The latter appar- ently is permissive for secretion, acting a t a step distal to
A role for other stimulatory nucleotides such as xanthosine tri- phosphate (44) cannot be totally excluded. Theoretically, xanthosine triphosphate could be formed from xanthosine monophosphate, the synthesis of which is blocked by inosine monophosphate dehydrogen- ase inhibitors (Fig. 1). It seems unlikely, however, that an accumu- lation of IMP caused the reduction in secretion either directly or via conversion to inosine (and its byproduct hypoxanthine) since inosine stimulates insulin release (45). Furthermore, ITP also supports exo- cytosis, although inosine diphosphate is slightly inhibitory (46). In addition, provision of hypoxanthine (which could be converted via HGPRT to IMP) did not potentiate the inhibition of insulin release from MPA-pretreated cells (Table IV).
GTP and Exocytotic Insulin Release 12525
calcium transients (47). Using basophilic leukemia cells, Wil- son et al. (42) reported that MPA reduced GTP levels by more than 60% and reduced serotonin release by 50%. These effects were accompanied by little or no reduction in phospholipase C activation, but Ca2+ influx was reduced. In paramecium, microinjection of GTP (but not its nonhydrolyzable analogs) was needed to support exocytosis (48). In the current studies, four different inhibitors of GTP synthesis reduced insulin secretion, an effect which was reversed by guanine (which also prevented decrements in GTP levels). Since increased ambient glucose levels can augment islet GTP concentrations and the GTP/GDP ratio (20-22), it is possible that both increments and decrements in GTP content could regulate islet function. Although effects of increments in GTP were not specifically addressed in the current studies, this specu- lation is compatible with the observation that, in control studies, guanine supplementation of the culture medium caused small increments in both GTP content and insulin release.
However, other explanations for the data should be consid- ered. ATP content fell modestly with MPA or mizoribine provision and this effect also was largely prevented by gua- nine. ATP is felt to be important for glucose-induced insulin release (49). However, the modest decrement in ATP (up to 43% with MPA and 39% with mizoribine) may not be suffi- cient to explain the marked degree of secretory inhibition (49). Furthermore, provision of adenine with MPA restored ATP levels nearly to basal values yet did not prevent the inhibition of insulin release induced by MPA. The latter finding cannot be explained by a small, residual reduction in ATP (-14%) since an equivalent or greater reduction (-14 to -25%) in ATP content was seen with either MPA plus guanine or with mizoribine plus guanine (Figs. 8 and 9, respectively), conditions wherein insulin secretion was nor- malized essentially completely. Nonetheless, the finding that a decrement in GTP seems to produce a decline in islet ATP content supports the conclusion from other studies that GTP is required for ATP synthesis both at the adenylosuccinate synthetase step and in the transphosphorylation of AMP and ADP to ATP (5-7) (Fig. 1). This could be an additional step at which GTP regulates secretion in the islet in situ.
MPA also elevated UTP content of islets and, in fact, this effect overall seemed to correlate better with the inhibition of insulin release than did GTP content (cf. Table 7 and Fig. 3). It is tempting to speculate that a rise in UTP could favor glycogen deposition in islets via the formation of UDG-glucose and a consequent deposition of glycogen. Glycogen deposition has been suggested to be involved in the toxic effects of exposure to high ambient glucose levels in islet function (50). However, adenine provision restored UTP levels nearly to normal without normalizing secretion. As indicated above, the rise in UTP may merely reflect a redirection of precursors consequent to a primary impairment of purine nucleotide synthesis. This effect apparently was progressive at increasing concentrations of MPA despite an apparent plateau in its effects on GTP and ATP content (see below).
It is unlikely that nonspecific toxic effects on the ,’3 cell explain the effects of MPA (or mizoribine) since short term exposures (up to 1.5 h) were not inhibitory, whereas the longer term effects were specifically reversed by guanine. MPA has been said to inhibit certain lipoxygenases (51), and our pre- vious studies indicated that lipoxygenase inhibitors reduce insulin release (52). However, rather high concentrations of MPA are required to inhibit lipoxygenase (51). Furthermore the effect of lipoxygenase inhibitors on secretion occurs far more rapidly than that of MPA and extends to K+ as agonist
(52) unlike MPA. Since GTP (and/or its deoxy analogs) may have a role in DNA, RNA, and protein synthesis (10, 15-17, 36, 37) secretion might have declined due to a reduction in insulin stores. However, even at the highest concentrations of MPA, insulin content fell by only 18% and even this effect was not consistently seen with the other inhibitors of GTP synthesis. Additionally, secretion was clearly reduced even when expressed in terms of content (fractional secretion), implicating a true inhibition of exocytosis. We should empha- size, however, that the current studies do not exclude the possibilities that GTP depletion might also modify (pro)insulin synthesis, targeting to intracellular vesicles, or subsequent processing (see below). Furthermore, it remains possible that GTP depletion could inhibit the synthesis of a small, functionally critical “pool” of insulin while having only minor effects on total insulin content. Glucose is known to stimulate the secretion of a newly synthesized compartment of insulin which is “marked” for preferential release (53-55). While we have not formally excluded this possibility, it is not likely to explain a large part of MPA’s inhibitory effect on insulin secretion for several reasons. K+ (50 mM)-stimulated and basal insulin release are both dependent on a similar, newly synthesized pool of insulin to a degree a t least as great as (53), if not greater than (55), the one on which high (16.7 mM) concentrations of glucose are dependent. Yet the former types of secretion were largely refractory to inhibition by MPA, in contrast to release induced by high glucose levels. This is the opposite of what would be expected if MPA selectively inhibited synthesis of a small but readily released (and therefore critical) “pool” of insulin. Nonetheless, the newly synthesized, readily releasable pool of insulin has been estimated to comprise only -33% of total insulin stores (53). It remains possible that partial blockade of this pool contrib- utes to the small but detectible inhibition of insulin content induced by the inhibitors (mizoribine had no effect).
The blockade by MPA of the secretory effects of an amino acid or of a phorbol ester also precludes the possibilities that glucose transport, glucose metabolism, or plasma membrane receptors are the sole or principal target(s) of GTP depletion. The virtual absence of inhibition by MPA of depolarization (K+)-induced release excludes a direct inhibition of Ca2+ entry via voltage-sensitive Ca2+ channels, or blockade of the direct effects of Ca2+ on exocytosis, as likely effects of GTP depletion (at least to the degree achieved in the current studies). This finding is in accord with the failure of exogenous GTP (up 1 mM) to augment Ca2’-induced secretion from normal islet cells (56), HIT cells (57), or RIN m5F cells (58) which have been permeabilized and therefore are presumably GTP-de- pleted. Furthermore, the findings using K+ as agonist further abrogate the possibility of an effect of MPA solely on insulin content. However, a role for GTP in the potentiation of submaximal intracellular Ca2+ levels or in “Ca’+-independent” exocytosis (56) is not excluded and, indeed, exogenous GTP doubles insulin release in permeabilized islet cells at basal Ca2+ levels (53). The blockade of TPA-induced insulin release raises the speculation that protein kinase C activation or effects might have been inhibited by GTP depletion. Inter- estingly, GTP-utilizing protein kinases have recently been described (11, 12). These findings using TPA suggest at least one site of action of GTP distal to phospholipase C activation, possibly a G-protein/GTPase which is phosphorylated by protein kinase C. However, further studies will be needed to address these possibilities.
If depletion of GTP stores is proposed as the mechanism whereby MPA and the other three inosine monophosphate dehydrogenase blockers reduce secretion, it is important to
12526 GTP and Exocytotic Insulin Release
deal with the dose-response characteristics of these two pa- rameters. MPA reduced GTP levels and insulin release over a similar concentration range (0.5 through 50 pg/ml). How- ever, the decline in GTP had nearly reached an apparent plateau by 1-2 pg/ml, whereas insulin release fell further at higher levels of MPA (Fig. 3). There are several possible reasons for this apparent discrepancy. The extraction and HPLC techniques employed measure total (free plus bound) GTP levels in the whole cells. As has been discussed by others (6, 16, 59-61), there is reason to believe that nucleotides are compartmentalized. Furthermore, free, rather than total, nu- cleotide levels may be the relevant parameter. Thus, a very small but functionally important decline of free GTP levels in a critical pool could easily go undetected in the presence of a background level of -1 mM GTP: much of which may be bound. Indeed, when GTP levels were examined at various levels of MPA only within individual studies, there was evi- dence of a further decline in GTP levels between 2 and 25 or 50 pg/ml MPA (data not shown). Note that the data in Table VI1 are pooled from five separate experiments. Additionally, it should be noted that GTP levels were measured in intact islets, of which only 70-80% are insulin-secreting cells. This fact may obscure the presence of closer relationships between GTP content in B cells and insulin release.
Such issues may be relevant to whether a reduction in GTP levels could become rate-limiting for the function of GTP- binding proteins. This possibility has often been dismissed since free GTP levels in the nanomolar to lower micromolar range have usually been found to be sufficient for the function of high affinity, low K,,, G-proteins, including those in islets (1, 42, 62-67). However, such levels may be achieved only in the presence of much higher levels of total GTP. The exoge- nous provision of at least 10-100 p~ of GTP was required for maximal G-protein action (1, 2, 41, 52, 68) in several cell systems, including islets (1, 2, 57). The evidence has been summarized which suggests that free concentrations of GTP could become rate limiting for the function of GTP-binding proteins (60).6 For example, in cultured rat kidney cells, MPA or virazole (another inosine monophosphate dehydrogenase inhibitor) reduced by 50-70% the effect of isoproterenol or prostaglandin El to elevate cyclic AMP levels under condi- tions where the GTP content of cell was inhibited 80% (similar to the current studies) (40); guanosine reversed these effects. In C6 glioma cells, MPA blunted the cyclic AMP response to isoproterenol in cells, homogenates, or membrane fractions; GTP reversed the inhibition (61). In Ehrlich ascites tumor cells, similar results were seen using epinephrine as agonist (41). Thus, it remains theoretically possible that GTP depletion impairs signal transduction in islets via a mecha- nism involving a classical GTP-binding protein.
To begin to examine this issue functionally, we pretreated islets with MPA to reduce (but not obliterate) glucose- and K+-induced secretion. We then determined whether the resid- ual secretion remained inhibitable by epinephrine. Since epi- nephrine inhibits secretion largely via pertussis toxin-sensi- tive G proteins (1-3, 28, 62) and in the hands of some
This figure uses the average islet GTP content in our studies of 3 pmol (a figure very similar to the GTP content of freshly isolated islets in the studies of others, Refs. 21,22) and an average islet volume of -3 nl. An 80% reduction of GTP content by MPA would therefore reduce average GTP concentrations (bound plus free) only to -200 PM. However, free GTP concentrations in untreated cells are probably much lower and have been estimated in other cells to be only 25-150 PM (60). A significant decrement in free GTP might make this parameter rate-limiting.
investigators (2,62) requires the presence of GTP: we tested the possibility that MPA-treated islets might be resistant to epinephrine’s inhibitory effect. However, epinephrine oblit- erated all residual secretion. This inhibition was reversed (by 70-73%) by pertussis toxin. Since free GTP levels of 51-10 pM are nearly maximal for epinephrine’s effect to activate a high affinity GTPase and to inhibit adenylate cyclase in islets (1,62) the simplest conclusion would be that MPA is not able to reduce free GTP levels sufficiently to block the function of Gi (or, by extrapolation, that of other heterotrimeric G pro- teins). However, it should be noted that, in other studies, GTP levels of 100 p~ or higher were needed for epinephrine (or somatostatin) to inhibit secretion from permeabilized HIT cells in a pertussis toxin-sensitive fashion (2, 57). Thus, it remains possible that GTP levels during MPA exposure could become regulatory for a putative low affinity, high K,,, GTPase7 which, we speculate, might be directly involved in exocytosis (i.e. “G,,” Refs. 70, 71). Even some low affinity GTPases may be subject to regulation (72). This speculation is in accord with the finding of Howell et al. (46) who observed that the effect of GTP on exocytosis in permeabilized mast cells reached saturation only at 500 p~ GTP. However, this possibility is not directly addressed by the current studies and can only be investigated when the GTP-binding proteins involved in physiologic insulin release are all identified and characterized. Furthermore, GTP serves a number of roles, only some which involve its interaction with GTP-binding proteins or GTPases involved in signal transduction (see Introduction). For example, levels of GTP above 1 mM may be needed for maximal synthesis of inositol-containing phos- pholipids (73). It has recently been suggested that a reduction in cellular content of phosphatidylinositol may impede exo- cytosis (74). Clearly, additional studies will be required to address this possibility and to ascertain the exact step(s) in islets whereby GTP depletion reduces exocytosis.
Finally, a word of caution is indicated with regard to the clinical uses of inosine monophosphate dehydrogenase inhib- itors. MPA, ribavirin, and other inosine monophosphate de- hydrogenase inhibitors are currently undergoing clinical test- ing for use in the treatment of human immunodeficiency virus (H1V)-associated diseases (43), cancer, inflammatory dis- eases, and for use as immunosuppressive agonists in the treatment of several human disease states, including renal or pancreatic transplantation (75) and, conceivably, for the im- munotherapy of newly diagnosed type I diabetes mellitus. Levels of MPA achieved during therapy with its prodrug RS- 61443 in humans (75) are similar to those used in the current study. Therefore, it may now be possible to assess the effects of nucleotide metabolism on islet function in vivo in humans. More cogently, the inhibition of insulin release in vitro in- duced by this class of pharmacologic agents suggests that islet function and glucose tolerance should be closely monitored during their use in vivo.
Acknowledgments-The technical assistance of Thom Rabaglia is gratefully acknowledged. The suggestions of Dr. Denis English (In- diana School of Medicine, Indianapolis, IN) and Dr. Debra Hullett (University of Wisconsin, Madison, WI) are gratefully acknowledged. We also appreciate the generosity of Drs. R. Greene, D. English, and N. Kazmatani for providing the tiazofurin, ribavirin, and mizoribine.
Note that we (28) and others (3) have observed that a fraction of epinephrine’s effect seems to be PTX-insensitive and that a variable percentage of epinephrine’s inhibitory effects in islets may persist in the apparent absence of GTP (1 ,2,50,69) .
Recently, we have observed the presence of such a high K, (-725 PM) specific GTPase in islet secretory granules and homogenates in addition to more traditional GTPases (A. Kowluru and S. Metz, unpublished observations).
GTP and Exocytol REFERENCES
2. Ullrich, S., and Wollheim, C. B. (1988) J. Biol. Chem. 263,8615-8620 1. Katada, T., and Ui, M. (1981) J. Biol. Chem. 256,8310-8317
3. Robertson, R. P., Seaquist, E. R., and Walseth, T. F. (1991) Diabetes 40, 1 -fi
4. Car&, M.-F., Didry, D., andValentin-Ranc, C. (1991) J. Biol. Chem. 266, 12361-12368
5. Rodwell, V. W. (1988) in Harper's Biochemistry (Murray, R. K., Granner, D. K., Mayes, P. A,, and Rodwell, V. W., eds) 21st ed., pp. 344-361, Appleton & Lange, Norwalk
6. Kleineke, J., Duls, C., and Soling, H.-D. (1979) FEBS Lett. 107, 198-202
8. Wolf, B. A., Florholmen, J., Colca, J. R., and McDaniel, M. L. (1987) 7. Heldt, H. W., and Schwalbach, K. (1967) Eur. J . Biochem. 1, 199-206
9. Connolly, T., and Gilmore, R. (1989) Cell 57, 599-610 Biochem. J. 242, 137-141
10. Welsh, N., Oberg, C., and Welsh, M. (1991) Biochem. J. 275,23-28 11. Stoehr, S. J., and Smolen, J. E. (1990) Blood 75,479-487 12. Thams, P., Capito, K., and Hedeskov, C. J. (1986) Diabetologia 29, 888-
13. Rosenberg, E. M., Goodman, A. D., and Lipinski, T. I. (1987) Diabetes 36,
14. Dunne, M. J., and Petersen, 0. H. (1986) Pflligers Arch. 407,564-565 15. Cohen, M. B., Maybaum, J., and Sadee, W. (1981) J. Biol. Chem. 256,
16. Nguyen, B. T., and Sad&, W. (1986) Biochem. J. 234, 263-269 17. Franklin, T. J., and Cook, J. M. (1969) Biochem. J. 113, 515-524 18. Fahien, L. A,, MacDonald, M. J., Kmiotek, E. H., Mertz, R. J., Fahien, C.
19. Jackson, R. C., Morris, H. P., and Weber, G. (1977) Biochem. J. 166, 1-
20. Zunkler, B. J., Lenzen, S., and Panten, U. (1986) IRCS Med. Sci. 14, 354-
21. Hoenig, M., and Matschinsky, F. M. (1987) Metabolism 36,295-301 22. Meelasson. M. D.. Nelson. J.. Nelson. D.. and Erecinska. M. (1989) Metab-
892
37-42
8713-8717
M. (1988) J. Biol. Chem. 263,13610-13614
10
355
, I , , o h m 36,118811195
, . , 23. Koyama, H., and Tsuji, M. (1983) Biochem. Pharmocol. 32,3547-3553 24. Sakaeuchi. K.. Tsuiino. M.. Yoshizawa. M.. Mizuno. K.. and Havano. K.
25.
26.
27.
28. 29. 30. 31. 32. 33.
34.
35.
37. 36.
38.
39.
(1575) Cancer R&. 35,1643-1648
(1991) J. Clin. Inuest. 87,940-948
J. G. N., and English, D. (1990) Cellular Signalling 2,509-519
Cancer Res 45,5512-5520
, , , , ~I
Turka, L. A,, Dayton, J., Sinclair, G., Thompsom, C. B., Mitchell, B. S.
Rizzo, M. T., Tricot, G., Hoffman, R., Jayaram, H. N., Weber, G., Garcia,
Lee, H:J., Pawlak, K., Nguyen, B. T., Robins, R. K., and Sadbe, W. (1985)
Metz, S. A. (1988) Diabetes 37,65-73 Metz, S. A. (1988) Diabetes 37,1453-1469 Metz, S. A, and Dunlop, M. (1990) Arch. Biochem. Biophys. 283,417-428
Metz, S. A., and Dunlop, M. (1990) Biochem. J. 270,427-435 Metz, S. A. (1985) Proc. Natl. Acad. Sci. U. S. A. 82, 198-202,1985
Mehler, P. S., Sussman, A. L., Maman, A,, Leitner, J. W., and Sussman,
Sweeney, M. J., Hoffman. D. H.. and Esterman. M. A. (1972) Cancer Res. K. E. (1980) J. Clin. Inuest. 66, 1334-1338
32, i803-1809 Snyder, F. F., Henderson, J. F., and Cook, D. A. (1972) Biochem. Pharmacol.
Cohen, M. B., and Sadee, W. (1983) Cancer Res. 43,1587-1591 Nguyen, B. T., El Sayed, Y. M., and Sadee, W. (1984) Cancer Res. 44,
21,2351-2357
9979-9977 Eugui, E. M., Mirkovich, A,, and Allison, A. C. (1991) Transplant. Proc.
Morris, R. E., Wang, J., Blum, J. R., Flavin, T., Murphy, M. P., Almquist,
11.1 ".. 23(Suppl. 2), 15-18
Fie Insulin Release 12527 9. J., Chu, N., Tam, Y. L., Kaloostian, M., Allison, A. C., and Eugui, E. M. (1991) Transplant. Proc. 23,19-25
40. Johnson, G. S., and Mukku, V. R. (1979) J. Biol. Chem. 254,95-100 41. Smith, C . M., Henderson, J. F., and Baer, H. P. (1977) J. Cyclic Nucleotide
42. Wilson, B. S., Deanin, G. G., Standefer, J. C., Vanderjagt, D., and Oliver, Res. 3,347-354
43. Hartman, N. R., Ahluwalia, G. S., Cooney, D. A., Mitsuya, H., Kageyama, J. M. (1989) J. Immunol. 143,259-265
S., Fridland, A,, Broder, S., and Johns, D. G. (1991) Mol. Pharmacol. 40, l lR124
44. Morgan, A., and Burgoyne, R. D. (1990) Biochem. J. 269,521-526 45. Capito, K., and Hedeskov, C. J. (1976) Biochem. J. 158,335-340 46. Howell, T. W., Cockcroft, S., and Gomperts, B. D. (1987) J. Cell. Biol. 105,
47. Penner, R., Pusch, M., and Neher, E. (1987) Biosci. Re 7,313-321 48. Lumpert, C. J., Kersken, H., and Plattner, H. (1990fBiochem. J. 269,
49. Ashcroft, S. J. H., Weerasinghe, L. C. C., and Randle, P. J. (1973) Biochem.
50. Marynissen, G., Leclercq-Meyer, V., Sener, A,, and Malaisse, W. J. (1990)
51. Sircar, J. C., and Schwender, C. F. (1983) Prostaglandins Leukotrienes Med.
52. Metz, S. A. (1989) Biochem. Pharmacol. 38, 1849-1862 53. Gold, G., Landahl, H. D., Gishizky, M. L., and Grodsky, G. M. (1982) J .
54. Gold, G., Gishizky, M. L., and Grodsky, G. M. (1982) Science 218,56-58 55. Halban, P. A. (1982) Endocrinology 110,1183-1188 56. Wollheim, C. B., Ullrich, S., Meda, P., and Vallar, L. (1987) Biosci. Rep. 7,
57. Ullrich, S., Prentki, M., and Wollheim, C. B. (1990) Biochem. J. 270,273-
58. Ullrich, S., and Wollheim, C. B. (1989) FEBS Lett. 247, 401-404 59. Geisbuhler, T., Altschuld, R. A,, Trewyn, R. W., Ansel, A. Z., Lamka, K.,
and Brierley, G. P. (1984) Circ. Res. 54,536-546 60. Otero De, S. A. (1990) Biochem. Pharmacol. 39,1399-1404 61. Franklin, T. J., and Twose, P. A. (1977) Eur. J . Biochem. 77, 113-117 62. Schmidt, A,, Heschler, J., Offermanns, S., S icher, K., Hinsch, K.-D.,
Klinz, F.-J., Codina, J., Birnbaumer, L., Eausepohl, H., Frank, R.,
63. Abramson, S. B., Leszczynska-Piziak, J., and Weissmann, G. (1991) J. Schultz, G., and Rosenthal, W. (1991) J. B i d . Chem. 266,18025-18033
64. Grandt, R., Aktories, K., and Jakolz, K. H. (1986) Biochem. J. 237, 669- Immunol. 147,231-236
65. Lapetina, E. G., and Reep, B. R. (1987) Proc. Natl. Acad. Sci. U. S. A. 84 , 674
66. Bourne, H. R., Sanders, D. A,, and McCormick, F. (1991) Nature 349, 2261-2265
117-126
68. Anderson, W. B., Gallo, M., and Pastan, I. (1974) J. Biol. Chem. 249, 67. Kimura, N., and Nagata, N. (1979) J. Biol. Chem. 254,3451-3457
69. Jones, P. M., Salmon, D. M. W., and Howell, S. L. (1988) Biochem. J. 254,
70. Regazzi, R., Li, G., Ullrich, S., Jaggi, C., and Wollheim, C. B. (1989) J.
71. Gomperts, B. D. (1990) Annu. Reu. Physiol. 52,591-606 72. Kimura, N., and Shimada, N. (1980) FEBS Lett. 117,172-174 73. Sribney, M., Dove, J. L., and Lyman, E. M. (1977) Biochem. Biophys. Res.
74. Eberhard, D. A., Cooper, C. L., Low, M. G., and Holz, R. W. (1990) Biochem.
75. Sollinger, H. W., Deierhoi, M., Belzer, F. O., Diethelm, A. G., and Kauff-
~~. ~~~
191-197
639-645
J. 132,223-231
Metabolism 39,87-95
11,373-380
Clin. Inuest. 69,554-563
443-454
276
7041-7048
397-403
Biol. Chem. 264,9939-9944
Commun. 79,749-755
J. 268, 15-25
man, R. S. (1992) Transplantation 53,428-432