volaris investor day -...
TRANSCRIPT
Volaris Investor Day
New York Stock ExchangeSeptember 13, 2017
The information ("Confidential Information") contained in this presentation is confidential and is provided by ControladoraVuela Compañía de Aviación, S.A.B. de C.V., (d/b/a Volaris, the "Company") confidentially to you solely for your reference andmay not be retransmitted or distributed to any other persons for any purpose whatsoever. The Confidential Information issubject to change without notice, its accuracy is not guaranteed, it has not been independently verified and it may not containall material information concerning the Company. Neither the Company, nor any of their respective directors makes anyrepresentation or warranty (express or implied) regarding, or assumes any responsibility or liability for, the accuracy orcompleteness of, or any errors or omissions in, any information or opinions contained herein. None of the Company nor any oftheir respective directors, officers, employees, stockholders or affiliates nor any other person accepts any liability (innegligence, or otherwise) whatsoever for any loss howsoever arising from any use of this presentation or its contents orotherwise arising in connection therewith. No reliance may be placed for any purposes whatsoever on the information setforth in this presentation or on its completeness.
This presentation does not constitute or form part of any offer or invitation for sale or subscription of or solicitation orinvitation of any offer to buy or subscribe for any securities, nor shall it or any part of it form the basis of or be relied on inconnection with any contract or commitment whatsoever. Recipients of this presentation are not to construe the contents ofthis presentation as legal, tax or investment advice and should consult their own advisers in this regard.
This presentation contains statements that constitute forward-looking statements which involve risks and uncertainties. Thesestatements include descriptions regarding the intent, belief or current expectations of the Company or its officers with respectto the consolidated results of operations and financial condition, and future events and plans of the Company. Thesestatements can be recognized by the use of words such as "expects," "plans," "will," "estimates," "projects," or words of similarmeaning. Such forward-looking statements are not guarantees of future performance and actual results may differsignificantly from those in the forward-looking statements as a result of various factors and assumptions. You are cautionednot to place undue reliance on these forward looking statements, which are based on the current view of the management ofthe Company on future events. The Company does not undertake to revise forward-looking statements to reflect future eventsor circumstances.
Disclaimer
2
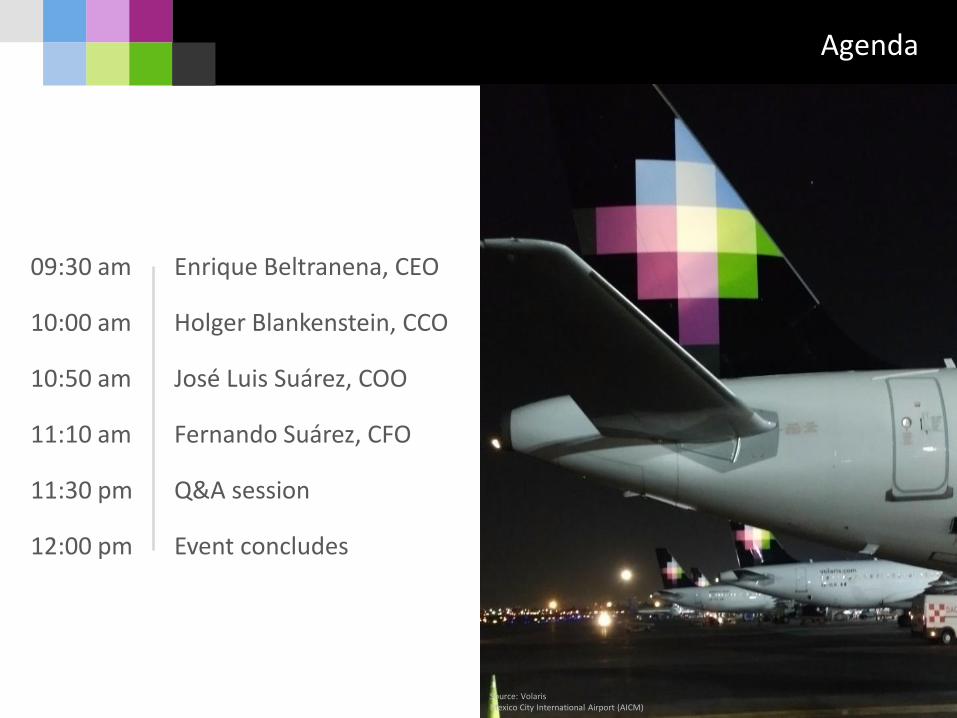
09:30 am Enrique Beltranena, CEO
10:00 am Holger Blankenstein, CCO
10:50 am José Luis Suárez, COO
11:10 am Fernando Suárez, CFO
11:30 pm Q&A session
12:00 pm Event concludes
Agenda
Source: VolarisMexico City International Airport (AICM)
Enrique BeltranenaChief Executive Officer
Enrique Beltranena, CEO
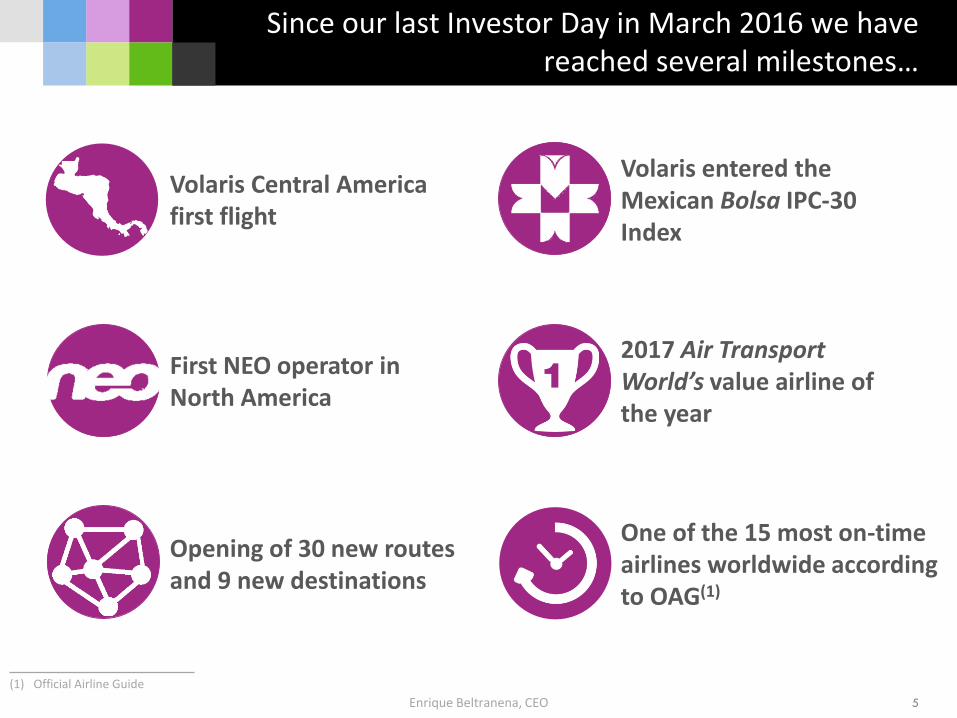
Since our last Investor Day in March 2016 we have reached several milestones…
5
Volaris Central America first flight
Volaris entered the Mexican Bolsa IPC-30 Index
First NEO operator in North America
2017 Air Transport World’s value airline of the year
Opening of 30 new routes and 9 new destinations
One of the 15 most on-time airlines worldwide according to OAG(1)
(1) Official Airline Guide
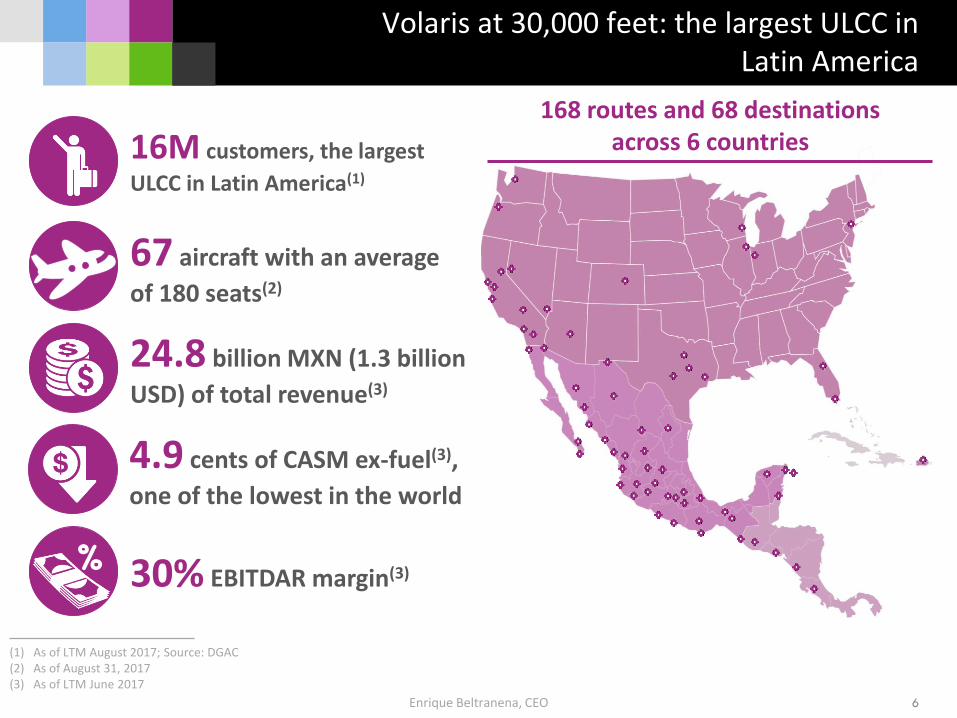
168 routes and 68 destinationsacross 6 countries
Enrique Beltranena, CEO
Volaris at 30,000 feet: the largest ULCC in Latin America
6
(1) As of LTM August 2017; Source: DGAC(2) As of August 31, 2017(3) As of LTM June 2017
67 aircraft with an average
of 180 seats(2)
16M customers, the largest
ULCC in Latin America(1)
24.8 billion MXN (1.3 billion
USD) of total revenue(3)
30% EBITDAR margin(3)%
4.9 cents of CASM ex-fuel(3),
one of the lowest in the world
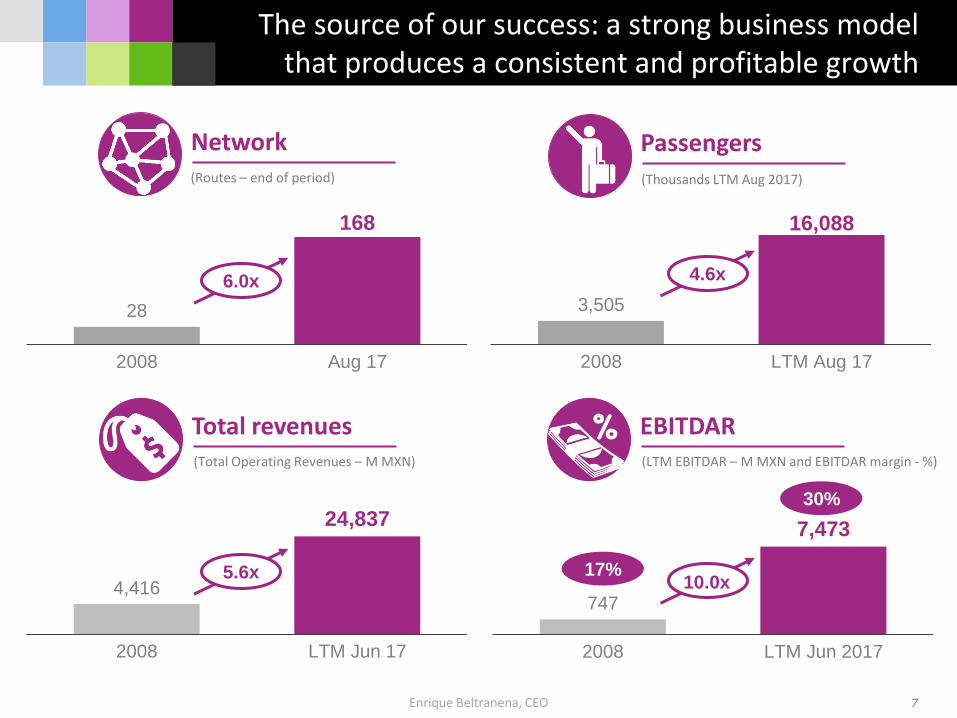
3,505
16,088
2008 LTM Aug 17
28
168
2008 Aug 17
Enrique Beltranena, CEO
The source of our success: a strong business model that produces a consistent and profitable growth
7
Total revenues(Total Operating Revenues – M MXN)
Network(Routes – end of period)
Passengers(Thousands LTM Aug 2017)
6.0x 4.6x
747
7,473
2008 LTM Jun 2017
EBITDAR(LTM EBITDAR – M MXN and EBITDAR margin - %)
%
17%
30%
4,416
24,837
2008 LTM Jun 17
5.6x10.0x
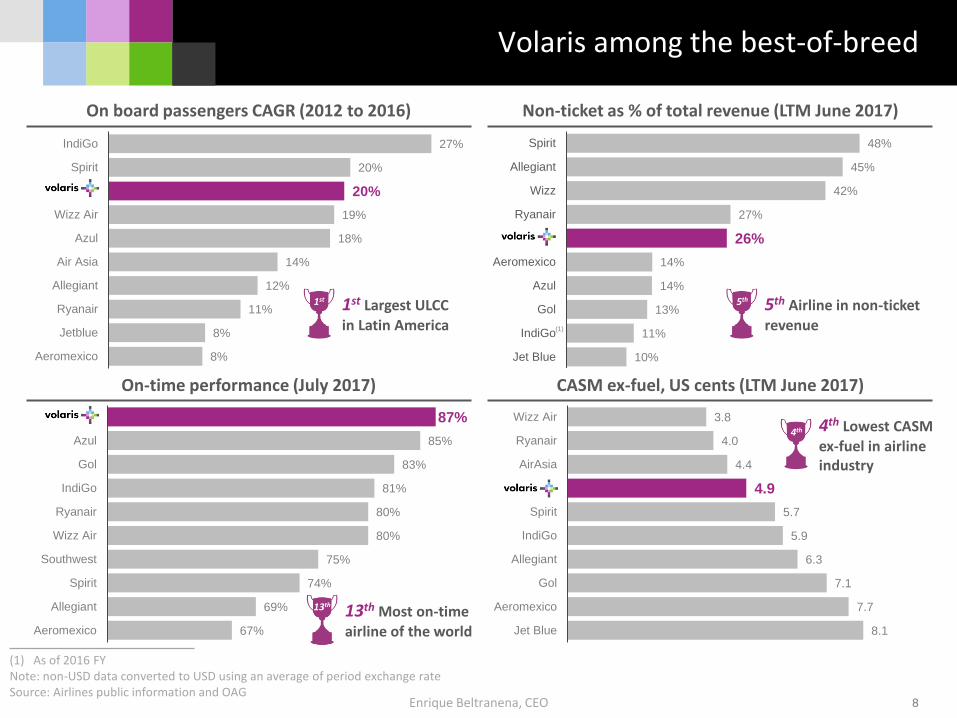
10%
11%
13%
14%
14%
26%
27%
42%
45%
48%
Jet Blue
IndiGo
Gol
Azul
Aeromexico
Volaris
Ryanair
Wizz
Allegiant
Spirit
8.1
7.7
7.1
6.3
5.9
5.7
4.9
4.4
4.0
3.8
Jet Blue
Aeromexico
Gol
Allegiant
IndiGo
Spirit
Volaris
AirAsia
Ryanair
Wizz Air
8%
8%
11%
12%
14%
18%
19%
20%
20%
27%
Aeromexico
Jetblue
Ryanair
Allegiant
Air Asia
Azul
Wizz Air
Volaris
Spirit
IndiGo
67%
69%
74%
75%
80%
80%
81%
83%
85%
87%
Aeromexico
Allegiant
Spirit
Southwest
Wizz Air
Ryanair
IndiGo
Gol
Azul
Volaris
On board passengers CAGR (2012 to 2016) Non-ticket as % of total revenue (LTM June 2017)
On-time performance (July 2017) CASM ex-fuel, US cents (LTM June 2017)
Enrique Beltranena, CEO 8
(1) As of 2016 FYNote: non-USD data converted to USD using an average of period exchange rateSource: Airlines public information and OAG
Volaris among the best-of-breed
4th 4th Lowest CASM ex-fuel in airline industry
13th
13th Most on-time airline of the world
1st 1st Largest ULCC in Latin America
5th 5th Airline in non-ticket revenue(1)
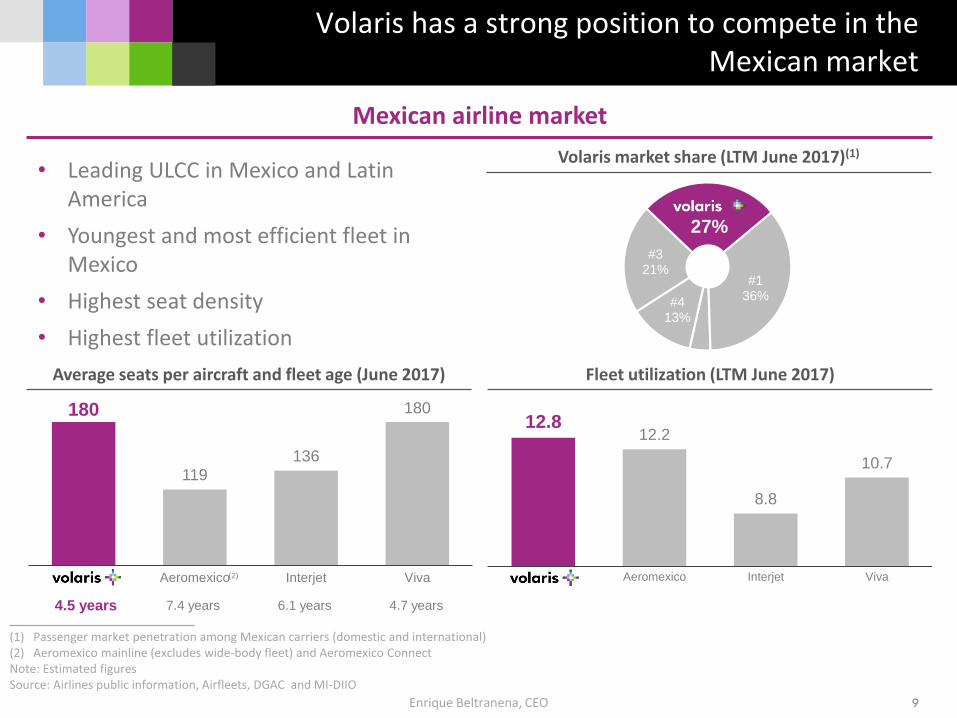
12.812.2
8.8
10.7
Volaris Aeromexico Interjet Viva
180
119
136
180
Volaris Aeromexico Interjet Viva
Enrique Beltranena, CEO 9
(1) Passenger market penetration among Mexican carriers (domestic and international)(2) Aeromexico mainline (excludes wide-body fleet) and Aeromexico ConnectNote: Estimated figuresSource: Airlines public information, Airfleets, DGAC and MI-DIIO
Volaris has a strong position to compete in the Mexican market
Mexican airline market
#413%
#321%
27%
#136%
Fleet utilization (LTM June 2017)
Volaris market share (LTM June 2017)(1)
Average seats per aircraft and fleet age (June 2017)
(2)
• Leading ULCC in Mexico and Latin America
• Youngest and most efficient fleet in Mexico
• Highest seat density
• Highest fleet utilization
4.5 years 7.4 years 6.1 years 4.7 years
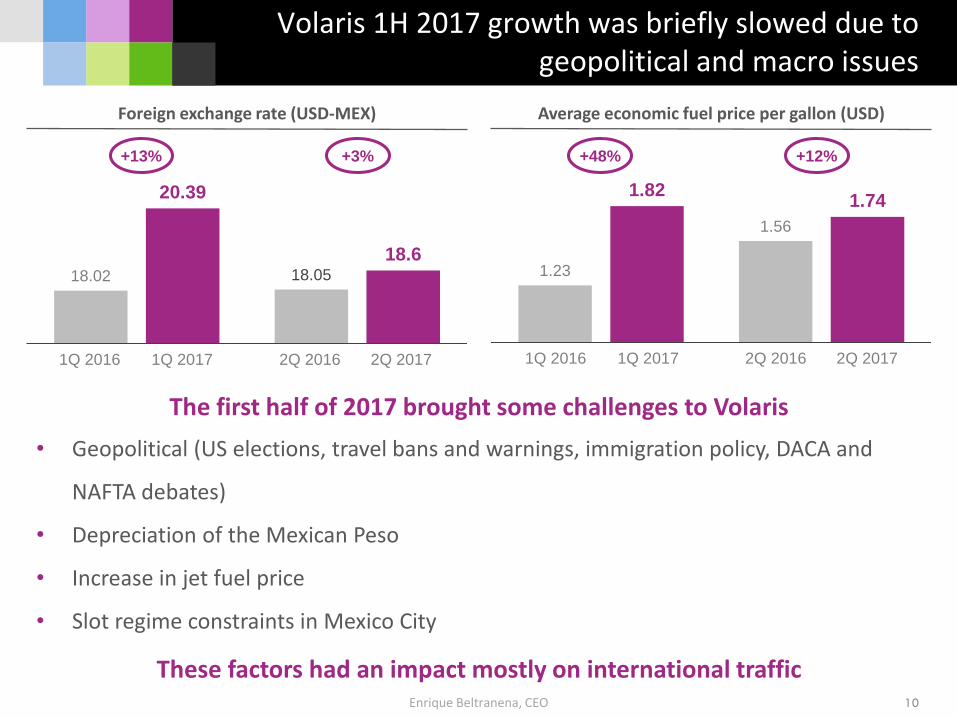
The first half of 2017 brought some challenges to Volaris
• Geopolitical (US elections, travel bans and warnings, immigration policy, DACA and
NAFTA debates)
• Depreciation of the Mexican Peso
• Increase in jet fuel price
• Slot regime constraints in Mexico City
These factors had an impact mostly on international traffic
18.02 18.05
20.39
18.6
1Q 2016 1Q 2017 2Q 2016 2Q 2017
Enrique Beltranena, CEO 10
Volaris 1H 2017 growth was briefly slowed due to geopolitical and macro issues
Foreign exchange rate (USD-MEX)
1.23
1.56
1.821.74
1Q 2016 1Q 2017 2Q 2016 2Q 2017
Average economic fuel price per gallon (USD)
+13% +3% +48% +12%
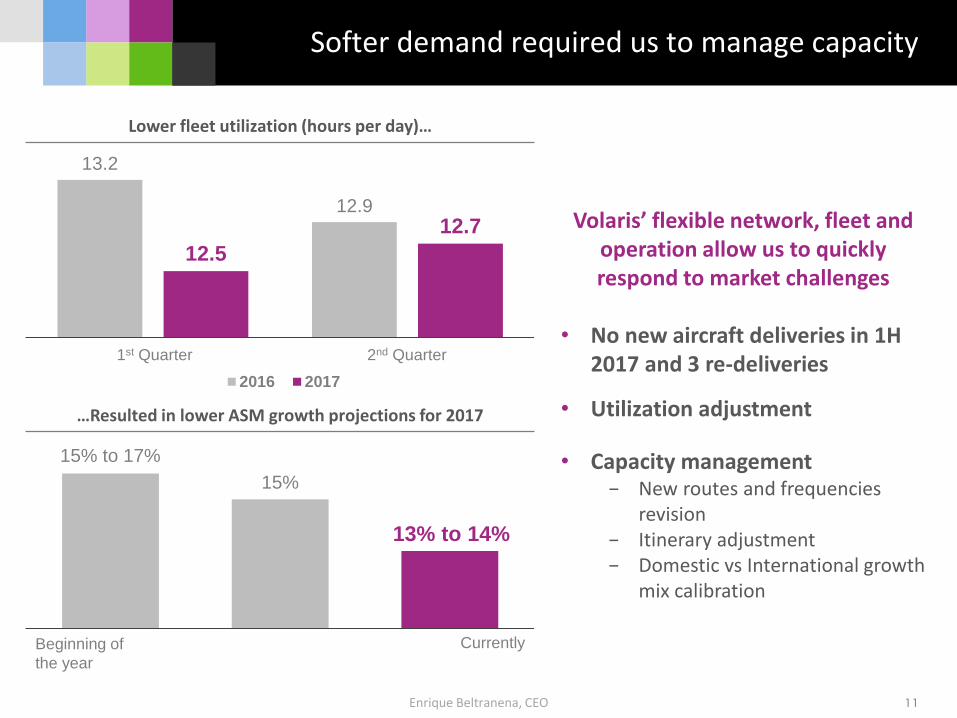
Lower fleet utilization (hours per day)…
…Resulted in lower ASM growth projections for 2017
Volaris’ flexible network, fleet and operation allow us to quickly respond to market challenges
• No new aircraft deliveries in 1H 2017 and 3 re-deliveries
• Utilization adjustment
• Capacity management− New routes and frequencies
revision− Itinerary adjustment− Domestic vs International growth
mix calibration
Enrique Beltranena, CEO 11
Softer demand required us to manage capacity
13.2
12.9
12.5
12.7
2016 2017
1st Quarter 2nd Quarter
Beginning of
the year
Currently
15% to 17%
15%
13% to 14%
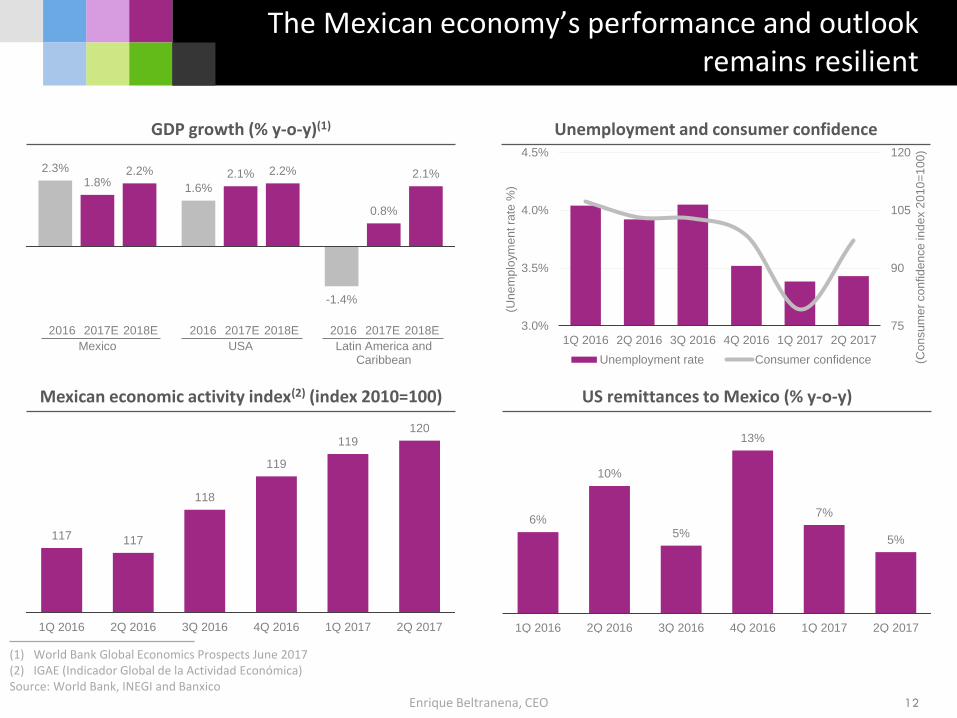
2.3%
1.6%
-1.4%
1.8%2.1%
0.8%
2.2% 2.2% 2.1%
Mexico USA Latin America andCaribbean
2017E2016 2018E 2017E2016 2018E 2017E2016 2018E
117 117
118
119
119120
1Q 2016 2Q 2016 3Q 2016 4Q 2016 1Q 2017 2Q 2017
75
90
105
120
3.0%
3.5%
4.0%
4.5%
1Q 2016 2Q 2016 3Q 2016 4Q 2016 1Q 2017 2Q 2017
(Une
mp
loym
en
t ra
te %
)
Unemployment rate Consumer confidence (Con
su
me
r co
nfid
en
ce
ind
ex 2
01
0=
10
0)
Enrique Beltranena, CEO 12
(1) World Bank Global Economics Prospects June 2017(2) IGAE (Indicador Global de la Actividad Económica)Source: World Bank, INEGI and Banxico
The Mexican economy’s performance and outlook remains resilient
Mexican economic activity index(2) (index 2010=100)
GDP growth (% y-o-y)(1) Unemployment and consumer confidence
6%
10%
5%
13%
7%
5%
1Q 2016 2Q 2016 3Q 2016 4Q 2016 1Q 2017 2Q 2017
US remittances to Mexico (% y-o-y)
26% 20%
35%
25%
17%
30%
14% 17%
7% 8%
2010 2025E
D/E D+ C C+ AB
Enrique Beltranena, CEO 13
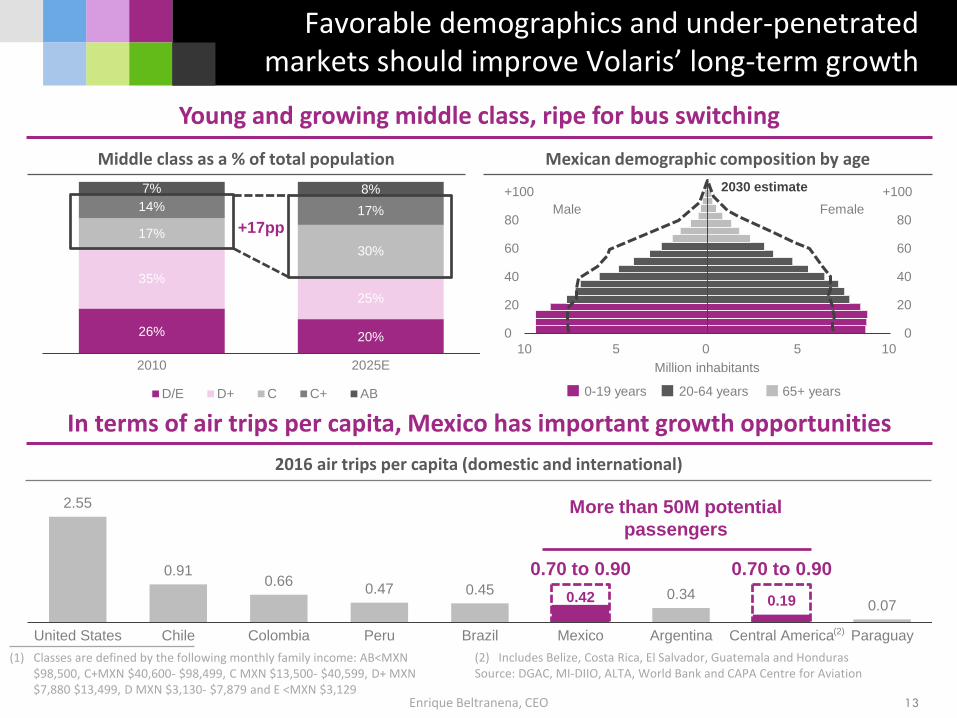
(1) Classes are defined by the following monthly family income: AB<MXN $98,500, C+MXN $40,600- $98,499, C MXN $13,500- $40,599, D+ MXN $7,880 $13,499, D MXN $3,130- $7,879 and E <MXN $3,129
Favorable demographics and under-penetrated markets should improve Volaris’ long-term growth
2016 air trips per capita (domestic and international)
In terms of air trips per capita, Mexico has important growth opportunities
Young and growing middle class, ripe for bus switching
Mexican demographic composition by age
10 5 0 5 10
Middle class as a % of total population
+100
Male Female
2030 estimate
Million inhabitants
0-19 years 20-64 years 65+ years
0
20
60
40
80
0
20
60
40
80
+100
More than 50M
potential passengers
+17pp
0.70 to 0.90 0.70 to 0.90
2.55
0.910.66
0.47 0.450.42 0.34 0.19 0.07
United States Chile Colombia Peru Brazil Mexico Argentina Central America Paraguay
(2) Includes Belize, Costa Rica, El Salvador, Guatemala and Honduras Source: DGAC, MI-DIIO, ALTA, World Bank and CAPA Centre for Aviation
(2)
More than 50M potential
passengers
Enrique Beltranena, CEO
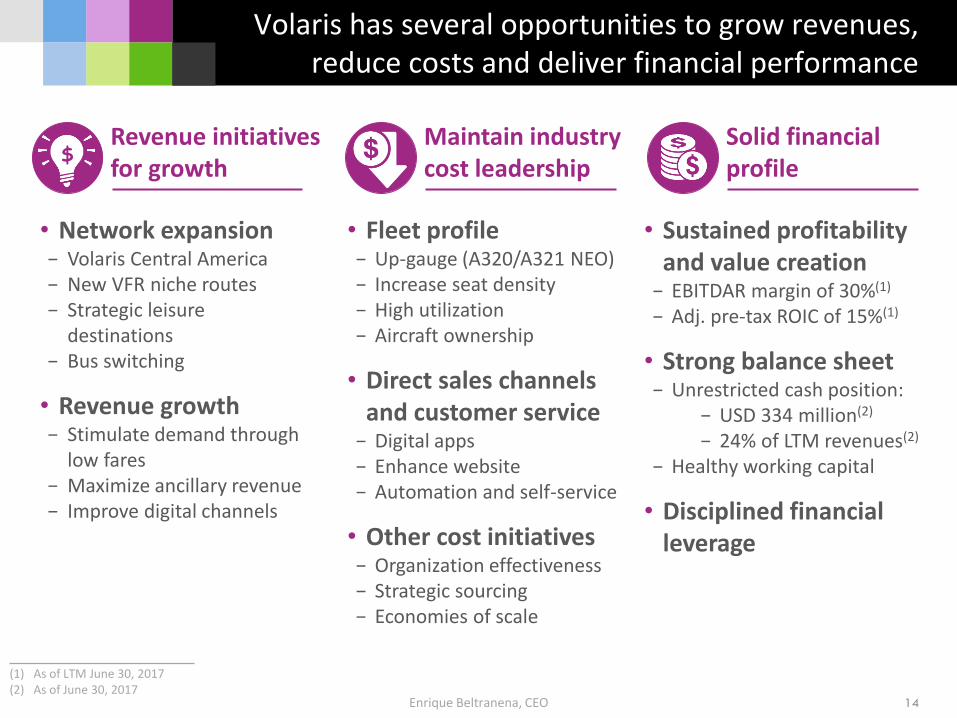
Volaris has several opportunities to grow revenues, reduce costs and deliver financial performance
14
(1) As of LTM June 30, 2017(2) As of June 30, 2017
Maintain industrycost leadership
Solid financialprofile
Revenue initiativesfor growth
$
• Fleet profile− Up-gauge (A320/A321 NEO)− Increase seat density− High utilization− Aircraft ownership
• Direct sales channels and customer service
− Digital apps− Enhance website− Automation and self-service
• Other cost initiatives− Organization effectiveness− Strategic sourcing− Economies of scale
• Network expansion− Volaris Central America− New VFR niche routes− Strategic leisure
destinations− Bus switching
• Revenue growth− Stimulate demand through
low fares− Maximize ancillary revenue− Improve digital channels
• Sustained profitability and value creation
− EBITDAR margin of 30%(1)
− Adj. pre-tax ROIC of 15%(1)
• Strong balance sheet− Unrestricted cash position:
− USD 334 million(2)
− 24% of LTM revenues(2)
− Healthy working capital
• Disciplined financial leverage

Holger BlankensteinChief Commercial Officer
Holger Blankenstein, CCO
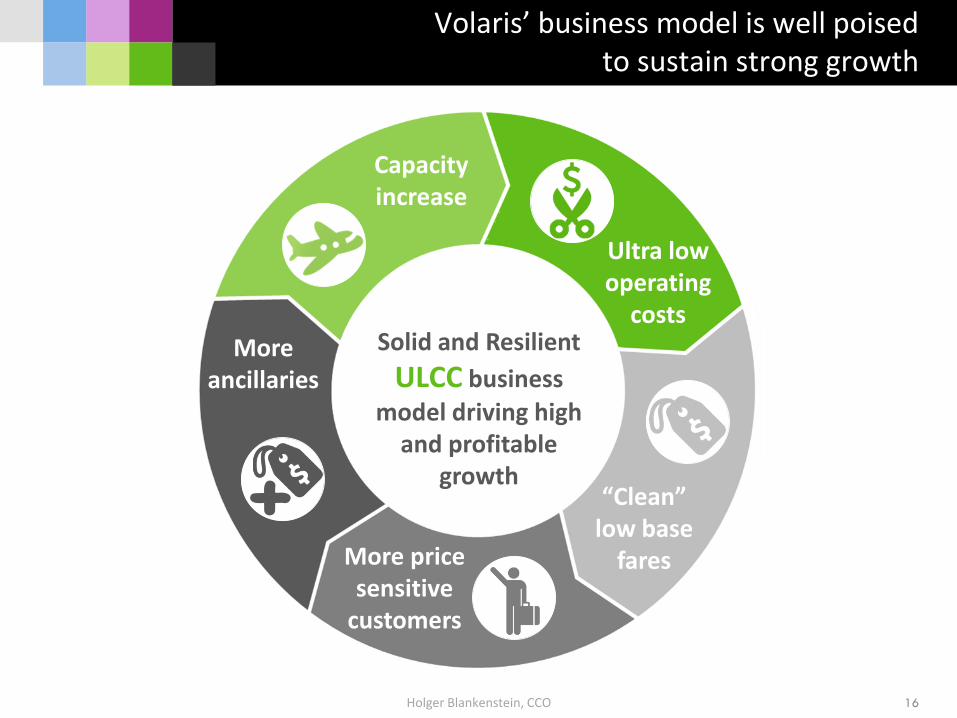
Volaris’ business model is well poised to sustain strong growth
16
Solid and Resilient
ULCC business
model driving high and profitable
growth
Ultra low operating
costs
“Clean” low base
faresMore price sensitive
customers
More ancillaries
Capacity increase
+
Holger Blankenstein, CCO 17
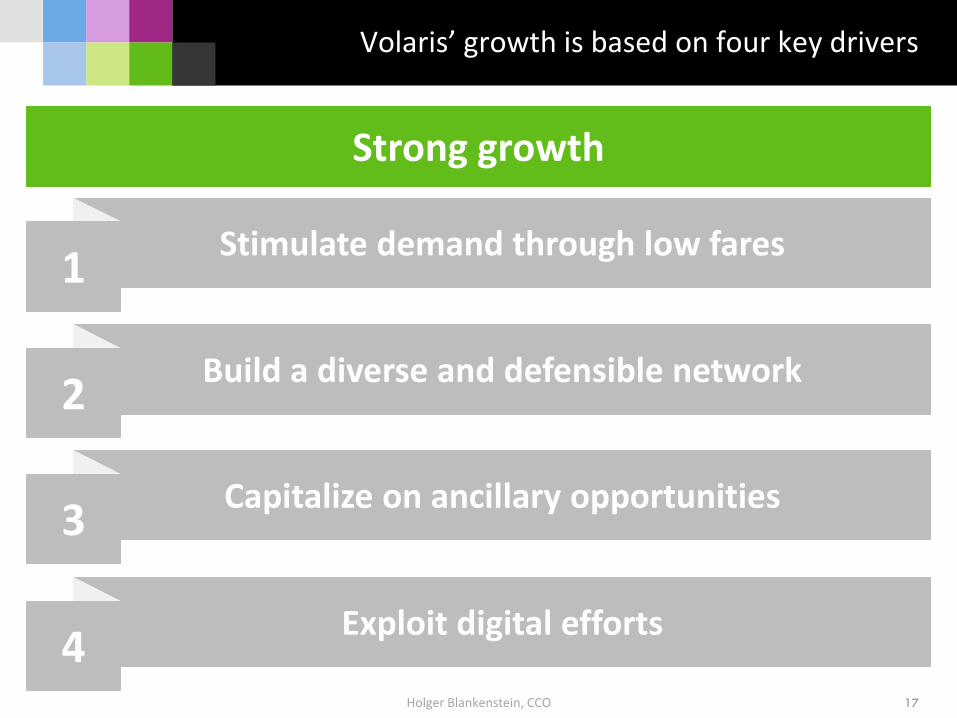
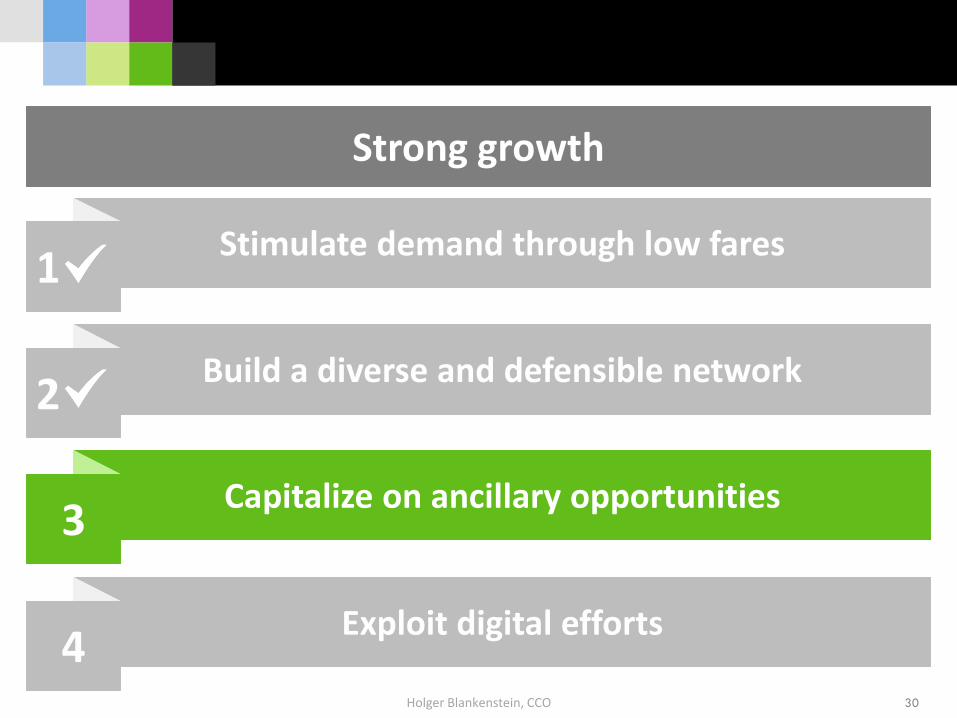
Volaris’ growth is based on four key drivers
Strong growth
Stimulate demand through low fares1
Build a diverse and defensible network2
Capitalize on ancillary opportunities3
Exploit digital efforts4
Holger Blankenstein, CCO 18
Strong growth
Stimulate demand through low fares1
Build a diverse and defensible network2
Capitalize on ancillary opportunities3
Exploit digital efforts4
Holger Blankenstein, CCO
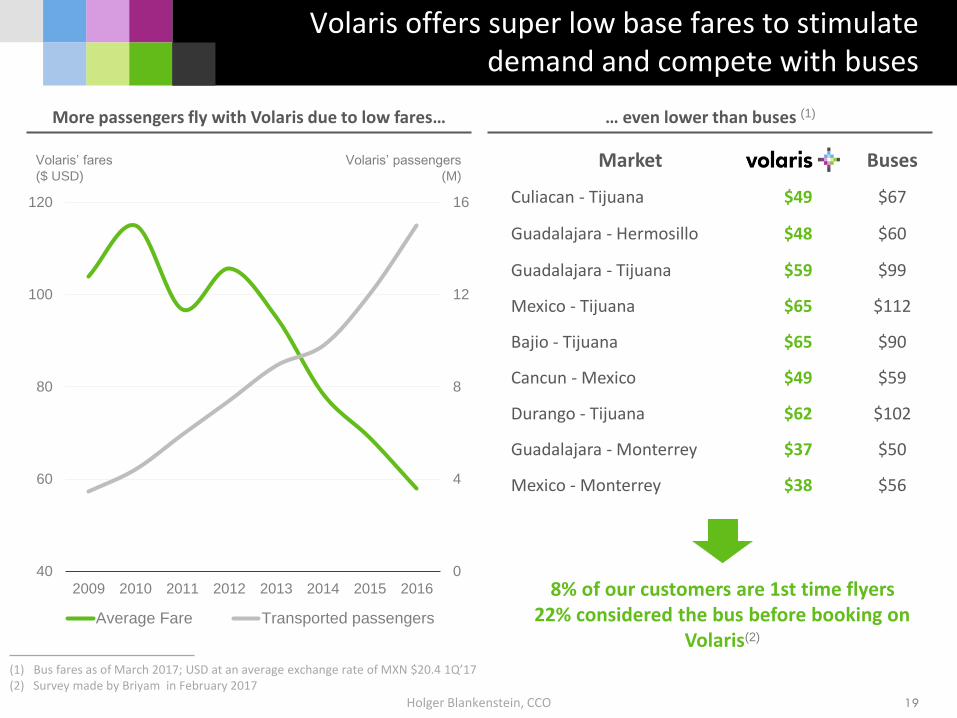
Volaris offers super low base fares to stimulate demand and compete with buses
19
0
4
8
12
16
40
60
80
100
120
2009 2010 2011 2012 2013 2014 2015 2016
Average Fare Transported passengers
Volaris’ passengers
(M)
Volaris’ fares
($ USD)
More passengers fly with Volaris due to low fares… … even lower than buses (1)
(1) Bus fares as of March 2017; USD at an average exchange rate of MXN $20.4 1Q’17(2) Survey made by Briyam in February 2017
Market Buses
Culiacan - Tijuana $49 $67
Guadalajara - Hermosillo $48 $60
Guadalajara - Tijuana $59 $99
Mexico - Tijuana $65 $112
Bajio - Tijuana $65 $90
Cancun - Mexico $49 $59
Durango - Tijuana $62 $102
Guadalajara - Monterrey $37 $50
Mexico - Monterrey $38 $56
8% of our customers are 1st time flyers22% considered the bus before booking on
Volaris(2)
0
1
2
3
4
5
0
50
100
150
200
250
January 2012 June 2017
O&D passengers
(thousands)
Route average fare
(USD)
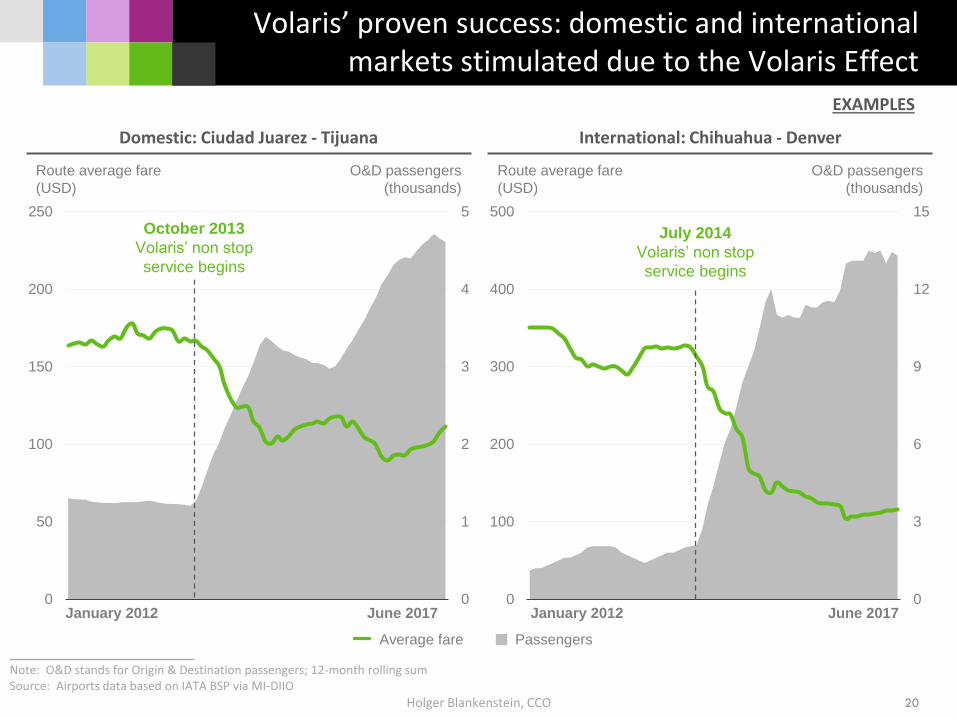
October 2013
Volaris’ non stop
service begins
0
3
6
9
12
15
0
100
200
300
400
500
January 2012 June 2017
O&D passengers
(thousands)
Route average fare
(USD)
July 2014
Volaris’ non stop
service begins
Holger Blankenstein, CCO
Volaris’ proven success: domestic and international markets stimulated due to the Volaris Effect
20
Domestic: Ciudad Juarez - Tijuana International: Chihuahua - Denver
Note: O&D stands for Origin & Destination passengers; 12-month rolling sumSource: Airports data based on IATA BSP via MI-DIIO
Average fare Passengers
EXAMPLES
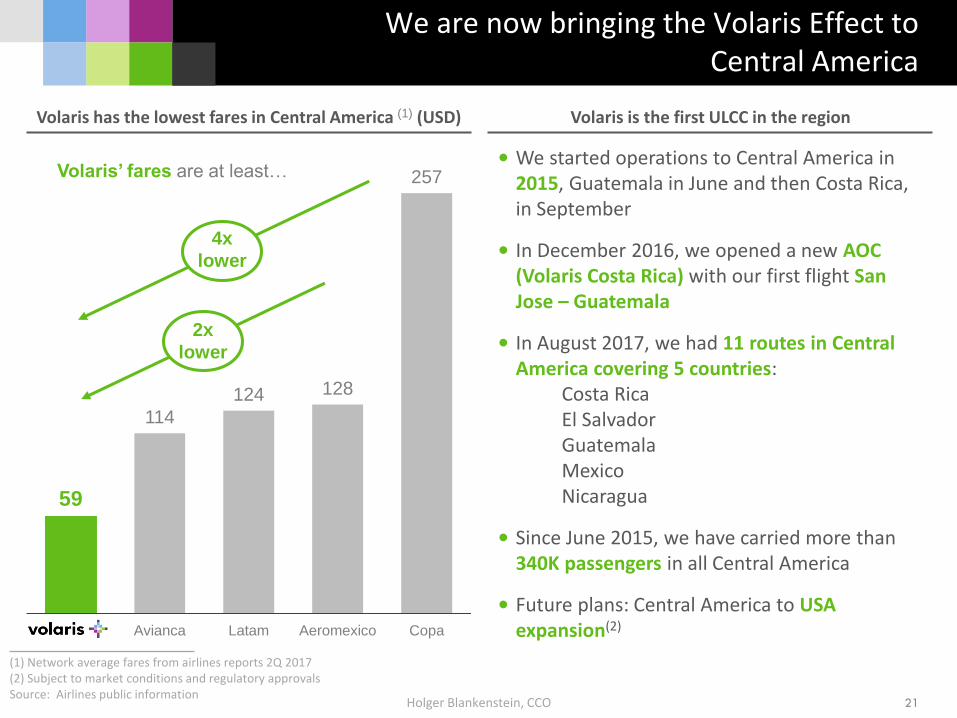
59
114
124 128
257
Volaris Avianca Latam Aeromexico Copa
Volaris’ fares are at least…
Holger Blankenstein, CCO
We are now bringing the Volaris Effect toCentral America
21
Volaris has the lowest fares in Central America (1) (USD) Volaris is the first ULCC in the region
(1) Network average fares from airlines reports 2Q 2017(2) Subject to market conditions and regulatory approvalsSource: Airlines public information
• We started operations to Central America in 2015, Guatemala in June and then Costa Rica, in September
• In December 2016, we opened a new AOC (Volaris Costa Rica) with our first flight San Jose – Guatemala
• In August 2017, we had 11 routes in Central America covering 5 countries:
Costa RicaEl SalvadorGuatemalaMexicoNicaragua
• Since June 2015, we have carried more than 340K passengers in all Central America
• Future plans: Central America to USA expansion(2)
4x
lower
2x
lower
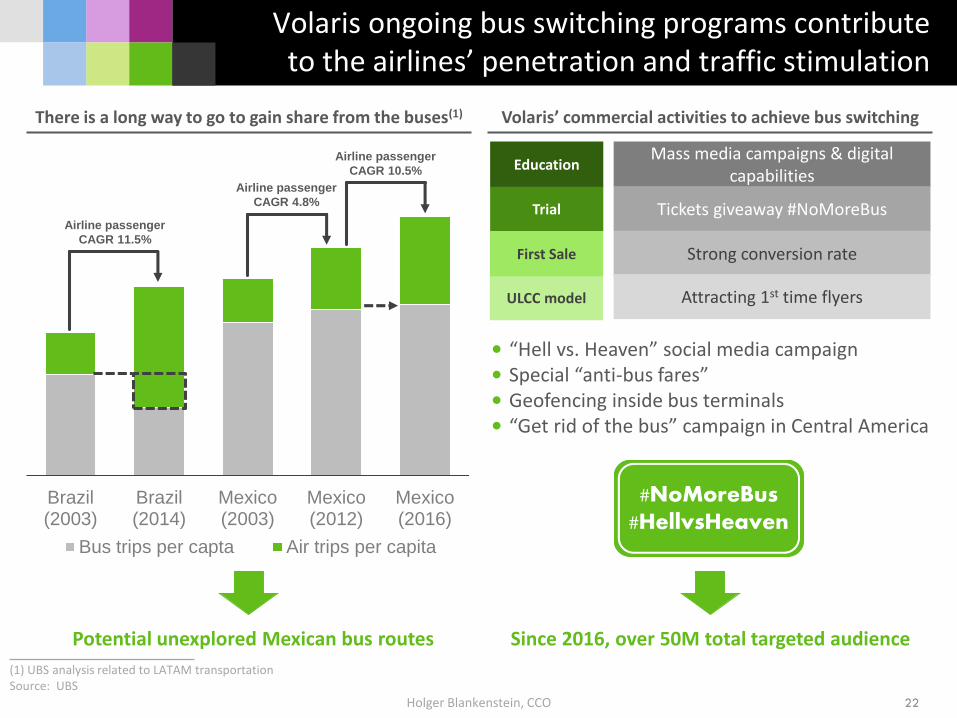
Brazil(2003)
Brazil(2014)
Mexico(2003)
Mexico(2012)
Mexico(2016)
Bus trips per capta Air trips per capita
Holger Blankenstein, CCO 22
(1) UBS analysis related to LATAM transportationSource: UBS
Potential unexplored Mexican bus routes
There is a long way to go to gain share from the buses(1) Volaris’ commercial activities to achieve bus switching
• “Hell vs. Heaven” social media campaign• Special “anti-bus fares”• Geofencing inside bus terminals• “Get rid of the bus” campaign in Central America
ULCC model
Trial
Education
First Sale
Mass media campaigns & digital capabilities
Tickets giveaway #NoMoreBus
Strong conversion rate
Attracting 1st time flyers
Volaris ongoing bus switching programs contribute to the airlines’ penetration and traffic stimulation
Since 2016, over 50M total targeted audience
Airline passenger
CAGR 11.5%
Airline passenger
CAGR 4.8%
Airline passenger
CAGR 10.5%
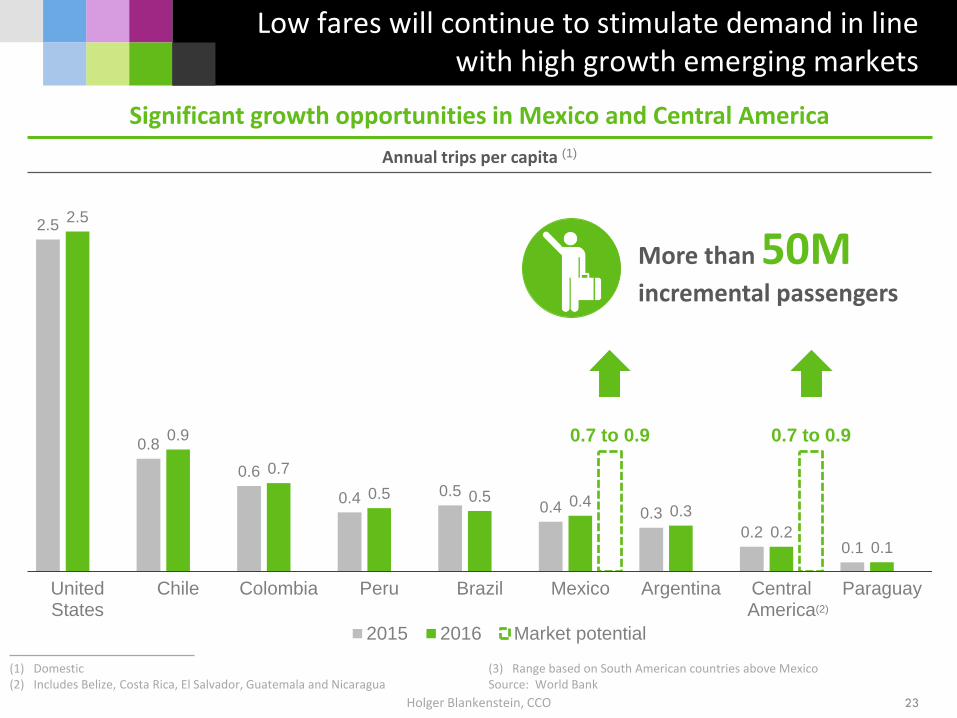
2.5
0.8
0.6
0.4 0.50.4 0.3
0.20.1
2.5
0.9
0.7
0.5 0.5 0.40.3
0.20.1
0.7 to 0.9 0.7 to 0.9
UnitedStates
Chile Colombia Peru Brazil Mexico Argentina CentralAmerica
Paraguay
2015 2016 Market potential
Holger Blankenstein, CCO
Low fares will continue to stimulate demand in line with high growth emerging markets
23
(1) Domestic(2) Includes Belize, Costa Rica, El Salvador, Guatemala and Nicaragua
Annual trips per capita (1)
Significant growth opportunities in Mexico and Central America
More than 50Mincremental passengers
(2)
(3) Range based on South American countries above MexicoSource: World Bank
Holger Blankenstein, CCO 24
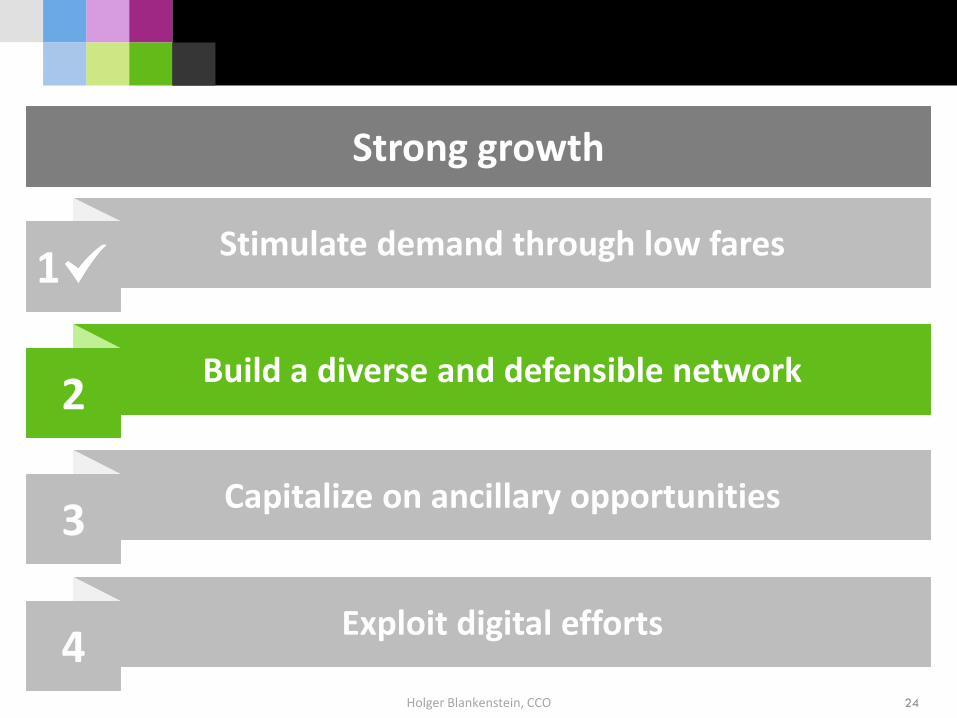
Strong growth
Stimulate demand through low fares1
Build a diverse and defensible network2
Capitalize on ancillary opportunities3
Exploit digital efforts4
Holger Blankenstein, CCO
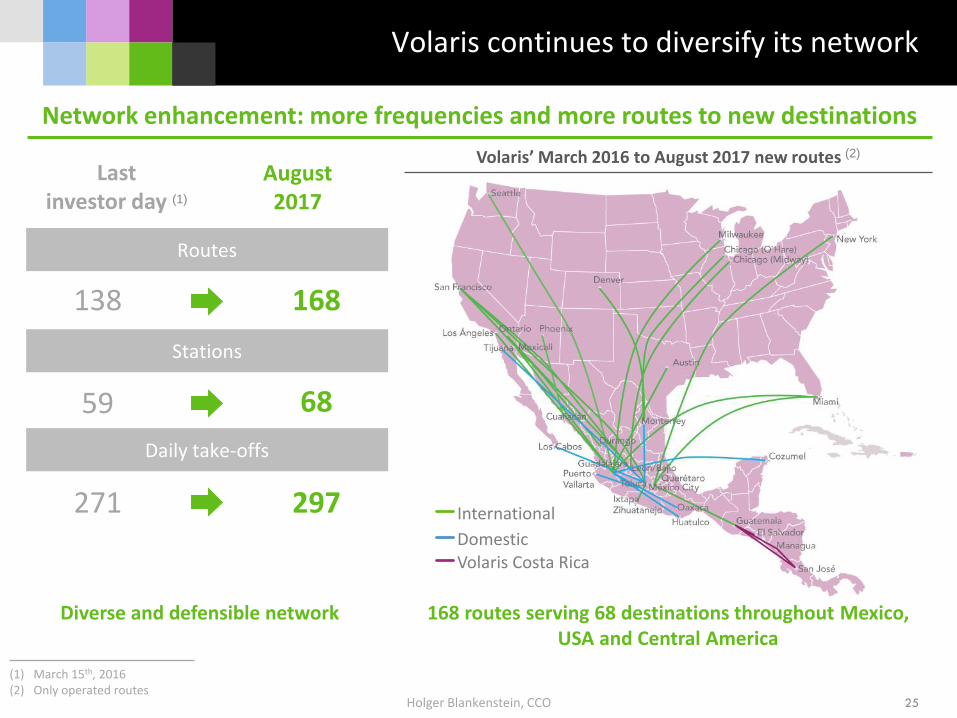
Volaris continues to diversify its network
25
Network enhancement: more frequencies and more routes to new destinations
168 routes serving 68 destinations throughout Mexico, USA and Central America
138 168
Lastinvestor day (1)
August2017
Routes
Stations
59 68
Daily take-offs
271 297
(1) March 15th, 2016(2) Only operated routes
Volaris’ March 2016 to August 2017 new routes (2)
International
DomesticVolaris Costa Rica
Diverse and defensible network
Holger Blankenstein, CCO
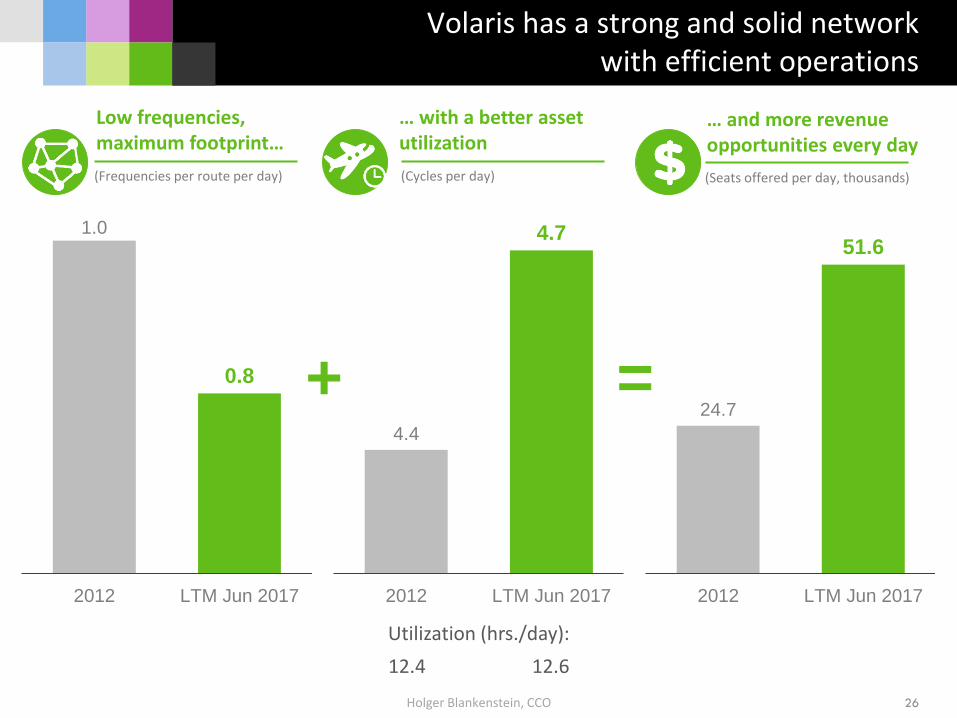
Volaris has a strong and solid network with efficient operations
26
Low frequencies, maximum footprint…
(Frequencies per route per day)
… and more revenue opportunities every day
(Seats offered per day, thousands)
… with a better assetutilization
(Cycles per day)
1.0
0.8
2012 LTM Jun 2017
4.4
4.7
2012 LTM Jun 2017
24.7
51.6
2012 LTM Jun 2017
12.4 12.6
Utilization (hrs./day):
+ =
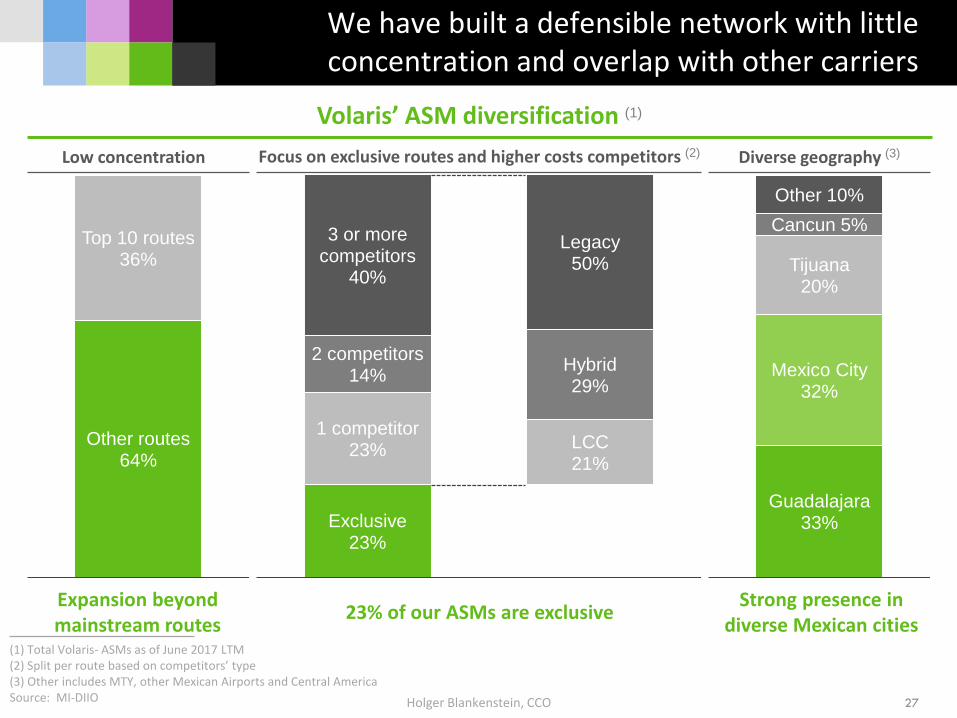
Exclusive23%
1 competitor23% LCC
21%
2 competitors14%
Hybrid29%
3 or morecompetitors
40%
Legacy50%
Other routes64%
Top 10 routes36%
Holger Blankenstein, CCO
We have built a defensible network with little concentration and overlap with other carriers
27
(1) Total Volaris- ASMs as of June 2017 LTM(2) Split per route based on competitors’ type(3) Other includes MTY, other Mexican Airports and Central AmericaSource: MI-DIIO
Volaris’ ASM diversification (1)
Focus on exclusive routes and higher costs competitors (2)Low concentration
Expansion beyond mainstream routes
23% of our ASMs are exclusiveStrong presence in
diverse Mexican cities
Diverse geography (3)
Guadalajara33%
Mexico City32%
Tijuana20%
Cancun 5%
Other 10%
Holger Blankenstein, CCO
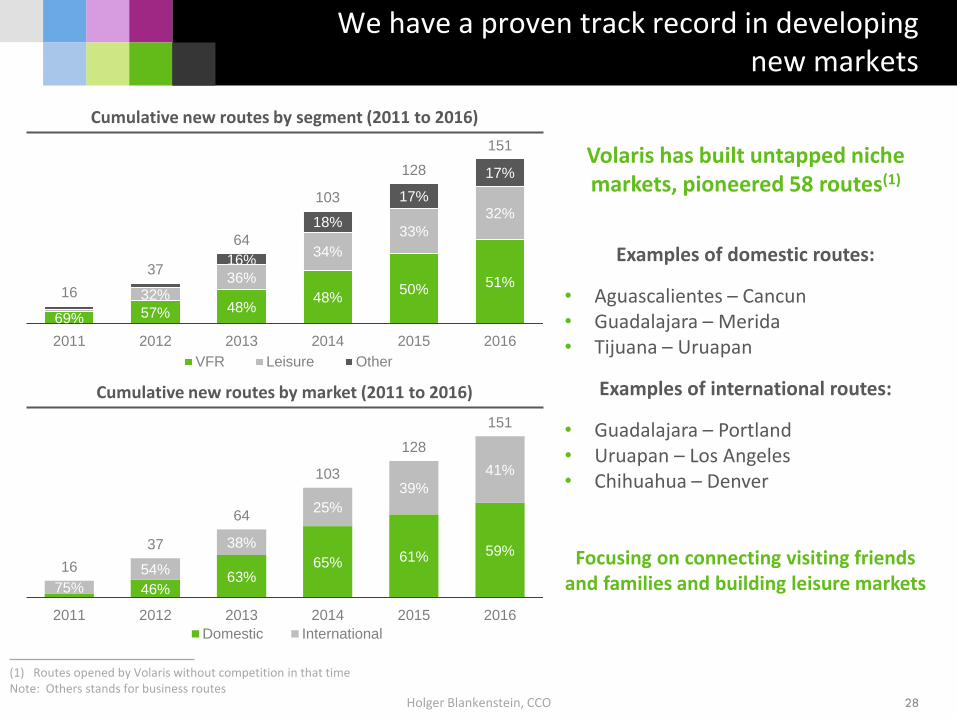
We have a proven track record in developingnew markets
28
(1) Routes opened by Volaris without competition in that timeNote: Others stands for business routes
Examples of domestic routes:
• Aguascalientes – Cancun• Guadalajara – Merida• Tijuana – Uruapan
Examples of international routes:
• Guadalajara – Portland• Uruapan – Los Angeles• Chihuahua – Denver
Focusing on connecting visiting friends and families and building leisure markets
Volaris has built untapped niche markets, pioneered 58 routes(1)
69% 57% 48%48%
50%51%
32%36%
34%
33%
32%
16%
18%
17%
17%
16
37
64
103
128
151
2011 2012 2013 2014 2015 2016
VFR Leisure Other
Cumulative new routes by segment (2011 to 2016)
46%63%
65% 61% 59%
75%
54%
38%
25%
39%
41%
16
37
64
103
128
151
2011 2012 2013 2014 2015 2016
Domestic International
Cumulative new routes by market (2011 to 2016)
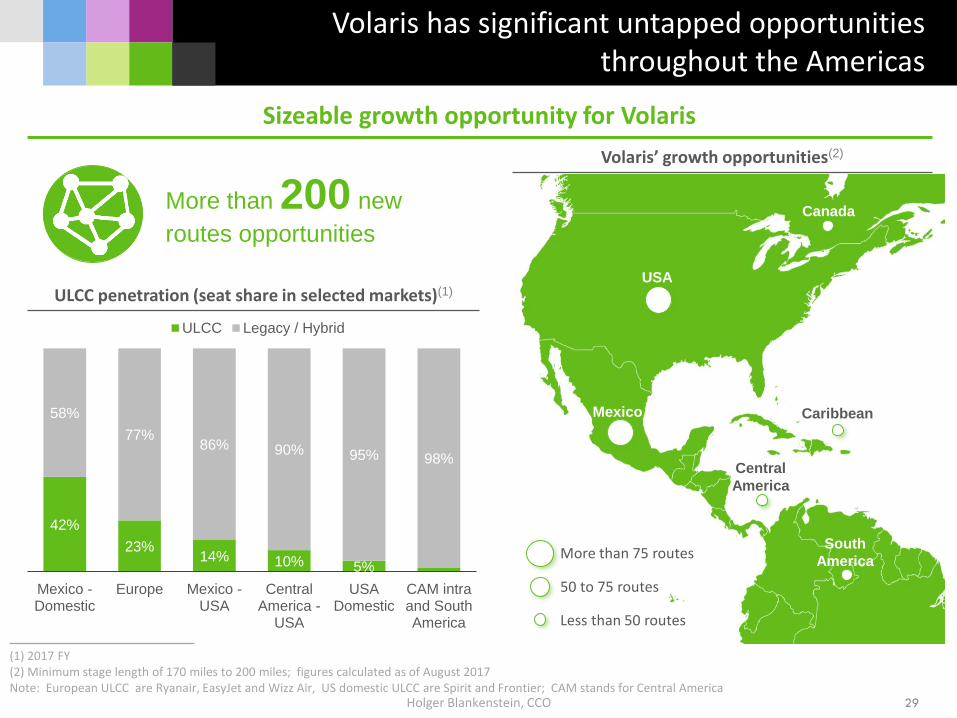
42%
23%14% 10% 5%
58%
77%86% 90% 95% 98%
Mexico -Domestic
Europe Mexico -USA
CentralAmerica -
USA
USADomestic
CAM intraand SouthAmerica
ULCC Legacy / Hybrid
Holger Blankenstein, CCO
Volaris has significant untapped opportunities throughout the Americas
29
Sizeable growth opportunity for Volaris
Volaris’ growth opportunities(2)
More than 200 new
routes opportunities
(1) 2017 FY(2) Minimum stage length of 170 miles to 200 miles; figures calculated as of August 2017Note: European ULCC are Ryanair, EasyJet and Wizz Air, US domestic ULCC are Spirit and Frontier; CAM stands for Central America
ULCC penetration (seat share in selected markets)(1)
South
AmericaMore than 75 routes
50 to 75 routes
Less than 50 routes
USA
Canada
Central
America
Mexico Caribbean
Holger Blankenstein, CCO 30
Strong growth
Stimulate demand through low fares1
Build a diverse and defensible network2
Capitalize on ancillary opportunities3
Exploit digital efforts4
150
200
250
300
350
400
450
2Q 20171Q 2012
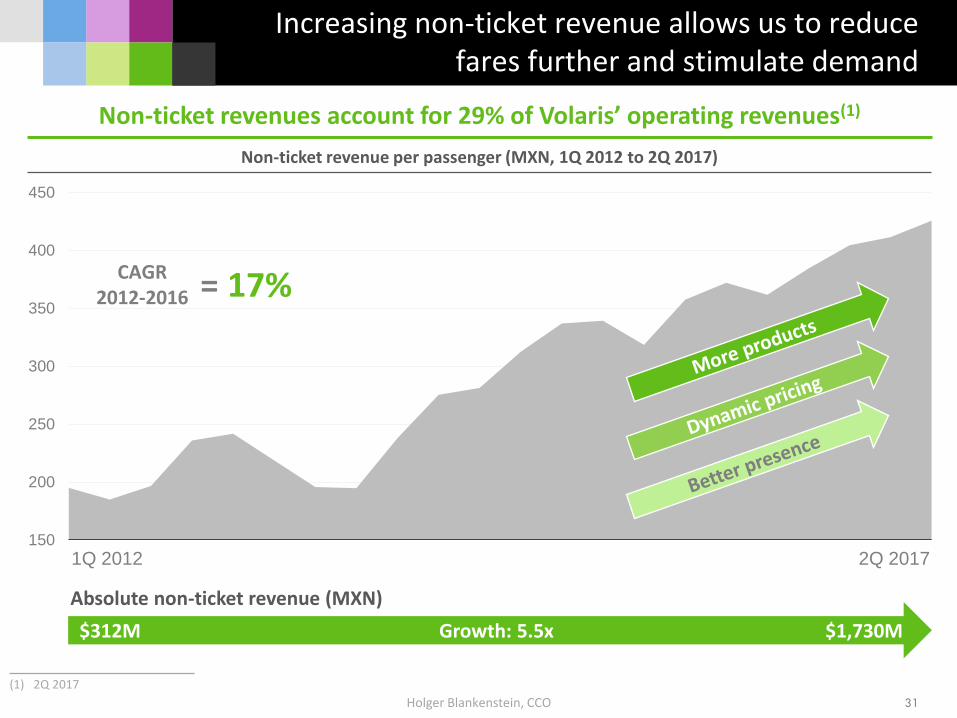
CAGR2012-2016 = 17%
Holger Blankenstein, CCO
Increasing non-ticket revenue allows us to reduce fares further and stimulate demand
31
Non-ticket revenues account for 29% of Volaris’ operating revenues(1)
Non-ticket revenue per passenger (MXN, 1Q 2012 to 2Q 2017)
Absolute non-ticket revenue (MXN)
$312M $1,730MGrowth: 5.5x
(1) 2Q 2017
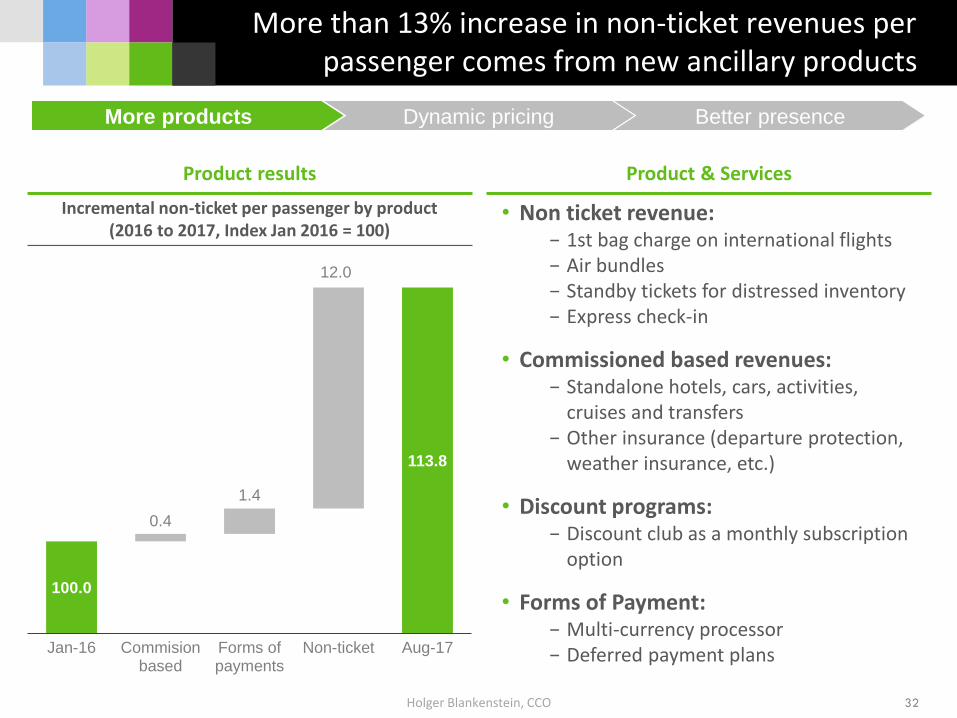
More than 13% increase in non-ticket revenues per passenger comes from new ancillary products
• Non ticket revenue:− 1st bag charge on international flights− Air bundles − Standby tickets for distressed inventory− Express check-in
• Commissioned based revenues:− Standalone hotels, cars, activities,
cruises and transfers− Other insurance (departure protection,
weather insurance, etc.)
• Discount programs:− Discount club as a monthly subscription
option
• Forms of Payment:− Multi-currency processor− Deferred payment plans
Holger Blankenstein, CCO
More products Dynamic pricing Better presence
Product & Services
32
Incremental non-ticket per passenger by product(2016 to 2017, Index Jan 2016 = 100)
Product results
100.0
0.4
1.4
12.0
113.8
Jan-16 Commisionbased
Forms ofpayments
Non-ticket Aug-17
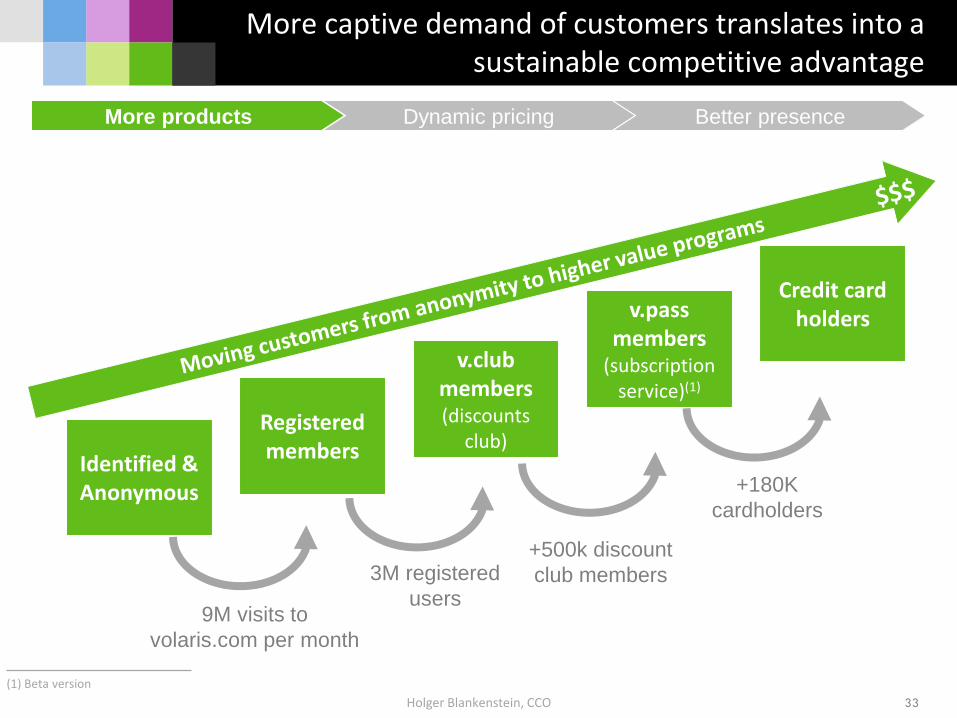
More captive demand of customers translates into a sustainable competitive advantage
Holger Blankenstein, CCO 33
More products Dynamic pricing Better presence
Identified & Anonymous
Registered members
v.clubmembers(discounts
club)
v.passmembers
(subscriptionservice)(1)
Credit card holders
9M visits to
volaris.com per month
3M registered
users
+500k discount
club members
+180K
cardholders
(1) Beta version
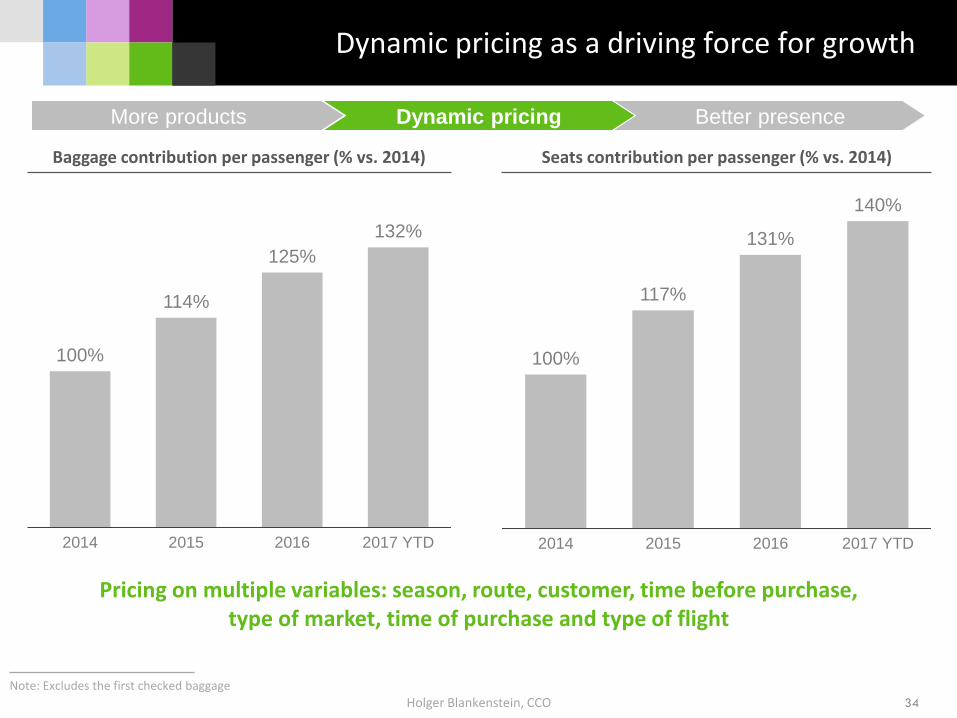
Dynamic pricing as a driving force for growth
Holger Blankenstein, CCO
Pricing on multiple variables: season, route, customer, time before purchase, type of market, time of purchase and type of flight
More products Dynamic pricing Better presence
Baggage contribution per passenger (% vs. 2014) Seats contribution per passenger (% vs. 2014)
100%
114%
125%
132%
2014 2015 2016 2017 YTD
100%
117%
131%
140%
2014 2015 2016 2017 YTD
Note: Excludes the first checked baggage
34
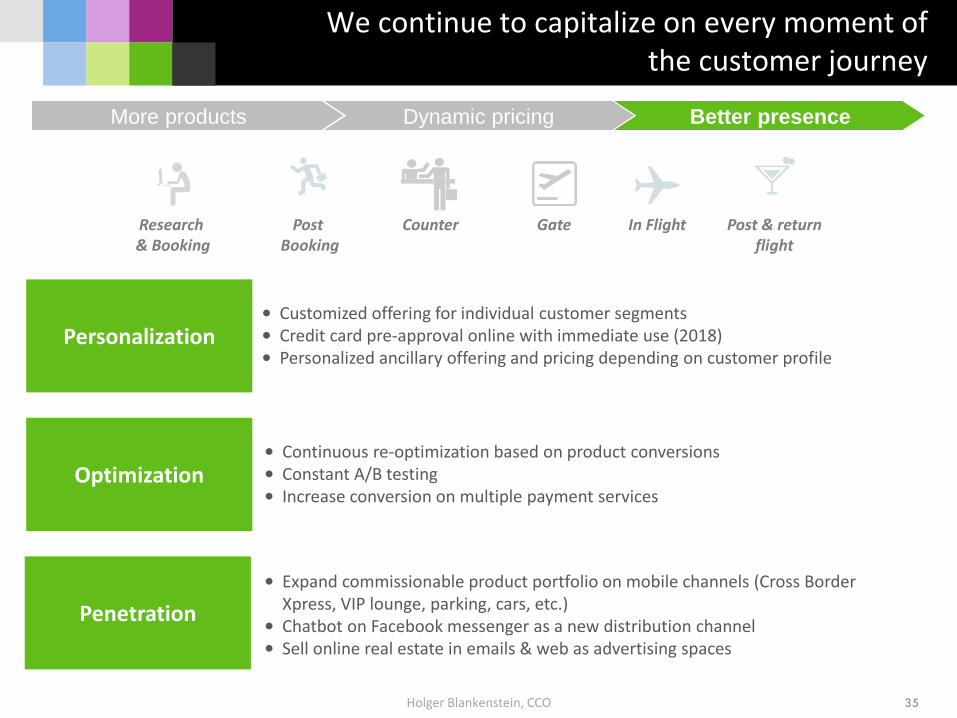
We continue to capitalize on every moment of the customer journey
• Customized offering for individual customer segments• Credit card pre-approval online with immediate use (2018)• Personalized ancillary offering and pricing depending on customer profile
• Continuous re-optimization based on product conversions • Constant A/B testing• Increase conversion on multiple payment services
• Expand commissionable product portfolio on mobile channels (Cross Border Xpress, VIP lounge, parking, cars, etc.)
• Chatbot on Facebook messenger as a new distribution channel• Sell online real estate in emails & web as advertising spaces
Post & returnflight
Post Booking
Counter In FlightResearch & Booking
Gate
Personalization
Optimization
Penetration
Holger Blankenstein, CCO
More products Dynamic pricing Better presence
35
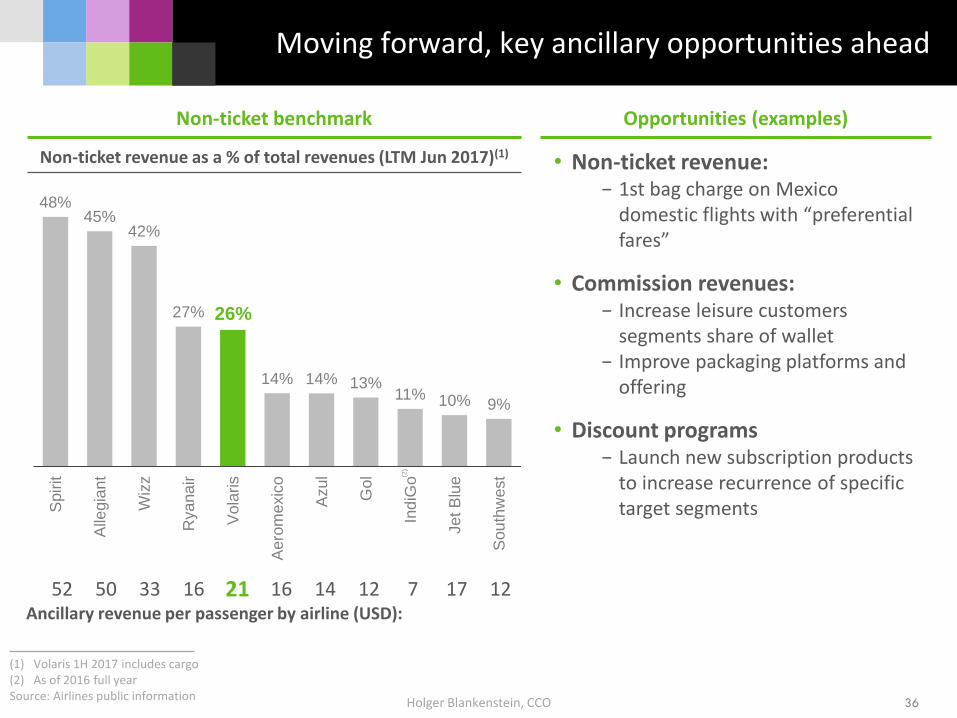
• Non-ticket revenue:− 1st bag charge on Mexico
domestic flights with “preferential fares”
• Commission revenues:− Increase leisure customers
segments share of wallet− Improve packaging platforms and
offering
• Discount programs − Launch new subscription products
to increase recurrence of specific target segments
Non-ticket benchmark Opportunities (examples)
Moving forward, key ancillary opportunities ahead
Holger Blankenstein, CCO
Non-ticket revenue as a % of total revenues (LTM Jun 2017)(1)
Ancillary revenue per passenger by airline (USD):
52 121771216211650
36
33 14
(2)
(1) Volaris 1H 2017 includes cargo(2) As of 2016 full yearSource: Airlines public information
48%45%
42%
27% 26%
14% 14% 13%11% 10% 9%
Spir
it
Alle
gia
nt
Wiz
z
Ryana
ir
Vola
ris
Aero
mexic
o
Azul
Gol
Ind
iGo
Je
t B
lue
Sou
thw
est
Holger Blankenstein, CCO 37
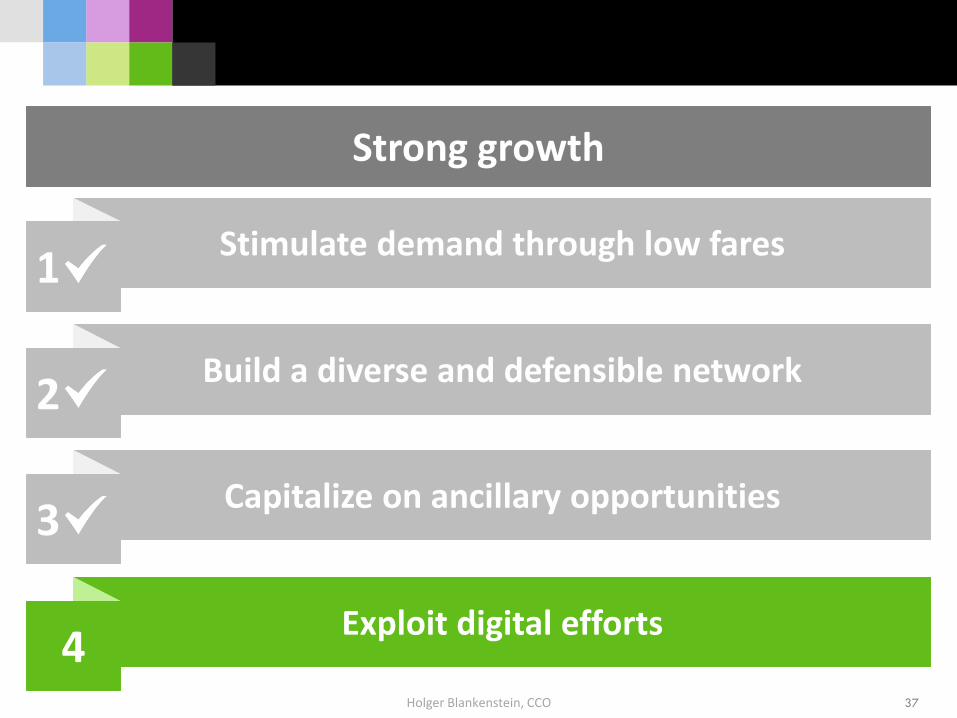
Strong growth
Stimulate demand through low fares1
Build a diverse and defensible network2
Capitalize on ancillary opportunities3
Exploit digital efforts4
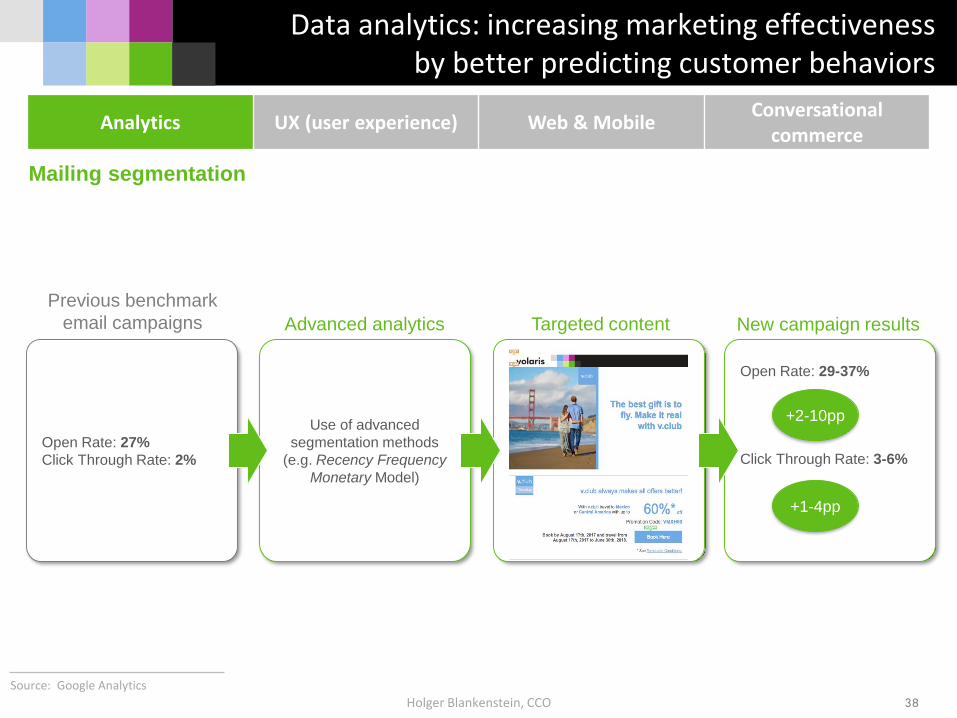
Data analytics: increasing marketing effectiveness by better predicting customer behaviors
Open Rate: 29-37%
Click Through Rate: 3-6%
New campaign results
Holger Blankenstein, CCOSource: Google Analytics
Open Rate: 27%
Click Through Rate: 2%
Previous benchmark
email campaigns
Use of advanced
segmentation methods
(e.g. Recency Frequency
Monetary Model)
Targeted contentAdvanced analytics
+2-10pp
+1-4pp
Mailing segmentation
Analytics UX (user experience) Web & MobileConversational
commerce
38
Holger Blankenstein, CCO
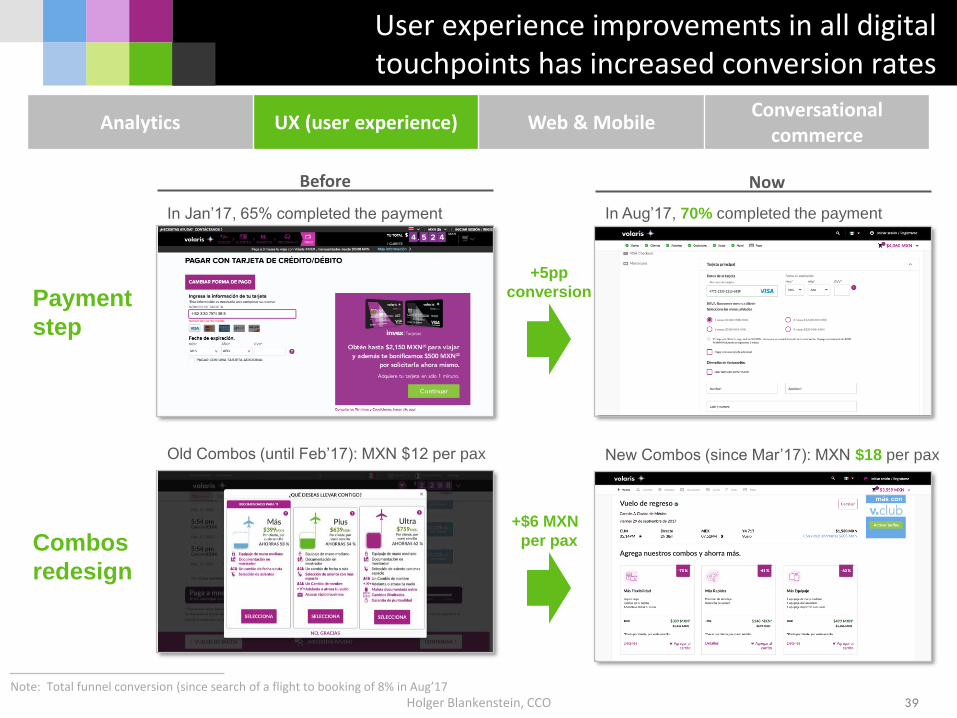
User experience improvements in all digital touchpoints has increased conversion rates
Payment
step
Combos
redesign
Before Now
In Jan’17, 65% completed the payment In Aug’17, 70% completed the payment
Old Combos (until Feb’17): MXN $12 per pax New Combos (since Mar’17): MXN $18 per pax
Note: Total funnel conversion (since search of a flight to booking of 8% in Aug’17
+5pp
conversion
+$6 MXN
per pax
Analytics UX (user experience) Web & MobileConversational
commerce
39

Holger Blankenstein, CCO
What are we looking to improve with this strategy?
• Mobile first designed user experiences are growing mobile sales and servicing
• Increase funnel conversion and ancillary sales per passenger, by redesigning booking flow
• Reduce bounce rate and increase engagement, by redesigning the homepage
Mobile first user experiences to monetize the growing share of mobile visits to our digital touchpoints
Home page Confirmation pageFlights
(preferential fare)
PassengersAdditional services
Analytics UX (user experience) Web & MobileConversational
commerce
40
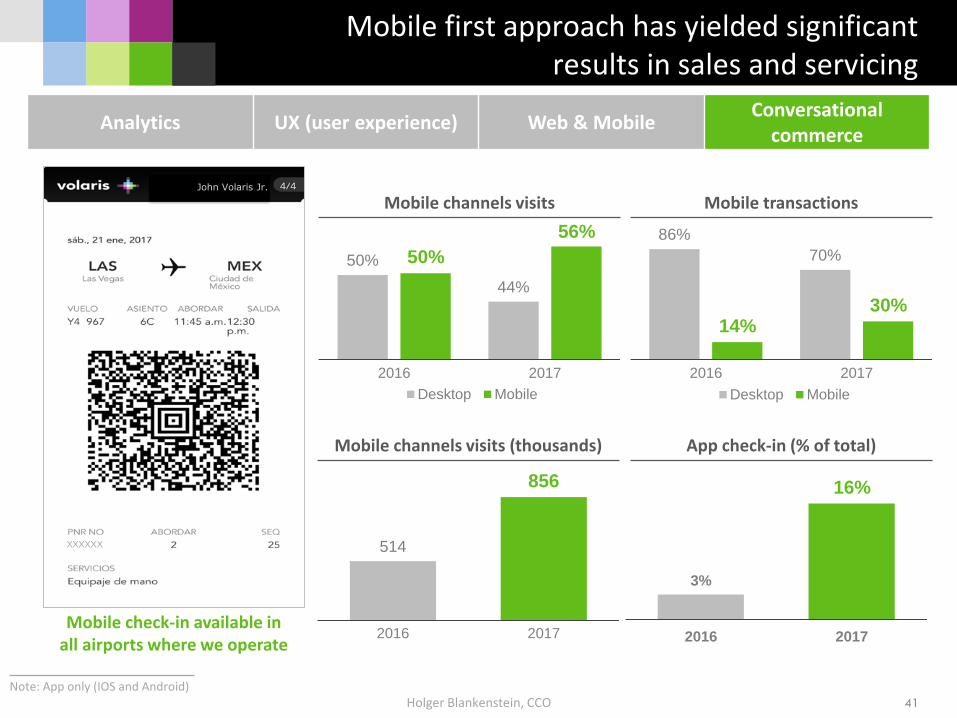
Mobile first approach has yielded significant results in sales and servicing
Holger Blankenstein, CCO
Analytics UX (user experience) Web & MobileConversational
commerce
514
856
2016 2017
86%
70%
14%30%
2016 2017
Desktop Mobile
50%
44%
50%
56%
2016 2017
Desktop Mobile
Mobile channels visits Mobile transactions
Mobile channels visits (thousands)
3%
16%
2016 2017
App check-in (% of total)
Mobile check-in available in all airports where we operate
John Volaris Jr.
Note: App only (IOS and Android)
XXXXXX
41
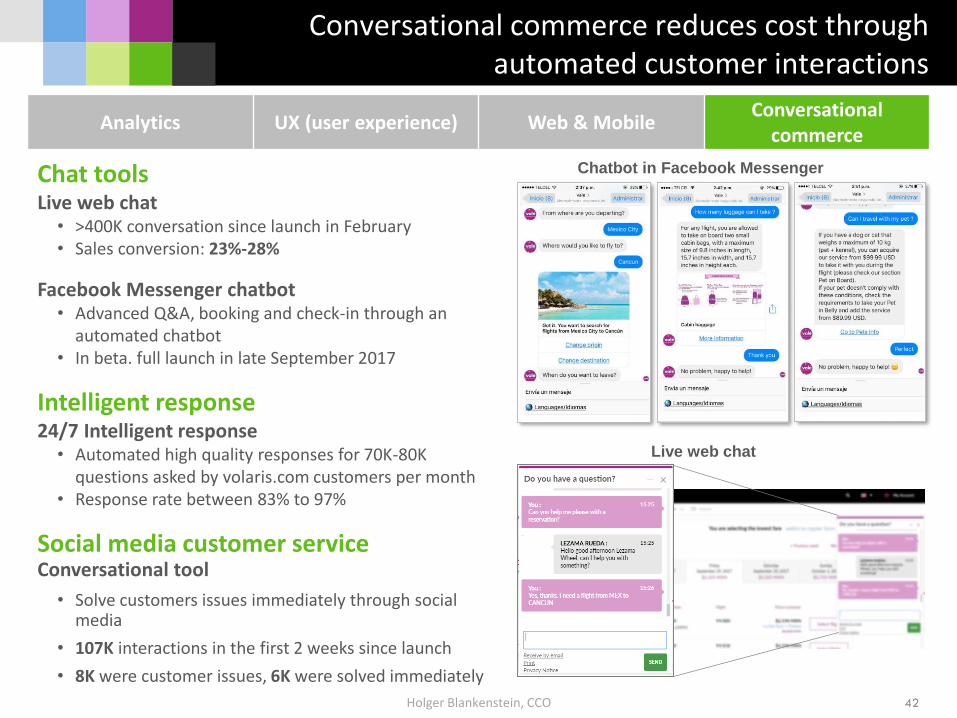
Conversational commerce reduces cost through automated customer interactions
Chat toolsLive web chat
• >400K conversation since launch in February• Sales conversion: 23%-28%
Facebook Messenger chatbot• Advanced Q&A, booking and check-in through an
automated chatbot • In beta. full launch in late September 2017
Intelligent response24/7 Intelligent response
• Automated high quality responses for 70K-80K questions asked by volaris.com customers per month
• Response rate between 83% to 97%
Social media customer serviceConversational tool
• Solve customers issues immediately through social media
• 107K interactions in the first 2 weeks since launch
• 8K were customer issues, 6K were solved immediately
Chatbot in Facebook Messenger
Live web chat
Holger Blankenstein, CCO
Analytics UX (user experience) Web & MobileConversational
commerce
42
José Luis SuárezChief Operating Officer
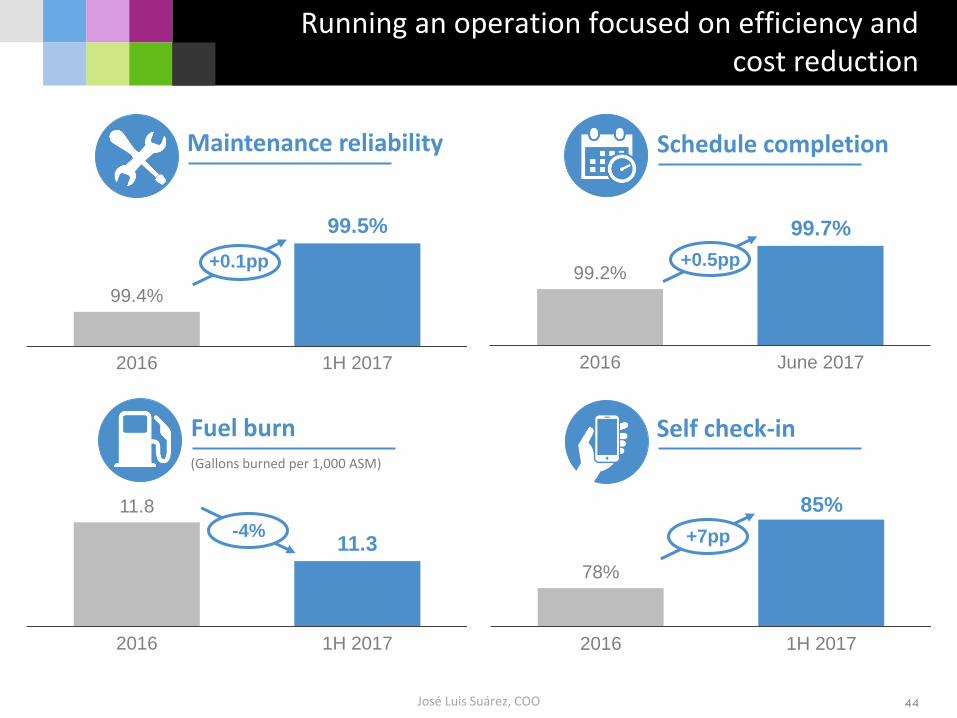
99.2%
99.7%
2016 June 2017
+0.5pp
11.8
11.3
2016 1H 2017
-4%
Running an operation focused on efficiency and cost reduction
44
Schedule completion
Fuel burn(Gallons burned per 1,000 ASM)
José Luis Suárez, COO
78%
85%
2016 1H 2017
+7pp
Self check-in
Maintenance reliability
99.4%
99.5%
2016 1H 2017
+0.1pp
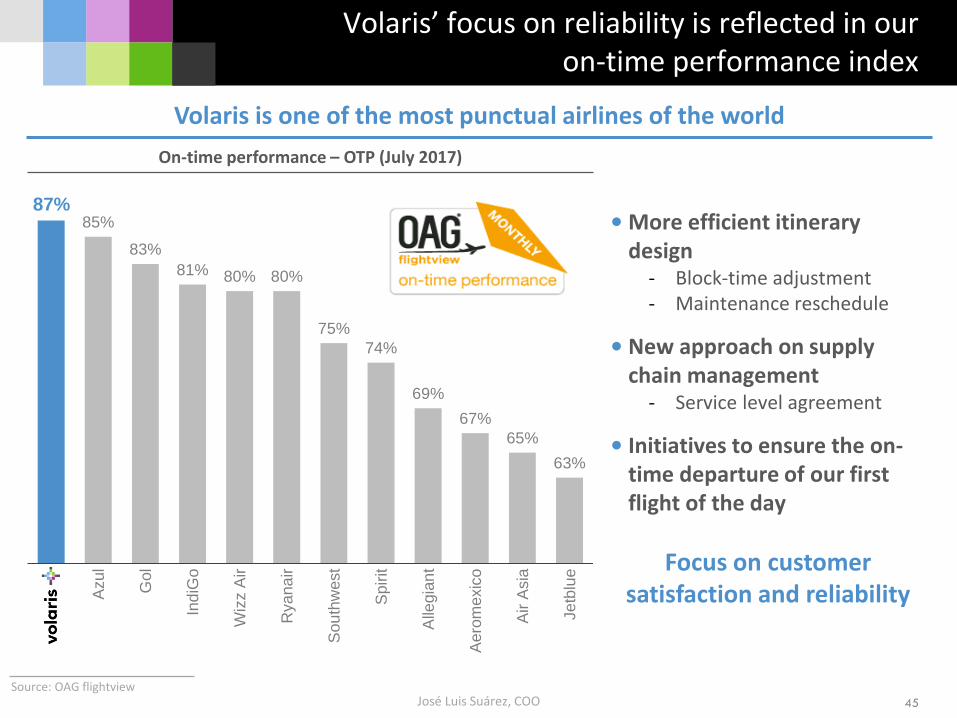
87%85%
83%
81% 80% 80%
75%
74%
69%
67%
65%
63%
Vola
ris
Azul
Gol
Ind
iGo
Wiz
z A
ir
Ryana
ir
Sou
thw
est
Spir
it
Alle
gia
nt
Aero
mexic
o
Air A
sia
Je
tblu
e
Volaris’ focus on reliability is reflected in ouron-time performance index
45
Source: OAG flightview
On-time performance – OTP (July 2017)
Volaris is one of the most punctual airlines of the world
• More efficient itinerary design
- Block-time adjustment- Maintenance reschedule
• New approach on supply chain management
- Service level agreement
• Initiatives to ensure the on-time departure of our first flight of the day
Focus on customer satisfaction and reliability
José Luis Suárez, COO
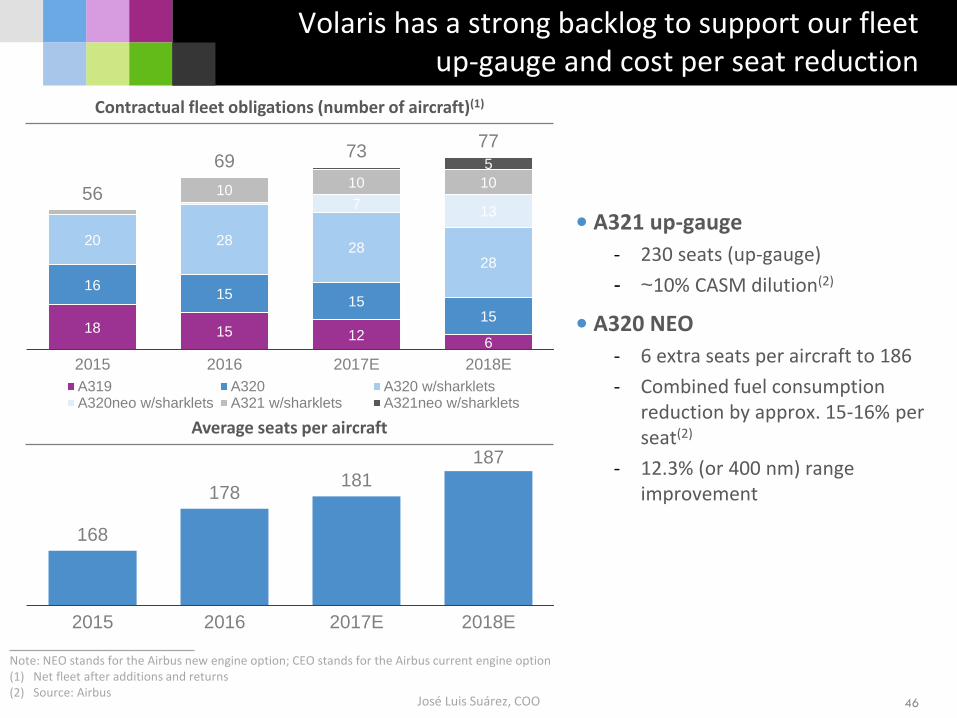
18 15 126
1615
1515
20 2828
28
713
1010 10
5
56
6973
77
2015 2016 2017E 2018E
A319 A320 A320 w/sharkletsA320neo w/sharklets A321 w/sharklets A321neo w/sharklets
168
178181
187
2015 2016 2017E 2018E
46
Note: NEO stands for the Airbus new engine option; CEO stands for the Airbus current engine option(1) Net fleet after additions and returns(2) Source: Airbus
Contractual fleet obligations (number of aircraft)(1)
• A321 up-gauge
- 230 seats (up-gauge)
- ~10% CASM dilution(2)
• A320 NEO
- 6 extra seats per aircraft to 186
- Combined fuel consumption reduction by approx. 15-16% per seat(2)
- 12.3% (or 400 nm) range improvement
Volaris has a strong backlog to support our fleet up-gauge and cost per seat reduction
Average seats per aircraft
José Luis Suárez, COO
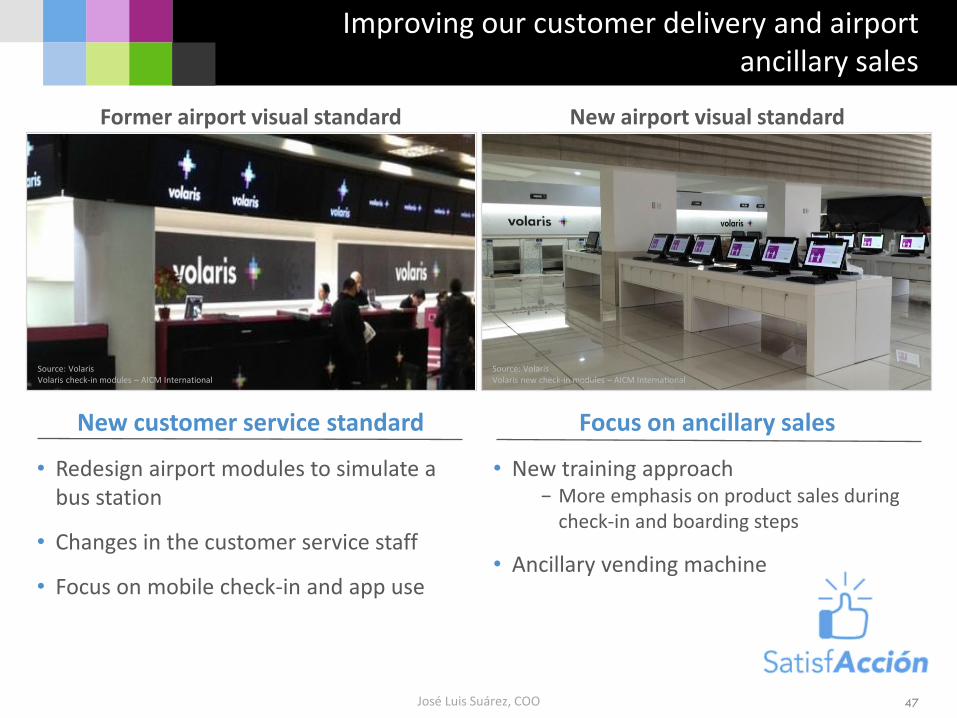
Improving our customer delivery and airport ancillary sales
47José Luis Suárez, COO
Source: VolarisVolaris check-in modules – AICM International
Former airport visual standard New airport visual standard
Source: VolarisVolaris new check-in modules – AICM International
New customer service standard
• Redesign airport modules to simulate a bus station
• Changes in the customer service staff
• Focus on mobile check-in and app use
Focus on ancillary sales
• New training approach− More emphasis on product sales during
check-in and boarding steps
• Ancillary vending machine
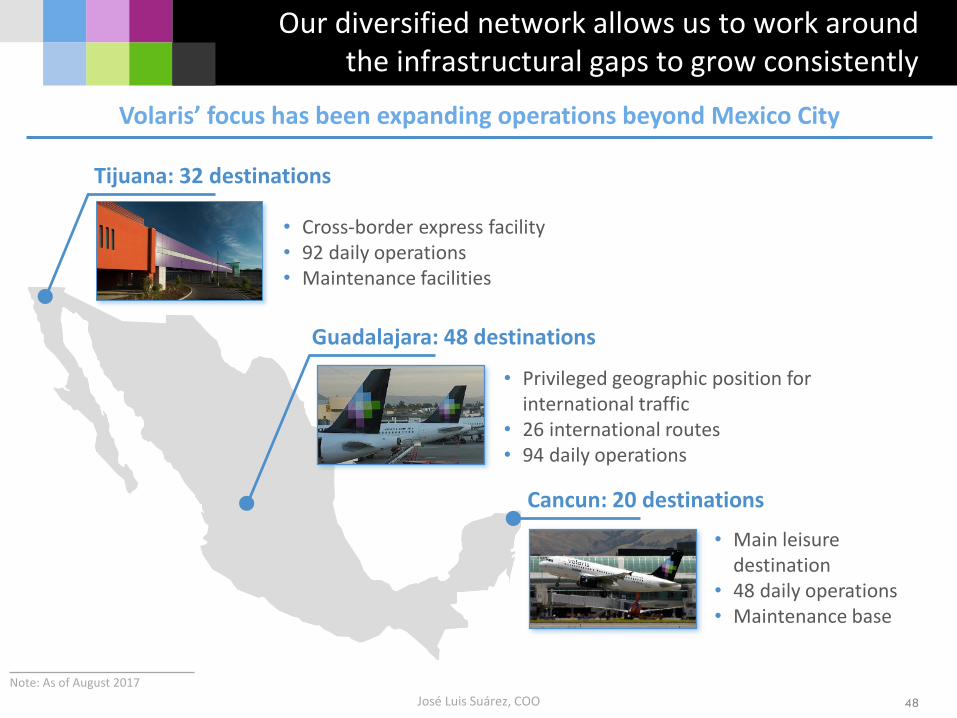
Our diversified network allows us to work around the infrastructural gaps to grow consistently
48
Note: As of August 2017
Volaris’ focus has been expanding operations beyond Mexico City
Guadalajara: 48 destinations
Tijuana: 32 destinations
Cancun: 20 destinations
• Cross-border express facility• 92 daily operations• Maintenance facilities
• Privileged geographic position for international traffic
• 26 international routes• 94 daily operations
• Main leisure destination
• 48 daily operations • Maintenance base
José Luis Suárez, COO
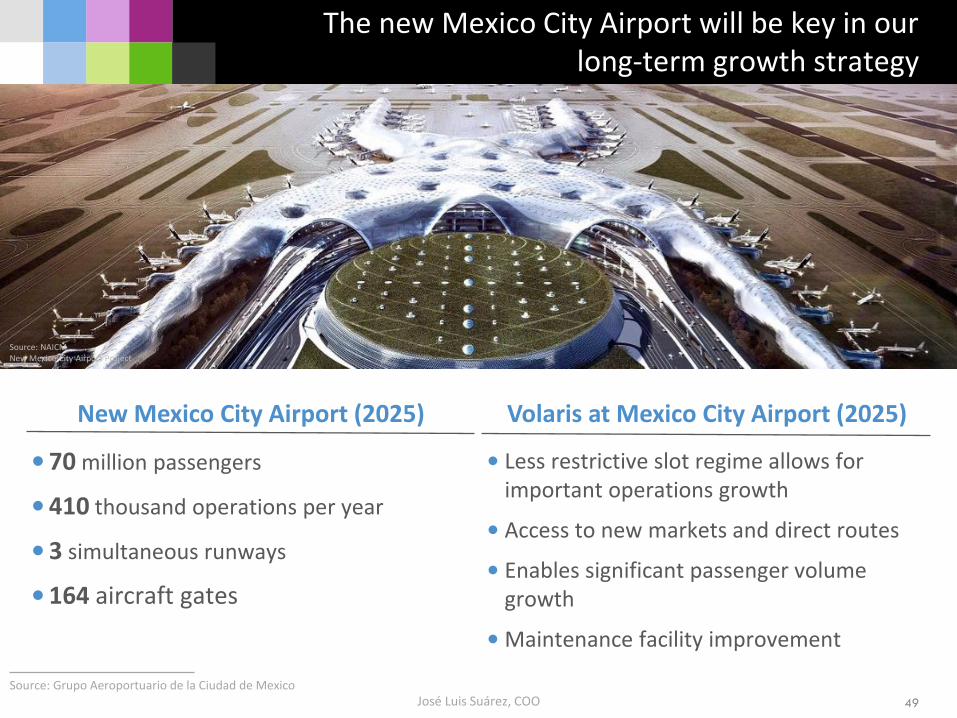
The new Mexico City Airport will be key in our long-term growth strategy
49
Source: Grupo Aeroportuario de la Ciudad de Mexico
Source: NAICMNew Mexico City Airport Project
José Luis Suárez, COO
New Mexico City Airport (2025) Volaris at Mexico City Airport (2025)
•70 million passengers
•410 thousand operations per year
•3 simultaneous runways
•164 aircraft gates
• Less restrictive slot regime allows for important operations growth
• Access to new markets and direct routes
• Enables significant passenger volume growth
• Maintenance facility improvement
Volaris’ operations are certificated with the most important seals in the airline industry
50
IATA Operational Safety Audit (IOSA) System
IATA Safety Audit for Ground Operations (ISAGO)
ISO 9001:2008 and 14001:2004
José Luis Suárez, COO

Fernando SuárezChief Financial Officer

Enrique Beltranena, CEO
Thanks for the recognition!
52
Institutional Investor 2017 Latin America Executive Team Awards – Transportation Small-cap
Note: In total, 445 investors and 238 sell-side and buy-side analysts voted across 16 sectors, www.institutionalinvestor.com(1) By sell-side analysts
1st 1stBest CEOEnrique Beltranena
Best Websiteir.volaris.com
2nd 2ndBest CFO(1)
Fernando SuárezBest Analyst Day
3rd 3rdBest IR Team Best IR Program
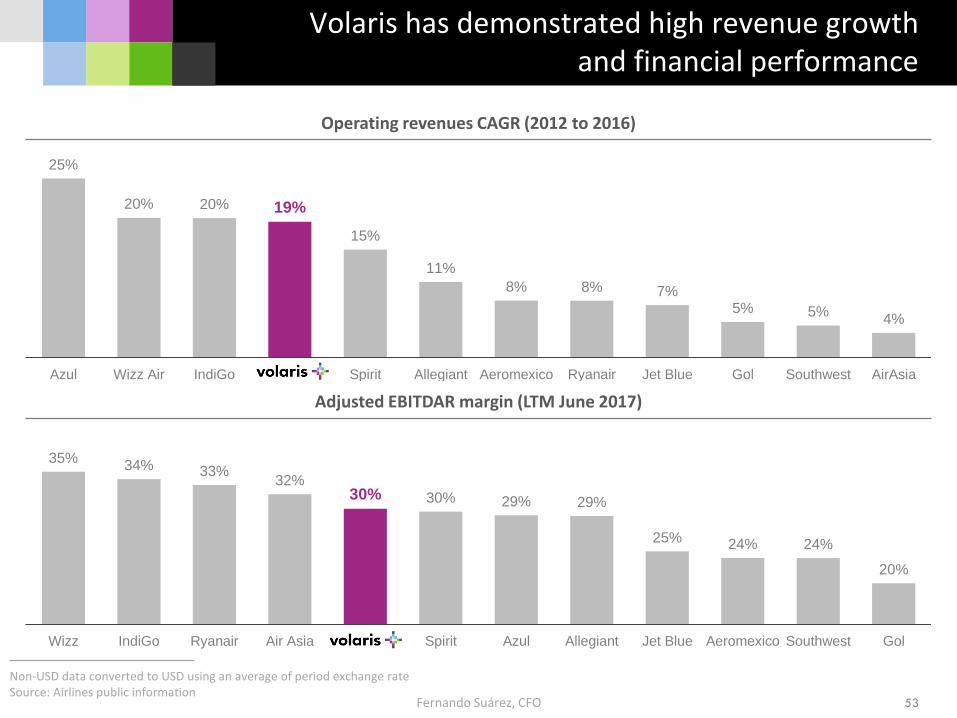
35%34% 33%
32%30% 30% 29% 29%
25% 24% 24%
20%
Wizz IndiGo Ryanair Air Asia Volaris Spirit Azul Allegiant Jet Blue Aeromexico Southwest Gol
Fernando Suárez, CFO 53
Operating revenues CAGR (2012 to 2016)
Adjusted EBITDAR margin (LTM June 2017)
25%
20% 20% 19%
15%
11%
8% 8% 7%5% 5%
4%
Azul Wizz Air IndiGo Volaris Spirit Allegiant Aeromexico Ryanair Jet Blue Gol Southwest AirAsia
Volaris has demonstrated high revenue growth and financial performance
Non-USD data converted to USD using an average of period exchange rateSource: Airlines public information
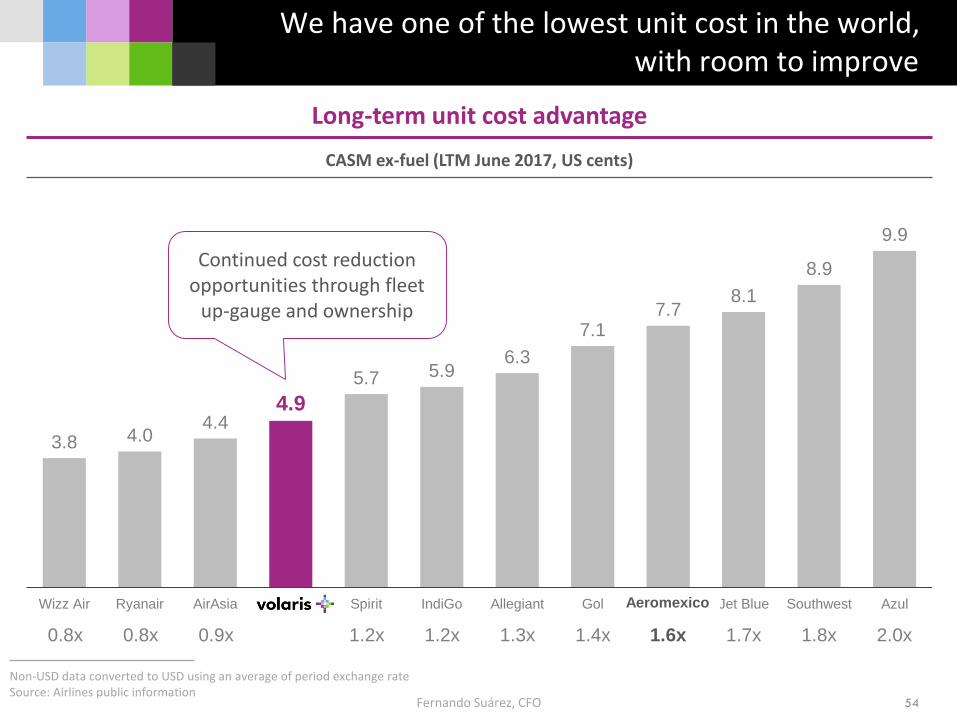
We have one of the lowest unit cost in the world, with room to improve
Non-USD data converted to USD using an average of period exchange rateSource: Airlines public information
54
Long-term unit cost advantage
CASM ex-fuel (LTM June 2017, US cents)
Fernando Suárez, CFO
3.8 4.04.4
4.9
5.7 5.96.3
7.17.7
8.1
8.9
9.9
Wizz Air Ryanair AirAsia Volaris Spirit IndiGo Allegiant Gol Aeromexico Jet Blue Southwest Azul
0.8x 2.0x1.8x1.7x1.6x1.4x1.3x0.9x0.8x 1.2x 1.2x
Continued cost reduction opportunities through fleet
up-gauge and ownership
Aeromexico
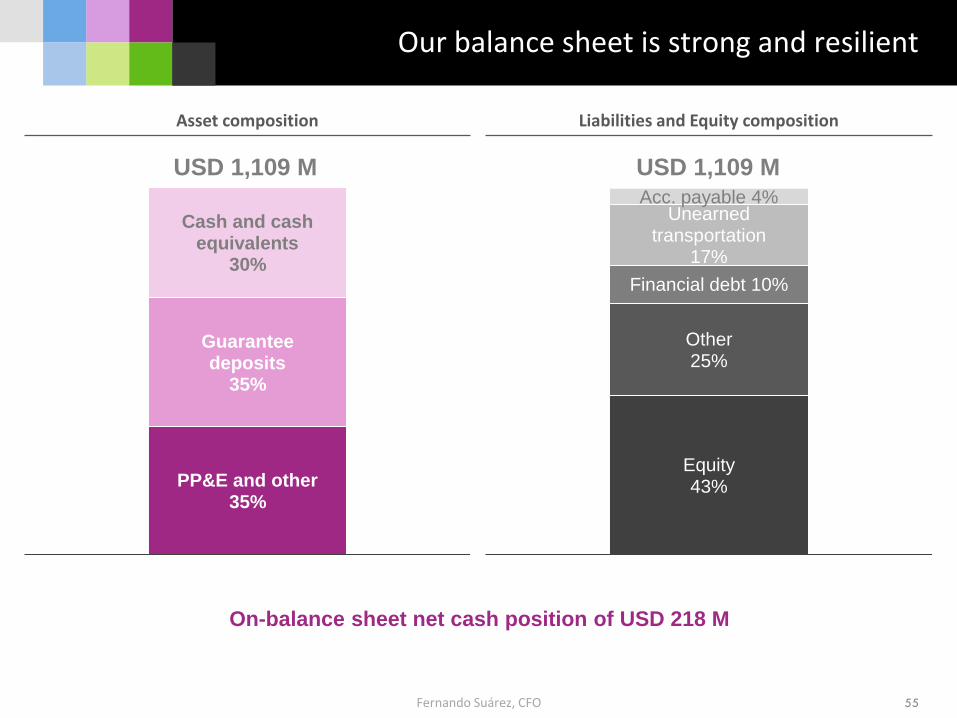
Equity43%
Other25%
Financial debt 10%
Unearnedtransportation
17%
Acc. payable 4%
PP&E and other35%
Guaranteedeposits
35%
Cash and cashequivalents
30%
Our balance sheet is strong and resilient
55
Asset composition Liabilities and Equity composition
Fernando Suárez, CFO
On-balance sheet net cash position of USD 218 M
USD 1,109 M USD 1,109 M
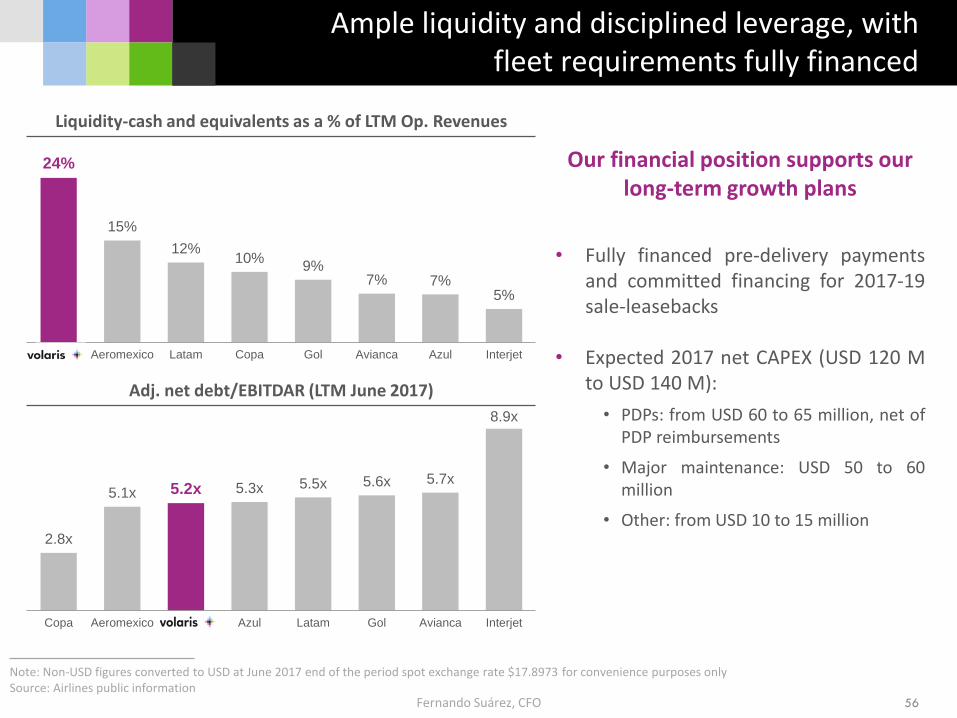
2.8x
5.1x 5.2x 5.3x 5.5x 5.6x 5.7x
8.9x
Copa Aeromexico Volaris Azul Latam Gol Avianca Interjet
24%
15%
12%10%
9%7% 7%
5%
Volaris Aeromexico Latam Copa Gol Avianca Azul Interjet
Adj. net debt/EBITDAR (LTM June 2017)
Liquidity-cash and equivalents as a % of LTM Op. Revenues
Ample liquidity and disciplined leverage, with fleet requirements fully financed
56
Note: Non-USD figures converted to USD at June 2017 end of the period spot exchange rate $17.8973 for convenience purposes onlySource: Airlines public information
Our financial position supports our long-term growth plans
• Fully financed pre-delivery paymentsand committed financing for 2017-19sale-leasebacks
• Expected 2017 net CAPEX (USD 120 Mto USD 140 M):
• PDPs: from USD 60 to 65 million, net ofPDP reimbursements
• Major maintenance: USD 50 to 60million
• Other: from USD 10 to 15 million
Fernando Suárez, CFO
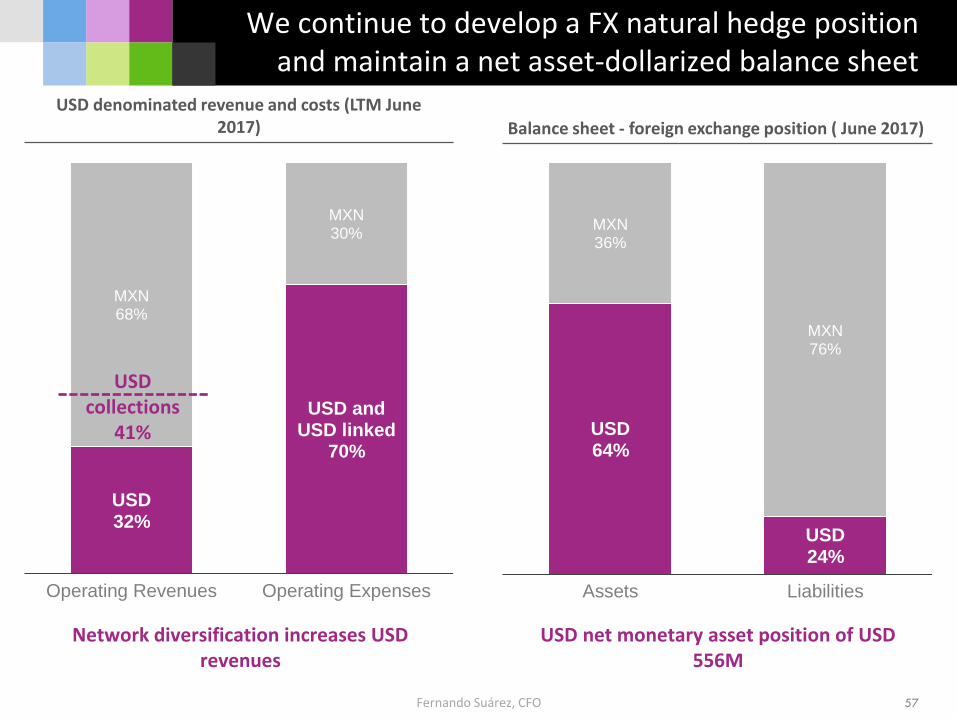
USD64%
USD 24%
MXN36%
MXN76%
Assets Liabilities
USD32%
USD andUSD linked
70%
MXN68%
MXN30%
Operating Revenues Operating Expenses
57
USD denominated revenue and costs (LTM June 2017) Balance sheet - foreign exchange position ( June 2017)
Network diversification increases USD revenues
Fernando Suárez, CFO
USD collections
41%
USD net monetary asset position of USD 556M
We continue to develop a FX natural hedge position and maintain a net asset-dollarized balance sheet
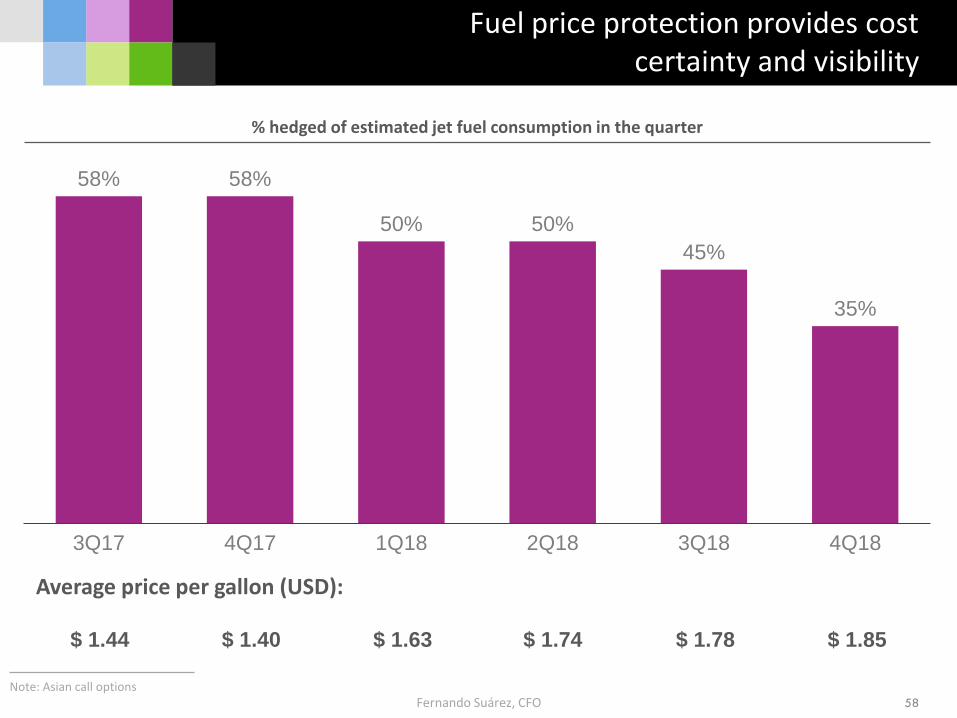
Fuel price protection provides costcertainty and visibility
58
Note: Asian call optionsFernando Suárez, CFO
58% 58%
50% 50%
45%
35%
3Q17 4Q17 1Q18 2Q18 3Q18 4Q18
$ 1.44 $ 1.40 $ 1.63 $ 1.74 $ 1.78 $ 1.85
Average price per gallon (USD):
% hedged of estimated jet fuel consumption in the quarter
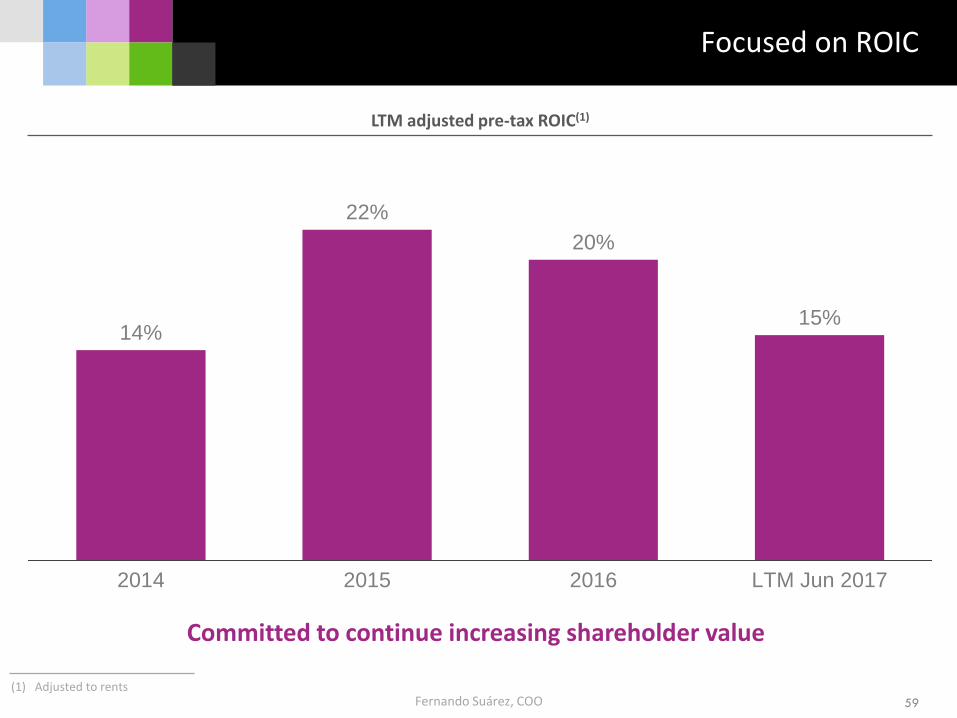
(1) Adjusted to rents
Committed to continue increasing shareholder value
LTM adjusted pre-tax ROIC(1)
Fernando Suárez, COO
Focused on ROIC
14%
22%
20%
15%
2014 2015 2016 LTM Jun 2017
59

Appendix
(1) Full year 2016 figures converted to USD at December end of the period spot exchange rate $20.6640 for convenience purposes only(2) 2Q 2017 figures converted to USD at June end of the period spot exchange rate $17.8973 for convenience purposes only(3) Audited financial information 2014A – 2016A
Apendix
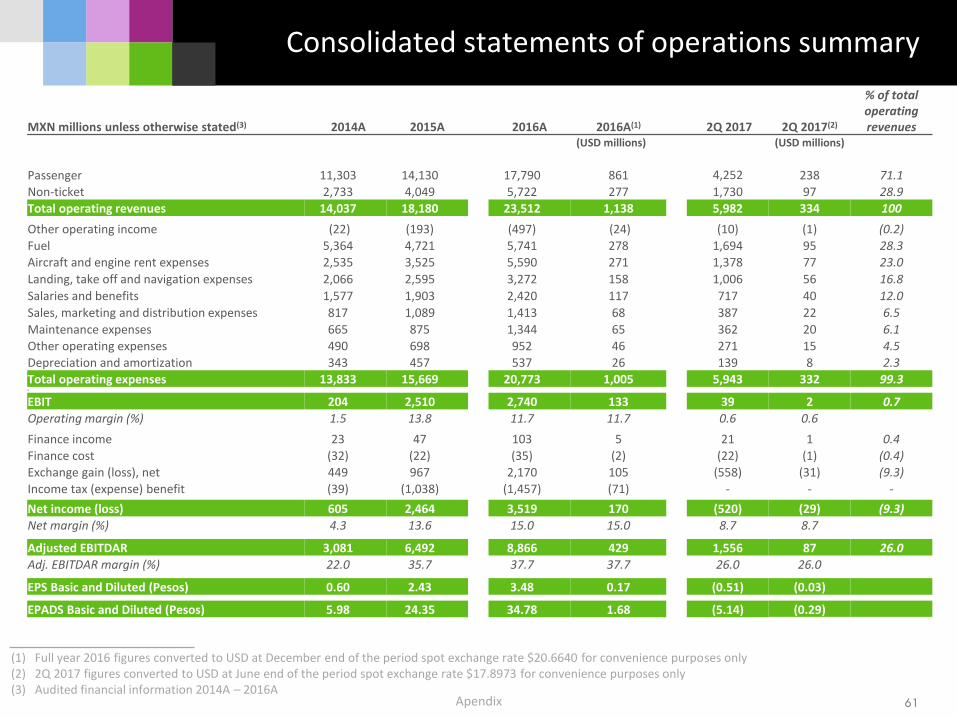
Consolidated statements of operations summary
61
MXN millions unless otherwise stated(3) 2014A 2015A 2016A 2016A(1) 2Q 2017 2Q 2017(2)
% of total operating revenues
(USD millions) (USD millions)
Passenger 11,303 14,130 17,790 861 4,252 238 71.1
Non-ticket 2,733 4,049 5,722 277 1,730 97 28.9
Total operating revenues 14,037 18,180 23,512 1,138 5,982 334 100
Other operating income (22) (193) (497) (24) (10) (1) (0.2)
Fuel 5,364 4,721 5,741 278 1,694 95 28.3
Aircraft and engine rent expenses 2,535 3,525 5,590 271 1,378 77 23.0
Landing, take off and navigation expenses 2,066 2,595 3,272 158 1,006 56 16.8
Salaries and benefits 1,577 1,903 2,420 117 717 40 12.0
Sales, marketing and distribution expenses 817 1,089 1,413 68 387 22 6.5
Maintenance expenses 665 875 1,344 65 362 20 6.1
Other operating expenses 490 698 952 46 271 15 4.5
Depreciation and amortization 343 457 537 26 139 8 2.3
Total operating expenses 13,833 15,669 20,773 1,005 5,943 332 99.36
EBIT 204 2,510 2,740 133 39 2 0.7
Operating margin (%) 1.5 13.8 11.7 11.7 0.6 0.6
Finance income 23 47 103 5 21 1 0.4
Finance cost (32) (22) (35) (2) (22) (1) (0.4)
Exchange gain (loss), net 449 967 2,170 105 (558) (31) (9.3)
Income tax (expense) benefit (39) (1,038) (1,457) (71) - - -
Net income (loss) 605 2,464 3,519 170 (520) (29) (9.3)
Net margin (%) 4.3 13.6 15.0 15.0 8.7 8.7
Adjusted EBITDAR 3,081 6,492 8,866 429 1,556 87 26.0
Adj. EBITDAR margin (%) 22.0 35.7 37.7 37.7 26.0 26.0
EPS Basic and Diluted (Pesos) 0.60 2.43 3.48 0.17 (0.51) (0.03)
EPADS Basic and Diluted (Pesos) 5.98 24.35 34.78 1.68 (5.14) (0.29)
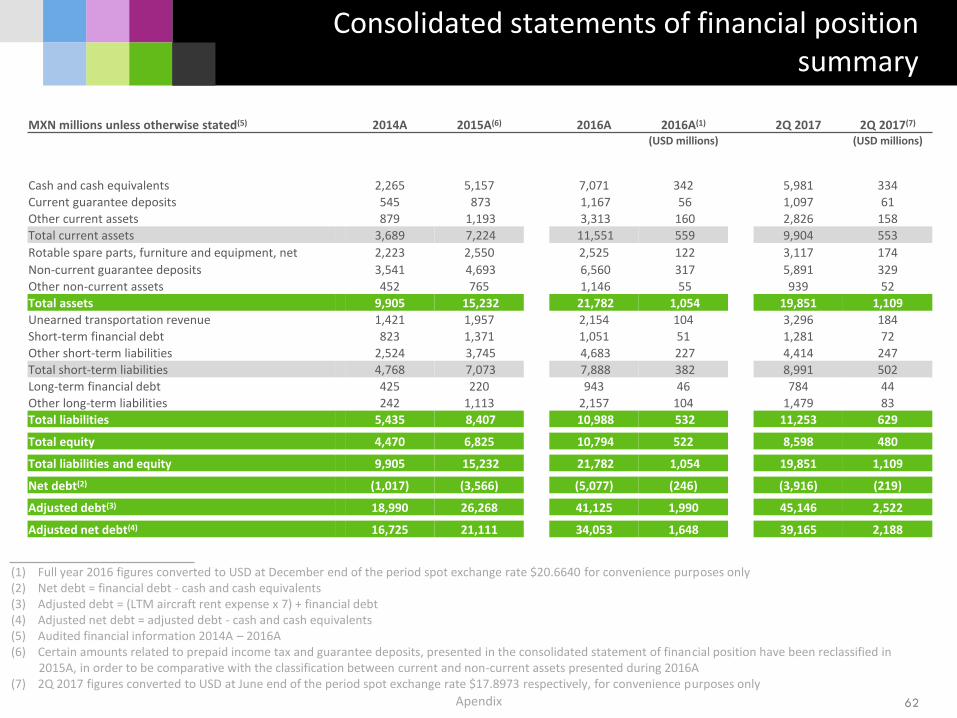
(1) Full year 2016 figures converted to USD at December end of the period spot exchange rate $20.6640 for convenience purposes only(2) Net debt = financial debt - cash and cash equivalents(3) Adjusted debt = (LTM aircraft rent expense x 7) + financial debt(4) Adjusted net debt = adjusted debt - cash and cash equivalents(5) Audited financial information 2014A – 2016A(6) Certain amounts related to prepaid income tax and guarantee deposits, presented in the consolidated statement of financial position have been reclassified in
2015A, in order to be comparative with the classification between current and non-current assets presented during 2016A(7) 2Q 2017 figures converted to USD at June end of the period spot exchange rate $17.8973 respectively, for convenience purposes only
Apendix
Consolidated statements of financial position summary
62
MXN millions unless otherwise stated(5) 2014A 2015A(6) 2016A 2016A(1) 2Q 2017 2Q 2017(7)
(USD millions) (USD millions)
Cash and cash equivalents 2,265 5,157 7,071 342 5,981 334
Current guarantee deposits 545 873 1,167 56 1,097 61
Other current assets 879 1,193 3,313 160 2,826 158
Total current assets 3,689 7,224 11,551 559 9,904 553
Rotable spare parts, furniture and equipment, net 2,223 2,550 2,525 122 3,117 174
Non-current guarantee deposits 3,541 4,693 6,560 317 5,891 329
Other non-current assets 452 765 1,146 55 939 52
Total assets 9,905 15,232 21,782 1,054 19,851 1,109
Unearned transportation revenue 1,421 1,957 2,154 104 3,296 184
Short-term financial debt 823 1,371 1,051 51 1,281 72
Other short-term liabilities 2,524 3,745 4,683 227 4,414 247
Total short-term liabilities 4,768 7,073 7,888 382 8,991 502
Long-term financial debt 425 220 943 46 784 44
Other long-term liabilities 242 1,113 2,157 104 1,479 83
Total liabilities 5,435 8,407 10,988 532 11,253 629
Total equity 4,470 6,825 10,794 522 8,598 480
Total liabilities and equity 9,905 15,232 21,782 1,054 19,851 1,109
Net debt(2) (1,017) (3,566) (5,077) (246) (3,916) (219)
Adjusted debt(3) 18,990 26,268 41,125 1,990 45,146 2,522
Adjusted net debt(4) 16,725 21,111 34,053 1,648 39,165 2,188
(1) Full year 2016 figures converted to USD at December end of the period spot exchange rate $20.6640 for convenience purposes only(2) 2Q 2017 figures converted to USD at June end of the period spot exchange rate $17.8973 for convenience purposes only(3) Audited financial information 2014A – 2016A
Apendix
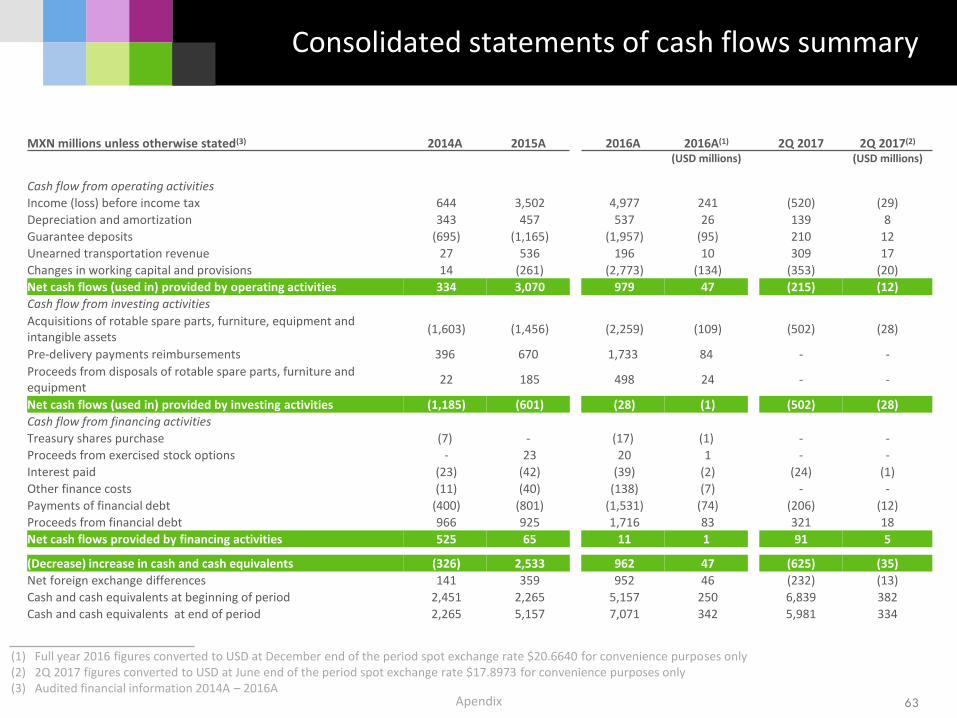
Consolidated statements of cash flows summary
63
MXN millions unless otherwise stated(3) 2014A 2015A 2016A 2016A(1) 2Q 2017 2Q 2017(2)
(USD millions) (USD millions)
Cash flow from operating activities
Income (loss) before income tax 644 3,502 4,977 241 (520) (29)
Depreciation and amortization 343 457 537 26 139 8
Guarantee deposits (695) (1,165) (1,957) (95) 210 12
Unearned transportation revenue 27 536 196 10 309 17
Changes in working capital and provisions 14 (261) (2,773) (134) (353) (20)
Net cash flows (used in) provided by operating activities 334 3,070 979 47 (215) (12)
Cash flow from investing activities
Acquisitions of rotable spare parts, furniture, equipment and intangible assets
(1,603) (1,456) (2,259) (109) (502) (28)
Pre-delivery payments reimbursements 396 670 1,733 84 - -
Proceeds from disposals of rotable spare parts, furniture and equipment
22 185 498 24 - -
Net cash flows (used in) provided by investing activities (1,185) (601) (28) (1) (502) (28)
Cash flow from financing activities
Treasury shares purchase (7) - (17) (1) - -
Proceeds from exercised stock options - 23 20 1 - -
Interest paid (23) (42) (39) (2) (24) (1)
Other finance costs (11) (40) (138) (7) - -
Payments of financial debt (400) (801) (1,531) (74) (206) (12)
Proceeds from financial debt 966 925 1,716 83 321 18
Net cash flows provided by financing activities 525 65 11 1 91 5
(Decrease) increase in cash and cash equivalents (326) 2,533 962 47 (625) (35)
Net foreign exchange differences 141 359 952 46 (232) (13)
Cash and cash equivalents at beginning of period 2,451 2,265 5,157 250 6,839 382
Cash and cash equivalents at end of period 2,265 5,157 7,071 342 5,981 334
(1) Full year 2016 figures converted to USD at December end of the period spot exchange rate $20.6640 for convenience purposes only(2) 2Q 2017 figures converted to USD at June end of the period spot exchange rate $17.8973 for convenience purposes only(3) Audited financial information 2014A – 2016A
Apendix
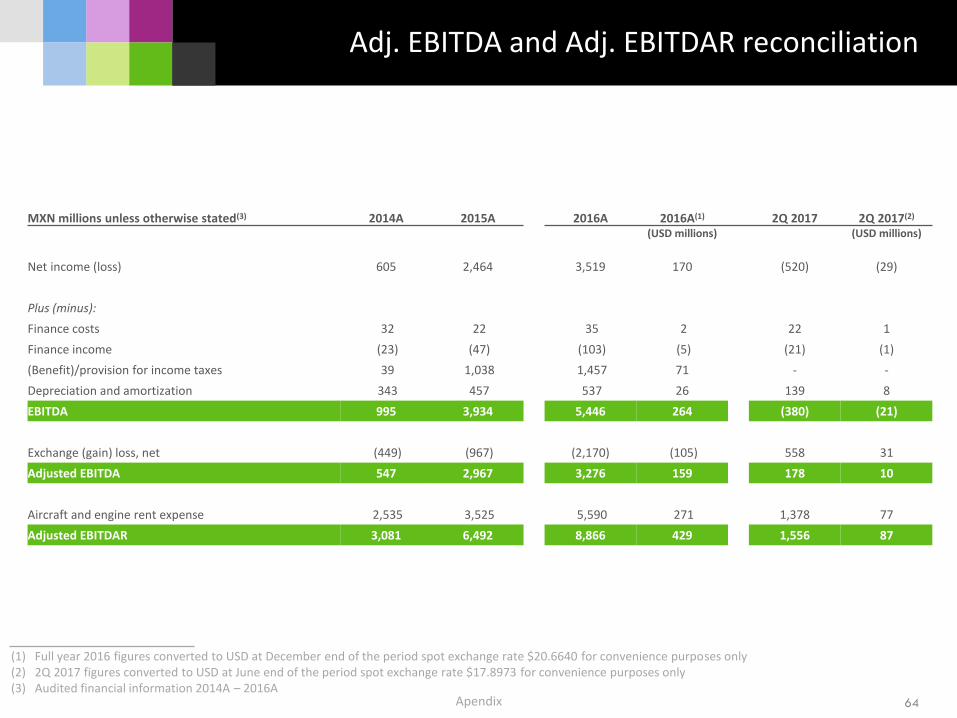
Adj. EBITDA and Adj. EBITDAR reconciliation
64
MXN millions unless otherwise stated(3) 2014A 2015A 2016A 2016A(1) 2Q 2017 2Q 2017(2)
(USD millions) (USD millions)
Net income (loss) 605 2,464 3,519 170 (520) (29)
Plus (minus):
Finance costs 32 22 35 2 22 1
Finance income (23) (47) (103) (5) (21) (1)
(Benefit)/provision for income taxes 39 1,038 1,457 71 - -
Depreciation and amortization 343 457 537 26 139 8
EBITDA 995 3,934 5,446 264 (380) (21)
Exchange (gain) loss, net (449) (967) (2,170) (105) 558 31
Adjusted EBITDA 547 2,967 3,276 159 178 10
Aircraft and engine rent expense 2,535 3,525 5,590 271 1,378 77
Adjusted EBITDAR 3,081 6,492 8,866 429 1,556 87