volatility, nonstandard employment, and … nonstandard employment, and productivity: an empirical...
TRANSCRIPT

DPRIETI Discussion Paper Series 10-E-025
Volatility, Nonstandard Employment, and Productivity:An empirical analysis using firm-level data
MORIKAWA MasayukiRIETI
The Research Institute of Economy, Trade and Industryhttp://www.rieti.go.jp/en/

- 1 -
RIETI Discussion Paper Series 10-E-025
Volatility, Nonstandard Employment, and Productivity: An Empirical Analysis Using
Firm-Level Data
Masayuki Morikawa (RIETI)
April 2010
(Abstract)
This paper empirically analyzes the relationship among the volatility of sales, nonstandard
employment, and firm productivity by using panel data of more than 8,000 Japanese firms
from 1994 to 2006. Globalization and innovation are highlighted as the forces that increase the
volatility of firm performance, which, in turn, increases the demand for flexible labor forces.
After controlling for various observable firm characteristics, the volatility of a firm’s sales
growth is a significant determinant of the ratio of nonstandard employees. This relationship is
stronger for manufacturing firms. Among the highly volatile firms, the ratio of nonstandard
employees has a positive relationship with productivity. These results suggest that the
desirable policy mix for the economy is a combination of the provision of sufficient safety net
and training opportunities for nonstandard workers and the enactment of reasonable laws and
regulations that enable firms to adjust labor input flexibly.
Key words:nonstandard worker, volatility, productivity
JEL classifications:J23, J69, D24
The author would like to thank Kotaro Tsuru, Kazuhiko Odaki, Masahiko Yoshida, Tatsuya Shinkawa, and the seminar participants at RIETI, for their helpful comments and suggestions.
RIETI Discussion Papers Series aims at widely disseminating research results in the form of professional papers, thereby stimulating lively discussion. The views expressed in the papers are solely those of the author(s), and do not present those of the Research Institute of Economy, Trade and Industry.

- 2 -
1. Introduction
In recent years, the number of nonstandard workers, such as part-time, contract, and
temporary agency workers (workers dispatched from temporary labor agencies), has been
growing rapidly. An increase in the female labor participation rate, labor market reforms, and
prolonged stagnation of the economy, among others, are the factors behind this trend.
According to the Labor Force Survey, the number of part-time workers was 8.2 million in
2008, up from 5.1 million in 1990. The number of temporary agency workers was 1.4 million
in 2008, an almost fivefold increase from 0.3 million in 1999. However, manufacturing firms’
sales dropped drastically in late 2008, hit by the global financial crisis, and the withdrawals of
job offers for temporary agency workers became a political issue in Japan. Currently, a
revision of the Worker Dispatching Law to make the regulations more stringent is under way.
An increase in the number of nonstandard employees is a common trend among advanced
economies. According to OECD statistics, the ratios of part-time and temporary workers to the
OECD total are 15.6% and 12.3%, respectively. A number of empirical studies in the field of
labor economics focus on nonstandard workers and analyze, for example, wage penalty of
these workers by estimating wage functions, and whether or not the experience of nonstandard
work is a stepping stone for better labor market outcomes, by using individual-level
longitudinal data. Although the rapid increase in nonstandard workers is the result of factors
related to the supply and demand of labor as well as institutional changes, studies from the
viewpoint of employers’ labor demand are relatively scarce. Firms are faced with
globalization, rapid technological innovations, shortened product life cycle, and market
deregulation, all of which may contribute to instability in performance. Instability and
uncertainty in firm performance compel firms to adjust their labor input flexibly, increasing
the demand for nonstandard workers. In other words, the productivity of firms facing highly
volatile sales will fall if they are unable to adjust labor input quickly in accordance with the
change in output.
Against this background, this paper empirically analyzes the relationship between the
volatility of sales, nonstandard employment, and firm productivity using 13 years’ panel data
from the Basic Survey of Japanese Business Structure and Activities spanning the period 1994
to 2006. The Survey collects information on the number of “part-time workers” and “contract
and daily workers” from its commencement. From the 2001 Survey, which collects data on
firms as of the end of the fiscal year 2000, the item “temporary agency workers” is also added.
As a result, comprehensive analysis of nonstandard workers, including temporary agency

- 3 -
workers, has become possible. Specifically, this paper determines whether the ratio of
nonstandard workers is related to the volatility of firms’ sales, controlling for observable firm
characteristics. The estimation is conducted for part-time workers, contract and daily workers,
and temporary agency workers separately and nonstandard workers as a whole. Then, we
estimate the effect of the use of nonstandard workers on firm productivity, focusing on the
relationship with firm-level volatility.
According to our analysis, the jobs of temporary agency workers and contract workers are
very unstable. The higher the volatility of firms’ sales, the greater their dependence on
nonstandard workers. When firms’ sales volatility is one standard deviation larger, the ratio
of nonstandard workers is about 0.7% point higher. This relationship is clear for agency
temporaries and weaker for part-time workers. By industry, this relationship is stronger for
manufacturing firms than for non-manufacturing firms. Among highly volatile firms, the ratio
of nonstandard employees has a significant positive relationship with total factor productivity
(TFP). For a firm with volatility of larger than one standard deviation, a 10% higher
nonstandard worker ratio is related to around a 1% point higher TFP. These results suggest
that it is inevitable for firms to adjust their labor input quickly, under the pressure of increasing
output volatility, and that the desirable policy mix for the economy is a combination of the
provision of sufficient safety net and training opportunities for nonstandard workers on the one
hand and the enactment of reasonable laws and regulations that enable firms to adjust labor
input flexibly on the other hand.
The rest of this paper is organized as follows. Section 2 briefly reviews relevant past studies.
Section 3 explains the data used and the method of analysis. Section 4 reports and interprets
the results, and Section 5 concludes the study with policy implications.
2. Literature review
Recent empirical studies in the U.S. indicate an upward trend in firm volatility despite the
declining volatility of GDP (see, for example, Comin and Mulani, 2006, and Comin and
Philippon, 2006). 1 Globalization, rapid technological innovations, shortened product life
cycle, and market deregulation are the possible reasons for increased firm-level volatility. For
example, di Giovanni and Levchenko (2009) show that sectors more open to international
trade are more volatile, although the analysis uses cross-country industry-level data. Bergin et
1 On the other hand, Davis et al. (2007) found that the rise in volatility is confined to publicly
traded firms but volatility is declining among privately held firms.
- 4 -
al. (2009) present evidence that offshore production by U.S. firms is related to the volatility of
employment in Mexico. Using U.S. industry-level data, Brynjolfsson et al. (2007) argue that
the IT intensity of industry is related to increase in volatility.
Increasing firm volatility, in turn, inevitably affects derived demand—labor demand.
Fabbri et al. (2003) and Barba et al. (2003), for example, present evidence that labor demand
of multinational firms has become more elastic recently. Klein et al. (2003) indicate that real
exchange rate movements significantly affect gross job flows in U.S. manufacturing. Comin et
al. (2009) show that rising turbulence in the sales of large U.S. firms has raised their workers’
wage volatility.
Under the existence of labor adjustment costs, in order to attain optimal levels of labor
input, it would be rational behavior for firms to increase the number of workers whose
adjustment cost is low. Segal and Sullivan (1997), who investigate the reason for the
increasing number of temporary agency workers, assert that firms’ increasing need for
flexibility is an important factor behind the increase in the number of temporary agency
workers. Houseman (2001), who investigates the reasons for the increase in the number of
nonstandard employees by a telephone survey of U.S. establishments, reports that the need to
cope with workload fluctuations and staff absences is the main reason for the use of
nonstandard employees. According to her estimation results, industry seasonality and
cyclicality are positively related to the use of agency temporaries. Ono and Sullivan (2006),
who use 1998 and 1999 manufacturing plant-level data (the Plant Capacity Utilization Survey)
for the U.S., examine the relationship between plants’ use of temporary workers and output
fluctuations. Their results indicate that plants with higher output uncertainty and falling
expected output tend to use more temporary production workers. This study is most closely
related to the present paper. However, their study does not deal with the relationship between
the use of temporary workers and productivity, and their sample is limited to manufacturing
industry. Vidal and Tigges (2009) also analyze the determinants of using temporary workers in
U.S. manufacturing plants. Their data come from a telephone survey of Wisconsin
manufacturing plants in 1998, and several estimations are conducted on the use of temporary
employees. The results indicate that industry’s seasonality is positively related to the use of
temporary employees. On the other hand, Gramm and Schnell (2001) reported that the effects
of output cyclicality and seasonality are insignificant for the use of flexible staffing
arrangements and temporary workers. However, their data are from a survey of establishments
located in Alabama, and the effective sample size is less than 100. Most of these studies
suggest that output volatility is related to the use of nonstandard workers, but the sample size
is generally small or the survey considers only some type of nonstandard workers. They do not
analyze the difference between manufacturing and service industries.

- 5 -
If highly volatile firms cannot adjust their labor force quickly when exogenous shocks
affect the demand for their products or services, the firms’ labor input will diverge from the
profit-maximizing level, reducing their productivity. In other words, the higher the volatility
of the output, the larger the gains from using nonstandard workers on their productivity.
Cunat and Melitz (2007), who theoretically and empirically study the link between volatility,
labor market flexibility, and comparative advantage, show that countries with more flexible
labor markets specialize in sectors with higher volatility. Several studies, such as Autor et al.
(2007) and Lafontaine and Sivadasan (2009), show that stringent labor market regulations
negatively affect firm-level productivity. These studies as well as this paper are motivated by
similar considerations, but to our knowledge, no previous study analyzes the relationship
among firm volatility, nonstandard employment, and productivity.2
To summarize, even though the rapid increase in the number of nonstandard workers
becomes an important policy agenda, the relationship between firm volatility and
nonstandard employment has not yet been analyzed extensively. Furthermore, studies on the
link between nonstandard employment and productivity in the context of firm volatility are
almost nonexistent.
3. Data and method
The data used in this paper come from the Basic Survey of Japanese Business Structure and
Activities (Ministry of Economy, Trade, and Industry). The Survey, an annual statistics begun
in 1991, accumulates representative statistics on Japanese firms with 50 or more regular
employees, including those engaged in mining, manufacturing, electricity and gas, wholesale,
retail, and several service industries. The purpose of this survey is to capture a comprehensive
picture of Japanese firms, including their basic financial information—sales, costs, profits,
book value of capital, number of employees, etc.—composition of businesses, R&D activities,
IT usage, and foreign direct investments. As the sample firms are coded by using perpetual
numbers, it is possible to construct a firm-level longitudinal data set. This paper constructs a
13-year panel data set from the Survey, from 1994 to 2006.3
2 Some studies analyze the relationship between the use of nonstandard employment and firm productivity. Boeri and Garibaldi (2007) and Sanchez and Toharia (2000), for example, report negative relationships in Italian and Spanish firms, respectively. 3 The Basic Survey of Japanese Business Structure and Activities in 2007, for example, collects information on flow figures during the fiscal year 2006 (normally from April to March in Japan) and stock figures at the end of the fiscal year 2006. For simplicity, we express the data as “2006” in this paper.

- 6 -
As mentioned in the introduction, the number of “temporary agency workers” is added as a
survey item from the 2001 Survey. As a result, comprehensive analysis on nonstandard
workers, including part-time workers, contract and daily workers, and temporary agency
workers, is possible. In the Survey, the number of “regular workers” comprises the total
number of paid directors and regularly employed persons. The term “regular employees” is
defined as persons, regardless of their titles as full-time or part-time, employed under a
contract longer than one month, or persons employed for 18 days or more in two months prior
to the end of the latest fiscal year. That is, “regular workers” include both full-time and
part-time workers. “Part-timers” are regular workers whose scheduled daily working hours or
working days in a week are less than those of full-time workers. In this paper, the number of
full-time workers is calculated by subtracting the number of part-timers from the total number
of regular workers. It should be noted that “full-time workers” include workers who are not
under long-term employment and that some of the “part-time workers” include employees
under long-term employment. “Other workers”—contract and daily workers—are persons who
are employed for a period of up to one month, or those who are brought in on a daily basis.
Finally, “temporary agency workers” are persons who are employed by a worker-dispatching
business operator and are engaged in an accepting company’s operations under its supervision
and command, based on a contract between the accepting company and the worker-dispatching
business operator. “Other workers” and “temporary agency workers” are not included in the
total number of regular workers.
Although more than 25,000 firms are surveyed every year, there are many entries and exits
in the Survey. Since we are interested in calculating time-series volatility at firm level, we
restrict the sample to firms that exist through the 13 years and construct a balanced panel.
After removing a very small number of outliers, the size of the final sample is 8,716.4
Table 1 shows the number of workers by type of employment among the sample firms. In
2006, full-time, part-time, contract and daily, and temporary agency workers numbered
1,642,000, 271,000, 24,000, and 135,000, respectively. Full-time workers are decreasing in
number and part-time workers increasing. The number of temporary agency workers has
increased rapidly from 47,000 in 2000 to 135,000 in 2006.
By using the data set, this paper first presents some descriptive characteristics on the job
flows and the labor adjustment of nonstandard employees. The gross job creation rate (GJCR),
gross job destruction rate (GJDR), and gross job reallocation rate (GJRR) for employment type
j of firm i are defined as follows (Davis et al., 1996; Davis and Haltiwanger, 1999):
4 We removed six firms in which the number of part-time workers was larger than that of regular workers at some point in time during the sample period. These were possibly caused by reporting error. In addition one firm in which the number of contract and daily workers is extremely large (40
- 7 -
GJCR = Σi [(Eijt − Eijt-1)/(Eijt + Eijt-1)/2] if (Eijt − Eijt-1) > 0
GJDR = Σi [(Eijt − Eijt-1)/(Eijt + Eijt-1)/2] if (Eijt − Eijt-1) < 0
GJRR = GJCR – GJDR
We compare these job flow measures by type of employment to see the degree of instability
for nonstandard jobs.
Next, we calculate the elasticity of labor adjustment with respect to changes in firm sales by
types of employment. The elasticity (β1) is calculated simply as follows:
ln(Eit+n/Eit) = β0 + β1 ln(Yit+n/Yit) + β2 ln(Wit+n/Wit) + ∑y βy year dummies + ∑i βi industry dummies+uit [1]
t = 1994–2006
where Eit, Yit, and Wit denote the number of employees, firm sales, and average wages of firm i
at year t.
Then, we analyze the relationship between firm volatility, ratio of nonstandard workers,
and TFP. As for the measure of firm volatility, we follow representative past studies
measuring firm volatility (Comin and Mulani, 2006; Davis et al., 2007) and calculate standard
deviations of annual sales growth through the sample period.5 Specifically, sales growth
(ΔYit), average sales growth (ΔYi), and the standard deviation (σi) of firm i in year t can be
expressed as follows. Since the period of analysis is between 1994 and 2006, T=12 in this
paper.
ΔYit = (Yit − Yit-1)/[(Yit + Yit-1)/2]
ΔYi = (1/T)ΣtΔYit
σi = [(1/T)Σt(ΔYit − ΔYi)2]1/2
The reason (Yit + Yit-1)/2 is used as the denominator is that expansion and contraction are
treated symmetrically, and the result thus obtained is superior to the conventional growth
measure, as pointed out in job flow studies (Davis et al., 1996; Davis and Haltiwanger, 1999).
This measure of sales volatility (σi) is used as the explanatory variable in regressions to
explain the ratio of nonstandard workers to total regular workers. Dependent variables are
ratios of nonstandard workers—(1) part-time, (2) contract and daily, (3) temporary agency,
and (4) total nonstandard workers (the sum of 1 to 3 above)—to total regular workers. Firm
times as large as regular worker) is removed. 5 Standard deviation of sales level through the sample period is another possible volatility measure, but the measure takes a large value when sales grow (or shrink) at a constant rate.

- 8 -
size (size: log of the number of regular workers) and age (age), the ratios of business
composition (composition), year dummies, and 3-digit industry dummies are used as control
variables. Among these controls, the ratios of business composition (composition) are the
number of workers in (1) administration at the head office (administration), (2) the
information processing activity (information), (3) research and development (r&d), (4) the
manufacturing activity (manufacturing), and (5) the commerce activity (commerce). These
figures can be calculated from the data on the number of workers by business organization
of firms in the Basic Survey of Japanese Business Structure and Activities. Past studies on the
manufacturing sector often use non-production (or blue-collar) workers as an important
variable, but this is inappropriate for analyzing firms operating in the non-manufacturing
sector. Therefore, we construct ratios of workers that may closely reflect the use of
nonstandard workers. Year dummies are included to control for the effects of business cycles
on the labor market, as well as the changes in labor market rules and regulations.
The basic equation to be estimated can be summarized as follows:
nonstandardit = β0 + β1σi + β2 administrationit + β3 informationit + β4 r&dit
+ β5 manufacturingit + β6 commerceit + β7 sizeit + β8 ageit
+ ∑yβy year dummies + ∑i βi industry dummies + uit [2]
t = 1994–2006 for part-timers and contract and daily workers
t = 2000–2006 for temporary agency workers an total nonstandard workers
We expect the coefficient of firm volatility (β1) to be positive. Estimation is conducted by
pooled OLS. In estimating (1) part-timers and (2) contract and daily workers, we use pooled
data from 1994 to 2006. Estimations for (3) temporary agency workers and (4) total
nonstandard workers are carried out by pooled data from 2000 to 2006. However, as explained
earlier, the firm-level volatility measure (σi) is calculated from annual sales from 1994 through
2006 for all estimations.
Next, we examine the relationship among firm volatility, use of nonstandard workers, and
the firm-level TFP.6 The dependent variable here is the cost-share-based TFP index number at
the firm level, which is calculated in a nonparametric manner that uses a hypothetical
representative firm as the reference. The input and output of a hypothetical representative firm
are calculated as the geometric means of the input and output of all firms, and the cost shares
of labor and capital are calculated as arithmetic means. The TFP for each firm is calculated
6 We conduct the same regressions by using labor productivity as dependent variable, but the results are essentially the same as the TFP-based results. In this paper, we do not report labor productivity results.
- 9 -
relative to the hypothetical representative firm. The formula for calculating the TFP level of
firm i in year t is expressed as follows:
lnTFPit = (lnVit − lnVt) − (1/2)Σj(sjit + sj
t)(lnXjit − lnXj
t)
+ (lnVt − lnV0) − (1/2)Σj(sjt + sj
0)(lnXjt − lnXj
0)
where Vit denotes the value added of firm i at year t, Xjit the input of factor j (capital and labor)
of firm i at year t, and sjit the cost share of input j. The italics imply average values.
The index number TFP is applied to ensure cross-section and time-series comparability of
firm-level productivity and to avoid problems of using restrictive functional forms. This
procedure was developed by Caves et al. (1982) and is becoming popular in recent
productivity studies (Nishimura et al., 2005; Fukao and Kwon, 2006; Morikawa, 2010, among
others. Syverson, 2010, presents a good survey on this TFP measurement issue). The data used
for calculating TFP are value added, capital (total assets), labor (total hours), and cost of
shares of capital and labor. Value added is the sum of operating profits, rent, wage,
depreciation, and tax paid. Industry-level deflators to make real values are taken from the
National Accounts. Explanatory variables are firm size (size) and age (age), log of average
wage (lnwage), ratios of nonstandard workers—(1) part-timers (part), (2) contract and daily
workers (contract), (3) temporary agency workers (temp), and (4) nonstandard workers as a
whole (nonstandard)—to regular workers, year dummies, and 3-digit industry dummies. Firm
size and age, industry, and year dummies are ordinary controls. Average wage is a proxy for
the quality of workers, which generally has a high correlation with productivity. 7 To
summarize, the equation to be estimated is as follows:
lnTFPit = β0 + β1 sizeit + β2 ageit + β3 lnwageit + β4 nonstandardit
+ ∑y βy year dummies + ∑i βi industry dummies + uit [3]
We divide the sample into (1) high-volatility (volatility above the sample median) and (2)
low-volatility (volatility below the sample median) firms and compare the coefficients of the
ratio of nonstandard workers (β4). We expect the size of this coefficient to be larger for
high-volatility firms.
In addition, we estimate the equation by including the interaction terms of sales volatility
and the ratio of nonstandard workers, instead of dividing the sample firms. In this
specification, we expect the coefficients of the interaction term (β4) to be positive.
7 Average wage is the total wage paid divided by the number of regular employees.

- 10 -
Specifically, the equation can be written as follows:
lnTFPit = β0 + β1 sizeit + β2 ageit + β3 wageit + β4 volatility * nonstandard
+ ∑y βy year dummies + ∑i βi industry dummies + uit [4]
It should be noted that the ratio of nonstandard workers (therefore, the interaction term in
equation [3]) is endogenous and that the OLS results may be biased. Unfortunately,
however, it is difficult to find an appropriate instrument that affects the ratio of nonstandard
workers but is independent of the error term (uit). To address this possible endogeneity bias,
we use the interaction terms of firm volatility and the ratios of business composition
(volatility*administration, volatility*information, volatility*r&d, volatility*manufacturing,
and volatility*commerce) as instruments and estimate the equation by two-stage least
squares (2SLS), although the instruments are not perfect.8
4. Results
4.1 Job flows and labor adjustment of nonstandard workers
Before presenting regression results, it is informative to see some statistical characteristics
on job flows and the elasticity of labor adjustment for nonstandard employees. Table 2 shows
the gross job creation rate (GJCR), gross job destruction rate (GJDR), and gross job
reallocation rate (GJRR) of the sample firms by type of employment. The annual GJRRs for
contract and daily jobs and temporary agency jobs are about 15% or more, which is seven to
nine times larger than that of full-time jobs (2%). The GJRR of part-time jobs is about 7%—at
the middle of temporary agency jobs and full-time jobs. It is obvious that the jobs of temporary
agency workers and contract workers are very unstable.
Then, table 3 indicates the elasticity of employment changes by type of employment with
respect to the change in firm sales (equation [1]). The estimated elasticity is 0.224 for full-time
workers, 0.323 for part-time workers, and 0.521 for temporary agency workers. The result for
contract and daily workers is statistically insignificant and is not reported in this table. When
the elasticity is calculated at an interval of three to five years, the estimated elasticity becomes
larger irrespective of the type of employment (see columns 2 and 3), but the difference in
8 The interaction term is a natural instrument for an interaction term that has an endogenous variable (see Wooldridge, 2002).

- 11 -
one-year elasticity is larger for full-time workers than nonstandard workers. These figures
confirm a general perception that nonstandard workers, especially temporary agency workers,
are used for the adjustment of firms’ labor input to cope with short-term output changes, which
is consistent with the rapid reduction of temporary agency workers just after the global
financial crisis in 2008.
4.2 Volatility and nonstandard employment
Table 4 presents regression results for equation [2], which estimates the relationship
between firm volatility and the ratio of nonstandard employment. The coefficients for firm
volatility are positive and significant for all types of nonstandard workers with the exception
of part-time workers. The coefficient is larger for the ratio of temporary agency workers. This
is consistent with the fact described in the subsection (1) that the gross job reallocation rate
and the labor adjustment elasticity are both smaller for part-time workers and larger for
temporary agency workers. This suggests that part-time jobs are relatively similar to full-time
jobs and different from other types of nonstandard jobs. Analyzing nonstandard workers as a
whole may mask important differences among the types.
Table 5 assesses the quantitative magnitudes of the estimated coefficients. Column 2
indicates that a larger volatility of one standard deviation (0.047) corresponds to a 0.7% point
higher nonstandard worker ratio. By type of employment, the figure for temporary agency
workers is 0.6% point. Column 4 converts the figures into ratios to the total number of workers
by employment type by using the ratio of each worker type as the denominator. A firm-level
volatility of one standard deviation corresponds to about 5% more nonstandard workers. These
results indicate that firms with higher sales volatility depend on nonstandard workers,
especially temporary agency workers, and that the magnitude is economically significant.
Large firms tend to use more nonstandard workers, among other explanatory variables, with
other factors controlled for. The coefficients for the ratio of administration, information, and
R&D workers are generally negative and significant for part-timers and contract workers,
but positive for temporary agency workers.
When the estimation is done by splitting the sample into manufacturing and
non-manufacturing firms, the volatility coefficient is larger for manufacturing firms (see table
6). The volatility of sales at the sample mean (shown in the last row) is higher for
manufacturing (0.069) than non-manufacturing firms (0.058). That is, the volatility itself and

- 12 -
its effect on the use of nonstandard employment are both higher for manufacturing firms.
Although the ratio of nonstandard employment is generally higher in the service sector
compared to the manufacturing sector, the relationship between sales volatility and the ratio of
nonstandard employment is stronger in the manufacturing sector. A possible reason for this
difference is that manufacturing firms face fierce competition with foreign firms, which forces
them to adjust labor input quickly.
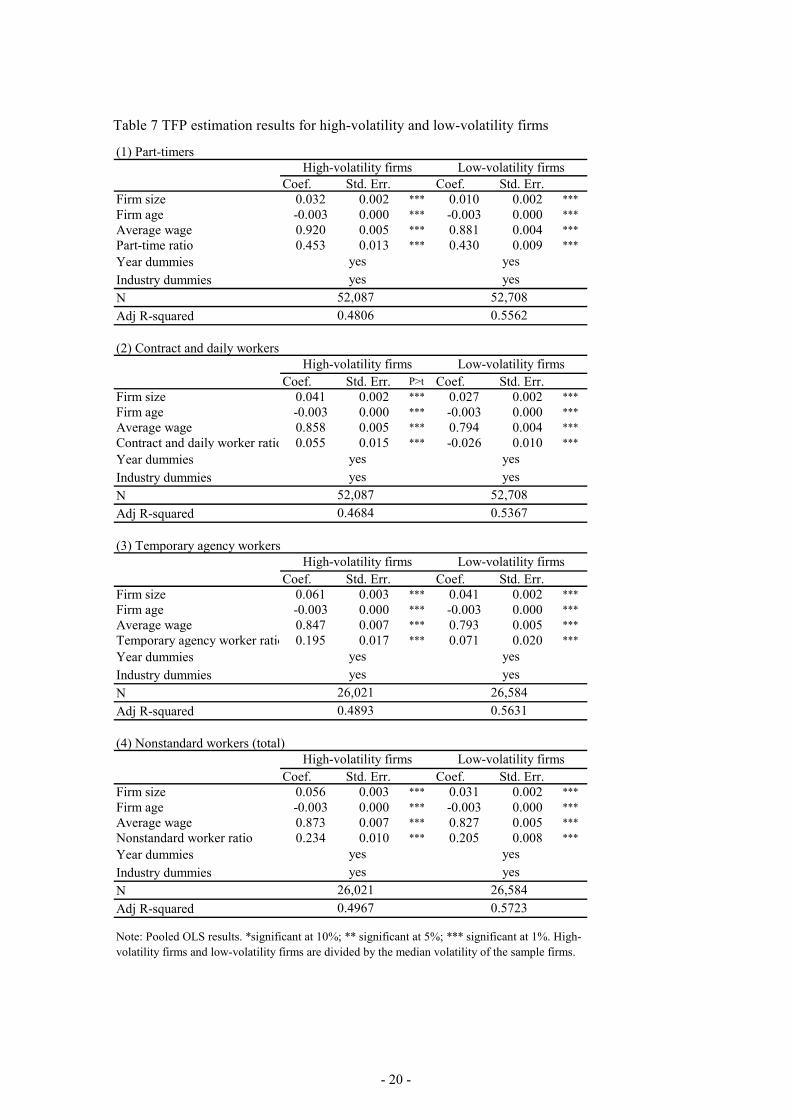
4.3 Nonstandard workers and productivity
In this subsection, we report regression results for equations [3] and [4] on the relationship
between the use of nonstandard workers and the TFP. The results for equation [3] are
presented in table 7. As discussed in the previous section, the sample is divided into
high-volatility and low-volatility firms, based on the sample median of the volatility measure
(σ). The coefficients for the ratio of nonstandard workers are positive and highly significant
for all estimations. However, what is of interest here is the difference between high-volatility
and low-volatility firms.
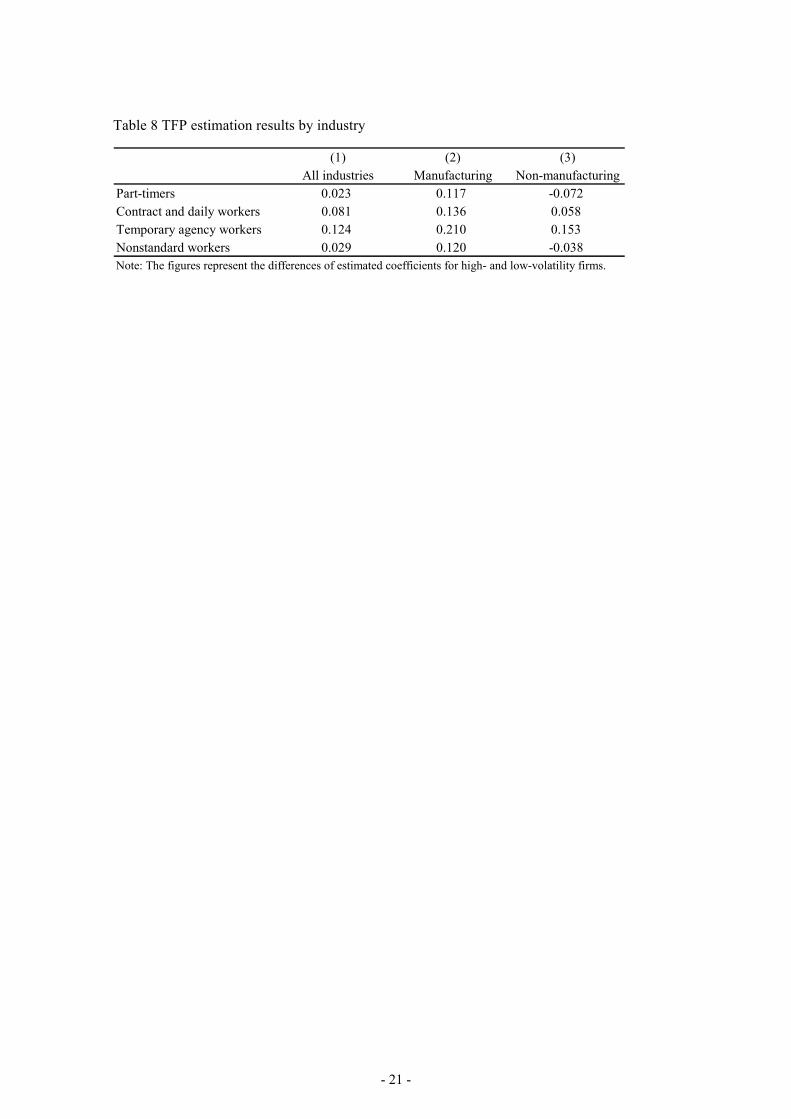
Table 8 summarizes the differences of estimated coefficients for the entire sample and by
industry. With firm size, firm age, average wages, year, and industry controlled for, the
coefficients of nonstandard workers are larger for high-volatility firms. The difference is
especially large for temporary agency workers. To translate the magnitudes into percentage
terms, a 10% increase in the ratio of nonstandard workers is related to a 0.3% point higher TFP
in high-volatility than low-volatility firms. By type of workers, the figure is large for the ratio
of temporary agency workers (1.3% point) and small for that of part-time workers (0.2%
point). By industry, this figure is larger for manufacturing than non-manufacturing firms
(columns 2 and 3). These results suggest that the productivity performance of volatile firms,
especially in the manufacturing sector, significantly depends on how nonstandard workers are
utilized.
Finally, table 9 presents the estimation results of equation [4], which do not categorize the
sample firms by their volatility. What is of interest here are the coefficients for the interaction
terms of firm volatility and the ratio of nonstandard workers. According to OLS estimations,
the coefficients of the interaction terms are positive and highly significant for all types of
nonstandard workers (column 1 of table 9). The result confirms the previously mentioned
findings, and the quantitative magnitude is nontrivial. For a firm with one standard deviation

- 13 -
higher volatility, a 10% higher nonstandard worker ratio is related to a 1.1% point higher
TFP. By type of employment, this figure is 1.6% point for part-timers and 1.1% point for
temporary agency workers (see table 10). Generally, we do not find large differences
between manufacturing and non-manufacturing firms with regard to this specification (see
columns 2 and 3 of table 10).
Column 2 of table 9 indicates 2SLS results, which use the interaction terms of firm
volatility and the five variables on business composition (volatility*administration,
volatility*information, volatility*r&d, volatility*manufacturing, and volatility*commerce) as
instruments. The coefficients for the interaction terms of firm volatility and the ratio of
nonstandard workers are generally lower than the OLS results.9 Although the instruments
used here are imperfect, the results suggest that estimations without controlling for
endogeneity may overstate the effects of using nonstandard workers on TFP. According to
the 2SLS results, for a firm with one standard deviation higher volatility, a 10% higher
nonstandard worker ratio is related to a 0.5% point higher TFP (see column 4 of table 10).
As regards this specification, the results for non-manufacturing industry are larger than those
for the manufacturing industry (see columns 5 and 6 of table 10). As the results by industry
are not uniform among the specifications, we cannot assert a decisive conclusion about
different productivity effects between manufacturing and non-manufacturing industries.
5. Conclusion
In recent years, the number of nonstandard workers, such as part-time, contract, and
temporary agency workers, is growing rapidly in advanced countries. This paper empirically
analyzes the relationship among the volatility of firm sales, use of nonstandard employees, and
productivity by using panel data of more than 8,000 Japanese firms spanning the period1994 to
2006.
The main results can be summarized as follows:
1) According to the statistical analysis of job flows and the elasticity of labor adjustment,
temporary agency jobs and contract and daily jobs are very unstable. Their gross job
reallocation rates (GJRRs) are more than seven times higher than the rate of full-time regular
jobs. The elasticity of nonstandard employment with respect to sales change is twice as large
as that of full-time regular employment.
9 The difference between OLS and 2SLS is especially large for contract and daily workers, because the correlation between the instruments and the ratio of contract and daily workers is relatively low.

- 14 -
2) Firms facing higher sales volatility depend on a large number of nonstandard workers.
When a firm’s sales volatility is one standard deviation larger, the ratio of nonstandard
workers of the firm is, on average, about 0.7% point higher. This relationship is clear for
temporary agency workers, by type of employment, and stronger for the manufacturing
industry, by industry.
3) Among the highly volatile firms, the ratio of nonstandard workers has a positive and
quantitatively nontrivial relationship with the TFP. For a firm with one standard deviation
higher sales volatility, a 10% higher nonstandard worker ratio is related to around 1% point
higher TFP.
These results come from Japanese firm-level data, but labor adjustment costs of standard
and nonstandard workers may differ among countries depending on labor market rules and
regulations. The relationship among firm volatility, nonstandard employment, and
productivity may also be different by the institutional setting of a country. Empirical studies
similar to this paper for other countries may enrich our understanding of the role of labor
market regulations.10
Today, firms are faced globalization, rapid technological changes, shortened product life
cycle, and product market deregulation. All these seem to contribute to the increase in
instability and uncertainty of firm output, which, in turn, increases the demand for nonstandard
workers whose adjustment cost is low. If firms with high volatility cannot adjust the labor
input flexibly, their productivity performance will deteriorate. From a macroeconomic
perspective, it is desirable to increase the utilization rate of human resources through their
smooth reallocation in accordance with change in output fluctuations. However, it should also
be noted that instability of temporary agency jobs and contract jobs are undesirable for these
types of individuals.
Multiple policy measures are necessary to achieve two trade-off policy
objectives—productivity growth and security of individual workers. The analysis in this paper
suggests that the desirable policy mix for the whole economy is a combination of the provision
of sufficient safety net and training opportunities for nonstandard workers on the one hand and
the enactment of reasonable laws and regulations that enable firms to adjust labor input
flexibly on the other hand.
10 Venn (2009) estimates the employment protection indicators for 30 OECD countries and 10 emerging economies. According to the result, Japan’s employment protection level is lower than OECD average, but higher than that of the U.S. and the UK.

- 15 -
References
Autor, David H., William R. Kerr, and Adriana D. Kugler (2007), “Does Employment
Protection Reduce Productivity? Evidence from US States,” Economic Journal, Vol. 117,
June, F189-F217.
Barba, Navaretti Giorgio, Daniele Checchi, and Alessandro Turrini (2003), “Adjusting
Labour Demand: Multinationals versus National Firms: A Cross-European Analysis,”
Journal of the European Economic Association, Vol. 1, Nos. 2-3, pp. 708-719.
Bergin, Paul R., Robert C. Feenstra, and Gordon H. Hanson (2009), “Offshoring and
Volatility: Evidence from Mexico’s Maquiladora Industry,” American Economic Review,
Vol. 99, No. 4, pp. 1664-1671.
Boeri, Tito and Pietro Garibaldi (2007), “Two Tier Reforms of Employment Protection: A
Honeymoon Effect?” Economic Journal, Vol. 117, June, F357-F385.
Brynjolfsson, Erik, Andrew McAfee, Michael Sorell, and Feng Zhu (2007), “Scale without
Mass: Business Process Replication and Industry Dynamics,” Harvard Business School
Working Paper, pp. 07-016.
Caves, D. W., Christensen, L. R. and Diewert, W. E. (1982). “Multilateral Comparisons of
Output, Input, and Productivity Using Superlative Index Numbers,” Economic Journal,
Vol. 92, March, pp. 73-86.
Comin, Diego and Sunil Mulani (2006), “Diverging Trends in Aggregate and Firm
Volatility,” Review of Economics and Statistics, Vol. 88, No. 2, pp. 374-383.
Comin, Diego and Thomas Philippon (2006), “The Rise in Firm-Level Volatility: Causes
and Consequences,” in Mark Gertler and Kenneth Rogoff eds. NBER Macroeconomics
Annual 2005, Cambridge, MA: The MIT Press, pp. 167-201.
Comin, Diego, Erica L. Groshen, and Bess Rabin (2009), “Turbulent Firms, Turbulent
Wages?” Journal of Monetary Economics, Vol. 56, No. 1, pp. 109-133.
Cunat, Alejandro and Marc J. Melitz (2007), “Volatility, Labor Market Flexibility, and the
Patterns of Comparative Advantage,” NBER Working Paper, No. 13062.
Davis, Steven J. and John Haltiwanger (1999), “Gross Job Flows,” in Orley Ashenfelter and
David Card eds. Handbook of Labor Economics, Vol.3B, Amsterdam: Elsevier Science
B.V., Ch. 41.
Davis, Steven J., John C. Haltiwanger, and Scott Schuh (1996), Job Creation and
Destruction, Cambridge, MA: The MIT Press.
Davis, Steven J., John Haltiwanger, Ron Jarmin, and Javier Miranda (2007), “Volatility and
Dispersion in Business Growth Rates: Publicly Traded versus Privately Held Firms,” in
Daron Acemoglu, Kenneth Rogoff, and Michael Woodford eds. NBER Macroeconomics

- 16 -
Annual 2006, Cambridge, MA: The MIT Press, pp. 107-156.
di Giovanni, Julian and Andrei A. Levchenko (2009), “Trade Openness and Volatility,”
Review of Economics and Statistics, Vol. 91, No. 3, pp. 558-585.
Fabbri, Francesca, Jonathan E. Haskel, and Matthew J. Slaughter (2003), “Does Nationality
of Ownership Matter for Labour Demands?” Journal of the European Economic
Association, Vol. 1, Nos. 2-3, pp. 698-707.
Fukao, Kyoji and Hyeog Ug Kwon (2006), “Why Did Japan’s TFP Growth Slow Down in
the Lost Decade? An Empirical Analysis Based on Firm-Level Data of Manufacturing
Firms,” Japanese Economic Review, Vol. 57, No. 2, pp. 195-228.
Gramm, Cynthia and John Schnell (2001), “The Use of Flexible Staffing Arrangements in
Core Production Jobs,” Industrial and Labor Relations Review, Vol. 54, No. 2, pp.
245-258.
Houseman, Susan N. (2001), “Why Employers Use Flexible Staffing Arrangements:
Evidence from an Establishment Survey,” Industrial and Labor Relations Review, Vol.
55, No. 1, pp. 149-170.
Klein, Michael W., Scott Schuh, and Robert K. Triest (2003), “Job Creation, Job
Destruction, and the Real Exchange Rate,” Journal of International Economics, Vol. 59,
No. 2, pp. 239-265.
Lafontaine, Francine and Jagadeesh Sivadasan (2009), “Do Labor Market Rigidities Have
Microeconomic Effects? Evidence from within the Firm,” American Economic Journal:
Applied Economics, Vol. 1, No. 2, pp. 88-127.
Morikawa, Masayuki (2010), “Labor Unions and Productivity: An Empirical Analysis Using
Japanese Firm-Level Data,” Labour Economics, (forthcoming).
Nishimura, Kiyohiko G., Takanobu Nakajima, and Kozo Kiyota (2005), “Does the Natural
Selection Mechanism Still Work in Severe Recessions? Examination of the Japanese
Economy in the 1990s,” Journal of Economic Behavior and Organization, Vol. 58, No. 1,
pp. 53-78.
Ono, Yukako and Daniel G. Sullivan (2006), “Manufacturing Plants’ Use of Temporary
Workers: An Analysis Using Census Micro Data,” FRB Chicago Working Paper,
WP-2006-24.
Sanchez, Rosario and Luis Toharia (2000), “Temporary Workers and Productivity: The Case
of Spain,” Applied Economics, Vol. 32, No. 5, pp. 583-591.
Segal, Lewis M. and Daniel G. Sullivan (1997), “The Growth of Temporary Service Work,”
Journal of Economic Perspectives, Vol. 11, No. 2, pp. 117-136.
Syverson, Chad (2010), “What Determines Productivity?” NBER Working Paper, No.
- 17 -
15712. (forthcoming in the Journal of Economic Literature).
Venn, Danielle (2009), “Legislation, Collective Bargaining, and Enforcement: Updating the
OECD Employment Protection Indictors,” OECD Social, Employment, and Migration
Working Paper, No. 89.
Vidal, Matt and Leann M. Tigges (2009), “Temporary Employment and Strategic Staffing in
the Manufacturing Sector,” Industrial Relations, Vol. 48, No. 1, pp. 55-72.
Wooldridge, Jeffrey M. (2002), Econometric Analysis of Cross Section and Panel Data,
Cambridge, MA, and London: The MIT Press.

- 18 -
Table 1 Workers by type of employment
Sum Mean Sum Mean Sum MeanRegular workers 2,048,563 235.0 1,940,815 222.7 1,913,308 219.5 Full-time 1,866,766 214.2 1,636,560 187.8 1,642,097 188.4 Part-time 181,797 20.9 229,534 26.3 271,211 31.1Contract and daily workers 33,726 3.9 27,708 3.2 24,125 2.8Temporary agency workers - - 47,013 5.4 134,829 15.5
2006
Note: Calculated from the balanced panel of 8,716 firms.
1994 2000
Table 2 Gross job flows by type of employment
Full-timeworkers
Part-timeworkers
Contract anddaily workers
Temporaryagency workers
GJCR 0.9% 4.0% 8.5% 9.4%GJDR -1.0% -3.1% -8.7% -5.1%GJRR 2.0% 7.1% 17.2% 14.5%
Note: The figures are the averages from 2000-2001 to 2005-2006.
Table 3 Elasticity of employment with respect to change in sales
1 year 3 years 5 yearsFull-time workers 0.224 0.376 0.431Part-time workers 0.323 0.465 0.497Temporary agency workers 0.521 0.661 0.628Nonstandard workers (total) 0.410 0.566 0.630
Note: Elasticity for contract and daily workers is insignificant and is not reportedhere.
Intervals

- 19 -
Table 4 Regression results for ratio of nonstandard workers
Coef. Std. Err. Coef. Std. Err. Coef. Std. Err. Coef. Std. Err.
Sales volatility 0.012 0.009 0.032 0.008 *** 0.124 0.011 *** 0.150 0.020 ***
Administration -0.170 0.005 *** -0.014 0.004 *** 0.031 0.007 *** -0.218 0.012 ***
Information -0.096 0.011 *** -0.016 0.010 * -0.018 0.014 -0.099 0.026 ***
R&D -0.106 0.008 *** -0.017 0.007 ** 0.037 0.009 *** -0.089 0.017 ***
Manufacturing 0.001 0.003 -0.014 0.002 *** 0.033 0.003 *** 0.013 0.006 **
Commerce -0.009 0.003 *** -0.013 0.002 *** -0.009 0.003 *** -0.033 0.006 ***
Firm size 0.019 0.001 *** 0.000 0.001 0.012 0.001 *** 0.032 0.001 ***
Firm age -0.001 0.000 *** 0.000 0.000 0.000 0.000 *** -0.001 0.000 ***
Year dummiesIndustry dummiesNAdj R-squared
yesyes
113,308
(1) Part-timers(2) Contract and daily
workers
yesyes
113,308
Note: Pooled OLS results. *significant at 10%; ** significant at 5%; *** significant at 1%.
yes yes61,012 61,012
0.03130.3008
(3) Temporary agencyworkers
(4) Nonstandard workers(total)
0.0821 0.2068
yes yes
Table 5 Quantitative assessment of the estimated coefficients
(1) (2) (3) (4)
Estimatedcoefficients
Coefficients*1 sdvolatility
Mean ratio ofworkers
(2)/(3)
Part-timers 0.012 0.1% 9.7% 0.6%Contract and daily workers 0.032 0.1% 1.3% 11.6%Temporary agency workers 0.124 0.6% 4.0% 14.6%Nonstandard workers 0.150 0.7% 15.5% 4.6%
Table 6 Estimated coefficients for firm volatility by industry
(1) (2) (3)All industries Manufacturing Non-manufacturing
Part-timers 0.012 0.022 0.001Contract and daily workers 0.032 0.040 0.024Temporary agency workers 0.124 0.153 0.078Nonstandard workers 0.150 0.199 0.082Mean volatility 0.065 0.069 0.058Note: Figures in italics mean insignificant at 10% level.
- 20 -
Table 7 TFP estimation results for high-volatility and low-volatility firms
(1) Part-timers
Coef. Std. Err. Coef. Std. Err.
Firm size 0.032 0.002 *** 0.010 0.002 ***
Firm age -0.003 0.000 *** -0.003 0.000 ***
Average wage 0.920 0.005 *** 0.881 0.004 ***
Part-time ratio 0.453 0.013 *** 0.430 0.009 ***
Year dummiesIndustry dummiesNAdj R-squared
(2) Contract and daily workers
Coef. Std. Err. P>t Coef. Std. Err.
Firm size 0.041 0.002 *** 0.027 0.002 ***
Firm age -0.003 0.000 *** -0.003 0.000 ***
Average wage 0.858 0.005 *** 0.794 0.004 ***
Contract and daily worker ratio 0.055 0.015 *** -0.026 0.010 ***
Year dummiesIndustry dummiesNAdj R-squared
(3) Temporary agency workers
Coef. Std. Err. Coef. Std. Err.
Firm size 0.061 0.003 *** 0.041 0.002 ***
Firm age -0.003 0.000 *** -0.003 0.000 ***
Average wage 0.847 0.007 *** 0.793 0.005 ***
Temporary agency worker ratio 0.195 0.017 *** 0.071 0.020 ***
Year dummiesIndustry dummiesNAdj R-squared
(4) Nonstandard workers (total)
Coef. Std. Err. Coef. Std. Err.
Firm size 0.056 0.003 *** 0.031 0.002 ***
Firm age -0.003 0.000 *** -0.003 0.000 ***
Average wage 0.873 0.007 *** 0.827 0.005 ***
Nonstandard worker ratio 0.234 0.010 *** 0.205 0.008 ***
Year dummiesIndustry dummiesNAdj R-squared
High-volatility firms Low-volatility firms
yes yesyes yes
52,087 52,7080.4806 0.5562
High-volatility firms Low-volatility firms
yes yesyes yes
52,087 52,7080.4684 0.5367
High-volatility firms Low-volatility firms
yes yesyes yes
26,021 26,5840.4893 0.5631
High-volatility firms Low-volatility firms
yes yesyes yes
Note: Pooled OLS results. *significant at 10%; ** significant at 5%; *** significant at 1%. High-volatility firms and low-volatility firms are divided by the median volatility of the sample firms.
26,021 26,5840.4967 0.5723
- 21 -
Table 8 TFP estimation results by industry
(1) (2) (3)All industries Manufacturing Non-manufacturing
Part-timers 0.023 0.117 -0.072Contract and daily workers 0.081 0.136 0.058Temporary agency workers 0.124 0.210 0.153Nonstandard workers 0.029 0.120 -0.038Note: The figures represent the differences of estimated coefficients for high- and low-volatility firms.

- 22 -
Table 9 TFP estimation results with the interaction term
(1) Part-timers
Coef. Std. Err. Coef. Std. Err.
Firm size 0.029 0.001 *** 0.032 0.001 ***
Firm age -0.003 0.000 *** -0.003 0.000 ***
Average wage 0.867 0.003 *** 0.842 0.007 ***
Volatility*part-time ratio 3.462 0.081 *** 1.129 0.236 ***
Year dummiesIndustry dummiesNAdj R-squared #
(2) Contract and daily workers
Coef. Std. Err. Coef. Std. Err.
Firm size 0.033 0.001 *** 0.034 0.002 ***
Firm age -0.003 0.000 *** -0.003 0.000 ***
Average wage 0.830 0.003 *** 0.812 0.004 ***
volatility*contract ratio 0.531 0.112 *** 14.763 1.813 ***
Year dummiesIndustry dummiesNAdj R-squared #
(3) Temporary agency workers
Coef. Std. Err. Coef. Std. Err.
Firm size 0.049 0.002 *** 0.050 0.002 ***
Firm age -0.003 0.000 *** -0.003 0.000 ***
Average wage 0.823 0.004 *** 0.825 0.004 ***
volatility*temp ratio 2.286 0.123 *** 1.109 0.485 ***
Year dummiesIndustry dummiesNAdj R-squared #
(4) Nonstandard workers
Coef. Std. Err. Coef. Std. Err.
Firm size 0.046 0.002 *** 0.048 0.002 ***
Firm age -0.003 0.000 *** -0.003 0.000 ***
Average wage 0.846 0.004 *** 0.836 0.004 ***
volatility*nonstandard 2.329 0.071 *** 1.016 0.192 ***
Year dummiesIndustry dummiesNAdj R-squared #
52,6050.5180
yes104,795
yes
(1) (2)
yesyes
2SLS
2SLS
0.4883104,795
(1) (2)
yesyes
2SLS
yes
0.4936
yesyes
(1) (2)
(1) (2)
2SLS
104,7950.4104
OLS
OLS
yes
0.5034
yes104,795
OLS
yes
OLS
yes
0.5163
yes52,605
Note: *significant at 10%; ** significant at 5%; *** significant at 1%. # Adjusted R-squaredfor OLS and R-squared for 2SLS. 2SLS estimations use the interaction term of volatility andthe ratios of business composition as instruments.
0.5243
yes52,605 52,605
0.5224
yes

- 23 -
Table 10 Estimated effects of 10% increase in the ratio of nonstandard workers on TFP for
firms with one standard deviation higher sales volatility (by industry)
(1) (2) (3) (4) (5) (6)OLS OLS OLS 2SLS 2SLS 2SLS
All industries ManufacturingNon-
manufacturingAll industries Manufacturing
Non-manufacturing
Part-timers 1.6% 1.6% 1.7% 0.5% 0.1% 1.4%Contract and daily workers 0.3% 0.2% 0.3% 7.2% 4.8% 15.0%Temporary agency workers 1.1% 1.0% 1.7% 0.5% 1.0% 7.1%Nonstandard workers 1.1% 1.0% 1.2% 0.5% 0.5% 1.4%Note: Calculated from the regression results.