voltage stability improvement of power system using a...
TRANSCRIPT
International Conference on Renewable Energies and Power Quality (ICREPQ’16)
Madrid (Spain), 4th to 6th May, 2016 Renewable Energy and Power Quality Journal (RE&PQJ)
ISSN 2172-038 X, No.14 May 2016
Voltage stability improvement of power system using a shunt capacitor
Masahiro Furukakoi
1, Tomonobu Senjyu
1 and Toshihisa Funabashi
2
1 Department of Electrical and Electronics Engineering University of the Ryukyus
1 Senbaru Nishihara-cho Nakagami Okinawa 903-0213 japan Phone/Fax number:+81-98-895-8686, e-mail: [email protected], [email protected]
2 Institute of Materials and Systems for Sustainability (IMaSS) NAGOYA UNIVERSITY
Furo-cho, Nagoya, 464-8603(Japan)
Phone/Fax number:+81-52-789-2098, e-mail:[email protected]
Abstract. Due to the deregulation of the electricity
market, increasing demand approaching transmission
capacity, and the endeavor for economic benefits, the
power system is recently placed under more severe
operating conditions than ever before. Therefore, voltage
stability analysis is a major concern in power system
planning and operation. This paper proposes a method to
improve the voltage stability of the power system by using
the active and reactive power information of the
transmission line in accordance with the voltage stability
index. Installing a bank of shunt capacitors at the load
substation in order to inject the proper amount of reactive
power can improve the voltage stability of the system as
shown by simulations.
Key words
voltage collapse, voltage stability index, shunt capacitor,
smart grid, IEEE 5 Bus system
1. Introduction
Recent liberalization of the power market combined with
growing concern about of the depletion of energy resources has
led to an increase in the introduction of solar power generation
within the electric power grid. Moreover, the move to all electric
systems in the interest of economic benefits results in an increase
in demand, causing the power system to operate near power
transmission capacity in progressively severe situations[1]. With
more efficient use of transmission lines, it is possible that more
parts of the power system can be operated near voltage stability
limits. As a result the possibility of voltage collapse will
increase[2,3]. Therefore, voltage stability analysis is a major
consideration in the stable operation of the power system.
Voltage stability has been analyzed in a variety of ways. Some
of the analysis techniques include P-V analysis, which concerns
the relationship of the voltage and active power in the
transmission system, and Q-V analysis, which concerns the
relationship of the voltage and reactive power[4∼11]. Proposed
indicators of voltage stability include finding the change in active
and reactive power with respect to the change in voltage from the
P-V and Q-V characteristics, the proximity of the high and low
voltage vectors from the PV characteristics, and the voltage
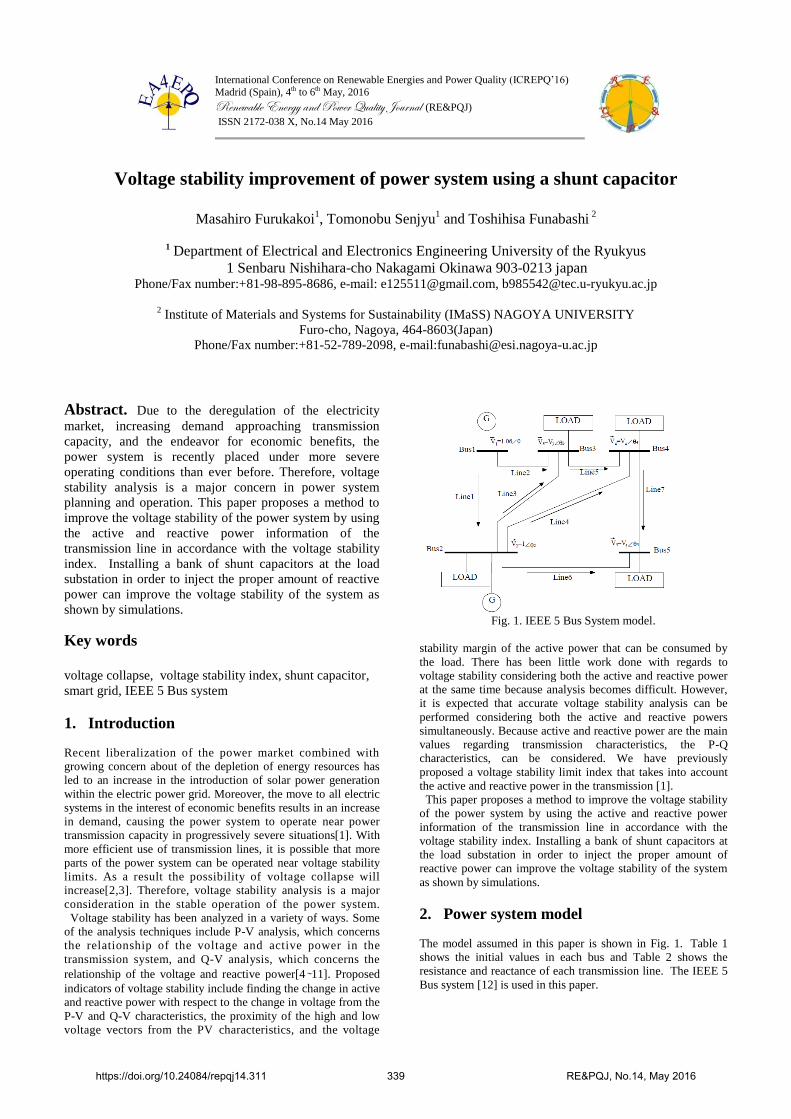
Fig. 1. IEEE 5 Bus System model.
stability margin of the active power that can be consumed by
the load. There has been little work done with regards to
voltage stability considering both the active and reactive power
at the same time because analysis becomes difficult. However,
it is expected that accurate voltage stability analysis can be
performed considering both the active and reactive powers
simultaneously. Because active and reactive power are the main
values regarding transmission characteristics, the P-Q
characteristics, can be considered. We have previously
proposed a voltage stability limit index that takes into account
the active and reactive power in the transmission [1].
This paper proposes a method to improve the voltage stability
of the power system by using the active and reactive power
information of the transmission line in accordance with the
voltage stability index. Installing a bank of shunt capacitors at
the load substation in order to inject the proper amount of
reactive power can improve the voltage stability of the system
as shown by simulations.
2. Power system model
The model assumed in this paper is shown in Fig. 1. Table 1
shows the initial values in each bus and Table 2 shows the
resistance and reactance of each transmission line. The IEEE 5
Bus system [12] is used in this paper.
https://doi.org/10.24084/repqj14.311 339 RE&PQJ, No.14, May 2016
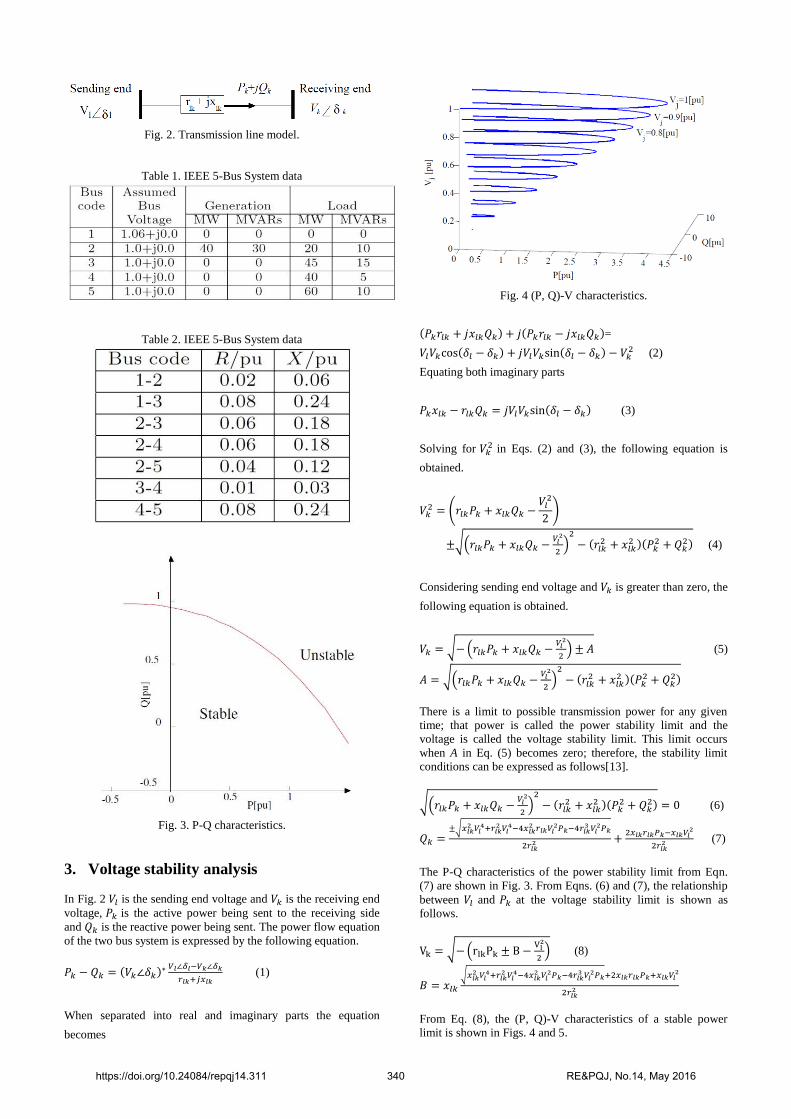
Fig. 2. Transmission line model.
Table 1. IEEE 5-Bus System data
Table 2. IEEE 5-Bus System data
Fig. 3. P-Q characteristics.
3. Voltage stability analysis
In Fig. 2 𝑉𝑙 is the sending end voltage and 𝑉𝑘 is the receiving end
voltage, 𝑃𝑘 is the active power being sent to the receiving side
and 𝑄𝑘 is the reactive power being sent. The power flow equation
of the two bus system is expressed by the following equation.
𝑃𝑘 − 𝑄𝑘 = (𝑉𝑘∠𝛿𝑘)∗ 𝑉𝑙∠𝛿𝑙−𝑉𝑘∠𝛿𝑘
𝑟𝑙𝑘+𝑗𝑥𝑙𝑘 (1)
When separated into real and imaginary parts the equation
becomes
Fig. 4 (P, Q)-V characteristics.
(𝑃𝑘𝑟𝑙𝑘 + 𝑗𝑥𝑙𝑘𝑄𝑘) + 𝑗(𝑃𝑘𝑟𝑙𝑘 − 𝑗𝑥𝑙𝑘𝑄𝑘)=
𝑉𝑙𝑉𝑘cos(𝛿𝑙 − 𝛿𝑘) + 𝑗𝑉𝑙𝑉𝑘sin(𝛿𝑙 − 𝛿𝑘) − 𝑉𝑘2 (2)
Equating both imaginary parts
𝑃𝑘𝑥𝑙𝑘 − 𝑟𝑙𝑘𝑄𝑘 = 𝑗𝑉𝑙𝑉𝑘sin(𝛿𝑙 − 𝛿𝑘) (3)
Solving for 𝑉𝑘2 in Eqs. (2) and (3), the following equation is
obtained.
𝑉𝑘2 = (𝑟𝑙𝑘𝑃𝑘 + 𝑥𝑙𝑘𝑄𝑘 −
𝑉𝑙2
2)
±√(𝑟𝑙𝑘𝑃𝑘 + 𝑥𝑙𝑘𝑄𝑘 −𝑉𝑙
2
2)
2
− (𝑟𝑙𝑘2 + 𝑥𝑙𝑘
2 )(𝑃𝑘2 + 𝑄𝑘
2) (4)
Considering sending end voltage and 𝑉𝑘 is greater than zero, the
following equation is obtained.
𝑉𝑘 = √− (𝑟𝑙𝑘𝑃𝑘 + 𝑥𝑙𝑘𝑄𝑘 −𝑉𝑙
2
2) ± 𝐴 (5)
𝐴 = √(𝑟𝑙𝑘𝑃𝑘 + 𝑥𝑙𝑘𝑄𝑘 −𝑉𝑙
2
2)
2
− (𝑟𝑙𝑘2 + 𝑥𝑙𝑘
2 )(𝑃𝑘2 + 𝑄𝑘
2)
There is a limit to possible transmission power for any given
time; that power is called the power stability limit and the
voltage is called the voltage stability limit. This limit occurs
when A in Eq. (5) becomes zero; therefore, the stability limit
conditions can be expressed as follows[13].
√(𝑟𝑙𝑘𝑃𝑘 + 𝑥𝑙𝑘𝑄𝑘 −𝑉𝑙
2
2)
2
− (𝑟𝑙𝑘2 + 𝑥𝑙𝑘
2 )(𝑃𝑘2 + 𝑄𝑘
2) = 0 (6)
𝑄𝑘 =±√𝑥𝑙𝑘
2 𝑉𝑙4+𝑟𝑙𝑘
2 𝑉𝑙4−4𝑥𝑙𝑘
2 𝑟𝑙𝑘𝑉𝑙2𝑃𝑘−4𝑟𝑙𝑘
3 𝑉𝑙2𝑃𝑘
2𝑟𝑙𝑘2 +
2𝑥𝑙𝑘𝑟𝑙𝑘𝑃𝑘−𝑥𝑙𝑘𝑉𝑙2
2𝑟𝑙𝑘2 (7)
The P-Q characteristics of the power stability limit from Eqn.
(7) are shown in Fig. 3. From Eqns. (6) and (7), the relationship
between 𝑉𝑙 and 𝑃𝑘 at the voltage stability limit is shown as
follows.
Vk = √− (rlkPk ± B −Vl
2
2) (8)
𝐵 = 𝑥𝑙𝑘
√𝑥𝑙𝑘2 𝑉𝑙
4+𝑟𝑙𝑘2 𝑉𝑙
4−4𝑥𝑙𝑘2 𝑉𝑙
2𝑃𝑘−4𝑟𝑙𝑘3 𝑉𝑙
2𝑃𝑘+2𝑥𝑙𝑘𝑟𝑙𝑘𝑃𝑘+𝑥𝑙𝑘𝑉𝑙2
2𝑟𝑙𝑘2
From Eq. (8), the (P, Q)-V characteristics of a stable power
limit is shown in Figs. 4 and 5.
https://doi.org/10.24084/repqj14.311 340 RE&PQJ, No.14, May 2016

Fig. 5. (P, Q)-V characteristics.
4. Voltage stability index
From the current point K(𝑃𝑜, 𝑄𝑜), an unstable point on the curve
from Equation (6) C(X,Y) is obtained using Lagrange multipliers.
Equation (6) is obtained as follows.
𝐶 = (𝑟𝑙𝑘𝑃𝑘 + 𝑥𝑙𝑘𝑄𝑘 −𝑉𝑙
2
2)
2
− (𝑟𝑙𝑘2 + 𝑥𝑙𝑘
2 )(𝑃𝑘2 + 𝑄𝑘
2) = 0 (9)
The distance between the current point K and the nearest point of
voltage instability C, is a the function f(X, Y) and the minimum of
𝑓2.
𝑓2 = (X − P0)2 + (Y − Q0)2 (10)
The following equation is obtained by using Lagrange multipliers.
𝐹(𝑋, 𝑌, 𝜆) = 𝑓2(𝑋, 𝑌) − 𝜆𝐶(𝑋, 𝑌) (11)
𝐹(𝑋, 𝑌, 𝜆) = (𝑋 − 𝑃0)2 + (𝑌 − 𝑄0)2
−𝜆 ((𝑟𝑙𝑘𝑋 + 𝑥𝑙𝑘𝑌 −𝑉𝑙
2
2)
𝟐
− (𝑟𝑙𝑘2 + 𝑥𝑙𝑘
2 )(𝑋2 + 𝑌2)) (12)
Taking the partial differential equation for X, Y, 𝜆 above the
following equation is obtained.
2𝑋 − 2𝑃0
−𝜆 (2 (𝑟𝑙𝑘𝑋 + 𝑥𝑙𝑘𝑌 −𝑉𝑙
2
2) 𝑟𝑙𝑘 − 2(𝑟𝑙𝑘
2 + 𝑥𝑙𝑘2 )𝑋) = 0 (13)
2𝑌 − 2𝑄0
−𝜆 (2 (𝑟𝑙𝑘𝑋 + 𝑥𝑙𝑘𝑌 −𝑉𝑙
2
2) 𝑥𝑙𝑘 − 2(𝑟𝑙𝑘
2 + 𝑥𝑙𝑘2 )𝑌) = 0 (14)
− (𝑟𝑙𝑘𝑋 + 𝑥𝑙𝑘𝑌 −𝑉𝑙
2
2)
𝟐
+ (𝑟𝑙𝑘2 + 𝑥𝑙𝑘
2 )(𝑋2 + 𝑌2) = 0 (15)
The values of X, Y, 𝜆 are obtained by simultaneously solving
equations (13)~(15). Using these points, the nearest operating
point is determined. In this paper, 𝛥𝑃, 𝛥𝑄 denote the distance to
the nearest point from the operating point as the voltage stability
index.
Fig. 6. P-Q characteristics.
Fig. 7. Shunt Capacitor control.
The voltage stability index for the power transmission line l-k
is calculated as the shortest distance from the current operating
point to the P-Q voltage stability limit curve. These are
demarcated as ∆P and ∆Q and the Critical Boundary Index
(CBI) can be evaluated as follows:
𝐶𝐵𝐼𝑙𝑘 = √∆𝑃𝑙𝑘2 + ∆𝑄𝑙𝑘
2 (16)
Here, 'l' is the sending end bus number, 'k' is the receiving end
bus number. The CBI can be used as an index of voltage
stability of the transmission line. The voltage stability of the
given transmission line worsens as the CBI approaches zero [1].
5. Shunt Capacitor Control Method
The following is the proposed control method aimed at
improving the voltage stability by using shunt capacitors
housed in the substation. Fig. 6 shows the operating
point K(𝑃𝐿𝐾 , 𝑄𝐿𝐾) and the closest point D(𝑃0, 𝑄0) on the
stability limit curve. The tangent of the curve at point D
is calculated as follows: 𝑃𝐿𝐾 and 𝑄𝐿𝐾 are the active and
reactive power flowing through line k. 𝑄𝑘 is derived
using Equation (3), as shown in Equation (17).
𝑄𝑘 =±√𝑥𝑙𝑘
2 𝑉𝑙4+𝑟𝑙𝑘
2 𝑉𝑙4−4𝑥𝑙𝑘
2 𝑟𝑙𝑘𝑉𝑙2𝑃𝑘−4𝑟𝑙𝑘
3 𝑉𝑙2𝑃𝑘
2𝑟𝑙𝑘2 +
2𝑥𝑙𝑘𝑟𝑙𝑘𝑃𝑘−𝑥𝑙𝑘𝑉𝑙2
2𝑟𝑙𝑘2 (17)
https://doi.org/10.24084/repqj14.311 341 RE&PQJ, No.14, May 2016
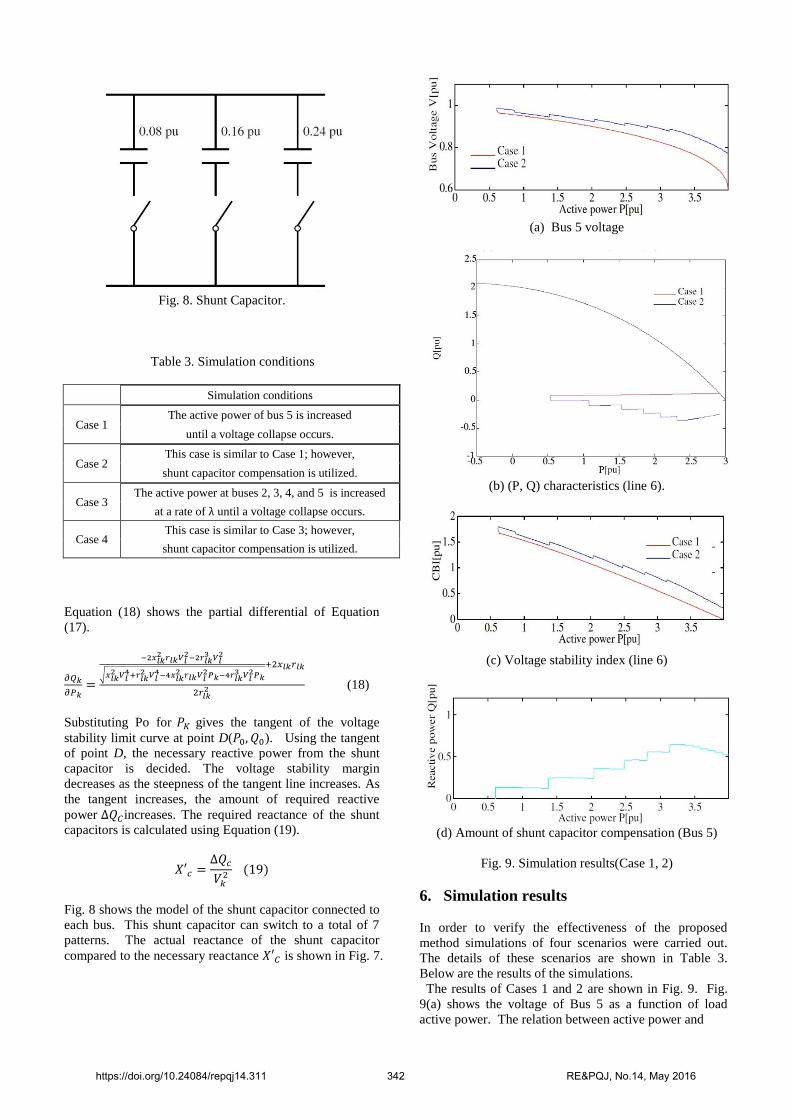
Fig. 8. Shunt Capacitor.
Table 3. Simulation conditions
Simulation conditions
Case 1 The active power of bus 5 is increased
until a voltage collapse occurs.
Case 2 This case is similar to Case 1; however,
shunt capacitor compensation is utilized.
Case 3 The active power at buses 2, 3, 4, and 5 is increased
at a rate of λ until a voltage collapse occurs.
Case 4 This case is similar to Case 3; however,
shunt capacitor compensation is utilized.
Equation (18) shows the partial differential of Equation
(17).
𝜕𝑄𝑘
𝜕𝑃𝑘=
−2𝑥𝑙𝑘2 𝑟𝑙𝑘𝑉𝑙
2−2𝑟𝑙𝑘3 𝑉𝑙
2
√𝑥𝑙𝑘2 𝑉𝑙
4+𝑟𝑙𝑘2 𝑉𝑙
4−4𝑥𝑙𝑘2 𝑟𝑙𝑘𝑉𝑙
2𝑃𝑘−4𝑟𝑙𝑘3 𝑉𝑙
2𝑃𝑘
+2𝑥𝑙𝑘𝑟𝑙𝑘
2𝑟𝑙𝑘2 (18)
Substituting Po for 𝑃𝐾 gives the tangent of the voltage
stability limit curve at point D(𝑃0, 𝑄0). Using the tangent
of point D, the necessary reactive power from the shunt
capacitor is decided. The voltage stability margin
decreases as the steepness of the tangent line increases. As
the tangent increases, the amount of required reactive
power ∆𝑄𝐶increases. The required reactance of the shunt
capacitors is calculated using Equation (19).
𝑋′𝑐 =∆𝑄𝑐
𝑉𝑘2 (19)
Fig. 8 shows the model of the shunt capacitor connected to
each bus. This shunt capacitor can switch to a total of 7
patterns. The actual reactance of the shunt capacitor
compared to the necessary reactance 𝑋′𝐶 is shown in Fig. 7.
(a) Bus 5 voltage
(b) (P, Q) characteristics (line 6).
(c) Voltage stability index (line 6)
(d) Amount of shunt capacitor compensation (Bus 5)
Fig. 9. Simulation results(Case 1, 2)
6. Simulation results
In order to verify the effectiveness of the proposed
method simulations of four scenarios were carried out.
The details of these scenarios are shown in Table 3.
Below are the results of the simulations.
The results of Cases 1 and 2 are shown in Fig. 9. Fig.
9(a) shows the voltage of Bus 5 as a function of load
active power. The relation between active power and
https://doi.org/10.24084/repqj14.311 342 RE&PQJ, No.14, May 2016

(a) Bus voltage(Case 3).
(b) P-Q characteristics(Case 3).
(c) Voltage stability index(Case 3)
(d) Bus voltage(Case 4).
(e) P-Q characteristics(Case 4).
(f) Voltage stability index(Case 4)
(g) Amount of shunt capacitor compensation (Case 4)
Fig. 10 Simulation results(Case 3, 4)
https://doi.org/10.24084/repqj14.311 343 RE&PQJ, No.14, May 2016
voltage, that the voltage drops as the load active power
increases, can be easily seen in this figure. The PQ
characteristics of line 6 are shown in Fig. 9(b). It can be
seen that as the load active power increases, the active and
reactive power flowing through the line also increases. As
a result, the distance between the operating point and the
voltage stability curve decreases. In Case 1, there is no
shunt capacitor compensation, so the operating point
moves above the voltage stability limit curve; thus, a
voltage collapse occurs.
Fig. 9(c) shows the critical boundary index (CBI). At the
occurrence of the voltage collapse, the CBI is equal to zero.
Fig. 9(d) shows the amount of shunt capacitor
compensation for Case 2. As active power increases, the
compensating reactive power must also be increased to
ensure the security of the system. As seen in Fig. 9(b),
from the compensation provided by the shunt capacitor,
the operating point is kept safely far away from the voltage
stability limit curve. Therefore, through the use of a shunt
capacitor, the system is protected from voltage sags and
voltage collapse.
Fig. 10 shows the results for Cases 3 and 4. Fig. 10(a)
shows the voltage of all buses as functions of load active
power. Here as well, the relation between active power
and voltage, can be easily seen. The PQ characteristics of
lines 2, 3, 4, 6 and 7 are shown in Fig. 10(b). When the
distance between the operating point of line 6 and the
voltage stability limit curve reaches 0, a voltage collapse
occurs. Fig. 10(c) shows the CBI of lines 2, 3, 4, 6 and 7.
As the active power of each load increases the voltage
stability margin decreases. Fig. 10(g) shows the amount of
shunt capacitor compensation for Case 4. As active power
increases, the compensating reactive power must also be
increased to ensure the security of the system. As seen in
Fig. 10(e), from the compensation provided by the shunt
capacitor, the operating point is kept safely far away from
the voltage stability limit curve. In Fig. 10(f), comparing
with Case 3 the voltage stability index is very high. The
scenario of Cases 3 and 4 are similar; however, in Case 4,
shunt capacitor compensation is used, whereas it is not
used in Case 3, thus a voltage collapse occurs. The system
in Case 4 is kept safe through the use of the shunt
capacitors.
7. Conclusion On the basis of the critical boundary index (CBI), installing shunt
capacitors in the power system allows the injection of reactive
power when loads are increased or a fault occurs, and this makes
it possible to improve the voltage stability of the power system as
shown by the simulation results. It is possible to improve the
results of this study by applying an optimization technique to find
the most beneficial shunt capacitor installation locations as well
as the most beneficial amount of injected reactive power.
References [1] Masato Tachibana, Michael Damien Palmer, Tomonobu
Senjyu and Toshihisa Funabashi, “Voltage Stability Analysis and
(P,Q)-V Caracteristics of Multi-bus System,”CIGRE AORC
Technical Meeting 2014, .
[2] Yuan-Kang Wu, “A novel algorithm for ATC calculations
and applications in deregulated electricity markets,”International
Journal of Electr Power and Energy Systems, vol. 29, Issue 10,
pp. 810-821, 2007.
[3] Ajjarapu V. and Lee B., ”Bibliography on voltage
stability,”IEEE Trans. on Power System, vol.13, Issue 1, pp.
115-125, 1998.
[4] Taylor CW, “Power system voltage stability,” New York:
McGraw-Hill; 1994.
[5] Leonardi B and Ajjarapu V, “An Approach for Real Time
Voltage Stability Margin Control via Reactive Power Reserve
Sensitivities,” IEEE Trans. on Power System, vol. 28, Issue 2,
pp. 615-625, 2013.
[6] Corsi S. and Taranto G.N., “Voltage Instability -the Differen
Shapes of the “Nose”,”Bulk Power System Dynamics and
Control - VII. Revitalizing Operational Reliability, 2007 iREP
Symposium, pp. 1-16, 2007.
[7] Li Lin, Junbing Wang, and Wenzhong Gao, “Effect of load
power factor on voltage stability of distribution Substation,”
IEEE Power and Energy Society General Meeting, pp.1-4, 2012.
[8] Hiroshi Okamoto, Ryuya Tanabe, Yasuyuki Tada, and
Yasuji Sekine, “Method for Voltage Stability Constrained
Optimal Power Flow (VSCOPF),”IEEJ Transactions on Power
and Energy vol. 121, 8 Issue 12, pp. 1670-1680, 2001.
[9] M. Glavic, M. Lelic, D. Novosel, E. Heredia, and D.N.
Kosterev, “simple computation and visualization of voltage
stability power margins in real-time”, Transmission and
Distribution Conference and Exposition, 2012 IEEE PES, pp.
1-7, 2012.
[10]O.A. Mousavi, M. Bozorg, A. Ahmadi-Khatir, and R.
Cherkaoui, “Reactive power reserve management: Preventive
countermeasure for improving voltage stability margin,” IEEE
Power and Energy Society General Meeting, 2012 pp. 1-7,
2012.
[11] H. Kazari, A. Abbaspour-Tehrani Fard, A.S. Dobakhshari,
and A.M. Ranjbar, “Voltage stability improvement through
centralized reactive power management on the Smart Grid,”
Innovative Smart Grid Technologies, 2012 IEEE PES, pp. 1-7,
2012.
[12] P. Srikanth, O. Rajendra, A.Yesuraj,M.Tilak, “Load Flow Analysis Of Ieee14 Bus System Using MATLAB,” Inte-
rnational Journal of Engineering Research and Technology, vol.
2, Issue 5, pp. 149-155, 2013.
[13] B.Venkatesh, Alex Rost, Riuchen Chang, “namic Volt age
Collapse Index–Wind Generator Application”, IEEE Trans. on
Power Delivery, vol. 22, Issue 1, pp. 90-94, 2007.
https://doi.org/10.24084/repqj14.311 344 RE&PQJ, No.14, May 2016