voltage stability probabilistic assessment in composite systems: modeling unsolvability and...
TRANSCRIPT

IEEE TRANSACTIONS ON POWER SYSTEMS, VOL. 25, NO. 3, AUGUST 2010 1575
Voltage Stability Probabilistic Assessmentin Composite Systems: Modeling Unsolvability
and Controllability LossAnselmo Barbosa Rodrigues, Ricardo B. Prada, and Maria Da Guia da Silva, Member, IEEE
Abstract—Several papers have recognized the effect of uncer-tainties in voltage stability analysis through probabilistic methods.In these papers, the unstable states are generally identified by theunsolvability of the power flow equations or by violations in thevoltage stability margin limit. However, voltage stability problemsmay also be associated with a loss in voltage controllability, whena voltage control action has an effect which is contrary to what isusually expected. The main aim of this paper is to include unstablestates caused by unsolvability and voltage controllability loss inthe voltage stability probabilistic assessment. This goal is achievedthrough the combination of three techniques: the Monte CarloSimulation Method, the nonlinear optimal power flow and theD’ matrix method. These three techniques permit the inclusionof a new issue in the computation of voltage instability risk: theunstable states stemming from controllability loss.
Index Terms—Composite systems, interior point method, MonteCarlo simulation, optimal power flow, probabilistic methods, sen-sitivity analysis, voltage stability.
List of Acronyms
BTS-65 Brazilian Test System of 65 buses.
BTS-107 Brazilian Test System of 107 buses.
C Circuit contingencies (lines andtransformers).
DMM D’ Matrix Method.
G Generator and compensator outages.
GC Simultaneous failures in circuits andgenerators.
L Fluctuations in the system peak load dueto forecasting errors (without equipmentin down state).
LOLP Loss of load probability.
Manuscript received May 29, 2009; revised August 21, 2009. First pub-lished January 26, 2010; current version published July 21, 2010. This workwas supported in part by FAPEMA (Fundação de Amparo à Pesquisa e aoDesenvolvimento Científico e Tecnológico do Estado do Maranhão), in partby ELETRONORTE (Centrais Elétricas do Norte do Brasil S.A), and in partby CNPq (Conselho Nacional de Desenvolvimento Científico e Tecnológica).Paper no. TPWRS-00394-2009.
A. B. Rodrigues and R. B. Prada are with the Department of Electrical En-gineering, Pontifical Catholic University of Rio de Janeiro, Rio de Janeiro, RJ,Brazil (e-mail: [email protected]; [email protected]).
M. G. da Silva is with the Department of Electrical Engineering, Federal Uni-versity of Maranhão, São Luís, MA, Brazil (e-mail: [email protected]).
Digital Object Identifier 10.1109/TPWRS.2009.2039234
MCSM Monte Carlo Simulation Method.
MRTS Modified version of the IEEE ReliabilityTest System.
NI Number of islands.
Maximum number of simulations for theMCSM.
OPF Optimal power flow.
P (Health) Health state probability.
P (Marginal) Marginal state probability.
P (Emergency) Emergency state probability.
P (Collapse) Collapse state probability.
SLP Sequential linear programming.
SQP Sequential quadratic programming.
SRPFE Solvability restoration of the power flowequations.
VIR Voltage instability risk.
VSM Voltage stability margin.
VSPA Voltage stability probabilistic assessment.
I. INTRODUCTION
C URRENTLY, electric power systems are operating nearto their limits. This operational condition has been caused
by the following factors: the natural growth of demand for elec-tric energy and postponement in transmission expansion causedby routing constraints and reductions in the electricity sectorbudget due to economic difficulties. The operation of heavilyloaded transmission lines has given rise to voltage stability prob-lems in electricity networks. Voltage stability is defined as theability of a power system to maintain steady voltages at all thebuses after disturbances such as: load fluctuations and contin-gencies in the system components [1], [2]. The voltage insta-bility states are mainly associated with two mechanisms:
1) Unsolvability of the power flow equations [3], [4]: afterthe occurrence of a system disturbance, the power flowequations do not have real solutions due to the violationin the limit of maximum power transfer for the systemloads. The distance between the current loading point andthe maximum loading point is denominated as VSM.
0885-8950/$26.00 © 2010 IEEE
1576 IEEE TRANSACTIONS ON POWER SYSTEMS, VOL. 25, NO. 3, AUGUST 2010
2) Voltage controllability loss [1], [5]: after a disturbance,the control actions, used to correct the voltage profile, havethe opposite effect to that which is expected. For example,voltage reduction in a bus after a capacitor bank is switchedon. This effect is due to the negative value of the QV sen-sitivity in the bus where the capacitor was switched on.
The presence of the voltage instability mechanisms in asystem state can be identified through the combination of thefollowing techniques:
1) DMM [5] or modal analysis [6] to detect controllabilityloss problems;
2) OPF [4] or continuation power flow [7] to assess the solv-ability of the power flow equations.
This identification can be carried out due to voltage instabilitymechanisms rely on the existence of real solutions for the powerflow equations and on the sensitivity relationships between con-trol and state variables. However, it is not possible to predictthe system operational state. It is due to the stochastic behaviorof load fluctuations and equipment availability. Consequently,the system is subject to an uncertainty associated with the oc-currence of voltage instability states. Therefore, it is importantthat the voltage stability analysis should also consider the uncer-tainties related to random nature of system disturbances. Due tothis, the more appropriate techniques for modeling uncertaintiesassociated with system disturbances in voltage stability are theprobabilistic methods. The main advantages of the probabilisticmethods are their ability to combine severity and likelihood totruly express the system risk [8], [9]. Furthermore, several dis-turbances caused by voltage instability problems have been re-ported in the literature [2], [5]. These events have motivated thedevelopment of tools to quantify the VIR. This interest in eval-uating the VIR has resulted in several papers related to VSPA[10]–[16].
In [10], the nonlinear OPF [4] and the MCSM are combinedto assess the impact of the voltage instability problems on the re-liability indices based on load curtailments. The nonlinear OPFwas used to evaluate the amount of load curtailment requiredto restore the solvability of the power flow equations. Conse-quently, all solvable states are considered as stable states. Dueto this, the method proposed in [10] cannot identify voltage in-stability problems caused by controllability loss.
An approach for carrying out a reliability evaluation of bulkpower systems with voltage stability constraints is proposed in[11]. This approach is based on the combination of the BisectionMethod with the L index [17]. The Bisection Method is used todetermine the load curtailment necessary to satisfy a target valuefor the VSM estimated by the L index. Nevertheless, the L indexcan estimate the VSM only for load buses. However, voltageinstability problems caused by controllability loss occur morefrequently in buses with reactive power generation [5]. Due tothis, the L index cannot accurately identify voltage instabilitystates caused by controllability loss problems.
In [12], the impact of voltage stability constraints on the reli-ability indices is assessed using a linear OPF model and voltagelimit curves. These curves are obtained for a critical contingencylist which refers to voltage stability problems. If a selected con-tingency in the adequacy assessment belongs to a critical contin-gency list then the voltage stability operation curves for this con-
tingency are converted in linear constraints. Then, these linearconstraints are added to the linear OPF used to simulate cor-rective actions. The main problem with this approach is thatunstable states are deterministically selected. That is, unstablestates associated with noncritical contingencies cannot be iden-tified. It is because the adequacy assessment of a sampled stateis carried out without considering voltage and reactive issues.That is, the nonlinear nature of the voltage stability phenomenais ignored for noncritical contingencies.
The VIR for the system and load buses is evaluated in [13].In this paper, the L index is again used to identify voltage insta-bility states based on a threshold for the VSM. Consequently,the indices evaluated in [13] have the same problems of thoseobtained in [11].
In [14], an approach is proposed for evaluating the VIRand the expected VSM considering uncertainties associatedwith the load forecasting error. These probabilistic indiceshave been estimated using two techniques: the MCSM and theTangent Vector Method [18]. An important contribution of [14]is the evaluation of VSM for a specified risk level. However,the methodology proposed in this reference can be extendedto include the following issues in VSPA: 1) the evaluation ofVIR index considering unstable states caused by controllabilityloss problems; 2) the severity assessment of the unsolvablestates, that is, the identification of the unsolvable states thatcan be restored with no load curtailment; and 3) outages intransmission and generation equipments.
A methodology based on the state enumeration method is pro-posed in [15] to estimate the VIR index. In this paper an unstablestate is identified when the difference between the maximumand the current system loadings is the negative. The maximumsystem loading for each selected state is evaluated using a con-tinuation power flow [7]. Consequently, voltage instability prob-lems associated with power flow unsolvability can be correctlyidentified. Nevertheless, only four single transmission outagesare considered in the computation of the VIR index. Further-more, the method proposed in [15] does not take two importantissues relating to the VSPA index into consideration: voltage in-stability problems caused by controllability loss and the severityof the unstable states associated with the power flow unsolv-ability.
Reference [16] presents a method for evaluating reliability in-dices in composite systems taking voltage instability constraintsinto consideration. In this paper, voltage stability constraints areembedded in a corrective actions algorithm, based on nonlinearOPF, using the L index. Due to this, the proposed method in [16]cannot exactly assess the effects of controllability loss problemson the reliability indices.
The VSPA carried out in [10]–[16] is oriented to twoparadigms:
1) assessment of the impact of voltage stability constraints onthe reliability indices [10]–[12], [16];
2) evaluation of the probabilistic indices associated with un-stable states [10], [13]–[15].
At this point, it is important to mention that in both paradigmsdescribed above, the unstable states are identified using two cri-teria: unsolvability of the power flow equations or violation ofthe VSM limit. In other words, the unstable states associated

RODRIGUES et al.: VOLTAGE STABILITY PROBABILISTIC ASSESSMENT IN COMPOSITE SYSTEMS: MODELING UNSOLVABILITY 1577
with controllability loss have not been considered in the VSPA.Nevertheless, controllability loss problems have been reportedin several voltage instability incidents, such as the disturbanceof the South/South-East Brazilian system on April 24, 1997 [5].Therefore, the main aim of this paper is to model both the un-solvability and the controllability loss in the VSPA. This modelis based on the combination of three techniques:
1) MCSM [8], [9]: to consider uncertainties associated withpeak load forecasting errors and equipment unavailability;
2) DMM [5]: to include controllability loss problems in theprobabilistic indices associated with unstable states;
3) nonlinear OPF based on the Interior Point Method [4]: toassess unstable states associated with unsolvability of thepower flow equations.
It is important to mention that the unstable states associatedwith the controllability loss can be also identified using themodal analysis [6]. However, the modal analysis has a compu-tational cost bigger than the one associated with the DMM. Thedisadvantage of the modal analysis is due to the computationof eigenvalues/eigenvectors to assess the voltage stability of asystem bus. On the other hand, the DMM requires only back-ward/forward solutions, with the LU factors of the power flowJacobian matrix, to carry out a nodal voltage stability analysis.The computational cost is critical issues feature in VSPA since alarge number of system states must be assessed to estimate theindices with an acceptable precision. Thus, the DMM was se-lected to identify controllability loss problems in the proposedmethod for VSPA.
The combination of these three techniques has been usedto generate the following probabilistic indices: VIR index,Well-being States probabilities [19]–[21], buses expected VSMindex, the participation factors of the uncertainties, and of thevoltage instability mechanisms on the VIR index. These indiceshave been evaluated by three test systems: two equivalent sys-tems obtained from the Brazilian interconnected power system[22] (STB-65 and STB-107) and a modified version of theIEEE system of 24 buses [23], [24] (MRTS). The tests resultswith these three systems demonstrate that the voltage control-lability loss has significant impact on the probabilistic indicesassociated with unstable states. Furthermore, the proposedmethod accurately identified the areas vulnerable to voltageinstability problems in the test systems. Finally, it must bementioned that the main novelty of the proposed methodologyis the inclusion of unstable states caused by controllability lossin the VIR index computation. In the literature this issue hasnot been considered in previous studies on the VSPA.
The paper is organized as follows: Section II describes theproposed method for carrying out the VSPA. Section III presentsthe two techniques used in the voltage stability analysis: DMMand nonlinear OPF. Section IV establishes the definitions of theproposed indices for the VSPA. The test results are given inSection V. General conclusions are given in Section VI.
II. METHODOLOGY
The voltage stability of an electric network is a function ofparameters such as: load level, generation patterns and networktopology. These parameters are subject to uncertainties asso-ciated with load forecasting errors and component outages. In
this paper, the uncertainties associated with network parame-ters have been included in the VSPA through the MCSM. Inthis method, the probabilistic indices are estimated through thereplication of the system’s random behavior. This replicationis carried out using the probability distributions that model theuncertainties associated with the system components. The mainuncertainties considered in the VSPA are: load forecasting er-rors and lack of availability of equipment. The load forecastinguncertainty can be modeled through a probability distributionwhose parameters are evaluated from past experience and fu-ture considerations. However, the available historical data is notsufficient to identify the type of distribution associated with theload forecast errors. Due to this, the most common practice isto describe the load uncertainty by a normal distribution [25].In this way, it is possible to use a Box-Müller generator [9] tosample a system peak load for each system state selected by theMCSM. Thus, the system peak load is sampled as
where
system peak load for the system state ;
system peak load for the base—case condition;
load forecasting error (standard deviation)expressed as percentage of ;
random number with normal distributionobtained through the Box-Müller generator.
On the other hand, the equipment unavailability was mod-eled considering that the component outages are independentand represented by a two state model. Consequently, the proba-bility of outage is the forced unavailability. Thus, the state of acomponent is sampled as [9]:
1) generate a random number with uniform distribu-tion;
2)
ifif
where
unavailability of the component ;
state of the component in the system state .
The sampling procedure used in this paper can be easily ex-tended to model large scale generation units that operate at re-duced capacity states (derated states). The sampling approachfor multi-state generators is based on the division of the interval
in subintervals whose widths are equal to the derated statesprobabilities. For example, the state sampling for a generatorwith two derated states is carried out as follows [9]:
1) generate a random number with uniform distribu-tion;
2) define the state associated with , shown in the equa-tion at the bottom of the next page. and are

1578 IEEE TRANSACTIONS ON POWER SYSTEMS, VOL. 25, NO. 3, AUGUST 2010
the probabilities of the two derated states associated withgenerator .
The states of the components and the load level are combinedto define a system state as
NC is the number of components and is the th sampledsystem state. The sampling approach described above is usedto generate a sample of the system states. These states are as-sessed in accordance with the flowchart showed in Fig. 1. Themain steps of the assessment of a system state are explained asfollows.
1) Topological Processing: identification of connectivity lossproblems (islanding) caused by circuit outages. That is,the topological processing checks if the original graph ofthe electric network was partitioned in disconnected sub-graphs (islands). In this paper, the topological processingis carried out using graph transversal techniques such asbreadth and depth searches [26].
2) Load/Generation Dispatch: evaluation of the poweroutput of the generators of each island subject to thefollowing constraints: active power balance equation andlimits to the generators power output. In thermal systems,the dispatch is achieved using a merit order list of theincremental costs associated with the generators. Thatis, the generation dispatch in a thermal system is theresult of the minimization of the production costs. Onthe other hand, the generation dispatch of hydroelectricsystems is carried out through the minimization of thesquared Euclidian distance (quadratic deviation) betweenthe generators power output and a specified generationpattern. This pattern is determined in the short term (daily)scheduling of the hydroelectric plants [27]. Along with thedispatch, it may be necessary to carry out load curtailmentto eliminate generation deficit in some system states.
3) Data Compilation for the Power Flow Study: data pre-processing required for a power analysis of the sampledstate. This step is associated with the following tasks: def-inition of the buses types (PV, PQ, and ), evaluationof the Mvar limits in buses with reactive power genera-tion, elimination of isolated buses and unfeasible islands(islands without load and generation), etc. At this point, itmust be mentioned that the data compilation for the powerflow analysis defines one slack bus for each island [28],[29]. This approach eliminates the singularity of the Jaco-bian matrix caused by the connectivity loss of the electricnetwork [30]. Consequently, it is possible to carry out a
single power flow analysis for a system state composed ofseveral islands.
4) Power Flow: evaluation of the nodal voltages for the sam-pled state using the Newton–Raphson Algorithm.
5) Solvability Restoration with Nonlinear OPF: elimina-tion of nonconvergence cases of the Newton–Raphson Al-gorithm using a nonlinear OPF. The SRPFE is performedto analyze the severity of the voltage instability states asso-ciated with the unsolvability of the power flow equations.This information is very important for the system opera-tors since it permits the identification of whether there arestates in which the unsolvability can be eliminated withoutload curtailment or not.
6) Voltage Stability Analysis with DMM: voltage stabilityassessment of the sampled state using the DMM. Themain aim of this step is the identification of unstable statescaused by controllability loss problems.
It should be mentioned that the load/generation dispatch inhydroelectric systems is associated with a convex separablequadratic optimization problem. The problem has only oneequality constraint (active power balance equation). Conse-quently, it is possible to apply the economic dispatch algorithmdescribed in [31] to solve the minimum deviation dispatch. Itis then necessary to define a fictitious cost function for eachpower plant. The cost function is given by
where
, , and are the coefficients of the cost function associatedwith the plant ;
, , , and are: the cost function, the outputpower, the relative weight and the specified generation for theplant , respectively.
Furthermore, it can be noted that the steps 1)–4) of theAPET algorithm are similar to the violations (overloads, over-voltages, undervoltages, etc.) identification process carried outin composite reliability studies [28], [29]. The main differencebetween reliability and APET algorithms is that the correctiveactions simulation (used in reliability studies to evaluate theamount of load curtailment due to violations in operationalconstraints) is replaced by the voltage stability assessment of a
ifififif

RODRIGUES et al.: VOLTAGE STABILITY PROBABILISTIC ASSESSMENT IN COMPOSITE SYSTEMS: MODELING UNSOLVABILITY 1579
Fig. 1. Flowchart of the proposed method for VSPA.
selected state. In this way, composite reliability programs canbe easily expanded to incorporate the APET method proposedin this paper.
The sample of system states assessed with the DMM and bythe SRPFE algorithm may be used to estimate probabilistic in-
dices. These indices are evaluated using the sample average def-inition:
whereinumber of system states;
mean value of the index ;
value of the test function associated with theindex in the state . For example, if theestimated index is the LOLP, thenwhen is a failed state (if there is loadcurtailment in the state ), andotherwise.
The uncertainty of the estimate obtained with theMCSM may be assessed by means of the coefficient of varia-tion [9], [32]. This coefficient is given by
where
whereestimated variance of the index ;
estimated standard deviation of the index .
In this paper, the coefficient of variation has been used as a stop-ping rule for the MCSM. However, the maximum number ofsimulations is used as safeguard criterion to avoid an inordinatenumber of simulations being carried out when a specified pre-cision is very small.
III. VOLTAGE STABILITY OF A SAMPLED STATE
A. DMM
In this paper the DMM [5] is used to identify whether a statehas voltage instability problems caused by the controllabilityloss. This method is based on the linearized system of the powerflow equations:
(1)
Putting the equations related to the bus in the bottom of (1):
(2)

1580 IEEE TRANSACTIONS ON POWER SYSTEMS, VOL. 25, NO. 3, AUGUST 2010
where the submatrices , , , and are originated from apartition of full Jacobian matrix . Assuming an incrementalvariation and only in bus under analysis
, it is possible to eliminate the coupling betweenand through a Kron reduction. Applying
this procedure in system (2) it gives
(3)
where
The (3) expresses the sensitivity relationships between thevoltage and the power injections in bus considering the wholesystem. From the determinant of matrix, it can be concludedthat [5]:
1) : bus is operating in the stable region of thePV curve (upper half);
2) : bus is operating in the unstable regionof the PV curve (lower half), that is, the bus has voltageinstability problems caused by controllability loss;
3) : bus is operating in the maximum loadingpoint (“tip of the nose”).
The D’ matrix can be used to obtain an estimate of the VSMfor the bus . It is obtained by the association of a two-bus equiv-alent system with the D’ matrix for the bus . The derivation ofthe equivalent system is based on the following characteristicsin common between the matrices D’ and the Jacobian matrix ofa two-bus system: order 2 2 and elements expressing the samesensitivity relationships. Consequently, it is possible to obtain atwo-bus equivalent system from the equality between D’ matrixand the Jacobian matrix of the equivalent system . The hy-pothesis results in the following equation system:
(4)
where:
voltage magnitude in bus 2of the equivalent system;
, , and elements of thematrix for bus ;
diagonal element of the nodalconductance susceptibilitymatrix associated with bus 2in the equivalent system;
net active (reactive) powerinjection in bus 2 of theequivalent system.
The equation system (4) has the following characteristics:1) Four equations: , , , and
;2) Five unknowns variables: , , , , and ;3) Undetermined since the number of equations is lower than
the number of unknown variables;4) Nonlinear because of the product terms such as
in the equation .Due to the characteristics above it is not possible to obtain
the equivalent system parameters using direct methods for thesolution of linear systems. This difficult can be overcome con-sidering that the voltage in the bus 2 of the equivalent system isequal to the voltage in the bus of the multi-node system:
(5)
This simplification is acceptable because the voltages in theinternal and boundary buses of an equivalent network are equalto their respective values in the original network. In this way, itis possible to simplify the system (4) by the substitution ofwith :
(6)
The equation system (6) has four unknowns variables ( ,, , and ) and four equations ( ,, , and ). Furthermore, the nonlinear
terms were eliminated because is obtained from the powerflow solution for the multi-node system. Consequently, it is pos-sible to estimate the equipment system parameters through thelinear systems shown in (7) and (8) at the bottom of the page.
The solution of (7) and (8) gives
(7)
(8)

RODRIGUES et al.: VOLTAGE STABILITY PROBABILISTIC ASSESSMENT IN COMPOSITE SYSTEMS: MODELING UNSOLVABILITY 1581
At this point, it must be mentioned that the voltage in bus1 (slack bus) of the equivalent system still had not been deter-mined. The procedure used to estimate the voltage in bus 1 ispresented in the Appendix.
The determinant of the matrix can be used to estimate aVSM for bus since . Consequently, det[D’] is givenby (9) at the bottom of the page.
Multiplying the right and left sides of (9) by [5] and re-membering, from (5), that results in [5]
(10)
where ,
From (10) it may be concluded that:1) : when (stable region);2) : when (unstable region
associated with controllability loss);3) : when (maximum loading
point).Consequently, the term can be used to define a
VSM to bus as:1) :
;2) :
.Using as base in the unstable region it avoids the margin
going to as in this region [33]. The marginhas the following interpretations [5]:
1) in the stable region: it is the amount of apparent powerthat should be added to bus 2 of the equivalent system toachieve the ;
2) in the unstable region: it is the amount of apparent powerthat should be withdrawn from bus 2 of the equivalentsystem to achieve the .
It is to be noticed that is not necessary to evaluate the bus 1voltage to estimate the VSM for the bus , as (9) and (10) are in-dependent of the bus 1 voltage. However, the existence of a fea-sible slack bus voltage guarantees the coherence of the equiva-lent system identification procedure. The procedure to estimatethe bus 1 voltage of the equivalent system is presented in theAppendix.
B. Nonlinear OPF
The SRPFE task is performed by the minimization of thepower curtailments in the load buses subject to the followingconstraints: active and reactive power balance equations, limitson the active and reactive power generations and specifiedranges for the voltages in a bus with reactive power generation.In this nonlinear OPF problem, the following control actionshave been used for the SRPFE: active generation redispatch,voltage resetting in buses with reactive power generation andload curtailment (as a last resource).
The nonlinear OPF problem has been solved using the Inte-rior Point Algorithm proposed in [34]–[36]. The Interior PointMethod has the following advantages regarding SLP and SQP:
1) it is not necessary to attain the feasibility of the nonlinearequality constraints (power flow balance equations) at theintermediate iterations of the Interior Point Method as re-quired in the SLP. This characteristic is of vital importancein the SRPFE;
2) the Interior Point Method often (but not always) outper-forms active set methods, such as SQP, in large scale ap-plications [37].
Finally, it should be mentioned that the main advantage ofusing the nonlinear OPF to solve the SRPFE problem is theability of this approach to identify whether it is necessary tocarry out load curtailments to eliminate the unsolvability. Theidentification is not possible when the solution of the SRPFE isbased on the Continuation Power Flow method [7], because theload and the generation are simultaneously reduced or increasedin each predictor/corrector step.
System states with heavy load conditions or high levels of re-active power may result in convergence problems for the OPFalgorithm used in the RESFLUP. These nonconvergence prob-lems of the OPF algorithm are overcome using the followingstrategies:
1) Restart of the OPF algorithm with a safeguard parameterset for the Interior-Point Method. For example, the steplength of the Interior-Point Method is reduced when thereis a convergence failure of the RESFLUP algorithm.
2) Enlargement of the voltage ranges for PV and buses.This strategy is very efficient to eliminate infeasibilityproblems caused by high levels of reactive power. In these
(9)

1582 IEEE TRANSACTIONS ON POWER SYSTEMS, VOL. 25, NO. 3, AUGUST 2010
cases, the terminal voltages in reactive generation busestend to increase.
Finally, it is important to mention that there are system statesin which the OPF convergence problems are untreatable. Thesestates are banned of the system states sample used to estimatethe probabilistic indices.
IV. PROPOSED INDICES FOR VSPA
The proposed method for VSPA (see Section II) has been usedto evaluate the following indices: VIR, expected nodal VSM,and Well-Being states probabilities. The Well-Being analysishas the objective of establishing a link between probabilisticanalysis and power system operation, which traditionally hasbeen dominated by deterministic criteria such as the N-1. Thislink is based on the definition of Well-Being states, which aresimilar to the states used in the power system security assess-ment [38]. Therefore, system operators who are used to the de-terministic approaches may easily interpret Well-Being indices,which embed probabilistic information in accepted determin-istic criteria [19]–[21]. In this paper, the deterministic criterionused to define Well-Being states is the occurrence of voltage in-stability problems. This criterion was chosen because it has beenused by the Brazilian independent system operator in voltage se-curity studies [39]. With the established criterion, it is possibleto define the following Well-Being states:
1) Health state: the power equations have a so-lution and , where
, is the VSM
for bus in the state , is the minimum VSM forall the buses in the state and is the set ofPQ (PV) buses;
2) Marginal state: the power flow equations have a solutionand ;
3) Emergency state: the power flow equations have no solu-tion. However, the solvability restoration may be obtainedwithout load curtailment;
4) Collapse state: the power flow equations have no solu-tion and load curtailment is necessary for the solvabilityrestoration.
The probabilistic indices cited above have the following testfunctions:
1) VIR
ifotherwise
where is the set of unsolvable states.2) Nodal expected VSM
3) P(Health)
ifotherwise.
Fig. 2. Well-Being states used in VSPA.
4) P(Marginal)
ifotherwise.
5) P(Emergency)
ifotherwise
where is the load curtailment toleranceand is the total load curtailment required
for SRPFE in the state .6) P(Collapse)
ifotherwise.
From the test functions defined above, it may be concludedthat:
1) The voltage instability problems caused by unsolvabilitycan be considered more severe than those associated withcontrollability loss. This assumption is also used in the con-tingency ranking for voltage stability assessment [40];
2) The Well-Being states are defined in accordance with theseverity of the voltage instability mechanisms, that is: con-trollability loss and unsolvability. The Well-Being states inascending order of severity are shown in Fig. 2;
3) The nodal VSM is evaluated only for solvable states. Theconstraint is due to the operation point, obtained by theSRPFE algorithm (nonlinear OPF), being associated with anew load/generation pattern. Consequently, the VSM eval-uated after the SRPFE has no association with the distancebetween the solvability boundary and the original infea-sible operation point. Furthermore, it should be remem-bered that unsolvable states are considered more criticalthan those with controllability loss. Due to this, there is nosense in evaluating the expected nodal VSM for states withunsolvability problems.
V. TEST RESULTS
The results obtained with the proposed method for the VSPAare presented in this section. The models and techniques de-scribed in the previous sections have been applied to three test

RODRIGUES et al.: VOLTAGE STABILITY PROBABILISTIC ASSESSMENT IN COMPOSITE SYSTEMS: MODELING UNSOLVABILITY 1583
TABLE ICHARACTERISTICS OF THE TEST SYSTEMS
systems. The following indices have been estimated: VIR, prob-abilities of Well-Being states and expected values of the nodalVSM. The results presented in the following subsections are or-ganized as:
1) Section V-A contains a general description of the test sys-tems;
2) the accuracy and the computational costs of the proposedmethod for the VSPA are discussed in Section V-B;
3) the VSPA based on the system indices: VIR, probabilitiesof the Well-Being states and participation factors in theVIR are presented in Section V-C;
4) in Section V-D it is shown that the expected values of thenodal VSM can be used to identify critical bus and areas inthe VSPA.
A. Characteristics of the Test Systems
The proposed method for the VSPA has been tested inthree test systems: two equivalent systems obtained from theBrazilian interconnected power system [22] (STB-65 andSTB-107) and a modified version of the IEEE system of 24buses [23], [24] (MRTS). The main characteristics of these testsystems are presented in Table I. The reliability data associatedwith the systems BTS-65 and BTS-107 have been obtainedfrom [41].
The BTS-65 is composed of the South and South-Eastareas of the interconnected Brazilian power system, whilethe BTS-107 is composed of the areas of: Mato Grosso, theSouth, and South-East. In these systems the generation ispredominantly hydroelectric, while in the MRTS generation ispredominantly thermal.
The MRTS has been used due to its transmission networksbeing heavily loaded. The Brazilian systems are used becausetheir generation plants are located far from the load centers.Therefore, there are long transmission trunks transporting largeenergy blocks in the two Brazilian systems. Consequently, thethree test systems are suitable for voltage instability studies.
B. Assessment of the Accuracy and Computational Effort
The probabilistic indices used in VSPA have been estimatedunder the following conditions:
1) the load forecasting error is 5.0%;2) outages in circuits, generators, and compensators have
been considered in the VSPA;
TABLE IICOMPUTATIONAL EFFORT TO CARRY OUT THE VSPA IN THE TEST SYSTEMS
3) the pre-specified tolerances for the coefficient of variationin the systems BTS-65, BTS-107 and MRTS are equal to:5.0%, 10.0% and 5%, respectively;
4) is 100 000 for the MRTS and 50 000 for theBrazilian systems;
5) the VSPA is carried out considering a two state model forgeneration failures. This simplification is due to a lack ofdata associated with multi-state models in the Braziliansystems;
6) the relative weights for each power plant of the Braziliansystems are based on the equivalent reactance from the busin which the plant is connected. This procedure is appliedbecause several Brazilian electric energy utilities use theinverse of the equivalent reactances as participation factorsin the hydroelectric dispatch.
The computational effort (number of simulations and CPUtime) to carry out VSPA in each test system, considering theconditions 1)-4), is shown in Table II. The results presented inthis table have been obtained using a PC with Intel Core QuadCPU of 2.4 GHz and 3.25 GB of RAM.
From the Table II, it can be concluded that the sample sizerequired estimating a probabilistic index, with a specified preci-sion, is independent of the system size (number of components).For example, the sample size for the MRTS (42 401) is biggerthan the one associated with the BTS-65 (38 529), for a relativeuncertainty of 5%. Nevertheless, the MRTS is about three timesas small as the BTS-65. This effect is due to the number of sim-ulations being evaluated by
where is the specified value for the coefficient of varia-tion. Consequently, indices with large variances and/or smallexpected values demand a huge number of simulations to sat-isfy a specified tolerance. The small expected value of an indexcan be associated with a rare event probability. For example, theexpected value of the marginal state probability in the BTS-107is equal to . Consequently, the sample size re-quired to estimate this probability for a relative uncertainty of5% is
The assessment of a system states sample with 120 856 ele-ments causes a significant increase in the computation time of

1584 IEEE TRANSACTIONS ON POWER SYSTEMS, VOL. 25, NO. 3, AUGUST 2010
TABLE IIICOEFFICIENT OF VARIATION FOR THE PROBABILISTIC INDICES (IN PERCENTAGE)
TABLE IVROOT CAUSE ANALYSIS OF THE VIR BASED ON THE SYSTEM UNCERTAINTIES
the APET for large scale systems. Due to this, a relative uncer-tainty of 10% has been used for the MCSM in the BTS-107. Thisprocedure did not reduce the accuracy of any indices estimatedfor the BTS-107 because their expected values are bigger thanP(marginal). The estimated values of for the probabilistic in-dices evaluated for the three test systems are shown in Table III.In this table, the associated with the expected value of thenodal VSM is equal to the maximum of the VSM for allsystem buses.
From Table III, it can be concluded that the convergence ofthe MCSM is dominated by the probabilities of the Well-Beingstates. For example, the maximum relative uncertainties for thesystems MRTS, BTS-65, and BTS-107 are associated with thefollowing indices: P(Marginal), P(Collapse), and P(Marginal),respectively. This characteristic is due to probabilities of thesestates have the smallest expected values among the estimatedindices.
C. VIR and Probabilities of the Well-Being States
The VIR for the systems MRTS, BTS-65, and BTS-107 are,respectively, 26.3484%, 16.6446% ,and 16.8179%. These re-sults demonstrate that the VIR for the three test systems is verylarge. However, the causes of the high risk values are not thesame for the three test systems. This fact can be demonstratedthrough the evaluation of the participation factors of the uncer-tainties in the VIR. That is, the percentage of each type of un-certainty in the VIR. These participation factors allow carryingout a root cause analysis of the VIR oriented for the system un-certainties. The participation factors of the uncertainties in theVIR are presented in Table IV.
From Table IV, it can be concluded that:1) the unstable states of the MRTS and BTS-107 systems
are mainly caused by generator failures. This effect maybe caused by the existence of a deficiency in the reac-tive power generation reserve. Consequently, there are notenough Mvar resources to correct the voltage profile in thecontingency states;
TABLE VPROBABILITIES OF THE WELL-BEING STATES
TABLE VIPARTICIPATION FACTORS OF THE UNSTABLE WELL-BEING STATES ON THE VIR
2) in BTS-65, the main cause of the voltage instability prob-lems is the load forecasting error. This result is an indica-tive that the current operating point in the BTS-65 corre-sponds to a heavily load condition. Consequently, smallfluctuations in the system peak load result in voltage in-stability scenarios;
3) the system where the transmission failures have more im-pact on the VIR is the BTS-65. Thus, it may be necessaryreinforcements in the transmission network.
The VSPA of the test systems has also been carried outusing Well-Being indices. They allow a voltage stabilityanalysis based on the instability mechanisms. Furthermore,the Well-Being analysis also enables the identification ofunsolvable states which can be restored without using loadcurtailment. The probabilities of the Well-Being states for thethree test systems are presented in Table V. They can be usedto estimate the participation factors of the unstable Well-Beingstates (Marginal, Emergency, and Collapse) on the VIR. That is,it is possible to use the probabilities of the unstable Well-Beingstates to carry out a root cause analysis of the VIR oriented forthe voltage instability mechanisms. The participation factorsof the Marginal, Emergency, and Collapse states are shown inTable VI.
From Tables V and VI, it can be stated that:1) the emergency state is the most likely state in the MRTS
and BTS-107 systems. In other words, in these systems themain cause of the voltage instability is the unsolvability.This fact is also demonstrated by the participation factors.The participation factors of the emergency state for thesystems MRTS and BTS-107 are equal to 91.3802% and90.3884%, respectively. That is, the largest participationfactors of the emergency are associated with the systemsMRTS and BTS-107;
2) the maximum value of the probability of occurrence of themarginal state is associated with the BTS-65 system. Dueto this, the largest participation factor of the marginal stateoccurs in the BTS-65 system (86.4026%). That is, in theBTS-65 the unstable states are mainly caused by the con-trollability loss;
3) the participation factors associated with the collapse stateare small for the three systems. For example, the maximum
RODRIGUES et al.: VOLTAGE STABILITY PROBABILISTIC ASSESSMENT IN COMPOSITE SYSTEMS: MODELING UNSOLVABILITY 1585
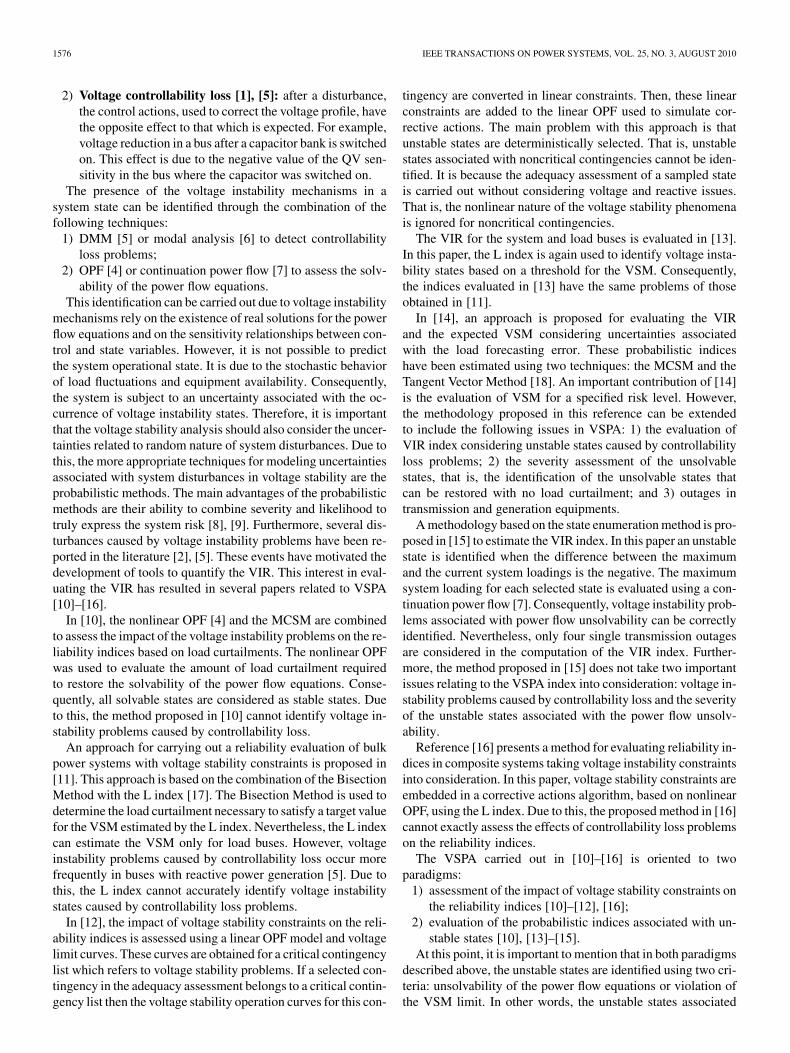
TABLE VIIEFFICIENCY OF THE CONTROL ACTIONS USED IN THE SRPFE
value of the participation factor, associated with the col-lapse state, for the test systems is equal to 7.6501%. Con-sequently, even in the most unsolvable states it is possibleto restore a solution without using load curtailment. There-fore, the unsolvability of the power flow equations for thethree systems is not too severe.
Additionally, it is also important to assess the efficiency ofthe control actions used for the SRPFE. This assessment may becarried out by the evaluation of the participation factors of theunsolvable Well-Being States (Emergency and Collapse) withreference to the probability of unsolvability. These participationfactors are presented in Table VII for the three test systems.
In Table VII, it can be observed that the generation redis-patch and the voltage set-point resetting in PV and buses arehighly efficient in eliminating the unsolvability problems in theMRTS and BTS-107 systems. For example, the minimum valueof the participation factor associated with the emergency statein these systems is equal to 92.1969%. That is, the maximumpercentage of unsolvable states which require load curtailmentsin the SRPFE is 7.8031%. On the other hand, the corrective ac-tions used in the SRPFE are efficient in 54.5872% in the BTS-65system. Consequently, the unsolvability of the power flow equa-tions is more severe in this system.
Finally, it should be mentioned that there are system states un-dergoing controllability loss after the SRPFE. This result is dueto the lack of voltage stability constraints in the OPF algorithmused to carry out the SRPFE. Consequently, a restored solutionby the OPF algorithm may have controllability loss problems.That is, the solution obtained by the SRPFE algorithm is in theunstable region (lower half) of the PV curve. The probabilitiesof a state having unsolvability and voltage controllability lossproblems for the MRTS, BTS-65, and BTS-107 systems are,respectively, 0.0684%, 2.0945%, and 4.9682%. From these re-sults, it can be noted that the probability of occurrence of thetwo voltage instability mechanisms is significant in the Braziliansystems. For example, the minimum value of this probability inthe BTS-65 and BTS-107 systems is 2.0945%.
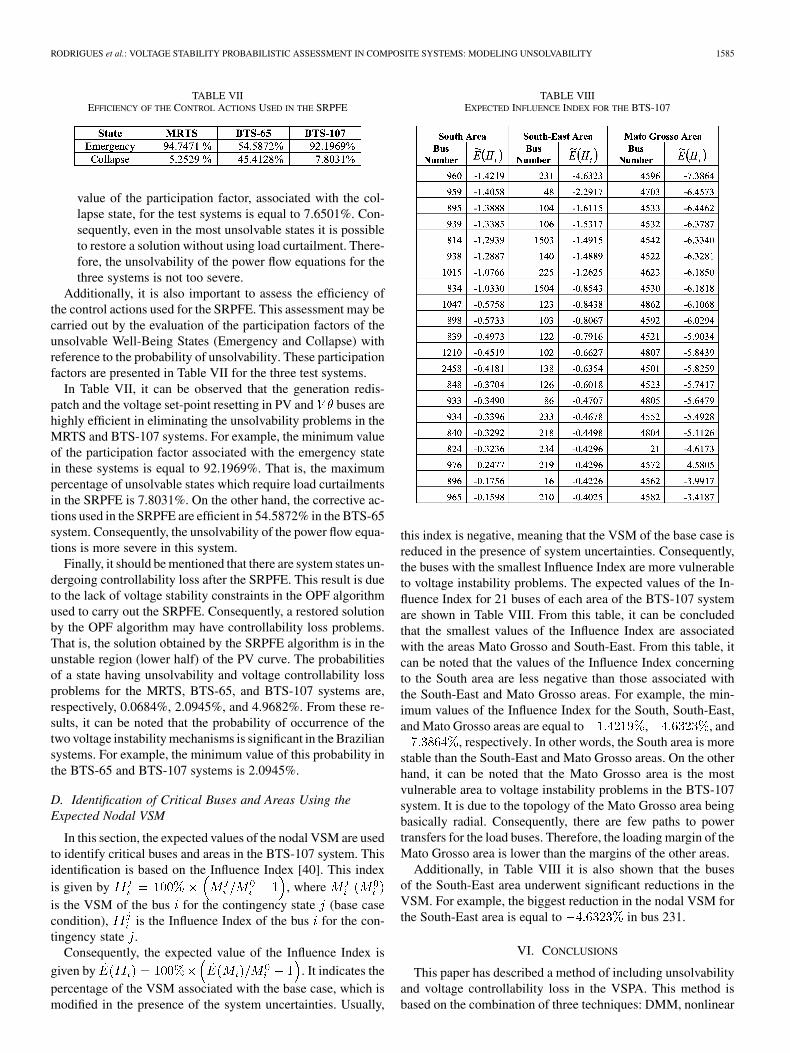
D. Identification of Critical Buses and Areas Using theExpected Nodal VSM
In this section, the expected values of the nodal VSM are usedto identify critical buses and areas in the BTS-107 system. Thisidentification is based on the Influence Index [40]. This indexis given by , whereis the VSM of the bus for the contingency state (base casecondition), is the Influence Index of the bus for the con-tingency state .
Consequently, the expected value of the Influence Index isgiven by . It indicates thepercentage of the VSM associated with the base case, which ismodified in the presence of the system uncertainties. Usually,
TABLE VIIIEXPECTED INFLUENCE INDEX FOR THE BTS-107
this index is negative, meaning that the VSM of the base case isreduced in the presence of system uncertainties. Consequently,the buses with the smallest Influence Index are more vulnerableto voltage instability problems. The expected values of the In-fluence Index for 21 buses of each area of the BTS-107 systemare shown in Table VIII. From this table, it can be concludedthat the smallest values of the Influence Index are associatedwith the areas Mato Grosso and South-East. From this table, itcan be noted that the values of the Influence Index concerningto the South area are less negative than those associated withthe South-East and Mato Grosso areas. For example, the min-imum values of the Influence Index for the South, South-East,and Mato Grosso areas are equal to , , and
, respectively. In other words, the South area is morestable than the South-East and Mato Grosso areas. On the otherhand, it can be noted that the Mato Grosso area is the mostvulnerable area to voltage instability problems in the BTS-107system. It is due to the topology of the Mato Grosso area beingbasically radial. Consequently, there are few paths to powertransfers for the load buses. Therefore, the loading margin of theMato Grosso area is lower than the margins of the other areas.
Additionally, in Table VIII it is also shown that the busesof the South-East area underwent significant reductions in theVSM. For example, the biggest reduction in the nodal VSM forthe South-East area is equal to in bus 231.
VI. CONCLUSIONS
This paper has described a method of including unsolvabilityand voltage controllability loss in the VSPA. This method isbased on the combination of three techniques: DMM, nonlinear
1586 IEEE TRANSACTIONS ON POWER SYSTEMS, VOL. 25, NO. 3, AUGUST 2010
OPF and MCSM. The results obtained with the proposed ap-proach in the test systems demonstrate that:
1) load forecasting errors may have a significant participationfactor on the VIR;
2) unstable states associated with controllability loss haveconsiderable probability of occurrence;
3) the expected values of the nodal VSM can be used to iden-tify vulnerable buses and areas to voltage instability prob-lems;
4) the SRPFE may result in states with controllability loss;5) the control actions used in the SRPFE have proved to be
very efficient in most of the test systems.
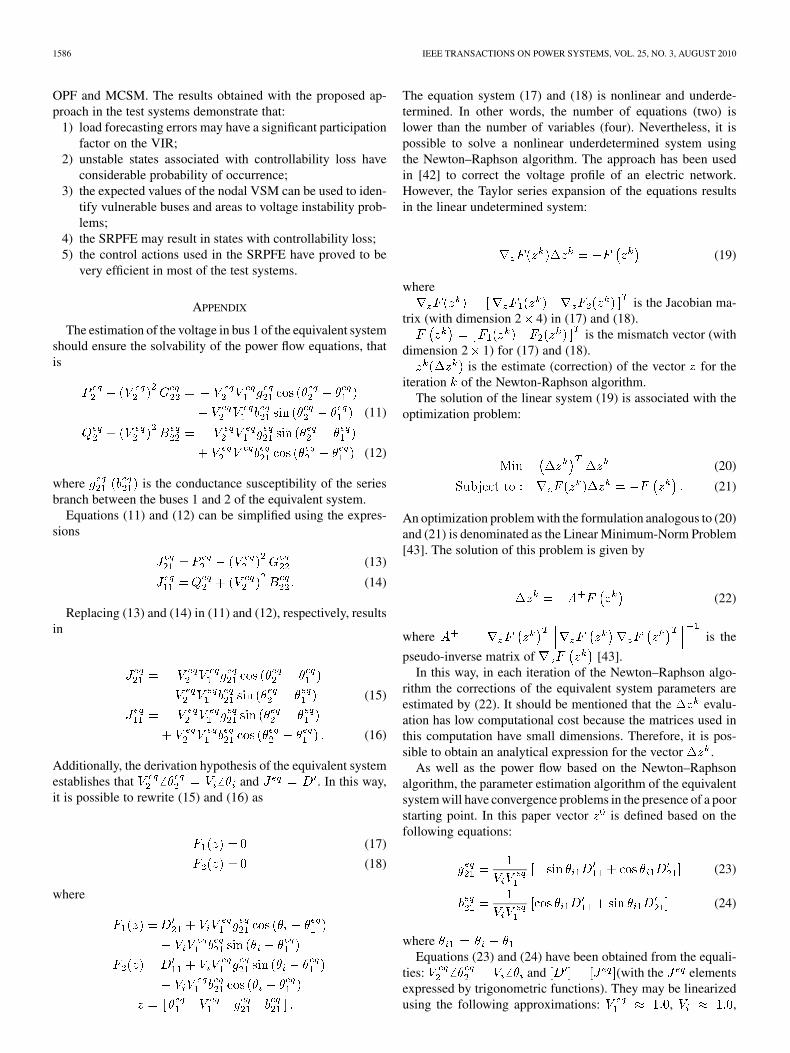
APPENDIX
The estimation of the voltage in bus 1 of the equivalent systemshould ensure the solvability of the power flow equations, thatis
(11)
(12)
where is the conductance susceptibility of the seriesbranch between the buses 1 and 2 of the equivalent system.
Equations (11) and (12) can be simplified using the expres-sions
(13)
(14)
Replacing (13) and (14) in (11) and (12), respectively, resultsin
(15)
(16)
Additionally, the derivation hypothesis of the equivalent systemestablishes that and . In this way,it is possible to rewrite (15) and (16) as
(17)
(18)
where
The equation system (17) and (18) is nonlinear and underde-termined. In other words, the number of equations (two) islower than the number of variables (four). Nevertheless, it ispossible to solve a nonlinear underdetermined system usingthe Newton–Raphson algorithm. The approach has been usedin [42] to correct the voltage profile of an electric network.However, the Taylor series expansion of the equations resultsin the linear undetermined system:
(19)
whereis the Jacobian ma-
trix (with dimension 2 4) in (17) and (18).is the mismatch vector (with
dimension 2 1) for (17) and (18).is the estimate (correction) of the vector for the
iteration of the Newton-Raphson algorithm.The solution of the linear system (19) is associated with the
optimization problem:
(20)
(21)
An optimization problem with the formulation analogous to (20)and (21) is denominated as the Linear Minimum-Norm Problem[43]. The solution of this problem is given by
(22)
where is the
pseudo-inverse matrix of [43].In this way, in each iteration of the Newton–Raphson algo-
rithm the corrections of the equivalent system parameters areestimated by (22). It should be mentioned that the evalu-ation has low computational cost because the matrices used inthis computation have small dimensions. Therefore, it is pos-sible to obtain an analytical expression for the vector .
As well as the power flow based on the Newton–Raphsonalgorithm, the parameter estimation algorithm of the equivalentsystem will have convergence problems in the presence of a poorstarting point. In this paper vector is defined based on thefollowing equations:
(23)
(24)
whereEquations (23) and (24) have been obtained from the equali-
ties: and (with the elementsexpressed by trigonometric functions). They may be linearizedusing the following approximations: , ,
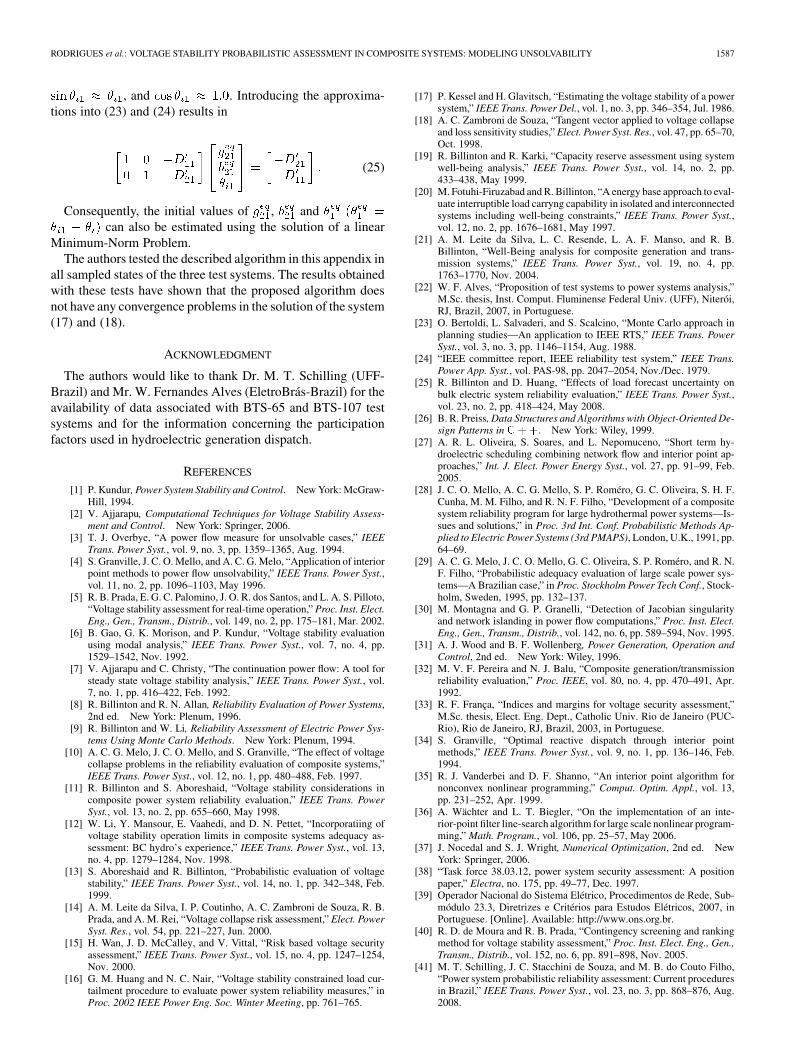
RODRIGUES et al.: VOLTAGE STABILITY PROBABILISTIC ASSESSMENT IN COMPOSITE SYSTEMS: MODELING UNSOLVABILITY 1587
, and . Introducing the approxima-tions into (23) and (24) results in
(25)
Consequently, the initial values of , andcan also be estimated using the solution of a linear
Minimum-Norm Problem.The authors tested the described algorithm in this appendix in
all sampled states of the three test systems. The results obtainedwith these tests have shown that the proposed algorithm doesnot have any convergence problems in the solution of the system(17) and (18).
ACKNOWLEDGMENT
The authors would like to thank Dr. M. T. Schilling (UFF-Brazil) and Mr. W. Fernandes Alves (EletroBrás-Brazil) for theavailability of data associated with BTS-65 and BTS-107 testsystems and for the information concerning the participationfactors used in hydroelectric generation dispatch.
REFERENCES
[1] P. Kundur, Power System Stability and Control. New York: McGraw-Hill, 1994.
[2] V. Ajjarapu, Computational Techniques for Voltage Stability Assess-ment and Control. New York: Springer, 2006.
[3] T. J. Overbye, “A power flow measure for unsolvable cases,” IEEETrans. Power Syst., vol. 9, no. 3, pp. 1359–1365, Aug. 1994.
[4] S. Granville, J. C. O. Mello, and A. C. G. Melo, “Application of interiorpoint methods to power flow unsolvability,” IEEE Trans. Power Syst.,vol. 11, no. 2, pp. 1096–1103, May 1996.
[5] R. B. Prada, E. G. C. Palomino, J. O. R. dos Santos, and L. A. S. Pilloto,“Voltage stability assessment for real-time operation,” Proc. Inst. Elect.Eng., Gen., Transm., Distrib., vol. 149, no. 2, pp. 175–181, Mar. 2002.
[6] B. Gao, G. K. Morison, and P. Kundur, “Voltage stability evaluationusing modal analysis,” IEEE Trans. Power Syst., vol. 7, no. 4, pp.1529–1542, Nov. 1992.
[7] V. Ajjarapu and C. Christy, “The continuation power flow: A tool forsteady state voltage stability analysis,” IEEE Trans. Power Syst., vol.7, no. 1, pp. 416–422, Feb. 1992.
[8] R. Billinton and R. N. Allan, Reliability Evaluation of Power Systems,2nd ed. New York: Plenum, 1996.
[9] R. Billinton and W. Li, Reliability Assessment of Electric Power Sys-tems Using Monte Carlo Methods. New York: Plenum, 1994.
[10] A. C. G. Melo, J. C. O. Mello, and S. Granville, “The effect of voltagecollapse problems in the reliability evaluation of composite systems,”IEEE Trans. Power Syst., vol. 12, no. 1, pp. 480–488, Feb. 1997.
[11] R. Billinton and S. Aboreshaid, “Voltage stability considerations incomposite power system reliability evaluation,” IEEE Trans. PowerSyst., vol. 13, no. 2, pp. 655–660, May 1998.
[12] W. Li, Y. Mansour, E. Vaahedi, and D. N. Pettet, “Incorporatiing ofvoltage stability operation limits in composite systems adequacy as-sessment: BC hydro’s experience,” IEEE Trans. Power Syst., vol. 13,no. 4, pp. 1279–1284, Nov. 1998.
[13] S. Aboreshaid and R. Billinton, “Probabilistic evaluation of voltagestability,” IEEE Trans. Power Syst., vol. 14, no. 1, pp. 342–348, Feb.1999.
[14] A. M. Leite da Silva, I. P. Coutinho, A. C. Zambroni de Souza, R. B.Prada, and A. M. Rei, “Voltage collapse risk assessment,” Elect. PowerSyst. Res., vol. 54, pp. 221–227, Jun. 2000.
[15] H. Wan, J. D. McCalley, and V. Vittal, “Risk based voltage securityassessment,” IEEE Trans. Power Syst., vol. 15, no. 4, pp. 1247–1254,Nov. 2000.
[16] G. M. Huang and N. C. Nair, “Voltage stability constrained load cur-tailment procedure to evaluate power system reliability measures,” inProc. 2002 IEEE Power Eng. Soc. Winter Meeting, pp. 761–765.
[17] P. Kessel and H. Glavitsch, “Estimating the voltage stability of a powersystem,” IEEE Trans. Power Del., vol. 1, no. 3, pp. 346–354, Jul. 1986.
[18] A. C. Zambroni de Souza, “Tangent vector applied to voltage collapseand loss sensitivity studies,” Elect. Power Syst. Res., vol. 47, pp. 65–70,Oct. 1998.
[19] R. Billinton and R. Karki, “Capacity reserve assessment using systemwell-being analysis,” IEEE Trans. Power Syst., vol. 14, no. 2, pp.433–438, May 1999.
[20] M. Fotuhi-Firuzabad and R. Billinton, “A energy base approach to eval-uate interruptible load carryng capability in isolated and interconnectedsystems including well-being constraints,” IEEE Trans. Power Syst.,vol. 12, no. 2, pp. 1676–1681, May 1997.
[21] A. M. Leite da Silva, L. C. Resende, L. A. F. Manso, and R. B.Billinton, “Well-Being analysis for composite generation and trans-mission systems,” IEEE Trans. Power Syst., vol. 19, no. 4, pp.1763–1770, Nov. 2004.
[22] W. F. Alves, “Proposition of test systems to power systems analysis,”M.Sc. thesis, Inst. Comput. Fluminense Federal Univ. (UFF), Niterói,RJ, Brazil, 2007, in Portuguese.
[23] O. Bertoldi, L. Salvaderi, and S. Scalcino, “Monte Carlo approach inplanning studies—An application to IEEE RTS,” IEEE Trans. PowerSyst., vol. 3, no. 3, pp. 1146–1154, Aug. 1988.
[24] “IEEE committee report, IEEE reliability test system,” IEEE Trans.Power App. Syst., vol. PAS-98, pp. 2047–2054, Nov./Dec. 1979.
[25] R. Billinton and D. Huang, “Effects of load forecast uncertainty onbulk electric system reliability evaluation,” IEEE Trans. Power Syst.,vol. 23, no. 2, pp. 418–424, May 2008.
[26] B. R. Preiss, Data Structures and Algorithms with Object-Oriented De-sign Patterns in � ��. New York: Wiley, 1999.
[27] A. R. L. Oliveira, S. Soares, and L. Nepomuceno, “Short term hy-droelectric scheduling combining network flow and interior point ap-proaches,” Int. J. Elect. Power Energy Syst., vol. 27, pp. 91–99, Feb.2005.
[28] J. C. O. Mello, A. C. G. Mello, S. P. Roméro, G. C. Oliveira, S. H. F.Cunha, M. M. Filho, and R. N. F. Filho, “Development of a compositesystem reliability program for large hydrothermal power systems—Is-sues and solutions,” in Proc. 3rd Int. Conf. Probabilistic Methods Ap-plied to Electric Power Systems (3rd PMAPS), London, U.K., 1991, pp.64–69.
[29] A. C. G. Melo, J. C. O. Mello, G. C. Oliveira, S. P. Roméro, and R. N.F. Filho, “Probabilistic adequacy evaluation of large scale power sys-tems—A Brazilian case,” in Proc. Stockholm Power Tech Conf., Stock-holm, Sweden, 1995, pp. 132–137.
[30] M. Montagna and G. P. Granelli, “Detection of Jacobian singularityand network islanding in power flow computations,” Proc. Inst. Elect.Eng., Gen., Transm., Distrib., vol. 142, no. 6, pp. 589–594, Nov. 1995.
[31] A. J. Wood and B. F. Wollenberg, Power Generation, Operation andControl, 2nd ed. New York: Wiley, 1996.
[32] M. V. F. Pereira and N. J. Balu, “Composite generation/transmissionreliability evaluation,” Proc. IEEE, vol. 80, no. 4, pp. 470–491, Apr.1992.
[33] R. F. França, “Indices and margins for voltage security assessment,”M.Sc. thesis, Elect. Eng. Dept., Catholic Univ. Rio de Janeiro (PUC-Rio), Rio de Janeiro, RJ, Brazil, 2003, in Portuguese.
[34] S. Granville, “Optimal reactive dispatch through interior pointmethods,” IEEE Trans. Power Syst., vol. 9, no. 1, pp. 136–146, Feb.1994.
[35] R. J. Vanderbei and D. F. Shanno, “An interior point algorithm fornonconvex nonlinear programming,” Comput. Optim. Appl., vol. 13,pp. 231–252, Apr. 1999.
[36] A. Wächter and L. T. Biegler, “On the implementation of an inte-rior-point filter line-search algorithm for large scale nonlinear program-ming,” Math. Program., vol. 106, pp. 25–57, May 2006.
[37] J. Nocedal and S. J. Wright, Numerical Optimization, 2nd ed. NewYork: Springer, 2006.
[38] “Task force 38.03.12, power system security assessment: A positionpaper,” Electra, no. 175, pp. 49–77, Dec. 1997.
[39] Operador Nacional do Sistema Elétrico, Procedimentos de Rede, Sub-módulo 23.3, Diretrizes e Critérios para Estudos Elétricos, 2007, inPortuguese. [Online]. Available: http://www.ons.org.br.
[40] R. D. de Moura and R. B. Prada, “Contingency screening and rankingmethod for voltage stability assessment,” Proc. Inst. Elect. Eng., Gen.,Transm., Distrib., vol. 152, no. 6, pp. 891–898, Nov. 2005.
[41] M. T. Schilling, J. C. Stacchini de Souza, and M. B. do Couto Filho,“Power system probabilistic reliability assessment: Current proceduresin Brazil,” IEEE Trans. Power Syst., vol. 23, no. 3, pp. 868–876, Aug.2008.

1588 IEEE TRANSACTIONS ON POWER SYSTEMS, VOL. 25, NO. 3, AUGUST 2010
[42] R. Travassos, “Voltage profile correction through a power flow algo-rithm with reactive implicit coupling,” M.Sc. thesis, Elect. Eng. Dept.,Catholic Univ. Rio de Janeiro (PUC-Rio), Rio de Janeiro, RJ, Brazil,1992, in Portuguese.
[43] A. Monticelli, State Estimation in Electric Power Systems: A General-ized Approach. Norwell, MA: Kluwer, 1999.
Anselmo Barbosa Rodrigues received the first andM.Sc. degrees in electrical engineering from FederalUniversity of Maranhão (UFMA), São Luís, Brazil,in 1998 and 2003, respectively. He is pursuing thePh.D. degree in electrical engineering at PontificalCatholic University of Rio de Janeiro, Rio de Janeiro,Brazil.
His primary research interest is reliability assess-ment in composite and distribution systems.
Ricardo B. Prada was born in 1951. He receivedthe diploma in electrical engineering and the M.Sc.degree in power systems from the Pontifical CatholicUniversity of Rio de Janeiro, Rio de Janeiro, Brazil,in 1975 and 1977, respectively, and the Ph.D. degreein electrical engineering from Imperial College ofScience and Technology, London, U.K., in 1980.
He is an Associate Professor in the Departmentof Electrical Engineering, Pontifical Catholic Univer-sity of Rio de Janeiro, Rio de Janeiro, Brazil.
Maria Da Guia da Silva (M’99) received the B.Sc.and M.Sc. degrees in power engineering from Fed-eral University of Paraiba, Paraiba, Brazil, in 1980and 1986, respectively, and the Ph.D. degree in powerengineering from the University of Manchester Insti-tute of Science and Technology, Manchester, U.K., in1994.
She is an Associate Professor in the Departmentof Electrical Engineering, Federal University ofMaranhão, São Luís, Brazil. Her primary researchinterest is the modeling and application of proba-
bilistic techniques for power system problems, particularly those concernedwith reliability and power quality.