voltammetric determination of low-molecular-weight sulfur compounds in hydrothermal vent fluids –...
TRANSCRIPT
Full Paper
Voltammetric Determination of Low-Molecular-Weight SulfurCompounds in Hydrothermal Vent Fluids – Studies with HydrogenSulfide, Methanethiol, Ethanethiol and PropanethiolDaiane Dias,a Paulo C. do Nascimento,a* Cristiane L. Jost,a Denise Bohrer,a Leandro M. de Carvalho,a
Andrea Koschinskyb
a Departamento de Qu�mica, Universidade Federal de Santa Maria, C. P. 5051, 97105-970 Santa Maria – RS, Brazilb School of Engineering and Science, Geosciences and Astrophysics, Jacobs University Bremen GmbH, P. O. Box 750561,
D-28725 Bremen, Germany*e-mail: [email protected]
Received: September 23, 2009Accepted: December 18, 2009
AbstractDetermination of sulfide compounds in hydrothermal vent fluid samples was performed by DPCSV. The methodologywas applied to speciate sulfides via primitive and first-derivative curve interpretation. Hydrogen sulfide,methanethiol, and propanethiol were simultaneously assayed in samples containing no ethanethiol. In the presenceof ethanethiol, the organic sulfides were determined without speciation. Sulfides were determined in an acidicelectrolyte, and detection limits ranging from 0.1 to 1.1 mmol L�1 were calculated. The method was tested in realhydrothermal vent fluid samples, with recoveries ranging from 86.9% (R – SH) to 115.3% (H2S). Interference of themetallic species present in seawater was investigated.
Keywords: Sulfide speciation, Stripping voltammetry, Hydrothermal vent fluids, Sulfur
DOI: 10.1002/elan.200900472
1. Introduction
Sulfur compounds are major constituents of volcanic gasesand magmatic-hydrothermal vent fluids. Due to the largenumber of oxidation states of sulfur, the element partic-ipates in quite a large variety of chemistries, including sulfurorganic compounds. Thiols of small carbon chains such asmethanethiol (MtSH), ethanethiol (EtSH) and propane-thiol (PrSH) are the simplest sulfur organic compounds,which participate in many chemical and biochemical trans-formations. Sulfur compounds are responsible for theclimatic effect of major volcanic eruptions as well as forthe transport and precipitation of metals during theformation of magmatic-hydrothermal ore deposits. Theunderstanding of the complex role of free sulfides (H2S, HS�
and S2�) and organic sulfides in hydrothermal systemsdepends on the development of sensitive and selectiveanalytical methods adaptable to on-ship measurements. Incommon practice, sulfur-containing samples are mixed intozinc acetate solutions to preserve the sulfides as the stablezinc sulfide for later analysis. However, the speciationanalysis is normally impaired by this strategy. Sulfurspeciation studies including short and long chain com-pounds have been undertaken by gas and liquid chroma-tography [1 – 4], by spectroscopic methods [5, 6] and byelectrochemical methods including potentiometry [7, 8] andvoltammetry [4 – 6, 8 – 14]. For low-molecular-weight S-
compounds, speciation and direct determinations are main-ly restricted to voltammetric and gas chromatographicmethods. The latter are particularly appropriate for theanalysis of gas streams, while the former can be used foranalysis in aquatic systems mainly in the presence of salinematrices. For studies in hydrothermal systems, the equip-ment portability for on-ship measurements, the possibilityof simultaneous determinations with high sensitivity in shorttime intervals and particularly the capability of measure-ments in saline samples are mandatory. Voltammetry fulfillsthese requirements, and the present paper is a contributionto assaying low-molecular-weight S-compounds in hydro-thermal vent fluids. The determination of H2S, MtSH, EtSHand PrSH (generically termed “sulfides”) was investigatedby differential pulse cathodic stripping voltammetry(DPCSV) in an acidic supporting electrolyte, directly onthe samples without sample stabilization by sulfide precip-itation. Although inorganic sulfide has already been assayedby voltammetry in saline matrices [15 – 17], no studiesreported speciation between inorganic and low-molecular-weight organic sulfides in saline samples using acidicsupporting electrolyte to improve the peak resolution.
The ubiquity of sulfur in hydrothermal environments, aswell as the reported presence of thiols in various hydro-thermal experiments, indicates that thiols are central tohydrothermal geochemistry [18]. In the absence of directmeasurements, the role of thiols in hydrothermal chemistry
Full Paper
1066 � 2010 Wiley-VCH Verlag GmbH & Co. KGaA, Weinheim Electroanalysis 2010, 22, No. 10, 1066 – 1071
was already assessed by their thermodynamic properties[18, 19]. Given the abundance of CO and CO2 in hydro-thermal vent fluids, they can be considered as carbonsources during the synthesis of thiols in hydrothermalsystems. Reactions between sulfur-bearing mineral assemb-lages (e.g., pyrite and pyrrhotite) can produce H2S, a sourceof sulfur, and H2, which acts as a reductant in the formationof thiols from CO and CO2 [18, 20] according to:
CO(aq)þH2S(aq)þ 2H2(aq)!CH3SH(aq)þH2O
CO2(aq)þH2S(aq)þ 3H2(aq)!CH3SH(aq)þ 2H2O
Similarly to MtSH, longer-chained thiols can also be formedby the same reaction.
2. Experimental
2.1. Instrumentation and Apparatus
Stripping measurements were made on a Metrohm (Her-isau, Switzerland) Model 646 VA processor/Model 675 VAsample changer in Hanging Mercury Drop Electrode(HMDE) mode. An accumulation time of 30 s was used,and voltammograms were recorded in the potential rangebetween 120 and�350 mV, with a scan rate of 10 mV s�1 andpulse amplitude of �50 mV. All potentials were measuredagainst a Ag/AgCl, KCl 3 mol L�1 reference electrode, andthe voltammetric cell volume was 10 mL. A Hewlett-Packard diode array UV-visible spectrophotometer (HP-8453 A) was used for spectrophotometric measurements inthe wavelength range of 220 to 800 nm with spectralresolution of 1 nm and 1 cm path-length quartz spectropho-tometric cells.
2.2. Reagents and Solutions
Standard solutions of inorganic sulfide (S�2) were preparedby dilution of a stock sodium sulfide solution (0.5 mol L�1 inNaOH 0.05 mol L�1) and were iodometrically standardized[21].
Standard solutions of MtSH were prepared from thedissolution of pure gas (Union Carbide Corporation) in0.05 mol L�1 NaOH and were iodometrically standardized[21]. Standard solutions of EtSH and PrSH were preparedfrom the dissolution of analytical-grade reagent (Sigma,USA) in 0.05 mol L�1 NaOH. The supporting electrolytewas a 0.05 mol L�1 hydrazine solution (pH 2.3) prepared byproper dissolution of the reagents in demineralized water(Milli-Q system).
2.3. Test Samples
Test samples containing the analytes were prepared byspiking with sulfides real hydrothermal vent fluids and pure
water. Hydrothermal vent fluid samples were collected onthe Logatchev field (158N, 458W) in January 2007 at a depthof approx. 3000 m using a remotely operated vehicle (ROVmodel KIEL 5000). Samples were drawn from the fluidsampler into plastic syringes onboard ship. The samples� pHwas approximately 3.5, and they were stored under refrig-eration (4� 0.5 8C) without pretreatment until beingopened in the laboratory for the voltammetric determina-tions. Before use, equal volumes of each hydrothermal ventfluid sample were mixed to compose a pooled sample to beused as a representative matrix of the real samples to test themethodology through recovery experiments. The totalsulfide content of the samples (without speciation) wasalso determined spectrophotometrically by the MethyleneBlue method adapted from Kriege and Wolfe [22].
2.4. Analytical Procedure
Ten milliliters of 0.05 mol L�1 hydrazine solution (pH 2.3)was added to the voltammetric cell and deaerated for 10 minwith nitrogen. After the gas flow was stopped, a 0.1 mLaliquot of the pooled hydrothermal vent fluid or of syntheticsamples spiked with the analytes (Table 1) was added to thevoltammetric cell to run the voltammogram. No aerationwith a nitrogen stream was applied after the addition of thesample (or standards) to the voltammetric cell. Calibrationcurves were used instead of the standard addition method.All of the voltammetric measurements were performed atroom temperature (22� 2 8C).
3. Results and Discussion
Determination of inorganic (H2S, HS�, S�2) and low-molecular-weight organic sulfides (MtSH, EtSH andPrSH) was performed by DPCSV at the mercury electrode(HMDE). The electrodic process responsible for thevoltammetric sulfide signals using mercury electrodes iswell known [9, 23, 24]. In short, this process includes anodicreactions during the accumulation step, yielding poorlysoluble mercury-sulfur compounds as a result of mercuryoxidation. During the cathodic stripping step, these com-pounds are reduced at the HMDE surface, producingvoltammetric peaks at different potentials for inorganicand organic sulfides. Stripping peaks for the investigatedsulfides were observed by DPCSV from acidic to alkalineelectrolytes, where inorganic sulfides always appeared atmore negative potentials. This behavior could be associatedwith the stability of the sparingly soluble sulfur compoundon the electrode surface, so that the peak separation can bethe basis of a method for simultaneous determination of theinvestigated sulfides.
Alkaline electrolytes are normally the choice for inor-ganic sulfide determinations [9, 10, 25] considering thepredominance (at room temperature) of the non-gaseousHS� or S2� forms at pH values of approx. 8.0 or higher, as thegaseous form of inorganic sulfide (H2S, b.p. �61 8C) is the
Determination of Sulfur Compounds
Electroanalysis 2010, 22, No. 10, 1066 – 1071 � 2010 Wiley-VCH Verlag GmbH & Co. KGaA, Weinheim www.electroanalysis.wiley-vch.de 1067
main sulfide species at pH� 4.0 (H2S� 91%, HS�� 9%).However, acidic electrolytes produced better peak shapesand separations between the sulfide forms than did thealkaline ones. The influence of pH on the sulfide peak shapewas investigated elsewhere in the pH range of 4.5 to 10.5 viameasurements by CSSWP (Cathodic Stripping SquareWave Polarography), where variations of pH could beassociated with changes in the mechanism of Hg oxidation inthe presence of sulfides as well as in the reduction of thedeposited HgS [26]. Indeed, sulfides and hydroxyl ions inalkaline solutions may compete for the mercury electrodebecause hydroxyl ions can act acts as a depolarizer,producing a large oxidation peak centered at zero volts[9]. At first, a logical assumption is that the presence of anacidic electrolyte would drive the hydrogen sulfide out ofsolution. However, experimental evidence demonstratesthat this is not the case. The presence of hydrochloric acid,for example, can be modeled in a fashion similar to the effectof a neutral ionic solute (such as sodium chloride). At lowacid concentrations, HCl salts out the hydrogen sulfide,
reducing the solubility. As the acid concentration increases,the solubility increases, and if the HCl concentration issufficiently large, the solubility is actually greater than inpure water [27]. Furthermore, the solubility of H2S in 5 molL�1 sulfuric acid is essentially the same as in pure water [28].The amount of the molecular form of hydrogen sulfide inaqueous solution is dictated by its partial pressure. Thewater solubility (1 atm, 20 8C) of H2S, MtSH, EtSH andPrSH is 4.13, 15.40, 15.60 and 1.90 g L�1, respectively [29 –33]. Thus, to enable the determination of these analytes inthe mg L�1 concentration range in acidic solutions, thedeaeration step was crucial. This step was carried out byaeration with a nitrogen stream before the addition ofstandards or samples to the voltammetric cell using hydra-zine as the electrolyte in order to maintain the oxygenconcentration at low levels as well as to avoid the oxidationof organic sulfides. Indeed, among the investigated analytes,H2S presents the lowest Henry�s constant (0.087 mol L�1
atm�1) [24], which is still significantly higher than the valuesfor dissolved oxygen (1.3� 10�3 mol L�1 atm�1) and nitrogen
Table 1. List of analytes.
Sample H2S/HS� MtSH PrSH R – SH
Added Recovery Added Recovery Added Recovery Added Recovery(mmol L�1) (%) (mmol L�1) (%) (mmol L�1) (%) (mmol L�1) (%)
HT 1.0 98.8 1.0 112.2 1.0 97.5HT [a] 0.7 103.1 0.7 101.4 0.7 99.2HT 1.2 101.8 2.3 111.8 2.3 99.9W 1.2 99.5 1.2 96.2 2.4 96.5W [a] 0.5 101.9 2.0 106.8 1.8 99.4W [a] 1.0 98.7 0.6 99.7 2.0 98.2HT [a] 0.8 115.3 2.6 112.7HT 1.5 114.9 3.5 93.8HT [a] 0.5 106.1 2.9 86.9W [a] 0.8 106.9 4.0 97.5W [a] 0.5 103.5 3.1 102.7W 0.7 98.8 2.8 99.6
[a] Sample containing 0.02 g of zinc acetate; R – SH: MtSHþEtSHþPrSH; HT: hydrothermal vent fluid; W: pure water
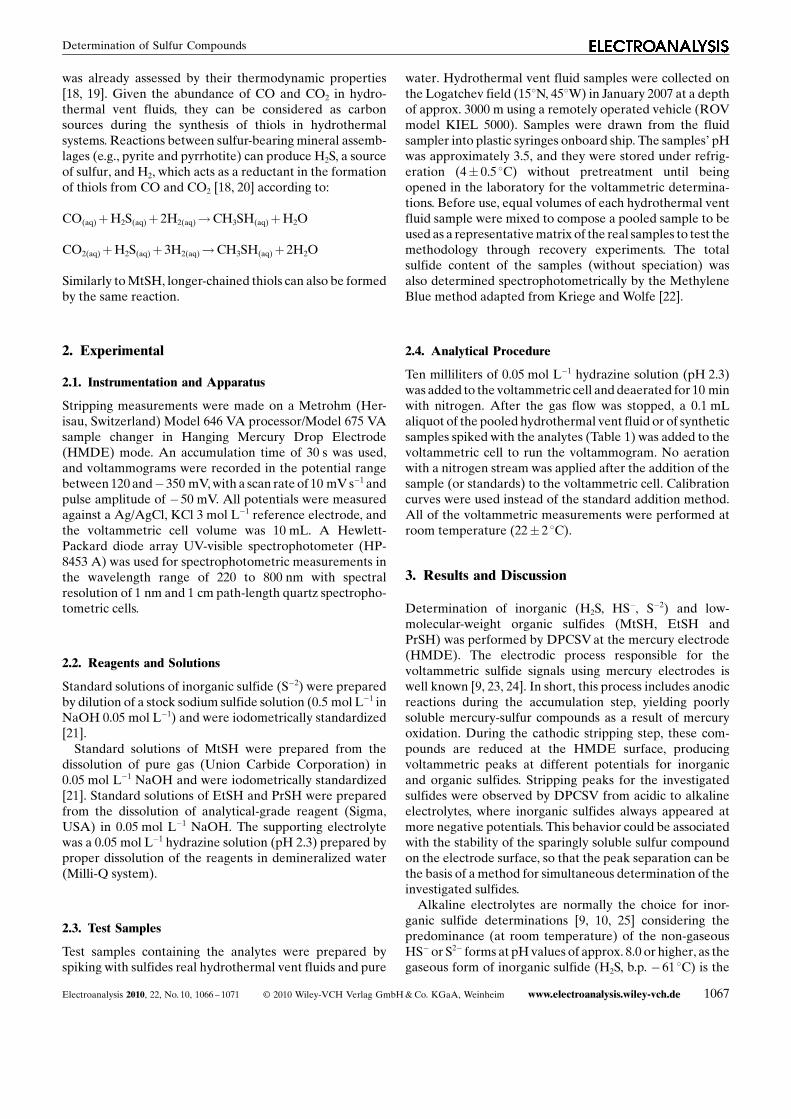
Fig. 1. DPCS voltammograms of inorganic (curve 1) and organic (curve 2) sulfides. (a) 0.5 mmol L�1 H2S/HS� species in NH4Cl/NH3
0.3 mol L�1; pH 9.5 (Eacc¼�280 mV; Tacc¼ 30 s), (b) 2.6 mmol L�1 MtSHþEtSHþPrSH species in Hydrazine 0.05 mol L�1; pH 2.3(Eacc¼ 120 mV; Tacc¼ 30 s). The inset shows the dependence of peak potentials of organic and inorganic sulfides on the electrolyte pH.
Full Paper D. Dias et al.
1068 www.electroanalysis.wiley-vch.de � 2010 Wiley-VCH Verlag GmbH & Co. KGaA, Weinheim Electroanalysis 2010, 22, No. 10, 1066 – 1071
(6.1� 10�4 mol L�1 atm�1) [34]. Using this strategy, well-separated peaks and good peak shapes were obtained for thesulfides in acidic electrolytes. Figure 1 shows the voltammo-grams of organic and inorganic sulfides in acidic and alkalineelectrolytes, and the inset shows the dependence of peakpotential on the pH of the electrolyte solution. For theinvestigated pH range, the sensitivity for organic sulfideswas about 6 times lower than the sensitivity for inorganicsulfides, and the peak of organic sulfides is broader than thatof the inorganic ones, suggesting a less reversible electrodeprocess.
3.1. Sulfide Depletion and Calibrations
Voltammetric determination of dissolved sulfides in batchmode using the mercury electrode can suffer from signalinstability related to loss of sulfides in the cell to the wastemercury pool. One alternative method for obtaining stablesulfide peaks with improved method sensitivity is a flow-analysis arrangement [35]. More recently, sulfide wasdetermined at nanomolar concentrations in batch mode bylimiting the sulfide-mercury contact time [11]. Indeed, this isa critical aspect because the solubility of mercuric sulfide isvery low (solubility product¼ 10�52.7) [36]. The mercuricions formed from partial oxidation reactions on the wastemercury pool can cause sulfide peak decays due toformation of insoluble mercuric sulfide salts. In the presentwork, batch experiments were also used to assay the sulfidesby voltammetry. The evaluation of peak stability showedthat, by using calibration curves instead of the standardaddition method, the contact time between sulfide and themercury accumulated in the voltammetric cell can besignificantly reduced. Indeed, the samples were in contactwith the waste mercury pool for approx. 4 min whenmeasured by the standard addition method in contrast toapprox. 1 min for measurements using calibration curves.
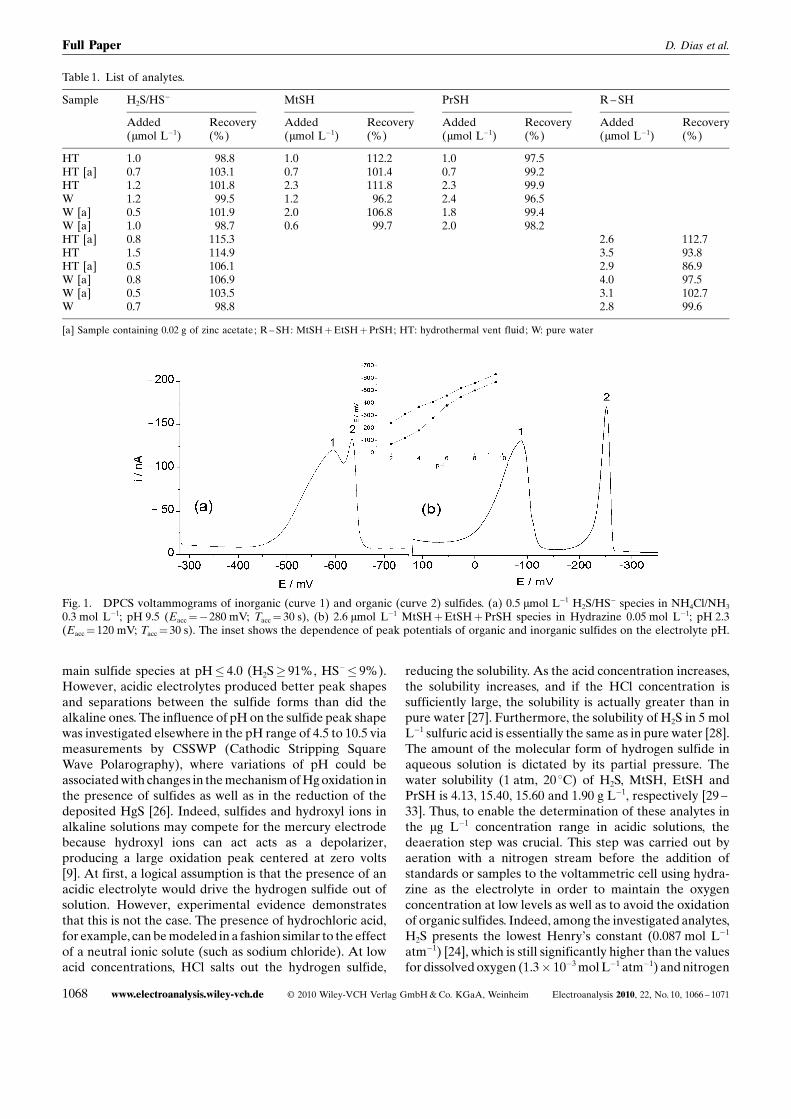
Figure 2 shows the curve of variation for inorganic sulfideconcentration resulting from the contact of a 60 mg L�1
solution (10 mL) with 8 mercury drops (64.1 mg Hg). Byvisual inspection, the exponential nature of the sulfide loss isclear. Thus, after 4 min, the sulfide loss was approx. 44%,and it grew to approx. 94% after 20 min. In contrast, for thetypical contact time between sulfide and the waste mercurypool of 1 min, observed for measurements by using calibra-tion curves, the sulfide loss was approx. 4%. The generalbehavior for the sulfide concentration decay is valid foracidic (hydrazine 0.05 mol L�1, pH 2.3) and alkaline (NH4
Cl/NH3 0.3 mol L�1, pH 9.5) electrolytes. Similar behaviorwas also observed for the investigated organic sulfides.
Calibration curves presented good linearity (r� 0.99) inacidic media from 0.5 to 4 mmol L�1 for inorganic sulfidesand from 2.6 to 10 mmol L�1 for organic sulfides using 30 saccumulation times. The calibration functions i [nA]¼ 763.2[mmol L�1]� 196.6 and i [nA]¼ 103.2 [mmol L�1]� 106.2were obtained for inorganic and organic sulfides, respec-tively. The relative standard deviations (RSD) were 8.0 and7.7% for five independent measurements of 0.5 and
1.5 mmol L�1 inorganic and organic sulfide solutions, re-spectively. Detection limits (LOD) of 0.3 and 1.1 mmol L�1
(30 s accumulation time) were calculated for inorganic andorganic sulfides, respectively, considering the condition(3s�BL), where s is the standard deviation (n¼10) of thebackground current (BL) at �90 and �252 mV.
3.2. Speciation of Sulfides by DPCSV
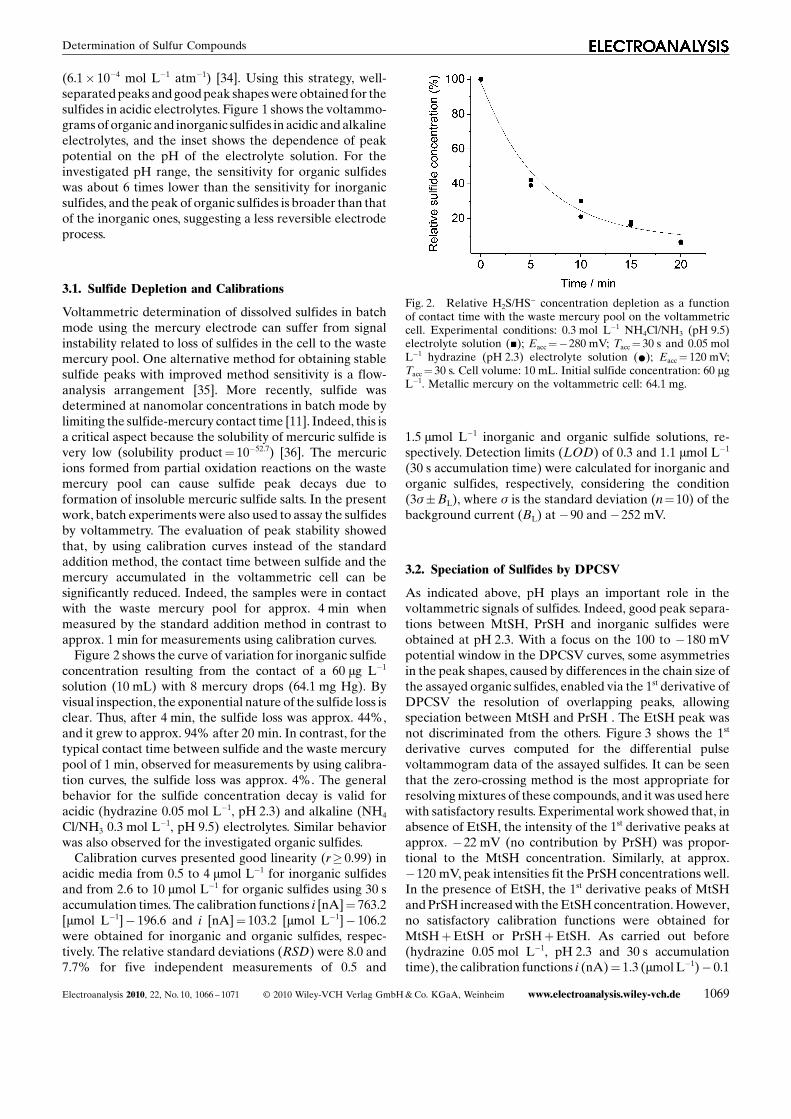
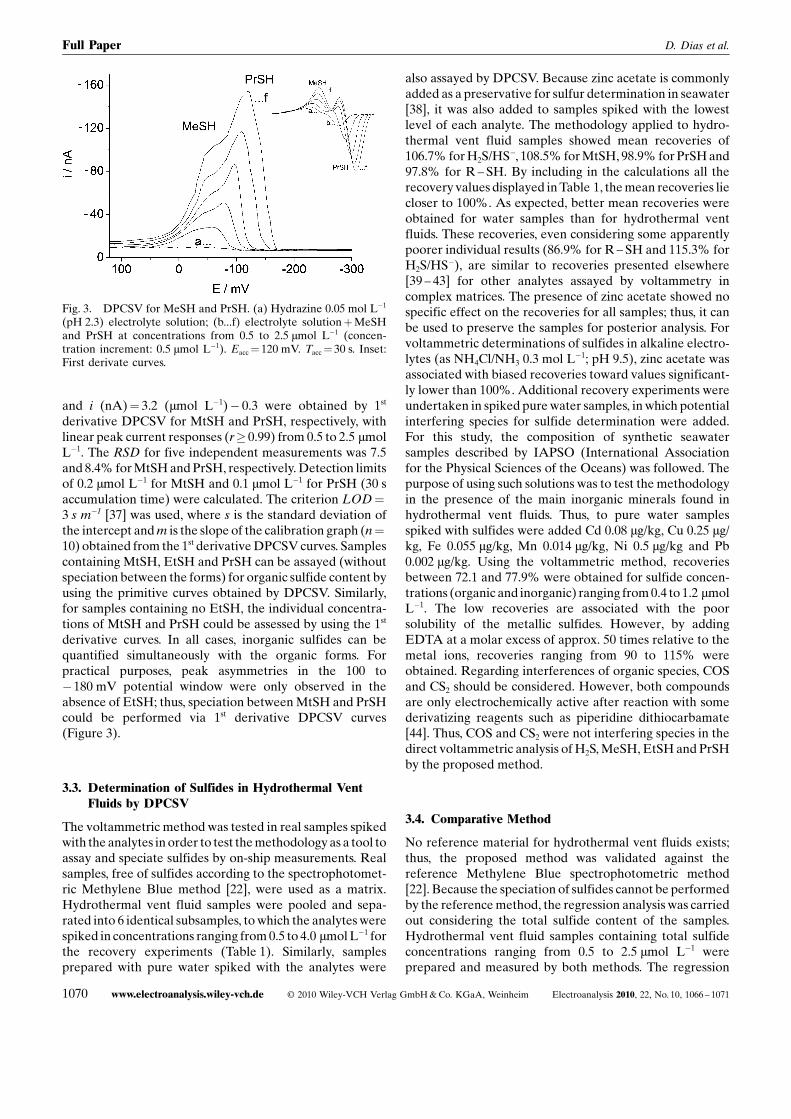
As indicated above, pH plays an important role in thevoltammetric signals of sulfides. Indeed, good peak separa-tions between MtSH, PrSH and inorganic sulfides wereobtained at pH 2.3. With a focus on the 100 to �180 mVpotential window in the DPCSV curves, some asymmetriesin the peak shapes, caused by differences in the chain size ofthe assayed organic sulfides, enabled via the 1st derivative ofDPCSV the resolution of overlapping peaks, allowingspeciation between MtSH and PrSH . The EtSH peak wasnot discriminated from the others. Figure 3 shows the 1st
derivative curves computed for the differential pulsevoltammogram data of the assayed sulfides. It can be seenthat the zero-crossing method is the most appropriate forresolving mixtures of these compounds, and it was used herewith satisfactory results. Experimental work showed that, inabsence of EtSH, the intensity of the 1st derivative peaks atapprox. �22 mV (no contribution by PrSH) was propor-tional to the MtSH concentration. Similarly, at approx.�120 mV, peak intensities fit the PrSH concentrations well.In the presence of EtSH, the 1st derivative peaks of MtSHand PrSH increased with the EtSH concentration. However,no satisfactory calibration functions were obtained forMtSHþEtSH or PrSHþEtSH. As carried out before(hydrazine 0.05 mol L�1, pH 2.3 and 30 s accumulationtime), the calibration functions i (nA)¼ 1.3 (mmol L�1)� 0.1
Fig. 2. Relative H2S/HS� concentration depletion as a functionof contact time with the waste mercury pool on the voltammetriccell. Experimental conditions: 0.3 mol L�1 NH4Cl/NH3 (pH 9.5)electrolyte solution (&); Eacc¼�280 mV; Tacc¼ 30 s and 0.05 molL�1 hydrazine (pH 2.3) electrolyte solution (*); Eacc¼ 120 mV;Tacc¼ 30 s. Cell volume: 10 mL. Initial sulfide concentration: 60 mgL�1. Metallic mercury on the voltammetric cell: 64.1 mg.
Determination of Sulfur Compounds
Electroanalysis 2010, 22, No. 10, 1066 – 1071 � 2010 Wiley-VCH Verlag GmbH & Co. KGaA, Weinheim www.electroanalysis.wiley-vch.de 1069
and i (nA)¼ 3.2 (mmol L�1)� 0.3 were obtained by 1st
derivative DPCSV for MtSH and PrSH, respectively, withlinear peak current responses (r� 0.99) from 0.5 to 2.5 mmolL�1. The RSD for five independent measurements was 7.5and 8.4% for MtSH and PrSH, respectively. Detection limitsof 0.2 mmol L�1 for MtSH and 0.1 mmol L�1 for PrSH (30 saccumulation time) were calculated. The criterion LOD¼3 s m�1 [37] was used, where s is the standard deviation ofthe intercept and m is the slope of the calibration graph (n¼10) obtained from the 1st derivative DPCSV curves. Samplescontaining MtSH, EtSH and PrSH can be assayed (withoutspeciation between the forms) for organic sulfide content byusing the primitive curves obtained by DPCSV. Similarly,for samples containing no EtSH, the individual concentra-tions of MtSH and PrSH could be assessed by using the 1st
derivative curves. In all cases, inorganic sulfides can bequantified simultaneously with the organic forms. Forpractical purposes, peak asymmetries in the 100 to�180 mV potential window were only observed in theabsence of EtSH; thus, speciation between MtSH and PrSHcould be performed via 1st derivative DPCSV curves(Figure 3).
3.3. Determination of Sulfides in Hydrothermal VentFluids by DPCSV
The voltammetric method was tested in real samples spikedwith the analytes in order to test the methodology as a tool toassay and speciate sulfides by on-ship measurements. Realsamples, free of sulfides according to the spectrophotomet-ric Methylene Blue method [22], were used as a matrix.Hydrothermal vent fluid samples were pooled and sepa-rated into 6 identical subsamples, to which the analytes werespiked in concentrations ranging from 0.5 to 4.0 mmol L�1 forthe recovery experiments (Table 1). Similarly, samplesprepared with pure water spiked with the analytes were
also assayed by DPCSV. Because zinc acetate is commonlyadded as a preservative for sulfur determination in seawater[38], it was also added to samples spiked with the lowestlevel of each analyte. The methodology applied to hydro-thermal vent fluid samples showed mean recoveries of106.7% for H2S/HS�, 108.5% for MtSH, 98.9% for PrSH and97.8% for R – SH. By including in the calculations all therecovery values displayed in Table 1, the mean recoveries liecloser to 100%. As expected, better mean recoveries wereobtained for water samples than for hydrothermal ventfluids. These recoveries, even considering some apparentlypoorer individual results (86.9% for R – SH and 115.3% forH2S/HS�), are similar to recoveries presented elsewhere[39 – 43] for other analytes assayed by voltammetry incomplex matrices. The presence of zinc acetate showed nospecific effect on the recoveries for all samples; thus, it canbe used to preserve the samples for posterior analysis. Forvoltammetric determinations of sulfides in alkaline electro-lytes (as NH4Cl/NH3 0.3 mol L�1; pH 9.5), zinc acetate wasassociated with biased recoveries toward values significant-ly lower than 100%. Additional recovery experiments wereundertaken in spiked pure water samples, in which potentialinterfering species for sulfide determination were added.For this study, the composition of synthetic seawatersamples described by IAPSO (International Associationfor the Physical Sciences of the Oceans) was followed. Thepurpose of using such solutions was to test the methodologyin the presence of the main inorganic minerals found inhydrothermal vent fluids. Thus, to pure water samplesspiked with sulfides were added Cd 0.08 mg/kg, Cu 0.25 mg/kg, Fe 0.055 mg/kg, Mn 0.014 mg/kg, Ni 0.5 mg/kg and Pb0.002 mg/kg. Using the voltammetric method, recoveriesbetween 72.1 and 77.9% were obtained for sulfide concen-trations (organic and inorganic) ranging from 0.4 to 1.2 mmolL�1. The low recoveries are associated with the poorsolubility of the metallic sulfides. However, by addingEDTA at a molar excess of approx. 50 times relative to themetal ions, recoveries ranging from 90 to 115% wereobtained. Regarding interferences of organic species, COSand CS2 should be considered. However, both compoundsare only electrochemically active after reaction with somederivatizing reagents such as piperidine dithiocarbamate[44]. Thus, COS and CS2 were not interfering species in thedirect voltammetric analysis of H2S, MeSH, EtSH and PrSHby the proposed method.
3.4. Comparative Method
No reference material for hydrothermal vent fluids exists;thus, the proposed method was validated against thereference Methylene Blue spectrophotometric method[22]. Because the speciation of sulfides cannot be performedby the reference method, the regression analysis was carriedout considering the total sulfide content of the samples.Hydrothermal vent fluid samples containing total sulfideconcentrations ranging from 0.5 to 2.5 mmol L�1 wereprepared and measured by both methods. The regression
Fig. 3. DPCSV for MeSH and PrSH. (a) Hydrazine 0.05 mol L�1
(pH 2.3) electrolyte solution; (b...f) electrolyte solutionþMeSHand PrSH at concentrations from 0.5 to 2.5 mmol L�1 (concen-tration increment: 0.5 mmol L�1). Eacc¼ 120 mV. Tacc¼ 30 s. Inset:First derivate curves.
Full Paper D. Dias et al.
1070 www.electroanalysis.wiley-vch.de � 2010 Wiley-VCH Verlag GmbH & Co. KGaA, Weinheim Electroanalysis 2010, 22, No. 10, 1066 – 1071
function obtained with six points was y¼ 1.054x� 0.002,where x and y are the concentrations obtained by thereference and proposed methods, respectively. The methodsproduced similar results, as the regression analysis presentsthe declivity (45.68) and intercept as being approx. 1 and 0,respectively.
4. Conclusions
The investigated low-molecular-weight sulfur compoundscan be simultaneously assayed by DPCSV in hydrothermalvent fluid samples by using hydrazine acidic solution as theelectrolyte. By the primitive voltammetric curves, thespeciation between inorganic (H2S) and organic (MtSH,EtSH, PrSH) sulfides is feasible. Similarly, with the 1st
derivative curves, the speciation between H2S, MtSH andPrSH is possible for samples containing no EtSH. Thevoltammetric method can be used for on-ship measure-ments, considering the portability of equipment for voltam-metry.
Acknowledgements
We are grateful to the Brazilian Foundations CNPq andCAPES (Probral N8 240/06) for scholarship support.
References
[1] R. Gras, J. Loung, V. Carter, L. Sieben, H. Cortes, J.Chromatogr. A 2009, 1216, 2776.
[2] S. Pelletier, C. A. Lucy, J. Chromatogr. A 2002, 972, 221.[3] S. M. Correa, G. Arbilla, Atmos. Environ. 2008, 42, 6721.[4] P. C. Nascimento, D. Bohrer, A. L. B. Rohlfes, L. M. Carval-
ho, A. Ramirez, Fresenius J. Anal. Chem. 2001, 370, 92.[5] L. L. Yu, W. R. Kelly, J. D. Fasset, R. D. Vocke, J. Anal. At.
Spectrom. 2001, 16, 140.[6] E. Bramanti, L. D�ulivo, C. Lomonte, M. Onor; R. Zamboni,
G. Raspi, A. D�ulivo, Anal. Chim. Acta 2006, 579, 38.[7] M. W. Tamele, L. B. Ryland, R. N. Mccoy, Anal. Chem. 1960,
32, 1007.[8] S. M. Ghannam, Il Farmaco 2004, 59, 331.[9] J. J. Renard, G. Kubes, H. I. Bolker, Anal. Chem. 1975, 47,
1347.[10] N. Batina, I. Ciglenecki, B. Cosovic, Anal. Chim. Acta 1992,
267, 157.[11] L. He, Y. Zheng, D. C. Locke, Anal. Chim. Acta 2002, 459,
209.[12] M. Scampicchio, N. S. Lawrence, A. Arecchi, S. Cosio, S.
Mannino, Electroanalysis 2007, 19, 85.[13] A. N. Caruso, L. G. Wang, S. S. Jaswal, E. Y. Tsymbal, P. A.
Dowben, J. Mater. Sci. 2006, 41, 6198.
[14] N. R. Stradiotto, D. M. Serafim, Fuel 2008, 87, 1007.[15] A. Koschinsky, R. Seifert, P. Halbach, M. Bau, S. Brasse,
L. M. Carvalho, N. M. Fonseca, Geochim. Cosmochim. Acta2002, 66, 1409.
[16] T. F. Rozan, S. M. Theberge, G. Luther, Anal. Chim. Acta2000, 415, 175.
[17] G. W. Luther, B. T. Glazer, S. Ma, R. E. Trouwborst, T. S.Moore, E. Metzger, C. Kraiya, T. J. Waite, G. Druschel, B.Sundby, M. Taillefert, D. B. Nuzzio, T. M. Shank, B. L. Lewis,P. J. Brendel, Mar. Chem. 2008, 108, 221.
[18] M. D. Schulte, K. L. Rogers, Geochim. Cosmochim. Acta2004, 68, 1087.
[19] M. D. Schulte, E. L. Shock, R. H. Wood, Geochim. Cosmo-chim. Acta 2001, 65, 3919.
[20] D. I. Foustoukos, D. E. Allen, Q. Fu, W. E. Seyfried, 11thAnn. V. M. Goldschmidt Conference, Abstract 2001, 3855.
[21] O. A. Ohlweiler. Qu�mica Anal�tica Quantitativa, Vol. 2,Livros T�cnicos e Cient�ficos Editora, Brazil, 1974.
[22] O. H. Kriege, A. L. Wolfe, Talanta 1962, 9, 673.[23] H. S. Kalal, A. A. M. Beigi, M. Farazmand, S. A. Tash,
Analyst 2000, 125, 903.[24] B. Monterroso-Marco, B. Lopez-Ruiz, Talanta 2003, 61, 733.[25] P. C. Nascimento, D. Bohrer, A. Ramirez, M. G. Trevisan, J.
Tramontina, A. L.B. Rohlfes, Talanta 2000, 52, 1047.[26] J. S. Redinha, C. Paliteiro, J. L. C. Pereira, Anal. Chim. Acta
1997, 351, 115.[27] J. J. Carroll, Chem. Eng. Prog. 1991, 87, 48.[28] A. A. Douabul, J. P. Riley, Deep-Sea Res. 1979, 26, 259.[29] W. J. Bruyn, E. Swartz, J. H. Hu, J. A. Shorter, P. Davidovits,
D. R. Worsnop, M. S. Zahniser, J. Geophys. Res. 1995, 100,7245.
[30] Toxicological Profile for Hydrogen Sulfide, US Departmentof Health and Human Services, Agency for Toxic Substancesand Disease Registry, Atlanta, GA 1999.
[31] Z. Duan, R. Sun, R. Liu, C. Zhu, Energy Fuels 2007, 21, 2056.[32] T. J. Barrett, G. M. Anderson, J. Lugowski, Geochim. Cos-
mochim. Acta 1988, 52, 807.[33] M. C. Iliuta, F. Larachi, J. Chem. Eng. 2007, 52, 2.[34] I. Mills, T. Cvitas, K. Homann, N. Kallay, K. Kuchitsu,
Quantities, Units and Symbols in Physical Chemistry, 2nd ed.,Blackwell Science, Oxford 1993.
[35] R. Al-Farawati, C. M. G. Van der Berg., Mar. Chem. 1997, 57,277.
[36] A. E. Martell, R. M. Smith, Critical Stability Constants,Vol. 4, Plenum, New York 1976.
[37] D. Midgley, Anal. Proc. 1984, 21, 284.[38] H. Elderfield, A. Schultz, Ann. Rev. Earth and Planet. Sci.
1996, 24, 191.[39] B. B. Prasad, B. Arora, Electroanalysis 2003, 15, 1212.[40] R. Piech, Electroanalysis 2009, 21, 1842.[41] M. Shahlaei, M. B. Gholivand, A. Pourhossein, Electroanal-
ysis 2009, 21, 2499.[42] A. A. Ensafi, R. Hajian , Electroanalysis 2006, 18, 579.[43] D. Lakshmi, P. S. Sharma, B. B. Prasad, Electroanalysis 2006,
18, 918.[44] W. Schwach, B. Br�ger, S. Nyanzi, Fresenius J. Anal. Chem.
1995, 351, 297.
Determination of Sulfur Compounds
Electroanalysis 2010, 22, No. 10, 1066 – 1071 � 2010 Wiley-VCH Verlag GmbH & Co. KGaA, Weinheim www.electroanalysis.wiley-vch.de 1071