volume 1: annexes - netherlands. david stower permanent secretary, ministry of water and irrigation...
TRANSCRIPT

PUBLIC-PRIVATE INFRASTRUCTURE ADVISORY FACILITY STRATEGIC REVIEW 2008
March 2009
Final Report
VOLUME 1: ANNEXES
Submitted by: Cambridge Economic Policy Associates Ltd

CONTENTS
1. Annex 1: Terms of reference for the Strategic Review 2008..............................4
2. Annex 2: List of consultations...........................................................................8
2.1. PPIAF annual meeting, Tunis, June 2008 ................................................................8
2.2. PMU headquarters, Washington DC, July 2008......................................................9
2.3. Field visits, Kenya, Uganda, India and Vietnam, Nov 2008- Jan 2009..............10
2.4. Consultations in London in person and by telephone/videoconference..........13
3. Annex 3: Market and institutional context of PPIAF ..................................... 14
3.1. Market context ...........................................................................................................14
3.2. Institutional context...................................................................................................17
4. Annex 4: Analysis of the trends in PPI by region ........................................... 21
5. Annex 5: An analysis of PPIAF’s portfolio using the suggested revised categorisation of activities ......................................................................................38
5.1. Geography...................................................................................................................38
5.2. Sector ...........................................................................................................................41
5.3. Size ...............................................................................................................................44
5.4. Activity.........................................................................................................................46
6. Annex 6: An analysis of PPIAF’s portfolio using the traditional classification 49
6.1. Geography...................................................................................................................49
6.2. Sector ...........................................................................................................................53
6.3. Size ...............................................................................................................................55
6.4. Activity.........................................................................................................................56
7. Annex 7: PPIAF governance structure............................................................58
7.1. PPIAF origins and the Charter ................................................................................58
7.2. Governance arrangements........................................................................................59
8. Annex 8: A comparison of PPIAF and other Trust Funds ............................. 61
8.1. Comparison of PMU costs with other Trust Funds.............................................62
8.2. More details on other World Bank Trust Funds ...................................................63
9. Annex 9: Proposal review process and trends in proposal approval...............78
9.1. Proposal origination and review process................................................................78
9.2. Trends in PPIAF proposal approval.......................................................................79
10. Annex 10: Outcomes and Impacts of a sample of PPIAF activities ...........82

3
11. Annex 11: Summary field visit reports .........................................................93
11.1. Kenya...........................................................................................................................93
11.2. Uganda.........................................................................................................................98
11.3. India .......................................................................................................................... 103
11.4. Vietnam .................................................................................................................... 108

1. ANNEX 1: TERMS OF REFERENCE FOR THE STRATEGIC REVIEW
2008
This annex reproduces the terms of reference for the Strategic Review 2008, as provided
to the consultants at the start of the assignment.

5

6
7
8
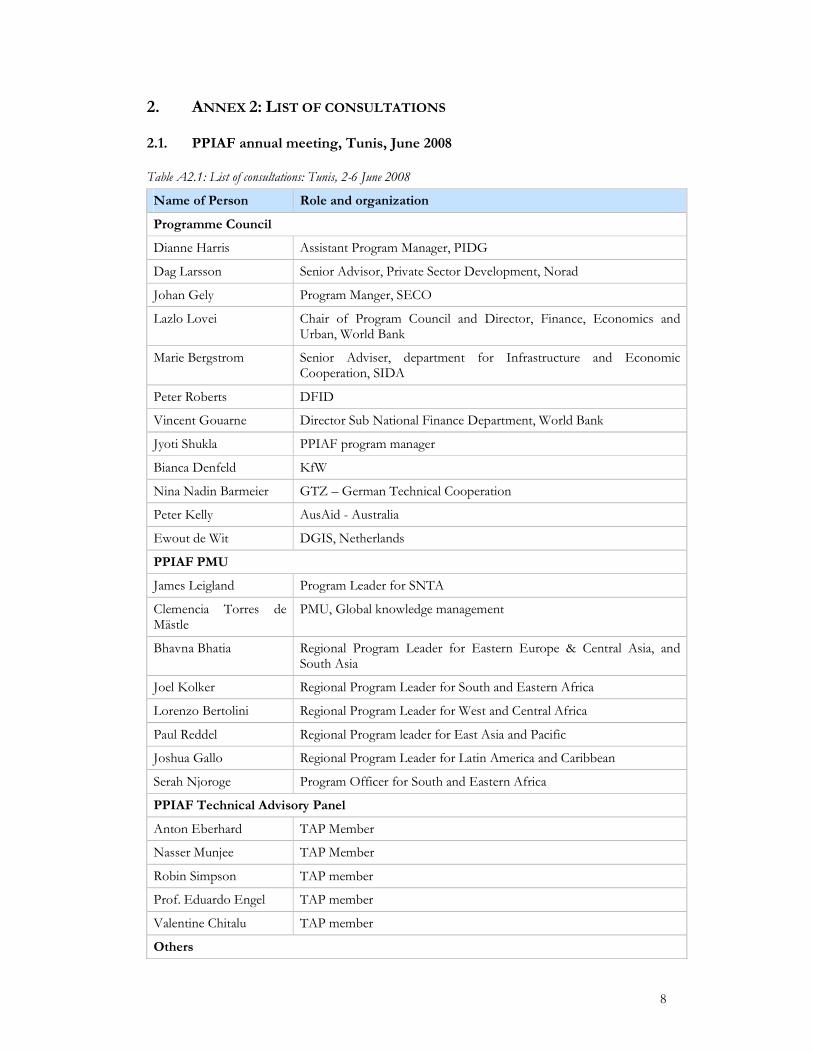
2. ANNEX 2: LIST OF CONSULTATIONS
2.1. PPIAF annual meeting, Tunis, June 2008
Table A2.1: List of consultations: Tunis, 2-6 June 2008
Name of Person Role and organization
Programme Council
Dianne Harris Assistant Program Manager, PIDG
Dag Larsson Senior Advisor, Private Sector Development, Norad
Johan Gely Program Manger, SECO
Lazlo Lovei Chair of Program Council and Director, Finance, Economics and Urban, World Bank
Marie Bergstrom Senior Adviser, department for Infrastructure and Economic Cooperation, SIDA
Peter Roberts DFID
Vincent Gouarne Director Sub National Finance Department, World Bank
Jyoti Shukla PPIAF program manager
Bianca Denfeld KfW
Nina Nadin Barmeier GTZ – German Technical Cooperation
Peter Kelly AusAid - Australia
Ewout de Wit DGIS, Netherlands
PPIAF PMU
James Leigland Program Leader for SNTA
Clemencia Torres de Mästle
PMU, Global knowledge management
Bhavna Bhatia Regional Program Leader for Eastern Europe & Central Asia, and South Asia
Joel Kolker Regional Program Leader for South and Eastern Africa
Lorenzo Bertolini Regional Program Leader for West and Central Africa
Paul Reddel Regional Program leader for East Asia and Pacific
Joshua Gallo Regional Program Leader for Latin America and Caribbean
Serah Njoroge Program Officer for South and Eastern Africa
PPIAF Technical Advisory Panel
Anton Eberhard TAP Member
Nasser Munjee TAP Member
Robin Simpson TAP member
Prof. Eduardo Engel TAP member
Valentine Chitalu TAP member
Others

9
Name of Person Role and organization
Gilbert Mbesherubsa Director of Infrastructure Department, AFDB
John Flora Technical Adviser of TAF
Lamin Manneh Regulatory expert, AfDB
Andrew Roberts Infrastructure Expert, ICA Secretariat
Hugh Goldsmith EIB
Catherine Revels WSP, South Asia
Johan Kruger Former CEO, INCA, SA
Chris Burke Research Fellow - Centre for Chinese Studies
2.2. PMU headquarters, Washington DC, July 2008
Table A2.2: List of consultations: Washington DC, 7- 10 July 2008
Name of Person Role and organization
Jyoti Shukla PPIAF Programme Manager
Aldo Baietti Senior financial specialist, Energy, transport and water department, World Bank
Katherine Sierra Vice President, Sustainable Development, World Bank
Christopher Gerrard Lead Evaluation Officer, IEGCG
Dana Rysankova Senior Energy Specialist, Energy, Africa, World Bank
Pankaj Gupta Sr. Financial Analyst, AFT: Energy, World Bank
Alain Labeau Program Coordinator, AFT Transport, World Bank
John Flora Technical Advisor, Technical Assistance Facility, PIDG
Pierre Guislain IFC Director, Investment Climate
Motoo Konishi Sector Manager, Sustainable Dvlpt. Sector Unit, World Bank
Bernie Sheahan Director, Advisory Services, IFC
Jonathan Walters Sector Manager; and Paul Noumba, Lead Economist, MENA Sustainable Development, World Bank
Jamal Saghir Director, Energy, Transport and Water Dept, World Bank
Junaid Ahmad Sector Manager, South Asia Sustainable Dvlpt., World Bank
Anil Bhandari Sr. Advisor, Transport, Nairobi, World Bank
Michael Haney Sr. Energy Specialist, South Asia Sustainable Dvlpt. - Energy
Patricia Veevers-Carter Program Manager, GPOBA
Kamran Khan Infrastructure Policy Advisor, East Asia Sustainable Dvlpt. - Operations and Policy, World Bank
Paul Cadario Senior Manager, Trust Fund Quality Assurance & Compliance
Ashok Subramanian Sector Manager, AFT: Water Resource Management
Jyoti and Amit PPIAF PMU
Inger Andersen Director, Africa Sustainable Dvlpt. Front Office

10
Name of Person Role and organization
Vivien Foster Lead Economist, Africa Sustainable Dvlpt. Front Office
Magdalena Manzo Senior Operations Officer, Trust Fund Operations
Dara M. Lengkong Trust Fund Operations
Nigel Twose Director, IDA/IFC Secretariat
Dianne Rudo TAP Member
Carol Bonney Sr. Resource Management Officer
Ajay Kumar Sr. Transport Economist, World Bank
Pierre Pozzo di Borgo Sr. Transport Specialist, World Bank
2.3. Field visits, Kenya, Uganda, India and Vietnam, Nov 2008- Jan 2009
2.3.1. Kenya
Table A2.3: List of consultations in Kenya, 24-26 November 2008
Name of Person Role and Organisation
Joel Kolker Regional program leader for South and Eastern Africa, PPIAF
Serah Njoroge Program officer for South and Eastern Africa, PPIAF
Mrs Esther Koimett Investment secretary, Ministry of Finance
Richard J Muiru Chief engineer ( Electrical ), Ministry of Energy
Patrick M Nyoike Permanent secretary, Ministry of Energy
Anil Bhandari Senior transport advisor, World Bank
Vishal Agarwal Head of infrastructure finance in SS Africa, PricewaterhouseCoopers
Elly Aguko Senior manager (projects), K- Rep Bank
J Kimani Engineer, Athi Water Services Board
Leonard M Mbugua Chairman, Kiamumbi Multipurpose Cooperative Society
Eng. David Stower Permanent secretary, Ministry of Water and Irrigation
Eng. Lawrence N Simitu Director of water services, Ministry of Water and Irrigation
Eng, R K Gaita Director of irrigation, drainage and water storage, Ministry of Water and Irrigation
James K Yatich Acting director, land reclamation department, Ministry of Water and Irrigation
Eng. Joseph K Njoroge Managing director, Kenya Power and Lighting Co Ltd
David Mwangi Chief manager, planning, research and performance monitoring, Kenya Power and Lighting Co Ltd
Eng. John Ombini Chief manager, distribution, Kenya Power and Lighting Co Ltd
Paivi Koljonen Lead energy specialist, World Bank
Taz Chaponda Associate director, Prosperity Capital Management Ltd
Eng. Gakubia CEO, Water Regulatory Board

11
Name of Person Role and Organisation
Joseph Nduva Muli Managing director, Kenya Railways Corporation
Eng. Joster I Onyango General manager (Concession), Kenya Railways Corporation
George Muhoho Managing director, Kenya Airports Authority
2.3.2. Uganda
Table A2.4: List of consultations in Uganda, 25-26 November 2008
Name of Person Role and Organisation
David Ssebabi Director, Privatisation and Utility Sector Reform Program
Joselyn Ategeka Legal Officer, Privatisation and Utility Sector Reform Program
Mona Batabara Muguma African Alliance
G T Itazi Director, Ministry of Works and Transport
C Okelo Principal Transport Economist, Ministry of Works and Transport
Name not available Kampala City Council
David Luyimbazi Director Planning, National Roads Authority
Patrick Mwesige Director of Finance and Administration, Electricity Regulatory Authority
Eng. Semitala Norbert Director of Technical Regulation, Electricity Regulatory Authority
Eric Kenneth Lokolong Senior Compliance Officer (Legal), Capital Markets Authority
Angela Kiryabwire Kanyima
Director, Legal and Compliance, Capital Markets Authority
Dr. William Muhairwe Managing Director, National Water and Sewerage Corporation
Alfred Okot Okidi Chief Manager of Finance and Accounts Division, NWSC
Rob Rudy Pro-Poor Growth Adviser, DFID
Kajuna Benon Assistant Commissioner, Planning, Ministry of Works and Transport
Okelo Cipriano Transport Economist, Ministry of Works and Transport
2.3.3. India
Table A2.5: List of consultations in India, 3-5 December 2008
Name of person Role and organisation
Beneficiaries/ government representatives
Dr Arvind Mayaram Additional Secretary, Government of India, formerly in the Ministry of Finance, PPPs.
Ashish Khundra Officer on Special Duty to Minister of External Affairs; formerly in Delhi Jal Board
Aparna Bhatia Joint Director – PPP, Department of Economic Affairs
Gajendra Haldea Adviser to Deputy Chairman, Planning Commission
Dr Pramod Deo Chairman, Central Electrical Regulatory Commission (CERC)

12
Alok Kumar Secretary
P. K. Srivastava Joint Secretary, Ministry of Urban Development
Vinayak Chatterjee Confederation of Indian Industries; Chairman, Feedback Ventures Pvt Limited
Manu Srivastave Secretary Urban Development, Government of Maharashtra
Donors
Stephen Young Senior Infrastructure & Urban Development Adviser, DFID
Anouj Mehta Senior Infrastructure Finance Specialist, PPPs, Asian Development Bank, India Resident Mission
PPIAF Consultants
Anish De
Puneet Chitkara
Vibhuti Garg
CEO, Mercados Energy Markets India Pvt Ltd.
Manager
Consultant
Amrit Pandurangi Partner, PWC
Akanksha Chaurey Director, Decentralised Energy Solutions, TERI
Amit Kapur Partner, J.Sagar Associates
NGO - PPIAF beneficiaries
Udai S Mehta
Sharad Shrivastava
CUTS – Centre for Competition, Investment & Economic Regulation
Assistant Manager, CIRC
Anjali Garg Fellow & Area Convenor; TERI
2.3.4. Vietnam
Table A2.6: List of consultations in Vietnam, January 2009
Name of person Role and organisation
Dr Pham Ngoc Thai Deputy Director, Department of Technical Infrastructure, Ministry of Construction, Hanoi
Mr Tran Huang Tuan Director, Transport Management and Operations Centre ( TRAMOC), Hanoi
Mr Nguyen Hoang Hai Deputy Director, TRAMOC, Hanoi
Mr Nguyen Manh Hung Director, Hanoi Department of Transport
Mr Dinh Quang Hiep Director, Bac Ninh Water and Sewerage Company, Bac Ninh
Mr Tam General Director, Lim DBL Contractor, Lim
Mr Paul Coleman Partner in charge of advisory services, PwC Hanoi
Mrs Dinh Quynh Van Partner in charge of PwC Hanoi office and tax services, Hanoi
Mr Paul Reddel PPIAF Regional Program Leader, East Asia and Pacific, Manila

13
Name of person Role and organisation
Ms Hope Gerochi PPIAF Program Officer, Manila
Mr Nguyen Quang Vinh Operation Officer, Urban Sustainable Development Program, World Bank, Hanoi
Mr Richard Spencer Energy Sector Coordinator, World Bank, Hanoi
Mrs Beatriz Arizu de Jablonski
TTL PPIAF energy sector projects in Vietnam, World Bank
Mr Nguyen Vu Quang Deputy Director General, Electricity Regulatory Authority of Vietnam ( ERAV), Hanoi
Mr Vuong Quang San General Director, Saigon Water Corporation, (SAWACO), HCMC
Ms Le Anh Dao Corporate Office Vice manager, SAWACO, HCMC
Mr Ly Chung Dan Vice General Director, SAWACO, HCMC
Mr Tran Van Thinh General Director, Saigon Environmental Technology and Construction Company (SENCO), HCMC
Simon Calvert Consultant on DBL projects, director PwC – email
Robert G. Fitzgibbons Consultant for energy regulatory licensing projects – email
Roland Liemburger Consultant for NRWater projects in Hanoi and HCMC - email
William B. Kingdom TTL water and sanitation projects, World Bank – email
2.4. Consultations in London in person and by telephone/videoconference
Table A2.7: List of consultations: By telephone and others, June 2008 to March 2009
Name of Person Role and organization
John Hodges PIDG
William Cobbett Cities Alliance
Kameel Virjee WSP (Nairobi)
Michael Jordan Reviewer - PPIAF 2004
Tracey Osbourne PPIAF Communications Manager
Jan van Renselaar DGIS, Netherlands
Joanna Masic
Georges Heines
Ricardo Loi
Asian Development Bank
Engin Goksu European Bank for Reconstruction and Development
Misa Andriamihaja Philippe G
African Development Bank

14
3. ANNEX 3: MARKET AND INSTITUTIONAL CONTEXT OF PPIAF
In this annex, we consider both the high-level “market” and “institutional” contexts
within which the PPIAF program is taking place. In market context, we set out the
broad market impediments to privately financed infrastructure in PPIAF’s chosen areas
of operations. By institutional, we are primarily referring to the bilateral and multi-lateral
aid architecture through which PPIAF operates. The specific details of the institutional
location of PPIAF is set out in the main Inception Report.
3.1. Market context
In this sub-section, we explore the market context within which PPIAF operates. We
begin by summarising the main high level impediments to private sector participation in
infrastructure.
3.1.1. High level impediments to PPI
Although the specific constellation of impediments differs by region, country, sector and
even project, we would argue that impediments to the successful financial closure of
projects can be grouped into the following distinct, but inter-related themes:
• poor project fundamentals – in terms of the underlying economics and design
of the project, particularly as regards risk allocation;
• under-developed enabling environment – in terms of PPP and other
necessary laws, and the institutional structures necessary for private sector
participation; and
• lack of stakeholder commitment and/ or capacity – in other words, the
necessary motivations and capabilities of governments, project sponsors and to
some extent, donors.
These relationships might be set out figuratively as shown in Figure A3.1:

15
Figure A3.1: High level barriers template
Poor project fundamentals
In considering fundamentals, the aim is to analyse the project on a standalone basis.
Project fundamentals determine the bankability of a project from the perspectives of
investors and lenders. To attract the appropriate finance the project must (i) be able to
provide overall equity returns and debt margins, commensurate with the risks faced by
investors and lenders and (ii) commercial, financial and political risks must have been
either mitigated, or allocated to the party best able to manage them, or else appropriately
shared.
The principal barrier which can affect the required rate of return is a lack of
affordability in that the project’s revenue generation from direct or ultimate user charges
falls well short of the project’s costs, i.e. there is a funding gap; which is often not
addressed due to a lack of government and / or donor subsidies to fill the gap.
The principal project risks, and subsequent allocations, that cause the most problems are:
• Commercial: such as limited or lack of solvency among government purchasers
of private sector services (e.g. the sale of private power to national utilities which
are often highly indebted and are unable to set and collect cost reflective tariffs).
• Financial: such as currency mismatches between local currency revenues and
foreign exchange financing; where local currency financing is available, an
inability to hedge local interest rates and extend tenors can be highly problematic.
• Political / country: a lack of truly independent regulators who can stand up to
governments and customers means that many longer term arrangements – even
concessions – can be subject to regulatory risk that is often extremely difficult to
mitigate without considerable government or even multilateral commitment.
As the model suggests there are various overlaps between issues that are purely to do
with the project’s design, and those which are to do with other issues. As we will go to
discuss, an inability to recognise the problems set out above due to limited capacity will
contribute to the problems of design, whereas gaps in the enabling environment – such
Project
Fundamentals
Commitment
& Capacity
Enabling
Environment

16
as underdeveloped financial markets – give rise to a number of major project risks (eg
refinancing risk).
Under-developed enabling environment
We would seen the enabling environment constituting the laws and regulations, economic
institutions and established PPP processes, which create conditions conducive to the
development of not just PPP “projects”, but also markets which are needed for other
supporting activities such as finance.
Critical aspects of the enabling environment for PSP infrastructure are typically:
• Legal: a basic Build-Operate-Transfer (BOT) or other laws, which inter alia,
define the roles of the contracting parties, and those bodies required to approve
any PSP investment.
• Institutional: capabilities to develop and take projects to market or – at a
minimum – an ability to negotiate with investors making unsolicited approaches.
• Process: – clearly understood PPP processes where the responsibility of each
part of government are clearly set out, from those initiating projects through to
those responsible for ensuing that investors are treated respectfully.
Naturally, establishing such a favourable environment cannot be achieved without both
commitment and capacity, which overlaps with our third core area.
Capacity and commitment
This is a much wider and nuanced set of issues, which is not just limited to the host
countries, particularly where commitment is considered. The bullet point above on
institutional capabilities clearly overlaps with this third area, at least as far as capacity is
concerned. However, the capacity itself, is a necessary but not sufficient condition for
success; without the necessary discipline and commitment, private investment is unlikely
to occur. From government perspective, the commitment involves being prepared to
support private sector investment – and all that entails – even when certain aspects of it
may be politically unpopular – for instance, when tariff increase justifiably required. All
too often, rather than commitment and discipline rent seeking and more blatant forms of
corruption amongst officials and politicians are often observed.
However, those taking such short-cuts are often the investors themselves who are only
too happy to offer bribes and other forms of inducements in order that they achieve their
objectives. As such, there can also be a lack of commitment by some investors to fair
competition for project opportunities.
Finally, the role of donors can also often be prejudicial to the successful completion of
projects. Many lack the technical understanding of what PSP requires, whilst others are
easily swayed by interest groups with a minority interest, rather than being committed to
the successful completion of the project. Unrealistic social, environmental and gender
requirements, far in excess of those required in the developed world, have arguably
distorted and delayed donor investment and lending decisions. This has led to frustration

17
on the part of some governments and a greater temptation to respond favourably to
unsolicited approaches from, for instance, companies from developing counties who are
less concerned about such issues.
3.2. Institutional context
As well as the “market side” of infrastructure context within which PPIAF operates, it is
also important to consider the institutional context. Indeed, the terms of reference, in
paragraph11(iii), asks for an assessment of:
“PPIAF’s place in the international aid architecture including its impact on the programs of its donors,
other major development partners and other global programs.”
This sub-section is an initial contribution to this assessment and is largely based on
knowledge gained in earlier PIDG work, the DFID PSI review, internet research and
interviews in Phase 1 of this study.
PPIAF, particularly from 1999 to 2005, operated in a context of declining donor interest
in investment in economic infrastructure, combined with the post-1997 withdrawal of
private sector operators and project finance from many emerging markets. In this sense,
PPIAF was for a long time, an unfashionable but important champion of policy based
analytical work to specifically enable PPI and more generally, the crucial importance of
infrastructure to economic growth and poverty reduction. Views have, however, moved
on and the World Bank Group – having led the flight away from infrastructure – has
now moved back to being a lead investor and advocate. However the channels and
modalities are different and more complex than before.
Recent increases in global aid volumes, as defined by OECD DAC, have been driven by
debt relief; high profile post war reconstruction and prioritising of social sectors (which
now officially includes water and sanitation). Even for Sub-Saharan Africa, sector aid for
infrastructure fell from 29% of total aid flows in the early 1990s to 19% in 2000 – 2004;
moreover only two donors – Japan and US - together account for over 80 % of bilateral
infrastructure programs. For multi-laterals, IDA and EC dominate with nearly a third
each, although more recently the AfDB and ADB have raised their financing profile.
3.2.1. Aid Architecture
In general, the last five or so years have seen a proliferation of aid channels, a growing
number of new infrastructure sector participants - countries like China, Russia and India;
civil society and private sector foundations; and a massive rise in special purpose
programs or institutions - plus fragmentation and significant earmarking of aid
contributions. The latter include the rise of “vertical” global or regional, multi-donor
trust funds. The very lack of coherence has fuelled the aid effectiveness debate and
attempts to implement the 2005 Paris Declaration. In September 2008, a major High
Level Forum on this topic was held in Accra; and the resulting Accra Agenda for Action
aims to accelerate progress towards making aid more effective. The Agenda is complex
and political but includes extended principles on broadening ownership in development
policy, particularly at the country level, greater use of in-country systems, untying aid and

18
increasing predictability plus greater transparency. On technical assistance and capacity
building, the AAA concludes that: “Donors support for capacity building will be
demand-driven and designed to support country ownership.” Apart from recognition of
the fragmentation dangers associated with global funds, there is little on specific reform
of aid architecture.
PPIAF is one of a number of Trust Funds locate in the Bank. Other infrastructure
related Trust Funds are the Cities Alliance (CA), ESMAP, Water & Sanitation
Programme (WSP) and the Global Partnership for Output-Based-Aid. Donors are
recently reporting pledges of over $ 6 billion to the Climate Trust Funds, a pair of
investment instruments to provide scaled up funding to mitigate increases in greenhouse
gas emissions and adapt to climate change. The two Trust Funds cover the Clean
Technology Fund and the Strategic Climate Fund, the latter being broader and more
flexible and aimed to test innovative approaches. Interestingly the funds will be
administered and executed through a partnership or the World Bank Group and other
multi-laterals Developing countries will have an equal voice in the governance structures
and decisions on use of finds will be made by consensus. The first annual Partnership
Forum will have a very wide stakeholder base.
Based on the latest available “2006 Trust Funds Annual Report” from the World Bank,
there were some 929 active trust funds variously hosted at end June 2006. Annual
disbursements were US$4.4 billion and funds held around US$10.3 billion. Some 80% of
funds were from sovereign governments and under 1 % from private sources. There are
three types:
• funds supervised on behalf of donors;
• funds where the Bank acts only as financial intermediary; and
• funds used to “scale up” Bank activities.
PPIAF is in the latter category: this is the smallest of the three, adding only to some 6 %
of disbursements in 2006, but growing rapidly. Supervised funds added to 47 % and
included debt relief and reconstruction; fiscal agency funds totalled 38 % and included
majors like GEF, GFATM and CGIAR.
Of the 929 funds, IBRD operates 95% by disbursement value and the IFC 5 %( or 15),
with MIGA having a nominal residual share. In terms of infrastructure related funds or
programs size, PPIAF is at the larger end. In FY 2006, it spent US$17 million, the same
as FIAS but less than WSP (US$18 million); ESMAP spent US$5 million, Cities Alliance
some US$9 million and SSATP around US$4 million. Outside the segment, CGAP also
spent some US$ 9 million but GFATM disbursed US$1.32 billion. Interestingly, the IFC
is reported as spending US$75 million on technical assistance, from all sources, mainly on
advisory services.
3.2.2. IFC
In PPIs in infrastructure, the IFC will be increasingly important. Traditionally the IBRD
and the IFC have co-existed rather than proactively co-operated; they have different

19
cultures, procurement and safeguards. Under the new President and pressure from
donors following the IDA 15 replenishment, IBRD/ IDA and IFC will be incentivised
to work closer. Our consultations also suggested a greater degree of strategic and
operational cooperation within the World Bank Group going forward, which should
have positive implications for PPIAF.
Under IDA 15, some US$1.75 billion went to the IFC and there is a joint IFC / IDA
secretariat. Some 50% of IFC investment should be in “frontier” states. There is a move
to match IFC investments with IDA credits or sequence. In the IFC, infrastructure is one
of five advisory business lines and the TA Trust Funds program largely supports project
development activities and private sector development. In FY 2006, they managed a total
of US$134 million in technical assistance often sourced from IFC retained earnings; this
was centralised and then pooled regionally. The IFC Technical Assistance Trust Funds
Program is collectively sponsored by 23 donor countries and spends between US$15 to
US$20 million per year; this compares to around US$65 million per year from IFC
profits. Infrastructure is running at 30% of all technical approvals (including DevCo).
3.2.3. Overlap or Co-operation?
The PPIAF global enabling environment niche for PPI appears to have been well
regarded respected and there are no major competing initiatives. Of the original core
activities allowed by the Charter, only pioneering transactions support is part of the remit
of a number of regional and other (PIDG or IFC or DFI) project development and
investment facilities. The PPIAF program council represents around 15 donors and
covers all those with a continuing infrastructure interest; partnerships are also being
proactively pursued with emerging new players, like revitalised AfDB and the Africa
Infrastructure Forum. China and India are also a focus. The SNTA window is
complementary and reinforces the PPIAF platform compared to other initiatives. PPIAF
is also now an observer at PIDG.
In terms of other Bank Group technical assistance programs, apart from the IFC, the
potential overlap with FIAS seems well managed unless there is a bigger move into
directly productive agriculture or industry; here reference would also have to given to
water and sanitation programs. PPIAF client definitions have also been softened to
include commercial public sector only operations, at national and local levels.
The Investment Climate Facility (ICF) for Africa is a new public-private partnership
based in Dar Es Salaam which aims to remove real and perceived constraints on the
investment and business climate. One of its eight themes is facilitating infrastructure. It
covers the 24 African countries that have signed up for the Africa peer review
mechanism under NEPAD. It is time limited to seven years; a budget of US$120 million
is anticipated for the first five years; DFID, the IFC and the EC plus the Netherlands are
the start up donors. Corporate investors – at US$2.5 million each – include Celtel,
Microsoft, Anglo, Shell, SAB Miller , Unilever and Standard Bank .
There is a thin line between overlap and co-operation, particularly when most bilateral
and multi-lateral institutions actively seek “leverage.” A possible partner could be FIRST,
the global financial sector capacity initiative that was outsourced, but is now hosted by

20
the Bank. GPOBA and CA co-operation is already advanced; PPIAF is also looking to
extend links with EBRD and the EIB.
DFID have developed a portfolio of some 15 PSI initiatives including many of those
mentioned above. It was a lead champion and remains a major financier of PPIAF; many
of the European donors are also active in other initiatives, both PIDG and non-PIDG,
or small scale sector specific programs. The PPPUE predates PPIAF and was a policy
based urban technical assistance vehicle operated by UNDP but funded by DFID; there
was attempts to merge it with PPIAF but eventually DFID exited from funding in
around 2005 and PPPUE appears to have ceased to operate.
PPIAF is seen by contributing donors as addressing a continuing market failure and has
influenced the design of other programs via its relatively low cost, increasingly
decentralised business model. After a decade there is increasing pressure to demonstrate
development outcomes and impacts; IFC have embraced this different M & E reporting
framework and use it positively to secure grants. Internally PPIAF has been and
continues to be very important for the Bank in its analytical and knowledge agenda; it
also allows it buy-in skills and expertise it does not have or has lost. The wider and
deeper use of PP infrastructure solutions is a major pillar of the Bank’s SIAP 2009-11,
this envisages significant increases in Bank / IFC and MIGA infrastructure financing.1
1 SIAP envisages scale up of Bank Group infrastructure financing from around $ 41 billion in 2004 -07 , to
between $ 59 to $ 72 billion over 2008-11.

21
4. ANNEX 4: ANALYSIS OF THE TRENDS IN PPI BY REGION
This Annex summarises the PPI activity, both in terms of number and value of projects,
across regions in the period 1996-2007. The broad objective of this exercise is to get an
idea of PPI activity by region/ sector, and map that to the extent possible with the
PPIAF activities, to understand the linkages between the two. However, as set out in
Figure A4.1., our initial analysis of PPI activity over years, say in Sub Saharan Africa
(excluding Republic of South Africa), which is a main focus of PPIAF activities, does not
particularly show any trends. PPI activity has fallen since it’s peak in 2001but recovered,
albeit to a lower peak, in 2005.
Figure A4.1.: PPI spend in SSA
PPI spend in SSA, excluding RSA ($m)
0
1000
2000
3000
4000
5000
6000
7000
8000
9000
2000 2001 2002 2003 2004 2005 2006
PPI spend in SSA ($m)
PPI spend in SSA ($m)
The rest of this section presents the PPI information in summary tabular form by region.
Table A6.1. shows PPI activity in Sub-Saharan Africa (excluding South Africa), Table
A6.2. South Asia, Table A6.3. East Asia and Pacific, Table A6.4 Middle East and North
Africa, and Table A6.5. Europe and Central Asia and finally, Table A6.6 Latin America
and Caribbean.

22
Table A4.1: PPI projects and investments (in US $) in Sub-Saharan Africa 1996-2007 (excluding projects in Republic of South Africa )
Sector / subsector
Observations Total no. of projects
Value of commitments
ENERGY • More than a third of PPI investment in energy during this period took place before 2000.
• Since then, investment has been erratic, with 2001, 2003 and 2005 all seeing investments of more than $1b.
• Only a fifth of projects have involved investments of more than $150m.
• Nigeria and Mozambique together account for one-third of sector investment, although the latter is mostly in the gas sub-sector.
• Almost 63% of investments have been greenfield.
66 7,395
Electricity generation
• Projects involving electricity generation involved, on average, and investment of almost $90m. 84% of investments have been through greenfield projects.
• More than a third of investments have been made in Nigeria. Kenya, with nine percent of investments, closed greenfield projects and the KenGen divestiture.
• Investment in Tanzania and Zimbabwe amounted to almost 30%.
• Almost half of electricity generation investments took place before 2000; this has been erratic since. Larger scale IPPs were mostly undertaken during the 1990s.
43 3,837
Electricity distribution / transmission
• There has been very little investment since 2000, with the exception of the Umeme Concession in 2005. 78 % of investments came through divestitures.
• The average project involved an investment of $51m, although projects involving some transmission network investment were larger.
• Zambia accounts for two-thirds of investment in networks, while Uganda received 20%. Around 12% was the 1999 Electa project in Cape Verde
8 411
Integrated electricity generation and distribution/ transmission
• Virtually all (99%) integrated projects took place between 1999 and 2001, and all were made on a concession basis.
• Integrated projects tended to be much larger, on average, than separate network or generation projects.
• The largest commitment, accounted for 42% of investments in integrated projects, was the 2001 AES Sonel Concession in Cameron.
11 1,268
Gas distribution / transmission
• Two projects, accounting for 95% of gas sector investments, took place in 2003 and 2005: the Mozambique-South Africa Gas Pipeline BOO, worth $1.2bn, and the West African Gas Pipeline, worth $590m. All four projects were greenfield.
• While the average gas sector project involved an investment of almost $470m, projects with
4 1,879

23
Sector / subsector
Observations Total no. of projects
Value of commitments
grater transmission network components were larger. TRANSPORT • Three quarters of transport investment occurred in the years 2003-07, with about 50%
in 2005 alone.
• More than 85% of investments were concessions, with the majority of others coming through greenfield projects.
• More than half of transport investments took place in Nigeria, with Mozambique and Kenya accounting for another quarter.
• Nearly three quarters of projects were less than $75m in value, with just 11% grater than $150m.
66 5,139
Ports • 60% of transport investments took place in the sea-port sector, with Nigeria accounting for 78% these.
• Three-quarters of investments took place in 20 projects in 2005 alone.
• 32 projects were Concessions, accounting for 90% of investments.
42 3,079
Airports • 85% of investments were through greenfield projects, in particular the 2006 Murtala Muhammed Terminal ROT project in Nigeria, accounting for three-quarters of sub-sector investment.
5 261
Rail • 23% of transport investments took place in the rail sector, with the $404m Kenya-Uganda rail Concession in 2006 accounting for a third of these.
• Three-quarters of investments overall have taken place between 2003-07.
• More than 90% of investments involved an element of rehabilitation, in particular based on freight traffic in Franco-phone West Africa.
17 1,223
Roads/bridges • The 1999 Abidjan Lagoon Toll Bridge BOT and 1997 Mozambique-South Africa N4 Toll Road Concession were the sum of sub-sector investments.
• There have been no new PPI investments since 2000.
2 576
WATER & SANITATION
• All projects other than the 2007 Omdurman Water Treatment Plant BOT in Sudan were management/ lease contracts. Ten of the fifteen involved no new investment. Five projects have taken place between 2003 and ’07.
15 178
Full network • There has been a relatively consistent stream of discrete network projects over the period in Anglophone and Francophone countries.
13 57
Bulk water supply / treatment
• In addition to the Sudanese plant, the other project was a lease contract for a sewerage treatment plant in Namibia.
2 121

24
Sector / subsector
Observations Total no. of projects
Value of commitments
TELECOMS • 39% of investments took place between 1996 and ’99, with another third in 2001 alone. Although only 11% has taken place since 2003, this still amounts to $2.3bn.
141 21,225
Fixed access and long distance only
• 70% of fixed line only investment was made before 2000.
• Sudan, Ghana, Nigeria and, in particular, Cote D’Ivoire account for 95% of fixed network investments.
22 2,060
Some element of mobile.
• 14 projects took place in 2001 alone, amounting to almost $6.9bn. Around $775m was invested between 2003 and ’05, compared to more than a billion dollars in 2006 alone.
• Almost half of investments took place in Nigeria.
102 19,166

25
Table A4.2: PPI projects and investments (in US $) in South Asia 1996-2007
Sector / subsector
Observations Total no. of projects
Value of commitments
ENERGY • Majority of activity in the energy sector is in electricity generation.
• A little less than half of the projects have been relatively small in size (<$75m), with 41% of the projects being large (>$150m)
• 42% of the activity in this sector has taken place before 2000 i.e. 1996 to 1999
• Majority of the projects have been Greenfield projects (86%)
100 22,348
Electricity generation
• Three-fourths of the electricity generation projects have been in India.
• Less than half (43%) of the projects took place prior to 2000 (i.e. in the 4 year period 1996-1999), with the balance taking place in the 8 year period from 2000-07. In terms of investment commitments as well, the projects from 1996-99 accounted for 43% of the total investment commitments over the concerned period.
• Majority of the electricity generation projects are Greenfield, with 3 divestures only – 2 in India and 1 in Pakistan.
• 80% of the projects are thermal power with the remainder being hydro/ wind.
87 20,056
Electricity distribution / transmission
• PSP in this sub sector limited to India (missing data?)
• Projects have been a mix of Greenfield, concessions and divestures- with the latter being the largest share of projects.
9 1,308
Integrated electricity generation and distribution/ transmission
• Karachi Electric Supply Company (KESC) is the only divesture of a vertically integrated electricity utility in the South Asia region with 73% private ownership.
1 342
Gas distribution / transmission
• Natural gas forms a small proportion of total energy projects, with 1 relatively large project in India and the remaining 2 being fairly small projects (<$75K)
3 641
TRANSPORT • Again, majority of the activity has been in India – 116 of the 123 projects, $12,536m of the total $13,176m
• The roads sector has been most active, with 92 projects, followed by ports and airports at 21 and 7 respectively. Overall figures point to a large number of small projects in the roads sector and fewer number of projects in the airports sector, but involving high investment commitments.
• Post 2004 has been the relatively more intensive period with investment commitments exceeding $1,000m p.a. (prior to 2004, investment commitments have been in the early
123 13,176

26
Sector / subsector
Observations Total no. of projects
Value of commitments
hundred millions). The year 2007 has seen a huge escalation with total investment commitments equalling $7,289m (peak of 45 projects in this year).
• Majority of the projects have been concessions and Greenfield, with management contracts being very few.
Ports • Approximately half of the port projects have been medium to small in size (<$150m), with the largest port project being $440m.
• Majority of the projects are in India, having achieved financial close post 2000. (No project outside of India in South Asia has achieved financial close in this sector).
• Majority of the projects have been Greenfield, with only one management contract.
21 3,056
Airports • 7 projects over the period, with 5 in India – large projects are the concessions (BOT including rehabilitation) of the two big city airports- Delhi and Mumbai. These two projects on their own account for $2,538m of investment commitments.
7 3,301
Rail • Very little PSP activity – all 3 projects in India. 3 218
Roads/bridges • Most successful transport sector with a lot of activity in India and some in Bangladesh.
• The year 2006 saw a number of projects achieving financial close (37)
• Bulk of the projects were medium to small scale in nature with approximately 13 projects exceeding investment commitments of $150m.
92 6,600
WATER & SANITATION
• Mostly small sized projects; all in India
9 255
Utility • 1 management and lease contract in India 1 0
Bulk water supply/ treatment
• A mix of Greenfield projects and management contracts, with one concession 8 255
TELECOMS • PSP activity is more widespread covering more South Asian countries apart from India such as Nepal, Bhutan, Maldives, and Afghanistan.
• All Greenfield projects except for 1 divesture in Sri Lanka.
• Mostly very large projects (27 of 42 exceed $150m in total investment commitments). Large projects often include both fixed line, mobile access and long distance.
• 1996-1999 saw a lot of activity in this sector
42 25,024
Fixed • Most of the larger projects were pre- 2000. 12 2,328
Mobile • Most projects are for mobile access. 30 22,694

27
Table A4.3: PPI projects and investments (in US $) in East Asia and the Pacific 1996-2007
Sector / subsector
Observations Total no. of projects
Value of commitments
ENERGY • China accounts for more than two-fifths of energy investment in the period, more than 60 percent of which came before between 1996 and 1999.
• Indonesia, Malaysia, Philippines and Thailand are significant others.
• More than half of projects took place between 1996-1999.
• Just under two-thirds of projects have been less than $75m in value, while less than a quarter has been more than $150m.
• Almost all projects are in electricity and natural gas. Projects in the former have been, on average, almost six times as large than in the former.
395 65,702
Electricity generation
• Almost 88% of energy sector PPI investment took place in electricity generation, with around 43% small projects and 39% large.
• The average investment in these projects was $265m.
• More than two-thirds of the generating projects over the period were closed in 1996 and 1997.
• 90% of Vietnam’s energy sector projects were in electricity generation, while China engaged in nearly 100 over the period.
• More than three-quarters of generation projects were greenfield, with the rest mostly divestitures.
217 57,586
Integrated electricity generation and distribution/ transmission
• The average size of these integrated projects was less than $65m, with five of them being small and only one large project.
• All but one of the projects was a partial divestiture.
• All but one of these projects took place in China, the other being the Shoreline concession in Tonga.
8 525
Electricity distribution / transmission
• The only electricity distribution project was the 2003 Subic Bay Power Distribution project in the Philippines, a Rehabilitate, Operate and Transfer (ROT) concession worth $7m.
1 78
Gas distribution / transmission
• Almost all (161) of the natural gas sector projects took place in China. None of them were in Pacific Island countries.
• More than three-quarters of these projects were greenfield, mostly on a BOT basis.
• Greenfield and divestiture gas transmission projects were, on average, comfortably larger than half a billion dollars.
169 7,513
TRANSPORT • PPI investment in transport was restricted to the East and South East Asian economies rather than the Pacific region.
246 54,663

28
Sector / subsector
Observations Total no. of projects
Value of commitments
• There was steady PPI investment in transport over the twelve years, albeit with more than a quarter in 1996 and 1997.
• Two-thirds of transport investment has occurred in China, with a fifth in Malaysia and almost ten percent in Indonesia.
• Around 43% of projects are small, with around 47% grater than $150m. Ports • Almost 60% of port projects were greenfield investment. More than half of projects were
prepared on a BOT basis.
• 83% of port investment occurred in China.
64 14,235
Airports • Cambodia, Malaysia, Philippines and Thailand together accounted for 41% of airport investment, with China the rest.
• More than 80% of this investment was in combined runway/terminal projects, most of which were divestitures.
23 4,020
Rail • Railroad projects are comfortably the largest in the transport sector, amounting on average to almost $630m.
• Malaysia and China account for virtually all rail investment.
• Around 60% of this investment was in greenfield projects, and around 70% on a BOT or BROT basis.
• More than half of the investment over the period occurred in 1996-97, although 2006 saw a sharp upswing.
16 10,076
Roads/bridges • Road projects account for nearly half of PPI investment over the period, over a third of which is accounted for by Indonesia and Malaysia, but 60% by China.
• Two-thirds of road projects are Greenfield.
• Road building dramatically picked up between 2005 and 2007, during which time two-fifths, of investment over the period as a whole. Took place.
143 26,332
WATER & SANITATION
• Water-sector investment has been erratic, with more than a third of investment occurring in 1997 alone.
• This investment has been fairly even distributed across China, the Philippines and Malaysia.
• Only 16% of investment has been in greenfield projects; 80% has been in divestitures.
270 23,042
Utility network • Three-quarters of investment has been in water utilities of which around half has included sewerage.
• The majority of this took place in Malaysia and the Philippines.
49 17,446

29
Sector / subsector
Observations Total no. of projects
Value of commitments
• The average investment in water utilities was more than $350m, fourteen times the average treatment plant investment. The average utility concession is $462m.
Treatment plant • China accounted for more than three-quarters of investment in treatment facilities was made in China, equating to 92% of projects.
• Half of investments arose through management/ lease contracts.
221 5,597
TELECOMS • Around sixty percent of PPI investment in telecoms occurred before 2000, with no new projects recorded since 2004.
• Around 95% of this is accounted for investments in China and Indonesia.
• The average project in the sector was almost $1bn.
25 24,497
Fixed and long • All fixed and long telecoms investment has taken place in China and Indonesia over three separate years: 1996, 2001 and 2002
• Nearly three-quarters of investment was made before 2000.
7 7,720
Mobile or mobile combined
• Almost 70% of investments were made in projects involving mobile phones in at least some form.
• Countries other than China and Indonesia have been subject to these investments, including Lao, Thailand and Vietnam.
18 17,227

30
Table A4.4: PPI projects and investments (in US $) in Middle East and North Africa 1996-2007
Sector / subsector
Observations Total no. of projects
Value of commitments
ENERGY • Annual PPI investment in energy has fallen since a high $4.6bn in 1997. Nearly half of the investment in the period was between 1997-1999.
• Half of all energy investment occurred in Morocco, with around a fifth in Algeria and 14% in Oman. The average project size was larger in these counties also, particularly Morocco and Algeria.
• Around 71% of projects were greater than $150m in size.
• Investments were split evenly between Greenfield projects and concessions.
28 14,161
Electricity generation
• More than half of all energy sector projects took place in electricity generation, nearly 80% of electricity generation projects were greenfield.
• The only divestiture was worth $1.5bn.
• The average project investment was almost $370m.
• Investments in generating capacity were fairly evenly split between Algeria, Morocco, Egypt and Oman.
• 46% of investments took place between the years 2004-2007.
20 7,363
Integrated electricity generation and distribution/ transmission
• One integrated project took place in the period, the 2001 Salah Power ROT Concession in Oman.
1 270
Electricity distribution / transmission
• Four projects worth a total of more than $5.1bn took place between 1997 and 2001. All of these were ROT Concessions in Morocco.
4 5,107
Gas distribution / transmission
• Three projects worth $1.420bn were undertaken in Algeria, Tunisia and Egypt.
• The 2006 Algerian greenfield Medgaz Pipeline project is worth nearly $1.2bn.
• Both other projects took place in 1998.
3 1,420
TRANSPORT • Almost a third of transport investments took place in 2007, with three projects in Algeria, Jordan and Tunisia.
32 5,406
Ports • 45% of seaport investments were made in Egypt, with more than 17% in Djibouti and a quarter shared between Morocco and Oman.
• Two-thirds of investments were made between 2002 and 2006.
• Almost 80% of investments were concessions.
17 2,855

31
Sector / subsector
Observations Total no. of projects
Value of commitments
Airports • Two large airport concessions in 1997, Queen Alia International Airport in Jordan and Enfidha and Monastir International Airports in Tunisia, accounted for three quarters of all sectoral investment in the period.
• Much of the remaining airport investment was closed in 2001 in Egypt and Oman, including the greenfield Borg El Arab Airport.
12 2,103
Rail • Rail investment in the period took place in two projects: the Algiers Metro lease contract in 2007 and the Aqaba BROT rail concession in 1999.
2 343
Roads/bridges • The sole road PPI during the period was the greenfield Dongying Yellow River Roadway Bridge BROT in 2001.
1 104
WATER & SANITATION
• Of the 14 projects in the sector since 1996, nine have been since 2005.
• A majority of investments and projects undertaken were in Algeria.
14 1,082
Utility network • Utility projects were spread between Algeria, Jordan, Lebanon, Oman and the Palestinian territories.
* Investment values are unavailable for several utility projects.
8 0*
Treatment plant • The two largest water and sanitation projects were greenfield BOT desalination plants in Algeria.
6 1,082
TELECOMS • More than half of telecoms projects were undertaken between 2003-2006.
• North Africa was the focus of investment: Egypt and Morocco accounted for 57% of commitments, with Algerian and Tunisia also prominent.
35 29,900
Fixed and long • Projects with no mobile phone element were concentrated in Algeria and Egypt. 6 1,501
Mobile or mobile combined
• 95% of investments involved some mobile phone element in the project.
• Combined projects, i.e. those involving fixed and long distance access as well as mobile telephony, were, on average, two to three times the size of those involving just the latter.
29 28,399

32
Table A4.5: PPI projects and investments (in US $) in Europe and Central Asia 1996-2007
Sector / subsector
Observations Total no. of projects
Value of commitments
ENERGY • More than half of investments took place between 2002 and 2006.
• Around 62% of investments were divestitures, with less than a quarter greenfield.; 22% of investments were made in Turkey, with 57% in EU accession countries.
151 33,343
Electricity generation
• Almost half of energy investment was made in projects with some element of increased generating capacity.
• Almost 80% of greenfield projects were electricity generation (e.g. IPPs).
• Turkey accounts for a third of generation investments, with Bulgaria, Kazakhstan and Poland between them accounting for another 38%.
• The average generation project was around $200m in size.
80 15,944
Integrated electricity generation and distribution/ transmission
• The only completely integrated projects in the electricity sector were late 1990s divestitures in Estonia and Ukraine.
2 0
Electricity distribution / transmission
• Three-quarters of investments took place between 2002 and 2006.
• Projects involved an investment of, on average, just over $100m.
• Bulgaria accounts for a quarter of all network investments, with another half in the other EU accession countries. Macedonia and Azerbaijan received 9% each.
• More than 90% of investments were divestitures.
42 4,289
Gas distribution / transmission
• Almost 40% of energy investments were made in gas sectors.
• Outside of the EU, Croatia received 29% of gas sector investments, Russia 13%, Belarus 4% and Turkey 15%.
• Investments, on average, were almost half a billion dollars in size.
• Projects involving some element of transmission infrastructure were almost $1.25bn in size.
• Gas projects accounted for 20% of greenfield projects.
27 13,109
TRANSPORT • There has been a sharp pick-up in PPI investment in transport between 2004-07, with 78% of investments over the period falling into these years.
• Around two-thirds of this was split between Turkey and Hungary, with Croatia and Poland also prominent.
• 43% of funds were invested through concession arrangements, with over a quarter in greenfield projects and a quarter management/ lease contracts.
61 17,589

33
Sector / subsector
Observations Total no. of projects
Value of commitments
• The average project was worth around $300m; 43% of projects are smaller than $75m and 33% greater than $150m, implying a skewed distribution.
Ports • Despite no PPI investment in ports in 2001, more than $1.5bn was subsequently invested in the following six years.
• 61% of investment took place in Turkey, with the rest split between Poland, Latvia and Jordan.
• More than have of the investments in ports were concluded through concession agreements, with more than a third Greenfield.
19 2,091
Airports • The average size of contract was almost $360m.
• Virtually all (87%) investment has taken place since 2005.
• Hungary and Turkey accounted for more than 80% of airport investment.
• Around half of airport deals were management/ lease contracts, with 41% concessions and only 10% Greenfield.
27 9,666
Rail • There have been far fewer rail projects, and as a result investment has been much more erratic over time, with 97% of investment being accounted for by two projects, one which was cancelled in Estonia and the Shar-Ust-Kamenogorsk Railway Concession in Kazakhstan.
7 530
Roads/bridges • Two-thirds of road investment occurred between 2004 and 2007, all taking place in Croatia, Hungary and Poland.
• Almost 60% of investment was Greenfield.
8 5,302
WATER & SANITATION
• More than a quarter of water sector investment took place before 2000 in the period, although this has subsequently picked up, with $1.9bn investments between 2003-07.
• More than a quarter of investments took place in Russia, with Romania and Turkey together accounting for almost 40%.
75 5,274
Utility network • Around 40% of investment during the period took place in the year 2000, with another third being secured between 2005 and 2007.
• The average utility network investment was $53m, with a third of investment overall taking place in Romania.
67 3,449
Treatment plant • 58% of investment in treatment plants during the period took place before 2000.
• The average treatment plant project involved an investment of $230m.
• Have of all investments in treatment plants took place in Turkey, with a further third in Russia.
8 1,825
TELECOMS • More than two-thirds of telecoms investment took place before 2000, although there 151 69,736

34
Sector / subsector
Observations Total no. of projects
Value of commitments
was more than $12.5bn between 2005 and 2007.
• 16% of investments have taken place in Turkey, with around half in the EU accession countries (including nearly $2bn in Poland).
Fixed and long • Three quarters of fixed line projects took place between 1996 and 1999.
• 37% of investments took place in Poland, with 18% in Turkey.
39 17,953
Mobile or mobile combined
• 54% of projects were closed before 2000.
• 42% of investment has taken place in EU accession countries, with Ukraine, Turkey, Serbia and Russia together accounting for 37%.
112 51,784

35
Table A4.6: PPI projects and investments (in US $) in Latin America and the Caribbean 1996-2007
Sector / subsector
Observations Total no. of projects
Value of commitments
ENERGY • Almost 70% of investments in Energy came before 2000. While only 7% of investments were made between 2004 and 2006, this amounted to $7.7bn.
• 58% of investments were made in Brazil, with 23% in Argentina, Colombia and Mexico. 64% of investment in Brazil was in 1996-98.
• Investments were made through more than $49bn in Greenfield projects, almost $56bn in divestitures and $1.2bn in concessions.
• The average investment was more than $285m per project, with 39% of projects smaller than $75m, and 46% greater than $150m.
372 106,307
Electricity generation
• Investments in electricity generation have been relatively spread over the period but have still clearly fallen since the 1990s, with 57% 1996-99, 34% 2000-03 and 8% 2004-06.
• Less than half of investments in projects involving new generating capacity were made in Brazil, with Argentina and Mexico sharing 23%, and 22% in Peru, Colombia, Chile and the Dominican Republic.
• Two-thirds of investment was Greenfield.
• Generation projects involving network investment, gas transmission or electricity distribution, were, on average, four times the size of generating only projects.
213 49,279
Integrated electricity generation and distribution/ transmission
• 93% of investments in integrated electricity infrastructure were made in 1996-97, and were all divestitures.
• Integrated projects were worth, on average, $685m, virtually all in Brazil.
12 8,215
Electricity distribution / transmission
• Despite encouraging signs in 2006, with almost $2.3bn invested, 72% of sector investment took place in the years 1996-98. More than 80% of regional electricity network investment consisted of divestitures.
• Three quarters of network investments were made in Brazil, with another 11% in Argentina.
• The average project was worth nearly $390m, and was much larger for projects involving distribution elements.
85 32,890
Gas distribution / transmission
• 80% of gas investment over the period was in 1996-98. Between 2004 and 2006, there was just $181m PPI investment.
• Brazil accounts for 37% of investments, with Bolivia picking up 20%.
• Gas transmission projects involved investment, on average, of $378m, compared with $169m
62 15,922
36
Sector / subsector
Observations Total no. of projects
Value of commitments
for distribution projects.
• 70% of investments were Greenfield, with a further 27% divestitures.
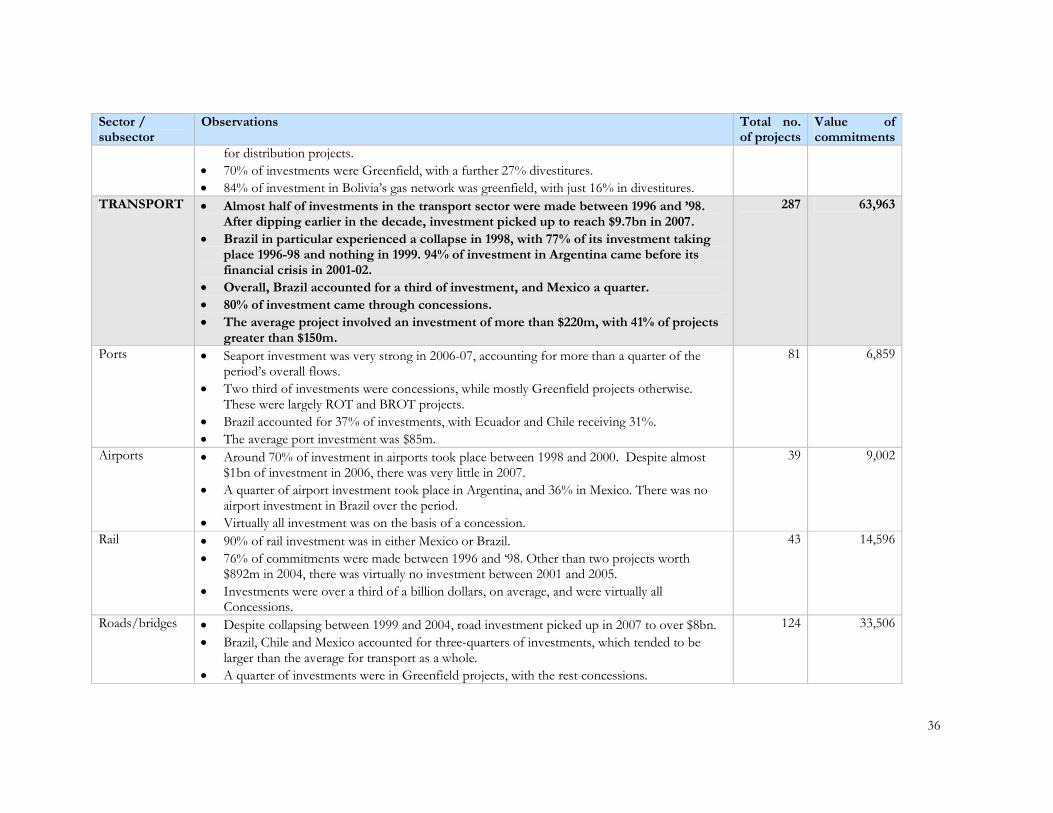
• 84% of investment in Bolivia’s gas network was greenfield, with just 16% in divestitures. TRANSPORT • Almost half of investments in the transport sector were made between 1996 and ’98.
After dipping earlier in the decade, investment picked up to reach $9.7bn in 2007.
• Brazil in particular experienced a collapse in 1998, with 77% of its investment taking place 1996-98 and nothing in 1999. 94% of investment in Argentina came before its financial crisis in 2001-02.
• Overall, Brazil accounted for a third of investment, and Mexico a quarter.
• 80% of investment came through concessions.
• The average project involved an investment of more than $220m, with 41% of projects greater than $150m.
287 63,963
Ports • Seaport investment was very strong in 2006-07, accounting for more than a quarter of the period’s overall flows.
• Two third of investments were concessions, while mostly Greenfield projects otherwise. These were largely ROT and BROT projects.
• Brazil accounted for 37% of investments, with Ecuador and Chile receiving 31%.
• The average port investment was $85m.
81 6,859
Airports • Around 70% of investment in airports took place between 1998 and 2000. Despite almost $1bn of investment in 2006, there was very little in 2007.
• A quarter of airport investment took place in Argentina, and 36% in Mexico. There was no airport investment in Brazil over the period.
• Virtually all investment was on the basis of a concession.
39 9,002
Rail • 90% of rail investment was in either Mexico or Brazil.
• 76% of commitments were made between 1996 and ‘98. Other than two projects worth $892m in 2004, there was virtually no investment between 2001 and 2005.
• Investments were over a third of a billion dollars, on average, and were virtually all Concessions.
43 14,596
Roads/bridges • Despite collapsing between 1999 and 2004, road investment picked up in 2007 to over $8bn.
• Brazil, Chile and Mexico accounted for three-quarters of investments, which tended to be larger than the average for transport as a whole.
• A quarter of investments were in Greenfield projects, with the rest concessions.
124 33,506

37
Sector / subsector
Observations Total no. of projects
Value of commitments
WATER & SANITATION
• More than three-quarters of investments in the water sector were made between 1996 and 2000, including over $6bn in 1999. Annual investments have not totalled more than $1bn since 2001.
• Brazil, Chile and Argentina account for 72% of investments.
• 37% of investments were divestitures, with 53% concessions.
• More than three-quarters of projects were worth less than $75m, with the average project just over $100m.
166 17,003
Utility network • The average utility investment was almost three times the size of investments in treatment plants.
• 87% of investments took place before 2002.
• 78% of investments were made in Argentina, Brazil and Chile.
• 41% of investments were concessions, with 59% divestitures.
130 15,364
Treatment plant • Half of the investments in treatment plants were made between 2004 and ’07, following two years of zero investment.
• Investment is highly concentrated in Mexico (62%), and 95% of the total were in greenfield projects.
36 1,638
TELECOMS • 83% of telecoms investment took place between 1886 and ’98, with $76bn in 1998 alone. In contrast, there has been only $1.3bn since 2002.
• 61% of investments were divestitures, and 78% took place in Brazil.
96 117,484
Fixed and long • Virtually all investment in telecoms with no mobile phone element took place in the 1990s. 36 36,578
Mobile or mobile combined
• Since 2001, in which $12.5bn was invested in projects with some mobile phone component, there has been less than $1bn investment in total.
60 80,906

38
5. ANNEX 5: AN ANALYSIS OF PPIAF’S PORTFOLIO USING THE
SUGGESTED REVISED CATEGORISATION OF ACTIVITIES
In this annex, we present an analysis of the PPIAF portfolio by geography, sector,
intervention size, and activity focus as a means to consider the extent to which PPIAF
activities are relevant to the current market context and needs.
5.1. Geography
Figure A5.1 below presents the percentage share of total annual PPIAF spend for each
region (including global activities) for the period 2000-08. As can be seen from the figure,
the SSA region has on average received over 22% of total PPIAF annual spend since 2000,
with its share in 2007 and 2008 being the highest (44% and 45% respectively). This has
commensurately resulted in a relative reduction in PPIAF expenditure in the LAC and EAP
regions in recent years. Overall, the MENA region has received the smallest share of PPIAF
activities (4%), but has shown some growth in recent years.
Figure A5.1: Percentage share of total PPIAF spend per year by regions, FY2000-2008
0%
10%
20%
30%
40%
50%
60%
70%
80%
90%
100%
2000 2001 2002 2003 2004 2005 2006 2007 2008
Year
Percentage of PPIAF interventions by value
EAP ECA Global LAC MENA SAR SSA
The changing trend in regional focus over the period 2000-08 is further highlighted in Figure
A5.2 below.2 As evident, an increasing number of projects (in terms of percentage share in
total value) are being undertaken in the SSA region. The EAP, SAR and LAC regions exhibit
a declining trend. ECA and Global projects are not depicted in the graph below as the trend
line appears fairly constant.
2 For simplicity, we have calculated and presented the linear trend over time.

39
Figure A5.2: Trend in PPIAF interventions by region, 2000-2008
0%
5%
10%
15%
20%
25%
30%
35%
40%
45%
50%
2000 2001 2002 2003 2004 2005 2006 2007 2008
Linear (SSA) Linear (EAP) Linear (SAR) Linear (LAC) Linear (MENA)
Figure A5.3 below presents a geographical analysis of the value of PPIAF interventions by
the revised categorisation. The figure considers the changing trend (if any) between the two
strategic review periods - 2000-04 and 2005-08.
40
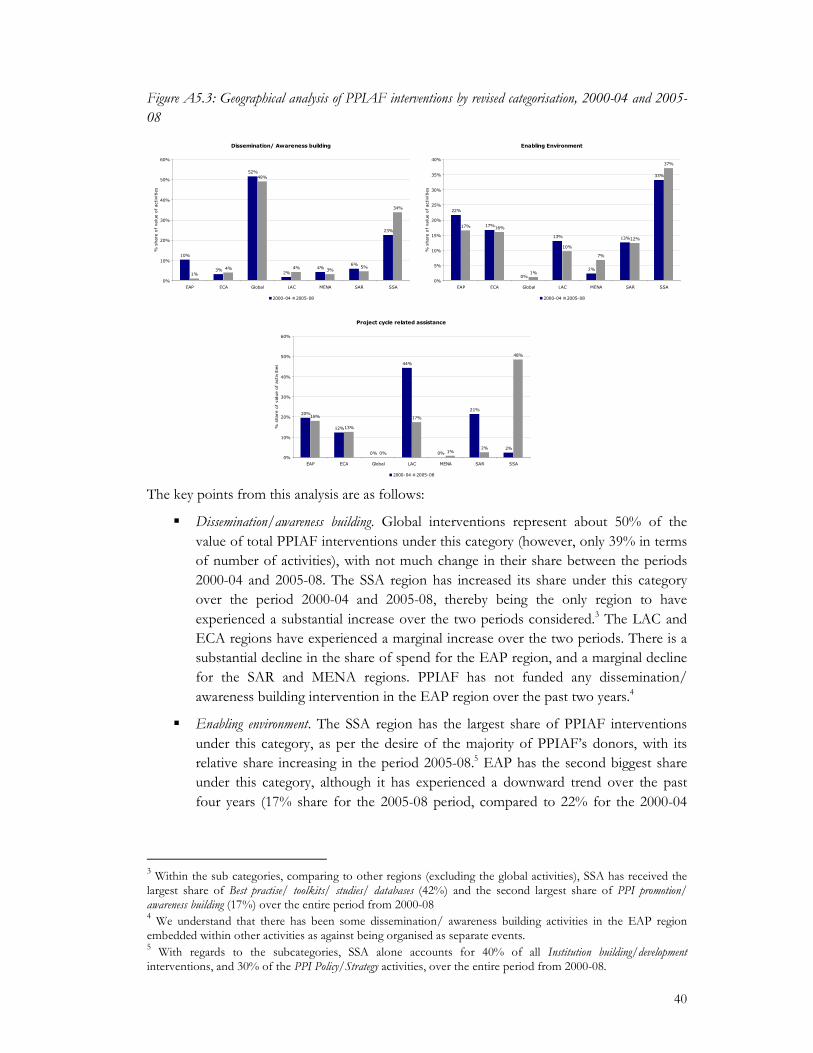
Figure A5.3: Geographical analysis of PPIAF interventions by revised categorisation, 2000-04 and 2005-
08
The key points from this analysis are as follows:
� Dissemination/awareness building. Global interventions represent about 50% of the
value of total PPIAF interventions under this category (however, only 39% in terms
of number of activities), with not much change in their share between the periods
2000-04 and 2005-08. The SSA region has increased its share under this category
over the period 2000-04 and 2005-08, thereby being the only region to have
experienced a substantial increase over the two periods considered.3 The LAC and
ECA regions have experienced a marginal increase over the two periods. There is a
substantial decline in the share of spend for the EAP region, and a marginal decline
for the SAR and MENA regions. PPIAF has not funded any dissemination/
awareness building intervention in the EAP region over the past two years.4
� Enabling environment. The SSA region has the largest share of PPIAF interventions
under this category, as per the desire of the majority of PPIAF’s donors, with its
relative share increasing in the period 2005-08.5 EAP has the second biggest share
under this category, although it has experienced a downward trend over the past
four years (17% share for the 2005-08 period, compared to 22% for the 2000-04
3 Within the sub categories, comparing to other regions (excluding the global activities), SSA has received the
largest share of Best practise/ toolkits/ studies/ databases (42%) and the second largest share of PPI promotion/ awareness building (17%) over the entire period from 2000-08 4 We understand that there has been some dissemination/ awareness building activities in the EAP region
embedded within other activities as against being organised as separate events. 5 With regards to the subcategories, SSA alone accounts for 40% of all Institution building/development
interventions, and 30% of the PPI Policy/Strategy activities, over the entire period from 2000-08.
Dissemination/ Awareness building
10%
3%
52%
2%4%
6%
23%
1%
4%
49%
4%3%
5%
34%
0%
10%
20%
30%
40%
50%
60%
EAP ECA Global LAC MENA SAR SSA
% share of value of activities
2000-04 2005-08
Enabling Environment
22%
17%
0%
13%
2%
13%
33%
17% 16%
1%
10%
7%
12%
37%
0%
5%
10%
15%
20%
25%
30%
35%
40%
EAP ECA Global LAC MENA SAR SSA
% share of value of activities
2000-04 2005-08
Project cycle related assistance
20%
12%
0%
44%
0%
21%
2%
18%
13%
0%
17%
1%2%
48%
0%
10%
20%
30%
40%
50%
60%
EAP ECA Global LAC MENA SAR SSA
% share of value of activities
2000-04 2005-08

41
period). PPIAF enabling environment interventions in the MENA region have
increased in the period 2005-08.6
• Project/transaction support. The SSA region has experienced a considerable increase
over the two periods under consideration – from 2% over the period 2000-04 to
48% over the period 2005-08.7 The LAC and SAR regions have experienced a
decline. However, important to note is that the number of activities in this category
have been much fewer than that in the other two categories discussed above.
5.1.1. Analysis by DAC country list
As shown in Figure A5.4, the Enabling environment category has the largest share of activities
in all the four DAC list columns (between 80-87% of total on average in each DAC list
column). Activities in the Project/transaction support category have a higher share in DAC list
column 1 and 3 compared to DAC list 2 and 4. In relation to the Dissemination/awareness
building category, 53% of all PPIAF approved applications belong to countries under the
DAC list column 1.
Figure A5.4: PPIAF interventions by category and DAC list8
31 1 1
27
21
34
7
2
4
1
4
0
5
10
15
20
25
30
35
40
45
DAC 1 DAC 2 DAC 3 DAC 4
Value of interventions (US$ m
)
Dissemination/Awareness building Enabling Environment Project/transaction support
5.2. Sector
Figure A5.5 below depicts the share of activities by sector in the annual PPIAF spend.
Looking at the figure, multi-sector activities have, on average, been the largest focus (37%),
followed by the energy and W&S sectors (both 19%). The telecoms sector has received the
6 Some of the detail of the yearly trend is presented in Annex 4.
7 With regards to the subcategories, SSA accounts for all Post Transaction Support interventions and 50% of the Project Preparation activities 8 Note that this analysis does not include US$40.5m (224 interventions) that could not be classified.

42
smallest share of PPIAF activities (9%), particularly in recent years where the range of
activities undertaken has been severely restricted to direct pro-poor ones.
Figure A5.5: Total PPIAF interventions by sector, FY2000-2008
0%
10%
20%
30%
40%
50%
60%
70%
80%
90%
100%
2000 2001 2002 2003 2004 2005 2006 2007 2008
Year
% of PPIAF intervention by value
Energy Multi-Sector Telecoms Transport W&S
Figure A5.6 below brings out the trend change in share of PPIAF spend by sector.9 As the
figure depicts, there has been an increasing focus on the transport and energy sectors, and a
declining focus on the W&S sector. Multi-sector and telecoms projects did not exhibit any
major change in trend over the period (and hence have not been presented in the figure).
9 Again, note that for simplicity, we have calculated and presented the linear trend over time.

43
Figure A5.6: Trend in PPIAF interventions by sector, FY2000-2008
0%
5%
10%
15%
20%
25%
30%
35%
40%
2000 2001 2002 2003 2004 2005 2006 2007 2008
Linear (Transport) Linear (W&S) Linear (Energy)
Further, Figure A5.7 presents the PPIAF re-categorised interventions by sector over the two
periods 2000-04 and 2005-08.
Figure A5.7: Sectoral analysis of PPIAF interventions by the revised categorisation, 2000-04 and 2005-08
Key points to note from the figure above are as follows:
� Dissemination/awareness building. As may be expected, multi-sector interventions
represent the lion’s share of total interventions under this category (greater than
60% over both periods), with some marginal decline in the period 2005-08.
Transport, energy and W&S sectors have experienced an increasing share over the
period 2005-08, with the reverse being the case for the telecoms sector.
Dissemination/ Awareness Building
4%
65%
4%
15%
11%9%
61%
1%
17%
12%
0%
10%
20%
30%
40%
50%
60%
70%
Energy Multi-Sector Telecoms Transport W&S
% share of value of activities
2000-04 2005-08
Enabling Environment
21%
30%
12%14%
23%22%
35%
10%
18%
15%
0%
5%
10%
15%
20%
25%
30%
35%
40%
Energy Multi-Sector Telecoms Transport W&S
% share of value of activities
2000-04 2005-08
Project cycle related assistance
5%
0%2%
23%
70%
36%
20%
2%
25%
17%
0%
10%
20%
30%
40%
50%
60%
70%
80%
Energy Multi-Sector Telecoms Transport W&S
% share of value of activities
2000-04 2005-08

44
� Enabling environment. Similar to the previous category, the biggest overall share of
interventions is multi-sector activities – having experienced an increased share over
the period 2005-08. The same holds true for transport and energy sector activities;10
however, W&S and telecoms sector have a smaller share in the period 2005-08, the
former due to lower demand and the latter a conscious policy decision.
� Project/transaction support. There has been a considerable change in the share of
PPIAF activities by value in this category over the two periods (substantial increase
in energy and multi-sector activities, and decrease in W&S activities by value).
However, projects in this category represent only a small proportion of the total
number of PPIAF projects (6%), with the average number of projects in each year
being only 3-4, except in the later years of 2006-08, when the number of project/
transaction support activities was 6, 7 and 14 respectively.
5.3. Size
In this section, we analyse the PPIAF activities by size of intervention as per the following
categorisation:
• Small – activities with a value of less than or equal to $75,000 (≤ $75,000)
• Medium – activities with a value greater than $75,000, but less than or equal to
$250,000
• Large – activities with a value greater than $250,000 (> $250,000)
An analysis of the PPIAF portfolio as per the above size categorisation over the period
2000-2008 reveals that about 45% of the interventions have been small interventions. Large
interventions follow next, with 36% share, with 6% of these being of value greater than
$500,000.
Figure A5.8 below presents the trend in the number of interventions by size over the period
2000-08 – there is a clear increase in the number of small interventions post 2004 and a
decline in the larger value interventions.
10
The share of the power sector (including energy, electricity and gas) has been relatively higher in the past two years i.e. 2007 and 2008.

45
Figure A5.8: Trend in PPIAF interventions by size, FY2000-2008
0%
10%
20%
30%
40%
50%
60%
2000 2001 2002 2003 2004 2005 2006 2007 2008
% of total number of interventions
Large (>$250K) Medium (>$75K and </=$250K) Small (</= $75K)
Analysing the trends in the size of PPIAF interventions by the revised categorisation, the
following observations can be made:
• For dissemination/ awareness building, activities that are small (i.e. ≤ $75,000) form the
largest share (68%). Large projects constitute only a small segment in this category
(17% over the period 2000-08). This has broadly been the trend over the entire
period of 2000-08.
• For enabling environment activities, 43% have been large in size. However, the share of
large activities in this category has declined over the years. Prior to 2004, the
percentage share is greater than 50% (except for the year 2000); however, post 2004,
the average share has been 37%, and down to 29% in 2008. Within the Enabling
environment category, PPI policy/ strategy and legal/ regulatory / competition framework
activities are mostly in the large size category.
• Given the high cost of activities in the project cycle related assistance category, it is not
surprising that 43% of the projects in this category are large in size. The next largest
share in the category is small interventions (39%). These, for example, include ‘lead-
in’ support that have helped catalyse further transaction activities. Overall, there has
been a higher level of activity in this category as mentioned above, across all activity
value sizes.

46
5.4. Activity
Figure A5.9 presents the broad trends in the PPIAF portfolio by the revised categorisation.
Figure A5.9: PPIAF interventions by category
0
2
4
6
8
10
12
14
16
18
20
2000 2001 2002 2003 2004 2005 2006 2007 2008
Value of interventions ($m)
Dissemination/Awareness building Enabling Environment Project/transaction support
Key points to note are as follows:
• Being the main focus of PPIAF, Enabling environment activities have received the lion’s
share of its funding each year (greater than 64% in all years).
• Dissemination/ awareness building activities as a share of the total PPIAF activity spend
have increased over the years until 2006, with 2007 and 2008 seeing a lower
proportion of the total budget devoted to projects under this category (12% and
18% respectively as against 20%+ share between 2003-06). The share by number of
projects also follows a similar trend.
• Project cycle related activities have increased, especially in 2007 and 2008, wherein they
accounted for 16% and 18% respectively of the total spend (as compared to an
average of 6% in the previous years). However the number of activities in this
category has been broadly stable – ranging between 25-30% over the 2000-2008
period.
Figure A5.10 below presents the share of total spend on PPIAF projects by the revised sub-
categories, over the two periods 2000-04 and 2005-08.
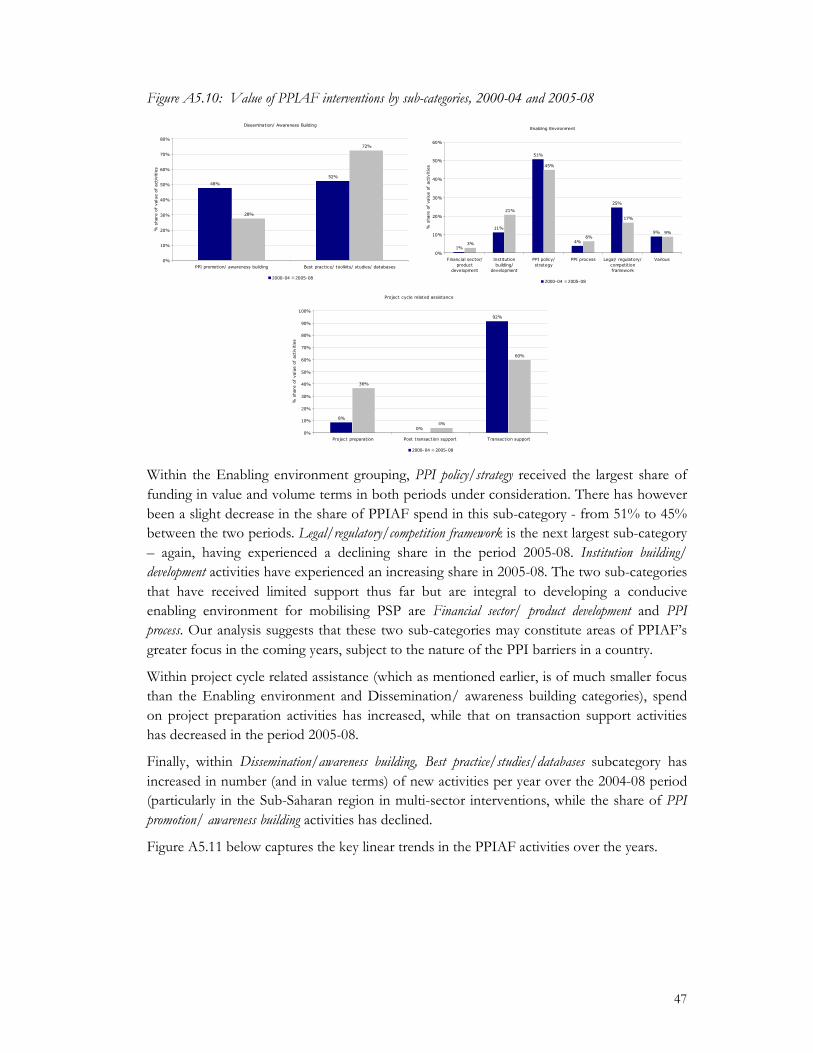
47
Figure A5.10: Value of PPIAF interventions by sub-categories, 2000-04 and 2005-08
Within the Enabling environment grouping, PPI policy/strategy received the largest share of
funding in value and volume terms in both periods under consideration. There has however
been a slight decrease in the share of PPIAF spend in this sub-category - from 51% to 45%
between the two periods. Legal/regulatory/competition framework is the next largest sub-category
– again, having experienced a declining share in the period 2005-08. Institution building/
development activities have experienced an increasing share in 2005-08. The two sub-categories
that have received limited support thus far but are integral to developing a conducive
enabling environment for mobilising PSP are Financial sector/ product development and PPI
process. Our analysis suggests that these two sub-categories may constitute areas of PPIAF’s
greater focus in the coming years, subject to the nature of the PPI barriers in a country.
Within project cycle related assistance (which as mentioned earlier, is of much smaller focus
than the Enabling environment and Dissemination/ awareness building categories), spend
on project preparation activities has increased, while that on transaction support activities
has decreased in the period 2005-08.
Finally, within Dissemination/awareness building, Best practice/studies/databases subcategory has
increased in number (and in value terms) of new activities per year over the 2004-08 period
(particularly in the Sub-Saharan region in multi-sector interventions, while the share of PPI
promotion/ awareness building activities has declined.
Figure A5.11 below captures the key linear trends in the PPIAF activities over the years.
Enabling Environment
1%
11%
51%
4%
25%
9%
3%
21%
45%
6%
17%
9%
0%
10%
20%
30%
40%
50%
60%
Financial sector/
product
development
Institution
building/
development
PPI policy/
strategy
PPI process Legal/ regulatory/
competition
framework
Various
% share of value of activities
2000-04 2005-08
Project cycle related assistance
8%
0%
92%
36%
4%
60%
0%
10%
20%
30%
40%
50%
60%
70%
80%
90%
100%
Project preparation Post transaction support Transaction support
% share of value of activities
2000-04 2005-08
Dissemination/ Awareness Building
48%
52%
28%
72%
0%
10%
20%
30%
40%
50%
60%
70%
80%
PPI promotion/ awareness building Best practice/ toolkits/ studies/ databases
% share of value of activities
2000-04 2005-08

48
Figure A5.11: Key trends in PPIAF interventions by sub-categories, 2000-08
The figure presents only some of the key trends observed in the PPIAF portfolio mix over
the years. A number of the revised sub-categories such as financial sector/ product
development and the project cycle related activities have been excluded from these figures as
the number of activities in these sub-categories is quite low.
0%
10%
20%
30%
40%
50%
60%
70%
80%
90%
100%
2000 2001 2002 2003 2004 2005 2006 2007 2008
Linear (PPI promotion/ awareness building)
Linear (Best practice/ toolkits/ studies/ databases)
0%
10%
20%
30%
40%
50%
60%
70%
2000 2001 2002 2003 2004 2005 2006 2007 2008
Linear (Institution building/ development)
Linear (PPI policy/ strategy)
Linear (Legal/ regulatory/ competition framework)

49
6. ANNEX 6: AN ANALYSIS OF PPIAF’S PORTFOLIO USING THE
TRADITIONAL CLASSIFICATION
This annex presents an analysis of the PPIAF portfolio as per the traditional classification of
activities as elucidated in its Charter. This analysis complements the one presented in Annex
6 above.
The traditional classification of PPIAF activities as per the Charter is as follows:11
• Infrastructure Development Strategies
• Policy, Regulatory and Institutional Reforms
• Capacity Building
• Consensus Building
• Pioneering Transactions
• Emerging Best Practices
The following sub-sections present the main trends in the portfolio by geography, sector,
size and activity.
6.1. Geography
Figure A6.1 below presents a geographical analysis of the PPIAF interventions by the
revised categorisation.12 The figure considers the changing trend (if any) between the period
2000-04 and 2005-08.
Figure A6.1: Geographical analysis of PPIAF interventions, 2000-04 and 2005-08
Infrastructure Development Strategies
16%
6%
0%
18%
2%
10%
48%
10%
15%
6%8% 7% 8%
45%
0%
5%
10%
15%
20%
25%
30%
35%
40%
45%
50%
55%
60%
EAP ECA Global LAC MENA SAR SSA
% share of value of activities
2000-04 2005-08
11
The Other PPIAF activity has not be included in this analysis, as it only includes 1 intervention (US$ 775,000). Source: www.ppiaf.org 12
This analysis does not include Emerging Best practices activities as over 70% of them have had a global scope.

50
Policy, Regulatory and Institutional Reforms
31%
20%
0%
10%
4%
13%
22%
27%
19%
0% 0%
27%
4%
23%
0%
5%
10%
15%
20%
25%
30%
35%
40%
45%
50%
55%
60%
EAP ECA Global LAC MENA SAR SSA
% share of value of activities
2000-04 2005-08
Capacity Building
9%
23%
10%13%
2%
17%
26%
16%13%
0%
5%
12%
7%
46%
0%
5%
10%
15%
20%
25%
30%
35%
40%
45%
50%
EAP ECA Global LAC MENA SAR SSA
% share of value of activities
2000-04 2005-08
Consensus Building
7%10%
14%
23%
10%
2%
33%
20%
27%
4% 5%
0%
6%
38%
0%
5%
10%
15%
20%
25%
30%
35%
40%
45%
50%
55%
60%
EAP ECA Global LAC MENA SAR SSA
% share of value of activities
2000-04 2005-08

51
Pioneering Transactions
0%
56%
0% 0% 0%
35%
9%
28%
11%
0%
7%
0%
6%
48%
0%
5%
10%
15%
20%
25%
30%
35%
40%
45%
50%
55%
60%
EAP ECA Global LAC MENA SAR SSA
% share of value of activities
2000-04 2005-08
The key points to note from this analysis are as follows:
• Infrastructure Development Strategies. The SSA region has the largest share of PPIAF
interventions under this category, of around 46% in value terms for over the entire
period, as per the desire of the majority of PPIAF’s donors. The LAC and EAP
region have the second biggest share under this category, around 13% each, although
both have experienced a downward trend over the past four years (for LAC: 8%
share for the 2005-08 period, compared to 18% for the 2000-04 period and for EAP:
16% compared to 10%). PPIAF interventions in the ECA region have increased in
the period 2005-08 up to 15% for the 2005-08 period.
• Policy, Regulatory and Institutional Reforms. The EAP, SSA and ECA region have
maintained their share of PPIAF intervention during the two periods analysed, EAP
being the region with the largest share in value terms (around 30%)13. The MENA
region has considerably increased its activities in this category during the 2005-08
period reaching 27% of the total category PPIAF portfolio. Finally, the SAR and the
LAC regions have experienced a decline.
• Capacity Building. The SSA region has the largest share of activities under this
category, having increased its share over the two periods under consideration from
26% over the period 2000-04 to 46% over the period 2005-08. EAP and MENA
have also increased its share of activities under this category while the ECA, LAC
and SAR regions have declined its share of about 10% each between these two
periods. Over the past four years, PPIAF has not funded any capacity building
related intervention with a global scope.
• Consensus Building. The SSA region has maintained over the years the largest share-
around 35% in value terms- of total PPIAF interventions under this category (#52,
US$5.5 m). The ECA, EAP and SAR regions have all increased their activities in this
13
In size terms, both the EAP and the SSA regions have the highest share with around 23% share each for the period 2000-08.

52
area by around 5% increase between the periods. Global PPIAF interventions and
those in the LAC region have been reduced.
• Pioneering Transactions. The SSA region has experienced a considerable increase over
the two periods under consideration – from 9% over the period 2000-04 to 48%
over the period 2005-08. The ECA and SAR region have both sharply declined their
share under this category. The former has gone from 56% share during the 2000-04
period to 11% during the 2005-08 period while the later has gone from 35% to 6%.
However, important to note is that the number of activities in this category have
been much fewer than that in the other two categories discussed above.
6.1.1. PPIAF interventions by DAC country list
Figure A6.2 presents PPIAF interventions in each of the categories by the DAC country list.
PPIAF activities under the Infrastructure Development Strategies category have largest share of
activities in all four DAC list columns (between 39-45% of total on average in each DAC list
column) closely followed by the Policy, Regulatory and Institutional Reforms category (between
33-46% of total on average in each DAC list column). It is worth highlighting that while the
DAC list column 1 and 2 have a higher share of Infrastructure Development Strategies activities
compared to DAC list column 3 and 4, these later have a higher share in Policy, Regulatory and
Institutional Reforms interventions compared to DAC list column 1 and 2. Activities in the
Pioneering transactions category have a higher share in DAC list column 1, 2 compared to DAC
list 3 and 4, with a share of around 8% each. Finally, PPIAF Consensus Building and Capacity
Building activities represent on average 10% and 3% of total activities per DAC list column
without major variations in each column.
Figure A6.2: PPIAF interventions by category and DAC list14
0
5
10
15
20
25
30
35
40
45
1 2 3 4
Value of Interventions ($m)
Capacity Building Consensus Building
Emerging Best Practices Infrastructure Development Strategies
Pioneering Transactions Policy; Regulatory and Institutional Reforms
14
Note that this analysis does not include US$ 40.5 million (224 interventions) that could not be classified

53
6.2. Sector
Figure A6.3 presents the PPIAF re-categorised interventions by sector over the two periods
2000-04 and 2005-08.
Figure A6.3: Sector analysis of PPIAF interventions, 2000-04 and 2005-08
Infrastructure Development Strategies
12%
37%
7%
20%
25%
18%
37%
7%
24%
14%
0%
5%
10%
15%
20%
25%
30%
35%
40%
Energy Multi-sector Telecoms Transport Water and Sanitation
% share of value of activities
2000-04 2005-08
Policy, Regulatory and Institutional Reforms
31%
18%20%
10%
20%
29%28%
12%
19%
13%
0%
5%
10%
15%
20%
25%
30%
35%
Energy Multi-sector Telecoms Transport Water and Sanitation
% share of value of activities
2000-04 2005-08

54
Capacity Building
8%
52%
4%8%
29%
15%
61%
6%9% 9%
0%
10%
20%
30%
40%
50%
60%
70%
Energy Multi-sector Telecoms Transport Water and Sanitation
% share of value of activities
2000-04 2005-08
Consensus Building
31%
18%20%
10%
20%
29%28%
12%
19%
13%
0%
5%
10%
15%
20%
25%
30%
35%
Energy Multi-sector Telecoms Transport Water and Sanitation
% share of value of activities
2000-04 2005-08
Pioneering Transactions
3%0%
22%
9%
66%
44%
14%
6%
13%
23%
0%
10%
20%
30%
40%
50%
60%
70%
Energy Multi-sector Telecoms Transport Water and Sanitation
% share of value of activities
2000-04 2005-08

55
Key points to note from the figure above are as follows:
� Infrastructure Development Strategies. Multi-sector activities have the highest share of
interventions under this category (greater than 35% over both periods). Transport
and energy sectors have experienced an increasing share over the period 2005-08,
with the reverse being the case for the Water and Sanitation (W&S) sector.
� Policy, Regulatory and Institutional Reforms. PPIAF interventions in the multi-sector and
transport sectors have experienced a sharp increase- of around 10% - over the later
period. However these activities in the W&S and telecoms sector have a smaller
share in the period 2005-08. Finally activities in the energy sector have remained
with a similar share – of around 30%- during both periods.
� Capacity Building. In this category, multi-sector activities represent the lion’s share of
total interventions under this category (greater than 50% over both periods).
Activities in the energy sector have increased its share from 8% for the 2000-04
period to 15% for the 20005-08 while activities in the W&S sector have been sharply
reduced by 10% from one period to the other.
� Consensus Building. Activities in this sector are better distributed across sectors than in
the other PPIAF traditional categories. All sectors hold at least 10% of share in both
periods. Energy it the sector with the highest share- around 30% for both periods.
However, similarly to other categories, PPIAF interventions in the multi-sector and
transport sector have increased in the later period while telecoms and W&S have
declined its share for around 8%.
� Pioneering Transactions. There has been a considerable change in the share of PPIAF
activities by value in this category over the two periods analysed (substantial increase
in energy and multi-sector activities and decrease in W&S activities by value).
However, it should be clearly noted that projects in this category represent only a
small proportion of the total number of PPIAF projects (4%), with the average
number of projects in each year being only 1-2, except in the later years of 2005-08,
where the average of activities has been around 5.
6.3. Size
In this section we analyse the PPIAF activities by size of intervention as per the following
categorisation:
• Small – activities with a value of less than or equal to $75,000 (≤ $75,000)
• Medium – activities with a value of greater than $75,000 but less than or equal to
$250,000
• Large – activities with a value which is greater than $250,000 (> $250,000)
The following figure presents PPIAF activities breakdown by size and by its traditional
categorisation. Across all PPIAF interventions size categories, Pioneering Transactions account
for less of 5% in each size category. Over 40% of large interventions fall under the
Infrastructure Development Strategies category, followed by Policy, Regulatory and Institutional Reforms
(32%). Over the 2000-08 period, the share of Policy, Regulatory and Institutional Reforms

56
activities has fallen from 10 average projects per year on average for the 2000-04 period to
an average of 7 projects. With regards to the size category with less interventions, the
medium size (19%), similarly 40% of interventions fall under Infrastructure Development
Strategies category followed by Policy, Regulatory and Institutional Reforms (27%) and Capacity
Building (18%).
Figure A6.4: PPIAF interventions by size and category, FY2000-2008
0
50
100
150
200
250
300
350
Large Medium Small
# Interventions
Capacity Building Consensus Building
Emerging Best Practices Infrastructure Development Strategies
Pioneering Transactions Policy, Regulatory and Institutional Reforms
Finally, for small PPIAF interventions these are more equally distributed among the main
PPIAF traditional categories (Policy, Regulatory and Institutional Reforms, Infrastructure Development
Strategies, Capacity Building, Emerging Best Practices). Moreover over 75% of PPIAF interventions
under the Consensus Building category are small in size and similarly around 50% of PPIAF
interventions under Capacity Building and Emerging Best Practices categories are small in size too.
For the latter, the 2005-08 period has experienced an increase of average projects per year
from 4 in the 2000-04 period to 9
6.4. Activity
As Figure A6.5 below shows, Infrastructure Development Strategies and Policy, Regulatory and
Institutional Reforms activities have comprised over the years an important share of PPIAF
activities, representing around 30% each of PPIAF total portfolio.15 In value terms, the
former accounts for 39% of the total portfolio (US$57m) and the later 29% (US$43m).
With regards to Emerging Best Practices, a PPIAF activity that only represents 10% of the
portfolio in value terms, 90% of them have had a global or regional scope and over 60% had
focus on multi-sector activities. Pioneering transactions comprises the smallest proportion of the
portfolio, 5% in value terms (US$ 8 m) and 4% in terms of number of activities (#27). It is
important to highlight that in FY2008 this later percentage has increased to 12% -in value
terms.
15
#233 and #189 respectively

57
Figure A6.5: PPIAF interventions by traditional categorisation
0
3
6
9
12
15
18
21
2000 2001 2002 2003 2004 2005 2006 2007 2008
Value of Interventions ($m)
Capacity Building Consensus Building
Emerging Best Practices Infrastructure Development Strategies
Pioneering Transactions Policy, Regulatory and Institutional Reforms

58
7. ANNEX 7: PPIAF GOVERNANCE STRUCTURE
This annex provides some background information on the PPIAF Charter and
governance structure. The role and composition of each element of the structure is
discussed.
7.1. PPIAF origins and the Charter
PPIAF was conceptualised as a multi-donor technical assistance facility in 1999, at the
initiative of its founding partners – DFID, the Government of Japan, and the World
Bank. It was officially launched in July 1999, during which several bilateral donors were
invited as observers and who subsequently became core PPIAF members. The Charter
of PPIAF was developed and agreed at this donors inaugural meeting, and defines its
mission and raison d’être, activities and processes, and governance and management
structures. The fundamental premise and modus operandi of PPIAF as set out in the
Charter have remained fairly durable since inception, notwithstanding some amendments
made to the Charter in July 2000 and May 2001.
The latest version of the Program Charter can be found at
http://www.ppiaf.org/documents/Program_Charter_July_99__revised_July_2000_and_
May_2001.pdf, and the salient points guiding its operations are summarised here below:
• The PPIAF Mission is ‘to help eliminate poverty and achieve sustainable development in
developing countries by facilitating private sector involvement in infrastructure’. PPIAF was
initially established for a period of three years, with subsequent extension at the
decision of the Program Council.
• PPIAF is owned and directed by the participating donors and managed by the
World Bank. The need to coordinate with the infrastructure activities of all
participating donors is emphasised as well as to build on the World Bank Group’s
Infrastructure Action Program.
• Its activities are predominantly around (a) technical assistance to developing
country governments (at national, regional or sub-national level) to promote PSP
in infrastructure, and (b) dissemination and promotion of relevant best practice.
• The scope and remit of the facility in terms of eligible infrastructure sectors,
countries, and nature of activities funded, and potential PPIAF products are
specified.
• The threshold eligibility criteria for approval of grant proposals are quite broad
and seek to ensure equitable and sustainable infrastructure development through
mobilising PSP. This is discussed in more detail below, along with the discussion
on the proposal origination and approval processes.
• The Charter suggests the determination of donor priorities through the approval
of annual work plans (both for the Core and Non-Core Funds).

59
• Details of PPIAF’s governance, organisation structure, and its two tier financial
structure of Core and Non-Core Funds are also set out.
Overall, the Charter is intended to guide PPIAF operations, and requires to be amended
(as had been done twice since incorporation), should there be any strategic or operational
changes to the current specifications.
7.2. Governance arrangements
The Program Council is the principal Board-equivalent entity that sets the strategic
direction of the facility and oversees its activities, in particular the approval of medium
and large grants. Day to day running of operations is devolved to the PMU, led by a
Program Manager. An independent Technical Advisory Panel (TAP) provides advisory
support to the Council on any specific strategic issues requested by the Council, and
assesses the impact of selected PPIAF interventions on an ex-post basis. The role,
composition, and activities of each of these entities is described below.
7.2.1. The Program Council
The Program Council is composed of the PPIAF donors (both core and non-core fund
contributors), and meets twice a year. The Charter specifies that the Program Council
will be chaired by the World Bank Vice President for Private Sector Development and
Infrastructure – although its recent Chair has been the Vice President for Sustainable
Development. The Program Council is responsible for setting PPIAF’s policies and
strategies, approving work plans, oversight and performance management.
Since 2005, subsequent to the Jordan Review recommendation of setting up a Steering
Committee, the donors have also met in December to ensure greater oversight (similar to
but not structured as a formal Steering Group meeting).
7.2.2. Technical Advisory Panel (TAP)
The Charter specifies that the TAP will comprise of up to six PPP subject matter experts
(including a Chairman) selected and appointed by the Program Council. Its mandate
includes advising the Program Council (at its request) on specific PSP issues in countries,
reviewing the PPIAF strategy/ annual work plans, and assessing impact through an ex-
post review of selected PPIAF activities.
However, over time, the TAP’s role has evolved to predominantly sample-based ex-post
project reviews. There have been some occasions when the Program Council has
requested the TAP’s advice on strategic issues such as the fit of SNTA facility, when it
was to be launched, to PPIAF’s mission.
7.2.3. PMU
The PMU, led by the Program Manager, is responsible for the administration and
running of the program, and providing Secretariat services to the Program Council and
the TAP. The Charter states that the actual delivery of PPIAF-funded activities will

60
mostly be undertaken by consultants, supervised by World Bank Group staff. The PMU
reports to the Program Council.
As per the recommendations of the Jordan review (and the Charter), the PMU now has
four regional coordination offices (LAC is still serviced from the Washington DC office)
to liaise with local stakeholders and recipients and to improve effectiveness of
interventions, including the demand-led nature of proposals. With the inclusion of SNTA
as a non-core fund in 2007, the PMU also has a dedicated SNTA Program Leader. The
PMU structure is set out in Figure A7.1 below, and in total has about twenty staff
(including administrative support) across its offices.
Figure A7.1: PMU structure
PPIAF Program Manager
SNTA Program Leader
Regional Program Leaders (5)
Program Leader for Global Knowledge Management
Southern and East Africa (Nairobi)
West and Central Africa, Middle East & Northern Africa (Dakar)
Latin America & Caribbean
(Washington DC)
Eastern Europe, Central & South Asia (Delhi)
East Asia & Pacific (Manila)
Logistics

61
8. ANNEX 8: A COMPARISON OF PPIAF AND OTHER TRUST FUNDS
As at the end of fiscal 2007, the Bank Group held a total of $21.4bn in trust,
administered through 1,015 active Trust Funds supported by 339 sovereign and non-
sovereign donor agencies. Of these, 81% (821 funds) were managed by IBRD/IDA, 18%
(185 funds) by IFC, and about 1% (nine funds) by the MIGA.
The portfolio - reflective of larger trends in the aid architecture - is composed of Bank-
Executed, Recipient-Executed, and Financial Intermediary Funds. Figure A8.1 below
illustrates these three categories of trust funds – the categories assigned are based on the
predominant nature of the Trust Fund.
Figure A8.1: World Bank Trust Funds
Trust Funds
Bank executed Recipient executed Financial intermediary
• Bank as task manager/ executor of grants
• Funds remain with the Bank, who authorise payments to consultants, where appointed
• Highest fiduciary responsibility for the Bank
• Country-based investments and delivery model
• Funds transferred to Special Accounts in country. Bank task manager to oversee work and payments on a ‘no objection’basis
• Fairly high fiduciary responsibility for the Bank
• Bank predominantly as a Treasury/ investment manager
• Funds transferred to approved implementing agencies
• Relatively lower fiduciary responsibility for the Bank
Description
• PPIAF, ESMAP, WSP • Cities Alliance • GAVI, Global Fund, CGIAR, GEFExamples
Our discussions with the Trust Funds department in the Bank suggested that there has
increasingly been a move towards ‘hybrid’ Trust Funds that allow a combination of
delivery by the Bank Group, recipients, and other development agencies/ partners.
Essentially, this is possible if the funds are set up with one trustee account into which
donors provide funds, and several ‘child disbursing accounts’ (e.g. one to allow recipient
executed and one for bank executed. For example, GEF allows for all three forms of
execution, and while CGAP is predominantly Bank executed, a portion of it operates as a
‘financial intermediary’.
Moreover, although most Trust Funds have historically been set up to be Bank executed,
there is a greater degree of emphasis now on involving beneficiary governments/ local
country partners, with an aim to improve ownership and commitment and the overall
effectiveness of the intervention. We understand from our meetings with the Trust
Funds department that there is no legal or structural issue to modify the PPIAF
execution model, should the donors/ Program Council decide to do so.
We also understand from our discussions with the PMU that PPIAF does undertake a
small percentage of its activities as recipient executed grants. However, being a World
Bank Trust Fund, the number of PPIAF grants executed by other Regional Development

62
Banks/ partners is quite minimal, primarily because of the high transaction costs
involved in their processing.
8.1. Comparison of PMU costs with other Trust Funds
Table A8.1 below summarizes the PPIAF expenditure over the last two years and
projected expenditure for FY2008 (including PPIAF core and SNTA spend).
Table A8.1: PPIAF expenditure ($ ‘000s)
Expense categories FY2006 FY2007 FY2008
PPIAF SNTA Total
Program activities (consultant fees and contractual services)
13,562 14,805 11,155 2,216 13,371
Program administration (task management, travel and staff costs)
2,031 1,943 2,045 43 2,088
PMU16 2,780 2,414 2,554 466 3,020
Other Admin expenses (incl. dissemination & outreach, TAP, annual meeting costs)17
205 384 380 45 425
Total 18,579 19,546 16,134 2,770 18,904
Program administration as % of total expenditure
10.9% 9.9% 12.7% 1.5% 11%
PMU costs as % of total expenditure
14.9% 12.4% 15.8% 16.8% 15.9%
Source: PPIAF Annual Report 2007, Program Manager’s Report, Annual Meeting, Tunis and information provided by the PMU
The Charter specified that a maximum of 30% of donor funds may be used for costs
associated with the World Bank Group staff (including PMU and program administration
expenses). As the sum of the two percentages in the table above indicates, this has been
the case over the last three years. Further, despite the expansion of PPIAF to also include
SNTA, the PMU costs have remained relatively low and around 16% of the total PPIAF
annual expenditure. This is despite the significant field presence (8 out of the 11 technical
PMU staff) and their associated costs.
Table A8.2 looks at the relative costs of other Trust Funds. No two Trust Funds are
quite comparable in terms of their cost structures on account of different Secretariat/
PMU roles, varying levels of field presence/ staff, and most importantly, different
mandates and delivery/ operating models. That said, we have attempted to broadly
identify the PMU/ program administration costs as a percentage of the Trust Fund’s
total annual expenditure. In general, the program management/ administration costs are
about 10% of total annual expenditure.
Table A8.2: Comparison of PPIAF administrative expenditure with other Trust Funds
16
This includes regional coordination office expenses of about $1.5m and $1.4m (split as $1,362,000 for PPIAF and $74,000 for SNTA) in FY2007 and 2008 respectively. 17
This includes $77,000 and $149,000 in TAP expenses in FY2006 and 2007 respectively.

63
1. GFDRR (2006)
Total annual expenditure $7.1m Annual Report 2007
Secretariat costs as % of expenditure 9.7% Includes staff, consultants, travel and associated PMU overheads
2. ESMAP (2004-06)
Total annual expenditure $9.3m Annual Report 2006
Program management costs as % of expenditure
10.0% Management costs in administering projects.
Project overheads as % of expenditure 0.9% Staff costs in developing particular projects
3. Cities Alliance (2005-07)
Total annual expenditure $14.9m Annual Report 2007
Operational overheads as % of expenditure 9.3%
Program overheads as % of expenditure 7.3%
4. GEF (2003-04)
Total annual expenditure $153.4m Annual Report 2007
Program administration costs as % of expenditure
10.9% Reimbursement to Implementing Agencies for their functions, and expenses of Trust Fund and Secretariat.
5. CGIAR (2005-07)
Total annual expenditure $472m Financing Report 2007
System overheads as % of expenditure 1.9% Office and system overheads. Administrative budgets of the 16 programs are tied into their funding.
8.2. More details on other World Bank Trust Funds
This section seeks to provide further details on some of the comparable trust funds. We
recognise that none of them match PPIAF exactly, but nevertheless may provide some
interesting insights as regards their strategy, focus and operations. For example, Cities
Alliance, whose Charter was modelled after PPIAF, subsequently has changed elements
of it with an aim to improve effectiveness. It has developing country participation in its
membership (beneficiary governments have a lower annual contribution of $50,000, than
the donors who have a minimum contribution of $250,000. Also, projects between
$75,000 and $250,000 are not referred back to the Consultative Group (CG) for
approval, but can be approved by the Programme Manager supported by an independent
technical assessment. Projects over $250,000, however, require CG approval on a no-
objection basis.

64
Table A8.3: Cities Alliance (CA)
Cities Alliance (CA)
Size $88 million in commitments to date; $15m average annual spend (2005-07)
Start year May 1999
Founding partners World Bank and UN Centre for Human Settlements (Habitat)
Current members • Slum Dwellers International (SDI)
• Local authorities, represented by United Cities and Local Governments and Metropolis;
• Australia, Brazil, Canada, Chile, Ethiopia, France, Germany, Italy, Japan, Netherlands, Nigeria, Norway, Philippines, South Africa, Spain, Sweden, United Kingdom and United States of America;
• Asian Development Bank, European Union, UNEP, UN-HABITAT and the World Bank.
Main objectives • improving livelihoods of the urban poor
• formulating a broad consensus on vision and priority actions for city development
Financing Donor financing can be for the Core Fund (CF) and / or the Non Core Fund (NCF). CF can be used for any activity falling within the work program approved by the CG, and are subject to no restrictions. Min donor contribution to the CF is $250,000 p.a. and min. govt contribution is $50,000 (or local currency equivalent) p.a. The NCF has donor restrictions relating to themes, activities or regions. Contributors to the NCF have to make at least the min contribution to the CF.
Portfolio Eligible countries include countries in the DAC list and column 1 of Countries and Territories in Transition
Key activities • country specific activities (typically originated from local authorities and must be approved by the government of the recipient country and sponsored by at least one member of CA, as well as have established channels to meet investment requirements)
• regional and global activities designed to raise awareness and disseminate good practices (can be proposed by CA Secretariat or any of the CA partners)
Governance Governance structure comprises:
• A Consultative Group (CG), for overall strategy and guidance, comprising financial contributors to CA and the political heads of international associations of cities and local authorities. The CG is co-chaired by the World Bank VP for PSD and infrastructure and the executive head of Habitat.
• A Policy Advisory Board (PAB), for expert advice on city development strategies and scaling0up slum upgrading as well as ex-post evaluation of specific activities, comprising preeminent urban experts and representatives of NGOs, CBOs, private

65
Cities Alliance (CA)
sector, etc
• A Secretariat, for management of day-to-day operations.
Institutional location/ hosting
The Secretariat is housed in the World Bank, Washington DC.
Delivery model No separate implementation capacity – implementation managed through regional units of the World Bank, Habitat and other multilateral and bilateral partners, as well as through existing global and regional partnership programs
Proposal approval process
• Proposals <$75,000 are evaluated (sometimes through external experts) and approved by the Secretariat
• Proposals >$75,000 have an independent technical assessment by specialists. Medium size proposals which are < $250,000 do not require further reference to the CG, but proposals that are > $250,000 require a ‘no objection’ from the CG.
• Proposals may originate from any member of the Alliance.
Co-financing Co-financing requirement of at least 20% of the total project budget from the cities themselves and other sources. For proposals >$250,000, the min target for co-financing is 25%, with a target of up to 50% for the maximum proposal size of $500,000.

66
Table A8.4: GPOBA
GPOBA
Size GPOBA has funded $11.5m for TA and dissemination activities and $144.7m for estimated identified subsidies – total of 67 projects
Start year January 2003
Founding partners DFID and World Bank
Current members Founding partners plus IFC, DGIS, AusAID and Sida
Main objectives GPOBA’s purpose is to fund, demonstrate and document OBA approaches to facilitate increased access to infrastructure and social services by the poor in developing countries.
Financing • Min donor contribution is $250,000 p.a. and the World Bank may meet the required minimum through a combination of administrative budget and in-kind contributions.
• One of GPOBA’s non core funds is a challenge fund which is open to general applications from other IFIs, bilateral donors, NGOs, public and private infrastructure providers, governments and the World Bank. Projects with World Bank involvement are allowed only a max of 15% of the total funds awarded under the challenge fund.
Portfolio • Eligible countries include DAC I and II, IDA countries and / or IFC frontier countries and regions.
• For DFID contributions, 60% allocation to columns 1 and 2 of DAC I list and 40% to columns 3 and 4 of the list.
Key activities • TA (Window 1)
• Dissemination (Window 2)
• OBA subsidy funding (Window 3)
Governance GPOBA comprises:
• A Program Council made up of donor representatives (chaired by the World Bank); and
• A Programme Management Unit (PMU).
Institutional location/ hosting
The PMU is from the Infrastructure Economics and Finance Department of the World Bank, who also select the Programme Manager (PM).
Delivery model • The PM may use a proportion of GPOBA resources to contract services of the World Bank Group staff to assist in identifying, supervising and delivering activities, provided that no more than 30% of GPOBA resources are applied to those costs.

67
GPOBA
• Window 1 and 2 activities are typically executed by the World Bank and procurement of consultants is generally initiated by the World Bank task manager in consultation with the PM.
• Procurement is implemented according to World Bank guidelines, when the World Bank is involved, otherwise according to the rules of other international institutions such as IFC and MIGA, determined on a case by case basis.
Proposal approval process
• For window 1 and 2, proposal below $75K are decided upon by the PM; > $75K proposals require a no objection from the donors. The same value limit is applied for Window 3 proposals, with the particular approval process being donor specific.
• For window 3 proposals, a Panel of Experts is tasked with evaluating projects recommended by the GPOBA PM. Grants are awarded by the PM accordingly, and an authorised representative of the World Bank, as administrator of GPOBA will enter into a Grant Agreement with the Recipient.
• Proposals may originate from any source.
Co-financing • GPOBA resources may cover up to 100% of the project costs, although co-financing is encouraged.

68
Table A8.5: CGIAR
CGIAR
Size In 2007, funding to the CGIAR amounted to over US$500m. $472m average annual spend (2005-07)
Start year 1971
Founding partners Initial co-financiers are FAO, World Bank, IFAD and the UNDP
Current members • Initial co-financiers plus AfDB, Canada, Denmark, Ford Foundation, France, Germany, IADB, Netherlands, Norway, RF, Sweden, UK and USA.
• The CGIAR system as a whole is an informal association of 64 public and private sector CGIAR members
Main objectives Sustainable development of agriculture, natural resource management, fisheries and forestry in developing countries.
Financing • CGIAR centres of research are primarily financed by annual support from CGIAR members for which they submit grant proposals.
• Members of the CGIAR provide resources to the Centres in accordance with their own internal procedures (approval of allocations, annual budget timetable, etc.) and often in consultation with the Centres and the CGIAR Secretariat.
• The transfer of resources may occur in one or more of the following ways: (a) CGIAR Members transfer funds directly to each of the beneficiary Centres; or (b) CGIAR Members transfer all or part of their contributions using mechanisms established in the World Bank and administered by the CGIAR Secretariat, including the CGIAR Multi-Donor Trust Fund. The funds are disbursed on the instructions of the Members concerned; or (c) CGIAR Members transfer funds to the Centres of their choice, through a third party, such as an international institution other than the World Bank.
Portfolio Agriculture; world wide
Key activities The CGIAR system collaborates in research and research related activities with many partners to support and carry out agricultural research.
Governance The CGIAR governance structure comprises of:
• The Consultative Group, which is the primary decision making body, is responsible for setting the broad policy, approve research programs and funding, monitor implementation of research activities, endorse key appointments within the system and establishes ad-hoc committees or task forces on specific issues.
• The chair of the CGIAR is nominated by the president of the World Bank and endorsed by the CGIAR members. From 1974, the chair has been the World Bank Vice President overseeing its sectoral work in agriculture. The chair leads CGIAR, facilitates the interplay among the systems actors, provides internal policy guidance and serves as the chair of

69
CGIAR
the ExCo.
• The director functions as the CEO of the CGIAR. He heads the secretariat and monitors the implementation of decisions reached by CGIAR or the ExCo. The chair selects the CGIAR director who is appointed as a senior staff member of the World Bank.
• The Executive Council (ExCo) is a subsidiary body of CGIAR and acts on matters delegated to it by the Group between AGMs. The ExCo facilitates decision-making by reviewing major policy issues and submitting recommendations to the CGIAR, provides oversight during the implementation of the Group's decisions and assigns tasks and responsibilities to the secretariat, as well as ad hoc committees or task forces within a stated time frame.
• The Science Council advises CGIAR on programme priorities, and CGIAR members may take these priorities into account when deciding the allocation of resources.
• The CGIAR Secretariat, a system office unit, is the principal central service unit of the CGIAR system.
• The CGIAR system is serviced by a system office, a virtual structure that was created to improve coordination and cohesion among the various central service units that support the research centres, members and other stakeholders.
• 15 international full-time agricultural research centres are the functional and operational scientific core of the CGIAR system. Collectively, they are responsible for planning, developing and implementing a research agenda that is approved and funded by the CGIAR.
Institutional location/ hosting
The World Bank provides CGIAR with its Chair, Director and Secretariat, as well as serves as the anchor of its finances.
Delivery model The CGIAR is an association of many national and international agricultural research centres that carry out the research activities.
Proposal approval process
• Decision on its research policy and agenda are made in conjunction with its many partners all over the world.
• The CGIAR does not receive proposals per se, but makes general decisions on its research agenda, governance, etc on a consensus basis either at its AGM or by email. The ExCo provides recommendations to the Group, which may or may not be accepted by the Group. The Group may delegate certain matters to the ExCo. Some decisions are reached through a ‘no objections’ basis within 2-4 weeks.
Co-financing N/A

70
Table A8.6: GFDRR
GFDRR
Size • As of June 30, 2007, the GFDRR had received a total of almost US$9.4 million from Australia, Switzerland, the United Kingdom, and the World Bank
• Eight donors—Australia, Switzerland, the United Kingdom, the World Bank, Denmark, Japan, Spain, and Sweden—have pledged US$55,219 million (including the US$9.4 million already received), which would cover the period until June 2010
• $7m average annual spend (2006)
Start year Sept 2006
Founding partners UN ISRD and World Bank
Current members Australia, Canada, Denmark, Italy, Japan, Luxembourg, Norway, Spain, Sweden, Switzerland, UK, World Bank
Main objectives GFDRR’s strategic goal is to effectively integrate disaster risk considerations into sustainable development policies, planning, programming and financing at all levels of government.
Financing • Track 1 is financed through the World Bank DGF; Track 2 and 3 through donor contributions to various trust funds administered by the World Bank
Portfolio Low (eligible for World Bank IDA financing) and middle (IBRD and IDA financing from the World Bank) income countries
Key activities GFDRR’s work is divided into 3 tracks:
• Standardisation and harmonisation of disaster reduction tools and methodologies;
• Mainstreaming disaster reduction in development; and
• Standby Recovery Financing Facility to support low-income countries for accelerated disaster recovery.
Governance The governance and organisational structure of the GFDRR includes:
• a consultative group for defining long term policies and strategies, adopting multi-year results framework, confirming donor pledges, etc (chaired by the VP for Sustainable Development, World Bank; includes donors contributing >$3,000,000 over 3 consecutive years in track 2 core funds or track 3 funds, recipient governments contributing $500,000 over 3 consecutive years and chair of the ISDR system and the results management council);
• a results management group to ensure quality, relevance and impact of the GFDRR’s activities (members include a Director of the World bank nominated by the VP of the Sustainable Development Network, Director of the ISDR

71
GFDRR
Secretariat, Program Manager of the GFDRR Secretariat, 5 representatives of inter-governmental organisations, NGOs, CBOs, etc and 5 prominent experts from relevant fields); and
• a GFDRR Secretariat responsible for the management of day-to-day operations; professional staff of the GFDRR Secretariat is recruited internationally based on relevant expertise following World Bank recruitment rules, having clear accountability to the World Bank.
Institutional location/ hosting
The GFDRR Secretariat is housed in the World Bank, DC.
Delivery model N/A
Proposal approval process
• Proposals for track 1 can originate from any source, but must be routed through the ISDR Secretariat
• Proposals for track 2 typically originate from national authorities or ISDR system members, and in all cases must be routed through the GFDRR Secretariat for vetting and approval.
Co-financing • All proposals need to include a co-financing element with a target of at least 10% financing from the proponent or the relevant country government, as well as from other sources. Co-financing can be in the form of in-kind assistance.

72
Table A8.7: WSP
WSP
Size At the close of 2005, US$18.5m had been disbursed. $27m – revised annual budget 2006, $34m – initial budget 2007.
Start year 1979
Founding partners World Bank and UNDP
Current members Founding members and ADB, Australia, Belgium, Canada, Denmark, Netherlands, Finland, France, Germany, Japan, Italy, Sweden, Switzerland, UNDP, ODA
Main objectives To help the poor gain sustained access to improved water supply and sanitation services (WSS)
Financing Funds that support the WSP may come from official donors, international financial institutions and other official agencies, including developing country governments. New sources of funding may be explored, such as private foundations and the private sector.
Portfolio Technical assistance on water and sanitation projects across regions
Key activities Policy support; strategic investment support; knowledge management, generation and synthesis; sector networking; pilot projects
Governance • WSP governance structure comprises:
• WSP Council comprising contributing donors, one member from an affected country, one member from a strategic partner such as a leading NGO or global sector organization, one sector expert, and representatives of UNDP and the World Bank.
• National and Regional Advisory Bodies - To ensure local participation and foster local ownership, the WSP establishes National Advisory Committees or enlists the assistance of existing bodies to function in an advisory capacity in countries in which it has a substantial work program. These bodies include representatives from key country-level partners.
• The World Bank manages the WSP and is accountable to the WSPC for the proper management of the program. WSP staff are World Bank staff members, recruited and managed according to World Bank policies. The WSP may accept staff members on secondment from other organizations and through junior professional and similar programs.
Institutional location/ hosting
• WSP is an independent unit within the Department of Energy, Water and Transport in the newly created Sustainable Development Network Vice Presidency of the World Bank.
Delivery model • WSP works through the World Bank, DC where its head-quarters are located as well as 4 regional offices

73
WSP
Proposal approval process
N/A
Co-financing N/A

74
Table A8.8: ESMAP
ESMAP
Size $9m average annual spend (2004-06)
Start year 1983
Founding partners World Bank and UNDP
Current members Founding donors plus Australia, Austria, Denmark, France, Germany, Iceland, Finland, Norway, Sweden, Netherlands. UK
Main objectives ESMAP helps build consensus and provides policy advice on sustainable energy development to governments of developing countries and economies in transition. ESMAP also contributes to the transfer of technology and knowledge in energy sector management and the delivery of modern energy services to the poor.
Financing N/A
Portfolio N/A
Key activities ESMAP is a TA program and also develops knowledge products. Key themes and focus areas include energy poverty, energy security, energy efficiency, market efficiency and governance, renewable energy and SMEs.
Governance ESMAP’s governance structure comprises:
• A consultative Group (CG) composed of representatives of donors and experts from the regions receiving ESMAP assistance. The CG is chaired by a Vice President of the World Bank and meets at least once a year.
• A Technical Advisory Group (TAG) of three international independent energy and development experts reviews the ESMAP strategic agenda, its work plan and its achievements, and submits an annual report providing guidance to the CG and to ESMAP Management.
• The ESMAP Manager, a senior official from the World Bank and a member of the Energy and Mining Sector Board, are responsible for administering the program, approving its activities, and overseeing their implementation. The Manager is supported by a small staff responsible for donor relations, quality assurance, portfolio and financial management, financial management and information dissemination.
The Energy and Mining Sector Board of the World Bank which includes the regional energy sector managers and ESMAP’s manager ensure that ESMAP’s strategy is consistent with the Bank’s approach and priorities in the energy sector.
Institutional location/ hosting
ESMAP administration is housed at the World Bank.
Delivery model To conduct individual activities, ESMAP relies on a cadre of World Bank Group engineers, energy planners, economists
75
ESMAP
and other development specialists, and on consultants.
Proposal approval process
N/A
Co-financing N/A

76
Table A8.9: GEF
GEF
Size Since 1991, GEF has provided $7.6 billion in grants and leveraging $30.6 billion in co-financing for over 2,000 projects in over 165 countries. In 2006, 32 donor countries pledged $3.13 billion to fund operations between 2006 and 2010.
$153m average annual spend (2003-04)
Start year 1991
Founding partners N/A
Current members Australia, Austria, Belgium, Canada, China, Czech Republic, Denmark, Finland, France, Germany, Greece, India, Ireland, Italy, Japan, Korea, Luxembourg, Mexico, Netherlands, New Zealand, Nigeria, Norway, Pakistan, Portugal, Slovenia, South Africa, Spain, Sweden, Switzerland, Turkey, the United Kingdom, and the United States
Main objectives GEF main objectives are to address global environmental issues while supporting national sustainable development initiatives.
Financing N/A
Portfolio GEF covers all member states of the UN.
Key activities GEF provides grants for projects related to the following six focal areas: biodiversity, climate change, international waters, land degradation, the ozone layer, and persistent organic pollutants
Governance • The GEF Council is the main governing body of the GEF. It comprises 32 members who are representatives of GEF member countries.
• The GEF Assembly is comprised of all the countries that are members of the GEF. It meets once every four years to review the policies and operations of the GEF. Only the Assembly can make amendments to the GEF Instrument—the document that established the GEF.
• The GEF Secretariat serves and reports to the Assembly and Council. The GEF CEO and Chairperson heads the Secretariat, which coordinates the implementation of GEF projects and programs, as well as the formulation of policies and operational strategies.
• The Scientific and Technical Advisory Panel (STAP) provides objective scientific and technical advice to the GEF.
• The independent Evaluation Office conducts reviews of GEF´s work and publishes lessons learned so that the GEF´s effectiveness can be enhanced.
Institutional The Secretariat is supported administratively by the World Bank, but operates in a functionally independent and effective

77
GEF
location/ hosting manner.
Delivery model GEF Agencies including UNDP, UNEP, WB, AFDB, ADB, EBRD, IDB, IFAD, FAO and UNIDO are responsible for creating project proposals and for managing GEF projects.
Proposal approval process
• Any eligible individual or group may propose a project, which must meet two key criteria: It must reflect national or regional priorities and have the support of the country or countries involved, and it must improve the global environment or advance the prospect of reducing risks to it. GEF project ideas may be proposed directly to UNDP, UNEP, or the World Bank.
• GEF projects shall be subject to endorsement by the CEO before final project approval. If at least four Council Members request that a project be reviewed at a Council meeting because in their view the project is not consistent with the Instrument or GEF policies and procedures, the CEO shall submit the project document to the next Council meeting, and shall only endorse the project for final approval by the Implementing Agency if the Council finds that the project is consistent with the Instrument and GEF policies and procedures.
• Approval process for different types of projects:
o The GEF council approves all full-size projects (>$1m).
o Medium size projects (up to $1m) are approved by the CEO. Prior to the CEO approval, MSPs are circulated to Council for their information.
o Most enabling activities are processed under expedited procedures and approved by the CEO on a rolling basis throughout the year. Enabling activities that go beyond the ceiling are considered non-expedited, and follow the procedures for processing full-sized projects.
Co-financing N/A

78
9. ANNEX 9: PROPOSAL REVIEW PROCESS AND TRENDS IN PROPOSAL
APPROVAL
This section outlines the current PPIAF processes, starting from the origination of
proposals to task management of approved interventions, and subsequent monitoring of
implemented activities.
9.1. Proposal origination and review process
Figure A9.1 below is a schematic of the proposal origination and review process.
Figure A9.1: Proposal review process
Proposed origination / submission to PF regional office
1st Technical Assessment by PF regional office (completeness/
relevance check etc)
If proposal is incomplete or
requires modification
PMU Program Manager review
PMU Program Manager decision2nd Technical Assessment by WB
Group staff1
Circulated to Program Council members for ‘no objection’2
PMU Program Manager decision
� PF Regional office
� Beneficiary governments
� World Bank Task Manager
1. Typically WB Task Manager from another region and occasionally an expert from WB Trust Fund like WSP, Cities Alliance
2. ‘No Objection’ sought from Program Council (for Core Fund financing) and relevant donor (for Non-core Fund financing)
< $75k> $75k
Some of the key observations regarding the proposal generation and review process are:
• One of the unique propositions of PPIAF – seen by many – is that it is ‘demand-
led’, i.e. responsive to the needs of the customers – the developing country
governments (albeit often as relayed to PPIAF via requests from potential TTLs).
PPIAF field presence was restructured and expanded subsequent to the Jordan
review. We understand from the PMU that the extent of PPIAF/ client driven
activities have increased where PPIAF has local offices. For example, in Kenya,
50% of projects (7 of the 14 projects) over the last nine years were primarily
PPIAF/client driven. These account for 29% of the total funding approved in
Kenya since 1999. Also, in India, 38% of projects (8 of 21 projects) over the last
three years were primarily PPIAF/client driven. These account for 29% of the
total funding approved in India since 2005. We would seek to verify further in

79
the next phase of the assignment the extent to which local presence has
improved the identification of opportunities for PPIAF assistance, and the
tailoring of grants to local needs and context.
• The Program Manager has delegated authority from the Program Council to
approve proposals that are less than $75,000.
• For all proposals greater than $75,000, we understand that the practice has been
to seek Program Council approval on a ‘no-objection’ basis. This effectively
implies that each Program Council member has a veto right on proposals greater
than $75,000 (unless their objections are addressed adequately). However, Section
E (Approval) of Annex III of the Charter states that “for small and medium proposals
($250,000 or less), the Program Manager is authorised to approve the proposal without further
reference to the Program Council. For large proposals (over $250,000), the PMU is required
to seek the endorsement of the Program Council on a ‘no objection’ basis.”18
• For all proposals greater than $250,000, it is mandatory to seek review by an
independent technical assessor. This is typically a World Bank task manager from
another region but who is familiar with the issues/ sector at hand.
• The criteria for evaluation of proposals are set out in the Charter and include a
range of factors - consistency with PPIAF mission, government commitment,
donor coordination, additionality in flow of resources, co-financing, value for
money, quality assurance, regional and sectoral balance, environmental and social
responsibility, eligibility of expenditure. The PPIAF website also sets out the
grant eligibility criteria, approval process and criteria, and application forms that
can be downloaded.
9.2. Trends in PPIAF proposal approval
This section presents some highlights on PPIAF’s total applications since inception and
those that were approved.19 Overall, PPIAF received 1,058 applications since inception
and approved 65% of these and rejected 17% (please note that the rejection percentage
was much higher before 2004). The remainder 18% are applications that have been
withdrawn by the potential client before being reviewed in detail by PPIAF.
By value, PPIAF has funded about US$146m of interventions and has rejected
applications with a total value of US$110m. Some of these rejected applications fall out
of PPIAF main mandate (i.e. housing sector, farming, poverty alleviation in general, and
business development). Others, we presume, did not meet the required PPIAF approval
criteria. In general, the PMU seeks to manage applications to maintain relationships and
avoid in-country and PPIAF resources being wasted on applications that have a
18
Please note that there appears to be a discrepancy in the Charter as the summary table on page 4 of the same Annex suggests that medium sized proposals (between $75,000 and $250,000) also require a ‘no objection’ endorsement by the Program Council. 19 Please note that we have not yet obtained the precise year of submission for the non-approved interventions.

80
significant failure probability. As discussed below, there is sufficient effective demand to
do this.
Tables A9.1 and A9.2 provide a breakdown of PPIAF applications before and after June
2004, split by region.
Table A9.1: PPIAF applications pre-June 2004
Rejected Withdrawn Approved Total/ % of Grand total
EAP 17 (18%) 24 (26%) 53 (56%) 94 (16%)
ECA 20 (31%) 0 44 (69%) 64 (11%)
Global 9 (15%) 9 (15%) 42 (70%) 60 (10%)
LAC 13 (17%) 27 (35%) 37 (48%) 77 (13%)
MENA 8 (26%) 5 (16%) 18 (58%) 31 (5%)
SAR 10 (15%) 11 (16%) 47 (69%) 68 (11%)
SSA 59 (30%) 22 (11%) 118 (59%) 199 (34%)
Grand Total 136 (23%) 98 (17%) 359 (60%) 593 (100%)
Table A9.2 PPIAF applications post-June 2004
Rejected Withdrawn Approved Total/ % of Grand total
EAP 5 (6%) 14 (17%) 63 (77%) 82 (18%)
ECA 4 (6%) 25 (36%) 40 (58%) 69 (15%)
Global 0 8 (18%) 36 (82%) 44 (9%)
LAC 4 (7%) 10 (17%) 45 (76%) 59 (13%)
MENA 0 4 (21%) 15 (79%) 19 (4%)
SAR 14 (10%) 13 (17%) 39 (73%) 66 (14%)
SSA 12 (8%) 22 (21%) 92 (71%) 126 (27%)
Grand Total 39(8%) 96 (21%) 330 (71%) 465 (100%)
The key points to note are:
• A higher percentage of applications were rejected prior to June 2004 (23% of
total applications compared to 8% post June 2004). This is broadly consistent
with what we heard in our consultations with the PMU. Essentially, since 2004,
the emphasis has been on working more closely with the beneficiary
government/ proposal originator to ensure that to the extent possible, any
proposal submitted and taken forward meets the basic criteria of PPIAF.
Otherwise, the person is encouraged to modify/ re-consider the proposal before
submission, or withdraw the application. Across regions, 21% of applications
were withdrawn post June 2004, compared to 17% in the earlier period.
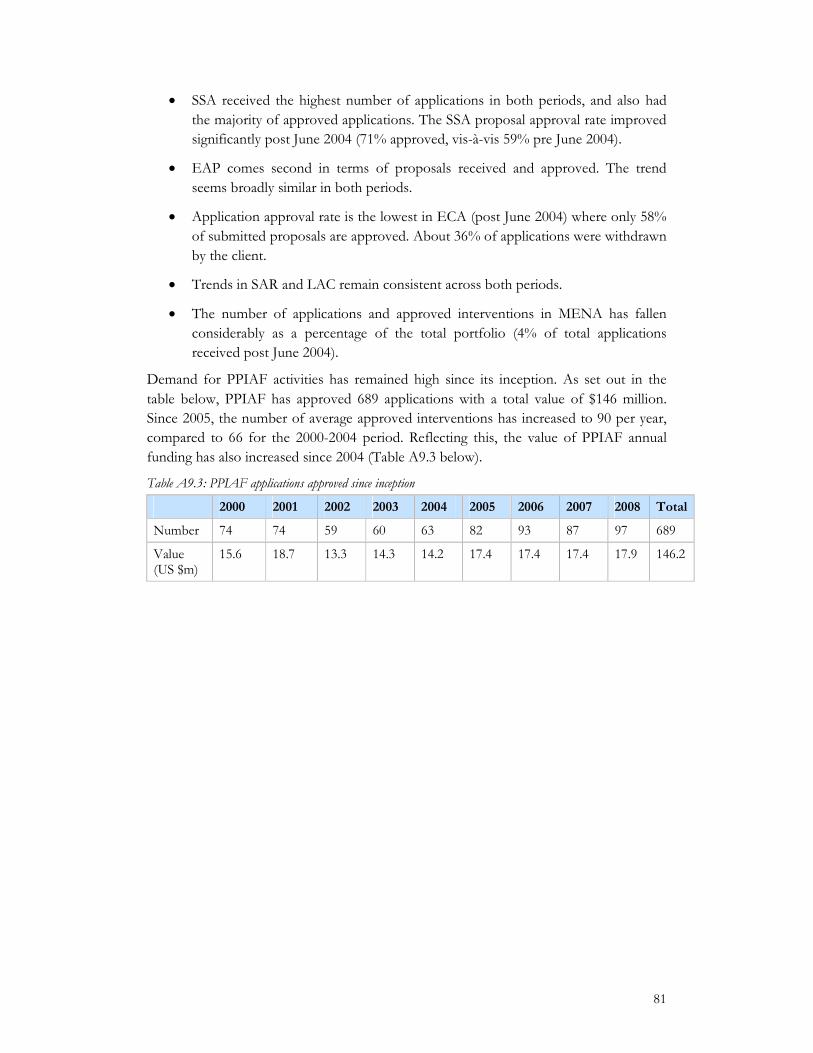
81
• SSA received the highest number of applications in both periods, and also had
the majority of approved applications. The SSA proposal approval rate improved
significantly post June 2004 (71% approved, vis-à-vis 59% pre June 2004).
• EAP comes second in terms of proposals received and approved. The trend
seems broadly similar in both periods.
• Application approval rate is the lowest in ECA (post June 2004) where only 58%
of submitted proposals are approved. About 36% of applications were withdrawn
by the client.
• Trends in SAR and LAC remain consistent across both periods.
• The number of applications and approved interventions in MENA has fallen
considerably as a percentage of the total portfolio (4% of total applications
received post June 2004).
Demand for PPIAF activities has remained high since its inception. As set out in the
table below, PPIAF has approved 689 applications with a total value of $146 million.
Since 2005, the number of average approved interventions has increased to 90 per year,
compared to 66 for the 2000-2004 period. Reflecting this, the value of PPIAF annual
funding has also increased since 2004 (Table A9.3 below).
Table A9.3: PPIAF applications approved since inception
2000 2001 2002 2003 2004 2005 2006 2007 2008 Total
Number 74 74 59 60 63 82 93 87 97 689
Value (US $m)
15.6 18.7 13.3 14.3 14.2 17.4 17.4 17.4 17.9 146.2

82
10. ANNEX 10: OUTCOMES AND IMPACTS OF A SAMPLE OF PPIAF ACTIVITIES
This Annex draws on the information provided to us by the PPIAF PMU on outcomes reached on selected PPIAF funded projects across its
regions and categorises them by the revised activity segmentation. It then seeks to separate outcomes and impacts as per their definition in the
main report.
Table A10.1: Summary impacts and outcomes table
Project Description CEPA category
CEPA sub category
Main outcome Likely / actual impact
African Infrastructure Development Company (DevCo)
Study to assess the viability of an infrastructure development advisory company
Enabling environment
Institution building/ development
Establishment of DevCo, currently supporting 16 advisory mandates and closed 9 projects
• 9 closed projects have generated $621m in investment; expected to generate $1.88b once completed.
• Development of additional projects could generate additional private investments totalling $2.96b and improve infrastructure services to about 4m people.
Emerging Africa Infrastructure Fund (EAIF)
Study to assess the feasibility of the establishment of a long term debt fond for SSA
Enabling environment
Institution building/ development
Establishment of new financing entity with up to US$365 in finance
• 12 infrastructure project financed in SSA, with EAIF investment of over $331m. 11 of these projects have generated $5.4b in private investment.
• Approximately 1.1.m people are being served with phone connections in 12 SSA countries and electricity coverage in Tanzania has been expanded to an additional 65,000 households.
Kenya: Restructuring and
Development of strategy for
Enabling PPI policy/ 30% sale of KenGen shares and procurement of a management
• 120,000 plus new connections

83
Project Description CEPA category
CEPA sub category
Main outcome Likely / actual impact
Privatisation of the Power Sector
restructuring and privatisation of the power sector and consensus building
environment strategy company • Reduction in system’s losses from 19.6% to 17.6%
Kenya: Financing Small Water Supply Projects through Microfinance
Design of pilot program to facilitate market based lending to small water projects on a project finance basis
Enabling environment
PPI policy/ strategy
Offer of new product lines by domestic financial institutions in the water sector along with co-financing from GPOBA
• Microfinance being provided to 21 community systems which will serve 60,000 people.
Madagascar: PSP in the Port of Tolagnaro
Study to examine PPP alternatives to improve and extend the port
Enabling environment
PPI policy/ strategy
Port under construction • One-third of the port is expected to be utilised for minerals and the balance for other shipping needs.
• Other investments are also being made in roads and electricity.
Mozambique: Design of a framework for PPPs in Municipal Services
Setting up a PPP unit for municipal services
Enabling environment
PPI policy/ strategy
Creation of a PPP unit in the City of Maputo
• 12 PPPs have been concluded, generating US$7.7m in investments
• 11 projects in negotiation with an estimated value of US$52.3m
Nigeria: PSP options for the port sector
Preparation of guidelines for privatising the port sector and granting a pilot concession
Enabling environment
PPI process 26 long term concessions have been completed for various Nigerian port facilities
• The largest concession contract was valued at $1.06b, of which about $300m was expected to be in support of capital investments.
Nigeria Infrastructure Advisory Facility
Support for consultations among key stakeholders
Enabling environment
Institution building/
NIAF team working on several policy interventions and
•

84
Project Description CEPA category
CEPA sub category
Main outcome Likely / actual impact
(NIAF) regarding policy and advisory support in preparation for PPPs in Nigeria
development potential PSP transactions
Kenya-Uganda: Institutional Framework for the Privatisation of the Railway corporation
Assessment of regulatory options for transport in general and the rail concession in particular
Enabling environment
Legal/regulatory/competition framework
Joint concession by Kenya and Uganda was awarded.
• Transaction included a $64m in debt, $24m in equity and internal cash generation of $33m; total capex during life of the project is estimated at $450m.
Africa Business Roundtable
Development of a facility providing capacity building and other services to African businesses and public authorities for project preparation
Enabling environment
Institution building/ development
Establishment of the NEPAD IPPF
• 22 projects have been approved for a total disbursement of $13.8m.
Africa: Establishment of a Central African Broadband (CAB) Network
Study on the feasibility of establishing the CAB
Project cycle related assistance
Project preparation
Endorsement of the project by CEMAC
•
Burkina Faso: Assessment of the regulatory regime for PSP in infrastructure sectors
Assessment of PSP framework in infrastructure
Enabling environment
Institution building/ development
PSP developments in the country – govt preparing an affermage for the SOE utility, new electricity law for establishment of a regulator, divestment in mobile sector
•
Guinea: PSP in urban transport
Preparation of public transport plan
Dissemination/ awareness
PPI promotion/ awareness
Govt actively implementing measures to improve transport including intermodal transport
•

85
Project Description CEPA category
CEPA sub category
Main outcome Likely / actual impact
building building development, concession award for mass transit, etc
ECOWAS: West Africa Power Pool (WAPP)
Preparation of a business plan for WAPP
Enabling environment
Institution building/ development
Establishment of the WAPP; a number of cross-border transmission and generation transactions are currently being launched.
•
Algeria: Building consensus for energy reform
Building consensus on energy sector reform, and design of PSP strategy
Dissemination/ awareness building
PPI promotion/ awareness building
New sector law adopted in 2002 on PSP, leading to the creation of a regulatory agency.
• Reforms have led to considerable private investment in the country
Algeria: Telecom sector reform; telecom sector investors conference
Drafting sector policy statement and organising investors conference
Dissemination/ awareness building
PPI promotion/ awareness building
New telecoms law passed and a GSM mobile license awarded.
• The market now has over $10m subscribers and has received over $4b in investments.
Egypt: PPP models in irrigation; development of regulatory and institutional arrangements for PSP
Examination of options for PSP in irrigation; conceptualise transactions model and development of required institutional and regulatory arrangements
Enabling environment
PPI policy/ strategy, Legal/regulatory/competition framework
Transaction currently being tendered
•
Morocco: Introducing competition in baggage handling in major airports
Feasibility study on introducing competition in baggage handling
Enabling environment
PPI policy/ strategy
10 year contract awarded to a new operator
• Contract value of €3.5m
• Expected to generate 120 jobs

86
Project Description CEPA category
CEPA sub category
Main outcome Likely / actual impact
Mongolia: Framework for universal access in telecoms
Design of PPP program to improve access to rural telecoms and two pilots
Enabling environment
PPI policy/ strategy
Rural access program adopted including the setting up of a universal access fund and the pilots were implemented
•
Philippines: Small Power Utilities Group (SPUG)
Preparation and execution of power supply agreements for PSP in power generation, supported public consultation, drafted model PSAa and subsidy agreements
Enabling environment
PPI policy/ strategy, PPI process
Successful tendering of PSAs in the pilot areas as well as further tendering in other SPUG areas
• Lower electricity costs for consumers
• Increased investment of $28m
• Govt saving is subsidy of $6m p.a.
• 10,000 new connections over the next 5-10 years
Vietnam: Pilot PSP in water sector
Preparation of transaction documents for pilot water service project and support to the Provincial Water Companies on the bidding and evaluation process
Project cycle related assistance
Transaction support
DBL contracts were successfully awarded and construction was completed, with projects being now operational.
• 90% of households in the towns agreed to be connected to the new water system
Vietnam: PBCs with the private sector to reduce non revenue water (NRW)
Review of international practises; support to Ho chi Minh City in developing PBCs for NRW; developing materials for dissemination
Enabling environment
PPI process Paper published in NRW PBC; 5 year PBC contract awarded
• Establishment of around 100 district monitoring areas to manage leakage and system expansion works
Philippines: Support to the Govt Project cycle Transaction Transco concession successfully • Under the concession, the

87
Project Description CEPA category
CEPA sub category
Main outcome Likely / actual impact
Support to the Govt on the assessment of the privatisation of Transco
in obtaining a third party independent assessment of the Transco concession agreement
related assistance
support awarded for $3.95b private proponent is required to implement the remaining infrastructure projects of Transco
Laos: Nam Theun II Power Project
Legal advisor for the project
Project cycle related assistance
Transaction support
Finalisation of the concession agreement, with the power project now being under construction
• The project attracted large amounts of funding through PPIAF support.
Vietnam: Assisting contract negotiations for the Phu My 2-2 BOT power project
TA to the Govt on finalising the BOT contract and the PPA for the project
Project cycle related assistance
Transaction support
Award of concession contract for the project.
•
Afghanistan: Strengthening telecoms regulation
Support to the Govt in creating a regulatory framework and setting up a regulatory unit
Enabling environment
Institution building/ development
Telecoms Regulatory Board set up and Telecoms Law approved; 4 GSM licenses have been awarded to private operators
• Following the licenses, market competition has led to tariff reduction of more than 70%.
• More than $300m in private investment has been attracted.
• Teledensity has increased to 35 telephones per 1,000 people in 3 years
Afghanistan: Urban water and sanitation
PSP strategy and development of legal and institutional reforms; hiring of legal and financial advisers to set up a corporatized urban
Enabling environment
PPI policy/ strategy, Institution building/ development
Development of an institutional development plan; setting up of the Afghanistan Urban WSS Company as a corporate entity
•

88
Project Description CEPA category
CEPA sub category
Main outcome Likely / actual impact
WSS company
Bhutan: Strengthening policy, regulatory and institutional environment for PSP in the telecoms sector
Assisted Govt in preparing a National information Infrastructure Policy, regulatory advice
Enabling environment
PPI policy/ strategy
Approval of the new policy, issuing of licenses to the private internet providers, issuing of cellular license to Bhutan telecom (public company) and subsequently to a private mobile operator
• Progressive rebalancing of tariffs has been achieved
• International long distance charges have been reduced
• Teledensity in Bhutan has increased from 2.5 in 2001 to 5.7% for fixed lines and 17.1% for mobiles in 2007.
India: Tariff approaches for electricity reform in Uttar Pradesh
Guidance on tariff approaches including developing multi-year tariff regulatory framework
Enabling environment
Various Multi year tariff approach approved under new National electricity Act adopted by the Govt
•
India: Privatisation of state highways in Chattisgarh
Support for setting up enabling legal, regulatory and institutional framework to facilitate PSP’ develop model BOT projects and contracts
Enabling environment
Legal/regulatory/competition framework
Award of concession agreement •
Pakistan: Design and implementation of rural telecom PPP project
Recommendations for operationalising, regulating and monitoring the Universal Service Fund (USF); transaction advice for pilot project
Enabling environment
Financial sector/ product development
Operationalisation of the USF and award of a number of licenses
•

89
Project Description CEPA category
CEPA sub category
Main outcome Likely / actual impact
South Asia: Pre-feasibility study for AsPIFF
Feasibility of setting up an infrastructure development company
Enabling environment
Institution building/ development
Establishment of AsPIFF •
Armenia: PSP in Armenian Railways
Development of PSP strategy, transaction advice on concession contract
Enabling environment, Project cycle related assistance
Various, Transaction support
Concession contract awarded •
Kosovo: PSP in WSS
Strategy and transactions support in the water sector
Project cycle related assistance
Transaction support
Water concessions law passed; Water supply management contract awarded
• Service connections have increased by 42%, UFW came down by 24% and supply improved from intermittent to 24-hr supply, benefitting about 200,000 people.
Macedonia: Facilitating private investments in mini-hydropower plants
Development of a strategy for developing mini hydro power plants with PSP
Dissemination/ awareness building
PPI promotion/ awareness building
Govt has awarded 60 sites for mini hydro power development
•
Uzbekistan: PSP in the water sector
Preparation of PBCs for 2 cities
Enabling environment
PPI process Signing of contract with private operator
•
Europe and Central Asia: Comprehensive energy action plan for CAREC
Development of a comprehensive energy sector strategic framework
Enabling environment
PPI policy/ strategy
The strategic framework was endorsed by concerned representatives
•
Croatia: PPP to enhance private participation in the development
Development of framework for long term development of the port and
Enabling environment
PPI policy/ strategy
Master plan and business plan approved by the Port Authority. A tender for the construction of the container terminal is
•

90
Project Description CEPA category
CEPA sub category
Main outcome Likely / actual impact
of the Port of Place
preparation of an action plan for PSP
ongoing.
Colombia: Port modernisation program
Support for reforms for PSP
Enabling environment
PPI policy/ strategy
Govt release of two new port licenses, renegotiation of existing port concession contracts, additional seaport and airport concessions
• The projects have generated $693m in investments.
Costa Rica: Drafting the regulatory framework for telecoms
Guidance on creating a legal and regulatory framework
Enabling environment
Legal/regulatory/competition framework
Approval of two key pieces of telecoms legislation on PSP and competition
•
Guatemala: Funding of credit enhancement facility
Establishment of a facility to enhance credit, stimulate increased bank lending and provide basic infrastructure services to low-income countries
Enabling environment
Financial sector/ product development
•
Honduras: Improving access, quality and efficiency of infrastructure
Country Framework Report
Enabling environment
PPI policy/ strategy
Award of concessions in the water, transport and energy sectors; new water sector laws and simplifying telecoms regulations passed
• Increased investment across all infrastructure sectors ($929m between 1997-07 as against $226m from 1990-98)
• 4m mobile subscribers of a total of 7m people in the country
Latin America and Caribbean: Regulation to develop and
Capacity building program for Regulatel to develop and implement more
Enabling environment
PPI policy/ strategy
Universal Access Funds for Telecoms adopted in 13 LAC countries
• 27,000 public telephones installed in more than 13,000 villages of 10.7m people
• 19,000 telecenters financed to
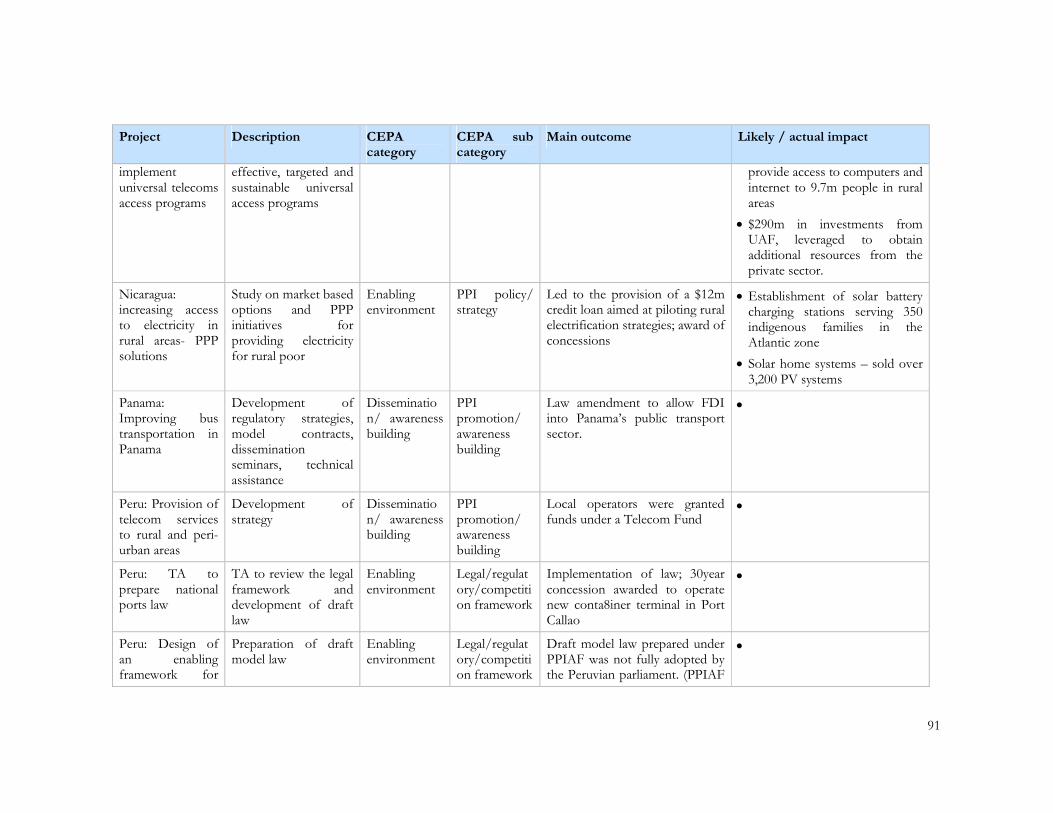
91
Project Description CEPA category
CEPA sub category
Main outcome Likely / actual impact
implement universal telecoms access programs
effective, targeted and sustainable universal access programs
provide access to computers and internet to 9.7m people in rural areas
• $290m in investments from UAF, leveraged to obtain additional resources from the private sector.
Nicaragua: increasing access to electricity in rural areas- PPP solutions
Study on market based options and PPP initiatives for providing electricity for rural poor
Enabling environment
PPI policy/ strategy
Led to the provision of a $12m credit loan aimed at piloting rural electrification strategies; award of concessions
• Establishment of solar battery charging stations serving 350 indigenous families in the Atlantic zone
• Solar home systems – sold over 3,200 PV systems
Panama: Improving bus transportation in Panama
Development of regulatory strategies, model contracts, dissemination seminars, technical assistance
Dissemination/ awareness building
PPI promotion/ awareness building
Law amendment to allow FDI into Panama’s public transport sector.
•
Peru: Provision of telecom services to rural and peri-urban areas
Development of strategy
Dissemination/ awareness building
PPI promotion/ awareness building
Local operators were granted funds under a Telecom Fund
•
Peru: TA to prepare national ports law
TA to review the legal framework and development of draft law
Enabling environment
Legal/regulatory/competition framework
Implementation of law; 30year concession awarded to operate new conta8iner terminal in Port Callao
•
Peru: Design of an enabling framework for
Preparation of draft model law
Enabling environment
Legal/regulatory/competition framework
Draft model law prepared under PPIAF was not fully adopted by the Peruvian parliament. (PPIAF
•

92
Project Description CEPA category
CEPA sub category
Main outcome Likely / actual impact
PPP models in rural electrification
activities transferred under a new World Bank project)

93
11. ANNEX 11: SUMMARY FIELD VISIT REPORTS
11.1. Kenya
This annex provides a summary of CEPA’s field visit to Kenya, as a part of the Strategic
Review of the PPIAF.20 The note mainly focuses on the feedback received from in-
country beneficiaries and users of PPIAF grants, but also PPIAF consultants, the private
sector and some bilateral donors, on the relevance, effectiveness, additionality and impact
of PPIAF interventions in the country.
Overview of the PPIAF portfolio in Kenya
The PPIAF Kenya portfolio adds to 14 projects, with a combined value of US$3.74m,
representing 8% of the overall PPIAF portfolio by value in SSA and approximately 3%
globally. The focus has been on enabling environment (10 projects), then dissemination
and awareness (3 projects), with 1 transaction support intervention. By sector, 3 projects
were in energy, 3 in transport, 5 in water and sanitation (W&S) and 3 were multi-sector.
By value, the W&S and transport categories both absorbed around one-third of the total
value of projects in Kenya, and the energy sector some 20%, leaving 10% for multi-
sector. In terms of size, the most common are very small or medium; there are 5 projects
with values less than US$75,000 and 7 exceeding US$250,000.
Relevance of PPIAF activities in Kenya
During the second half of 2008, the new government emphasis has been on post conflict
recovery, but the medium term aspirations, now termed ‘Vision 2030’, have effectively
been retained. They centre on high and sustained economic growth to deliver middle-
income status. Indeed future competitiveness is dependent on the removal of the
infrastructure services deficits in power, transport and W&S. There is wide acceptance of
the contribution that appropriately designed PPPs, debt instruments and private
investment can make and these feature strongly in sector and national policy statements.
PPIAF activities are therefore seen as highly relevant and supportive of poverty
reduction aims and policies. Indeed there is recognition that PPIAF options and strategy
studies in rail, power, airports and water have helped initiate policy reform and put in
place enabling acts and regulations. The requirement is now more about making the
existing markets and frameworks work, thereby securing infrastructure investment on the
ground. The PPIAF PPP unit project is focused on trying to meet this gap by providing a
more effective institutional and enabling framework across sectors. When in place, it
should help accelerate actual PPP investment pull through.
The relevance of the PPIAF portfolio has also been enhanced by the ability to react
flexibly and quickly, using smaller interventions to try to widen understanding and
20
A two-member CEPA team visited Kenya from 24-26 November 2008, along with Joel Kolker, Regional Program Leader and Serah Njoroge, Program Officer of the PPIAF PMU. The interviews on the field have been supplemented by extensive desk based research of the overall background and context of PPI in the country and the PPIAF portfolio summary and reviews.

94
stakeholder consensus; 5 of the 14 projects are under $75,000 in size. However, there is
also some dissatisfaction with the overall size of PPIAF grants – the tasks required being
regarded as not concomitant with the budget for the assignment or squeezed budgets to
facilitate quick approval. There was considerable support to raising the fast track
threshold to at least US$100,000 and avoiding a perception that project budgets
sometimes are artificially limited to get rapid or uncomplicated approval.
PPIAF’s positioning as a global facility with regional offices in Nairobi throughout the
whole period of operation has also proved beneficial.
Effectiveness of projects
The PPIAF country portfolio has been effective in initiating enabling PPI reforms in
power, roads, rail and airports and has contributed to corporatisation and kick started
community-based schemes in water.
• In power, the PPIAF baseline options study was acted upon and the sector
largely unbundled (a national policy paper on energy reflected some of the
recommendations of the PPIAF funded study); while one of two smaller
interventions was instrumental in finalising the KPLC management contract with
Manitoba Hydro International. In-country feedback confirms that sustainable
gains were made under this contract in a number of areas including connectivity,
overall business culture and corporate performance. One of the senior expatriate
management team was also retained. Less positively, it was felt that there was an
excessive focus on short-term performance targets with inadequate attention
given to training and knowledge transfer. Losses also remained unacceptably
high.21
• Similarly, the PPIAF baseline study in roads concession options facilitated
legislation in the sector (the Kenya Roads Act of 2007) and the eventual bidding
of a Nairobi toll road / bypass package. This 30-year concession is under
negotiation but despite 3 bidders being prequalified, there is now effectively only
1. There are issues relating to the actual level of equity available, the level of tolls
and service costs as well as the sequencing of investment. There is also some
unresolved overlap with ongoing Chinese construction activities. The US$500m
transaction also blends reportedly some US$100m of equity with commercial and
DFI / IDA debt and credits. This transaction also acts as a pioneer for 3 other
road concessions envisaged as part of the World Bank led Northern Corridor
program.
• PPIAF activities in Kenya and Uganda contributed to the eventual tendering of
the 25-year rail concession to Rift Valley Railways in 2006. The original deal
envisaged RVR providing some US$28 million in equity, with IFC and KfW
providing US$64 million in debt. The concession aimed to generate investment
resources of US$450m. However, in practice no significant investment in
structures or rolling stock have yet been made and IFC / KfW have not released 21
Consideration is being given to small follow on PPIAF project to document the lessons of experience.

95
the full debt funding. There is also debate about the quality of management and
the gains / losses in traffic and indeed overall operational effectiveness. Informal
feedback suggested that the operator had missed the quarterly fee payments to
government. IDA provided some US$45m to fund labour retrenchment of 6,200
employees in Kenya. A TAF grant of US$1m for SME linkages has not utilised as
yet.22
• The main outcome of the PPIAF funded work in the airports sector was to open
options, which led to major boosts in concessioning. This has generated income
and reduced costs.23
• For W&S, the Ministry of Water and Irrigation considered that the three city
system based studies supported by PPIAF had contributed in different ways to
reform in the water sector and the passage of the 2002 Water Act. As in other
sectors it appeared that an envelope of PPIAF smaller and medium scale
interventions, clustered around a key institution, was more effective than isolated
interventions. PPIAF has also supported an innovative community based
microfinance project, along with the Water and Sanitation Program (WSP) and
GPOBA, which aims to deliver a successful pilot project that will cover 13
communities. The project and business development model has been developed
in partnership with K-Rep Bank which will scale up the activity as a core business
line, with replication to a further 7 districts and 21 communities under a follow
on SNTA/GPOBA project.
Beneficiaries were complementary as to the quality and timeliness of the studies but were
sometimes concerned that there were inadequate funds to process, implement and train
after the specific output. The use of World Bank procurement and task managers was
seen as having good and bad effects but main concern related to who became the
primary client for the consultants and the perceived reduction in ownership of results or
indeed the balance of consultancy effort. The major difference in effectiveness was due
to differences in the quality of individual task managers. There was also support for an
enhanced role for the PMU in execution.
The ability of the PPIAF regional office to adopt a more selective and country focused
approach is limited at present by its geographic coverage – effectively Anglophone west /
eastern / southern and central Africa and the enormous investment of team time in
business and client / partner relationship development, monitoring the less able Task
Team Leaders, networking, advocacy, project and program reporting. Given the mix of
strong performers and fragile or post conflict states plus the “demand driven” policy,
field visits strongly confirm the inappropriate classification that regional office costs are
“administrative” in nature. Basically much of the above are part of the core PPIAF
22
Other issues also appear to be creeping in: these include an expressed regulator preference for an open access system; political pressures to upgrade or develop a standard gauge track compared to the existing metre gauge; and factions within government. PPIAF could have a role in providing independent advice on some of pros and cons of the above technical issues but overall concession prospects appear fraught. 23
A phased programme of improvements is now underway and outline agreement has been signed with a major private sector developer from Dubai to create a US$300m hospital / hotel / conference complex at Jomo Kenyatta International airport.

96
program and need to be separately accounted, as for external country task management.
This will require additional budget and accounting analysis above the level of a field
study.
Additionality
Feedback on additionality suggested that most beneficiaries and other observers
considered that the activity would have gone ahead in the absence of PPIAF, but would
have been delayed and more difficult to arrange. The ability to respond quickly and non-
bureaucratically at different points in the reform cycle was also highly valued.
Impact of projects
As detailed above, for transport the two flagship concessions have yet to achieve the
predicted impacts and may actually fail. In the case of transport the two flagship
concessions – rail and road – could fail or not be closed. For the rail concession, over 10
years of preparatory work would be lost and the US$450m full project PPI entry deleted.
The backlog of maintenance and operational losses would have increased. The labour
retrenchment position is probably neutral but anticipated concession fees to government
have however not materialised. For the roads concession for Nairobi, preparation and
bid costs would also be lost but more importantly, lack of closure with the current sole
bidder would damage market prospects for the future 3 road concessions anticipated in
the Northern Corridor.
In power, the KPLC management contract had some success in outcomes and impacts,
particularly in terms of connectivity (there was an increase from 67,000 connections to
120,000 in the first year, and a further 25% increases in the second year), metering and
service levels. The IPO for KenGen raised some US$109m.
The water and sanitation sector is more positive, but the actual impact of the innovative
micro-finance scheme is only just starting to emerge. The pilot covers 13 community-
based projects, of which 7 are under construction, 5 still in design phase and 1 complete
(from March 2008)24 – and when completed, will serve around 65,000 people with 24/7
water supply, at a lower cost than previously. The single completed project at covers
some 720 households but is aiming to double the subscriber base within 3 years.
However while increased connections has implied higher revenue for the Water Board,
the problem of illegal connections and losses of water continues (50% of the water
supply is still unaccounted for). The pilot will be scaled up, with SNTA assistance, to
another 7 Boards and anticipates a reaching a further 21 communities covering some
170,000 people by end 2009.
Other issues
• The importance of major unsolicited bids from private developers, often
packaged in a complex but not transparent manner, is likely to increase and
continue to gain political attention. The ability of government to assess, analysis
24
The outstanding 8 projects are expected to be approved by the end of next year.

97
and negotiate such transactions is both limited and sensitive and PPIAF support
may be required. This is a long outstanding PPI issue in the region and elsewhere.
• PPIAF was often but not exclusively seen by beneficiaries as a Bank program
rather than an independent Facility but there was no substantive perception of
PPIAF being used to prepare Bank operations or advance a Bank led reform
agenda.
Key conclusions and observations
The main conclusions and observations from the field visit are:
• The positioning and effectiveness of the future interventions would be improved
by a greater executing capacity within or contracted to the regional team; this may
also improve client ownership.
• The time investment put in by the regional team in ‘enabling and managing the
system’, including project development, client relationship management, PPP
advocacy, task management support, quality control and reporting needs to be
properly accounted for and not simply considered an administrative charge.
• In Kenya, the SNTA program has a strong strategic fit and likely to form a
substantial part of the future portfolio and any future staffing should reflect this.
• Innovation and quick response are highly valued and need to be at the centre of
the PPIAF business model.
• The potential for replication and transfers of best practice appears high but
should be more systematic and directed.
• Clustering seems to give more leverage than ad hoc interventions.
• There is broad support for the notion of raising fast track project budgets to at
least US$100,000 and indeed recognition that budgets generally should not be
artificially constrained.
• There is scope to increase awareness and use of PPIAF knowledge products in
order to increase local skills and expertise to implement PPP projects.

98
11.2. Uganda
This annex provides a summary of CEPA’s field visit to Uganda, as a part of the Strategic
Review of the PPIAF.25 The note mainly focuses on the feedback received from in-
country beneficiaries and users of PPIAF grants, but also PPIAF consultants, the private
sector and some bilateral donors, on the relevance, effectiveness, additionality and impact
of PPIAF interventions in the country.
Overview of the PPIAF portfolio in Uganda
The PPIAF portfolio in Uganda comprises 7 activities for a total value of US$1.5m, of
which 1 project has been cancelled. These projects represent 3% of the PPIAF portfolio
in Sub-Saharan Africa (SSA) and 1% globally, both in terms of number and value.
Of the 6 completed/ active PPIAF projects in Uganda, 5 are aimed at developing the
enabling environment for PPI in the country and 1 is more downstream in nature and
involves project preparation. The sectoral composition of the portfolio is as follows – 2
are multi-sector activities, 3 in the transport sector and 1 in the energy sector. Thus there
have been no PPIAF activities in the water and sanitation and telecoms sectors in
Uganda.26 In terms of size, there are 2 projects that are equal to or less than US$75K and
4 that are greater than US$250K.
Relevance of PPIAF activities in Uganda
The overall feedback received from the beneficiaries interviewed in Uganda is that the
PPIAF activities have been very relevant and timely and have been much valued by the
Ugandan government. PPIAF support has also been in line with national development
and poverty reduction priorities – for example, the energy situation in Uganda has been a
major constraint to economic growth and PPIAF funding has aimed to support
developments in this sector through both the country framework report which brought
out the key issues in the sector and recommended an appropriate strategy going forward,
as well as the PPIAF support provided for a study on the options for rural electrification
(an issue that is increasingly becoming quite political in the country given the affordability
constraint). In addition the Kenya- Uganda rail concession has been a key PSP
transaction for the country and PPIAF has supported the same through a study aimed at
restructuring the rail sector as well as the design of a multi-sector regulatory agency for
transport.
In terms of activity focus of the PPIAF portfolio in Uganda, our perception is that there
is a demand for enabling environment support for the development of PPI in the
country, with some specific transactions support as the need may arise. The majority of
25
A two-member CEPA team visited Uganda from 25-26 November 2008, along with Joel Kolker, Regional Program Leader, PPIAF PMU. The interviews on the field have been supplemented by extensive desk based research of the overall background and context of PPI in the country and the PPIAF portfolio summary and reviews. 26
Note that at present, the Sub National Technical Assistance (SNTA) is working with the water utility on obtaining a shadow credit rating and the issue of a bond to raise finance in the capital market. This marks a good strategic fit of the SNTA with PPIAF activities in the country.
99
PPIAF’s portfolio in the country has been on enabling environment activities, and the
recent project on development of the PPP framework/ unit in particular, is thus timely
and relevant for Uganda. The telecoms and energy sectors have progressed considerably,
and hence there may be a case for more downstream support in these sectors in Uganda,
however, the transport and water & sanitations sectors still require more upstream
support from PPIAF.
Another additional area of support requested from the PPIAF is in terms of supporting
the ‘process’ of implementing the PPIAF recommendations and reform procedure. An
oft-cited constraint by the government bodies is that they lack the capacity to interpret
the recommendations and take them forward to implementation.27 PPIAF support would
be very useful in ‘hand-holding’ the Government to help take an option/
recommendation to implementation stage.
Effectiveness of projects28
Some examples on the beneficiary views on the outcome of PPIAF assistance are as
follows:
• Country Framework Report (CFR). The beneficiary view is that the CFR was
a very useful piece, which helped put forward a strategy for private sector led
growth. At that time, the focus of PPPs in Uganda was divestitures, but the study
opened up other options for PSP including the reform of utilities. The CFR has
enabled reforms in the electricity, transport and other infrastructure sectors.
Some of the PPIAF projects in Uganda have been developed based on
recommendations made in the CFR including the rail restructuring and
development of the multi sector transport regulatory agency.
• Development of a multi-sector transport regulatory agency (MTRA). The
output of this study was very well received by the government agency, however
there were some issues in terms of the study not covering certain relevant legal
aspects. Progress, albeit considerably slowly, is being made towards
implementation of the regulatory agency (see footnote 3).
• Restructuring of the railway sector. Beneficiary governments have recognised
that it is hard to link this project directly to the current Kenya-Uganda rail
concession given the many players and activities that have taken place since.
However, one beneficiary commented that some of the recommendations of the
study in terms of implementing a regulatory law prior to the concession did not
27
The Multi Sector Transport Regulatory Agency (MTRA) study is a case in point and demonstrates the timescales of actually getting something implemented – the project was scoped in 2002, let in 2003 and the study completed in 2006, after which a government position paper had to be prepared. The paper will go to cabinet in end 2008 leading to a bill in Q1 2009 and approval by say Q3 2009. The MRTA will then be established by 2010 – 8 years after the start of the PPIAF assistance on the design study. 28
Of the 7 PPIAF funded projects in Uganda, 2 are on-going and 1 cancelled – thus giving 4 completed projects for which it is possible to gauge the effectiveness and outcomes. Of the 4 completed projects, 1 project – the options study for rural electrification – was very small (US$40K) and we could not meet with anyone directly associated with the project to assess its effectiveness and outcomes, if any.

100
take place and attributes this as one of the reasons for the problems with the
current concession.
The above-cited examples of outcomes achieved by the PPIAF funded projects reflect a
fairly good picture. The outputs of the PPIAF activity appear to have been fairly well
received by the Government, with these outputs contributing to outcomes in terms of
development of PPI sector reform strategies and policies, PPI legislation and regulation
as well as fostered the creation of relevant institutions to facilitate PPI in the country.
Additionality
PPIAF’s additional role in the PSP development landscape has been viewed very
positively by beneficiaries in Uganda. The speed and flexibility of PPIAF grants has been
specifically noted by almost all beneficiaries as an extremely additional factor. It was
noted that without PPIAF, PPI activities may have proceeded, albeit much more slower
and with greater degrees of difficulty. Also, the degree of dependence and linkage to the
World Bank or other donor activities would possibly have increased – PPIAF thus serves
to level the playing field.
Impact of projects
While the field visit attempted to gather information on the impact of PPIAF projects,
the information provided here obviously has the caveat that PPIAF activities are mostly
upstream and hence many take many years to filter down to actual downstream impacts
as well as the fact that any downstream impacts have also been affected by a host of
other factors and hence cannot be directly attributed to the PPIAF activity. In addition, it
is important to note that the PPIAF portfolio in Uganda has been relatively small.
The PPIAF supported Country Framework Report has fostered reform in a number of
infrastructure sectors, including the energy sector, which has seen a number of impacts
through its concessions in generation, transmission and distribution. PPI in the energy
sector has resulted in US$937m of total investments in projects since 1990, most of
which has been achieved after 2000.29 These investments have contributed to the
development and upgradation of infrastructure, which has in turn contributed to
improvements in connectivity. For example, the concession of the distribution system
(Umeme concession) has led to increased number of connections – 15,000 households in
year 1, 20,000 households in year 2 and 18,000 households in year 3.30 There is also
evidence of technology transfer which has impacted the system as a whole. However
there continue to be a number of issues plaguing the Ugandan electricity sector –
generation continues to be a major issue, as does rural electrification and affordability.
PPIAF support to the railways sector may be linked to the Kenya-Uganda rail concession
that became operational in October 2006. However, there have been no actual impacts
thus far – predicted debt of US$64m, equity totalling US$24m and internal cash
29
Source: PPI database. 30
We understand that this increase far exceeds the targets under the concession of 12,000 new connections p.a.

101
generation of US$33m pledged towards the five-year capital investment requirements,
have not been realised thus far. It was also estimated that total capital expenditure
required over the lifetime of the project will be approximately US$450m – however, the
concessionaire has not made any investments in capital development and upgrading of
the railways as of today. For Uganda in particular, the concessionaire has not paid the
fees due for the last 3 quarters, which amounts to greater than US$1m. In addition, the
cost retrenchment of labour from the railways has been handled by the Ugandan
government – 1,000 Ugandans were retrenched at a cost of Ush 15bn (US$7m) to the
Government. The concession has not enhanced competitiveness, with the market share
of the railways having dipped further from 16% to 10% for Uganda. Thus impacts of this
transaction are yet to be observed, if the transaction itself does not get cancelled. The rail
concession is a key transaction for Uganda and the East African region as a whole and
will have strong demonstration effects for the other infrastructure sectors of the
economy and any planned PSP activity in the medium term
Other issues
Some of the other issues brought out during the field visit are as follows:
• There was a more or less univocal demand from beneficiaries in Uganda for
greater task management of PPIAF projects by the PMU. The PMU is viewed as
an expert in the field of PPI and thus beneficiaries are keen for their greater role
as task managers. In Uganda in particular, there has been some dissatisfaction
with task management by the World Bank – clients have felt excluded from some
projects and management by TTLs not based in Uganda has been viewed to have
a lower degree of commitment.31
• Most of the beneficiaries interviewed in Uganda are not aware of the
independence of the PPIAF from the World Bank.
• Most of the beneficiaries interviewed were not aware of the wide range of
knowledge products offered by the PPIAF, but were quite excited by the
availability of this information and appeared to be keen to access it.
Key conclusions and observations
Based on the above, our key conclusions and observations are as follows:
• The PPIAF has played a relevant, effective and additional role in supporting the
enabling environment for PPI in Uganda and there is a demand for ‘more of the
same’ from the facility in Uganda.
• The examples of the experience of PPI in Uganda point towards the difficulty of
actually achieving impacts on the ground. The complex environment presents
quite a few challenges for the development of PPI, and the consequent level of
31
Iin Uganda in particular it needs to be noted that the World Bank office does not have sufficient capacity to task manage PPIAF projects at present. Thus most of the PPIAF TTLs have tended to be from the World Bank Tanzania office or even the Washington office.

102
impact that can be achieved. Achievement of impacts is a slow process and may
be enhanced through a greater ‘strategic’ focus of the PPIAF.
• There is a demand for task management of PPIAF projects by the PMU, and
thus going forward, it appears that in order for PPIAF to play a more effective
and strategic role in Uganda, there needs to be some expansion of PMU capacity.
• There is a role for PPIAF in taking projects forward to implementation. While it
is recognised that the PPIAF PMU does provide ad hoc support in this regard, it
is not extensive given its current capacity, and is not recognised outright as an
activity of the PPIAF with a supporting budget.
• In order to improve effectiveness of project and client satisfaction, there is a need
for greater involvement of the client in developing terms of reference and
outputs of projects.
• There is a need for PPIAF to expand the outreach of its knowledge products to
cover LDC governments more extensively
103
11.3. India
This annex provides a summary of CEPA’s field visit to India, as a part of the Strategic
Review of the PPIAF.32 It mainly focuses on the feedback received from in-country
beneficiaries and users of PPIAF grants, but also PPIAF consultants, the private sector,
and some bilateral donors on the relevance, effectiveness, additionality and impact of
PPIAF interventions in the country.
Overview of the PPIAF portfolio in India
The PPIAF portfolio in India comprises 36 projects at a total value of US$6.33m, of
which 19 are closed projects, 14 projects are ongoing, and 3 projects have been cancelled.
The total number of projects executed in India represents 39% of the PPIAF portfolio in
the South Asian Region (SAR) and 5% globally. In addition, there have been 9 regional
activities of US$1.75m – mostly on dissemination and awareness building – which also
included India.
78% of PPIAF projects in India focus on enabling environment activities. Although only
11% of PPIAF funds directly focussed on dissemination/awareness building category,
most of the projects have consensus building and dissemination components. Project
cycle related activities were 8% of the portfolio by number, and 16% by value.
17 projects were multi-sector activities, 9 focused on energy, and 5 projects each on
water and sanitation and the transport sectors. PPIAF has not intervened in the Indian
telecom sector as it already attracts significant private investment. 20 projects (around
56% of the portfolio) were of value less than or equal to US$75k. Of the remainder, 8
projects were medium-sized (US$75k – US$250k), and another 8 were greater than
US$250k).
Relevance of PPIAF activities in India
The general consensus is that PPIAF initiatives have been relevant, useful and timely.
Despite PPPs starting in India in the early 1990s, there is still limited capacity and
necessary regulation and policies are not in place to scale-up PPPs. Feedback from
government beneficiaries suggests that PPIAF’s support has been broadly in line with
national development and PPP strategy priorities. PPIAF’s portfolio in India increased
almost three-fold since 2004 (from 9 to 24 activities), in line with the national priorities
of increasing infrastructure spend to 9% of GDP, primarily through mobilising PPI.
Also, PPIAF’s sector focus on transport and energy; and support with developing an
enabling environment have been consistent with the government’s PPP priorities.
PPIAF’s activities in the establishment of a PPP transaction advisory panel and the
development of model concession agreements for various sectors, in line with
32
A two-member CEPA consortium team conducted the India review from 3-5 December 2008. This team met a number of government agencies related to the PPIAF portfolio, NGOs, consultants, donors, and other stakeholders. The field interviews were supplemented by extensive desk based research of the background and context of PPI in India and the PPIAF portfolio summary and reviews.
104
international best practice, were cited as especially relevant and far-reaching in terms of
advancing India’s PPP agenda.
Consultees were divided in their views of whether PPIAF should move downstream. A
few consultees supported PPIAF’s selective support on project cycle activities,
particularly early-stage assistance in developing bankable projects, and post-contract
issues. Within enabling environment activities, it was felt that local currency/capital
market development is comparatively advanced in India and requires limited focus;
however, PPI process activities such as support to PPP cells at the state level is
necessary.
All consultees were unanimous that PPIAF should also focus on health and education
infrastructure in India, where the government is now trying to promote PPPs and PPIAF
could help support innovative solutions.
Effectiveness of projects33
PPIAF activities have facilitated a greater commitment from the government to include
PPI as an important component of the reform agenda. One of the government’s recent
interventions was the establishment of the PPP cell in the Department of Economic Affairs
(DEA). This PPP cell plays an important role in the initiation, development and
monitoring of PPP transactions across India. 34
PPIAF activities can be partly credited for triggering greater government participation in
infrastructure PPP financing through measures such as sponsoring the India
Infrastructure Project Development Fund (IIPDF). Beneficiaries felt that PPIAF projects
helped achieve the desired outcomes in terms of suitable PPP policies/ legislation,
developing model concession agreements, building capacity, enabling regulatory reform,
and setting up institutional mechanisms such as PPP cells etc.
A recurring theme throughout the review was that PPIAF needs to scale-up the value of
its support if it is to make a meaningful impact. In general, it was felt that PPIAF was
more of a ‘knowledge partner’ on PPP issues and that the quantum of technical
assistance needs to be higher to meet the needs of the recipient.
Of the implemented 33 PPIAF projects, PIRs were available for 25 projects35 out of
which 23 were rated as satisfactory based on the Activity sign-off report, Activity
implementation reports and the PMU checklist, while 1 was rated at risk due to delays in
completion. Only one project (Privatisation of State Highways in Chhattisgarh) was rated as
unsatisfactory due to government abandonment at phase II, which required the
implementation of three pilot BOT road projects.
33
Of the 36 PPIAF funded projects in India, 19 projects are completed, for which it is possible to gauge the effectiveness and outcomes.
34 Details of the PPP cell can be obtained from www.pppinindia.com.
35 Based on feedback from the PPIAF staff, the balance eight activities were fairly new and PIRs will be done shortly. However, seven of these are expected to have a satisfactory rating, while one is high risk due to delays in completion.

105
Additionality
Most beneficiaries considered PPIAF to be the only facility/ knowledge partner
supporting enabling environment and other upstream PPP related interventions. It was
also felt that PPIAF provides quick-response solutions and meets government needs.
Feedback on PPIAF processes
In general, beneficiaries were content with the PPIAF proposal submission and activity
implementation processes. Although the support of the PPIAF’s regional office was
considered useful, it was evident that the government beneficiaries were ‘in the driving
seat’ with respect to defining their PPP needs and shaping the terms of work. Most users
saw benefit in drawing on the expertise of World Bank task managers, although all
consultees welcomed the idea of PPIAF selectively task managing more activities, given
their PPP skills and ‘neutral’ role in not being a lending programme. Task management
by other donors such as ADB was also received positively.
Impact of projects
The impact of PPIAF’s upstream support is mostly indirect in the short term. However,
PPIAF is viewed by beneficiaries as instrumental in contributing to the overall PPP
growth in India across sectors.
Table A11.1 lists the impacts achieved by a selection of closed PPIAF projects. In
addition, the PPIAF grants in India of US$6.33m have mobilised co-financing from
other donors and government agencies of about US$2.5m (40% of PPIAF’s portfolio).
Table A11.1: Impact of a selection of closed PPIAF activities36
PPIAF Activity Impact achieved/ expected
Planning Commission: Facilitating Public-private Partnerships in infrastructure sectors
A Model Concession Agreement that received advisory input under PPIAF funding led to a US$4bn PPP investment project being awarded for the Hyderabad metro project. The project financing is currently being negotiated with construction plans underway. Several other PPP/concession contracts are in the procurement stage.
Developing institutions to promote regulatory capacity building (CUTS)
CIRC, whose business plan was developed with PPIAF support, has successfully mobilised Rs10m (US$222k) from a private Indian company on a challenge grant basis. Its target capital to be mobilised is Rs20m (US$444k).
Infrastructure Public Private Partnership financing
GOI set up India Infrastructure Finance Company Ltd. (IIFCL), a dedicated institution for infrastructure financing. As of Sep 2008, 71 projects across sectors, mostly in road and power, reached financial close. IIFCL allocated Rs11.8bn (US$262m) to these projects, whose
total project cost exceeded Rs1097bn (US$24bn).37 In 2008, ADB provided US$500m lending to IIFCL and the World Bank is preparing a US$600m loan for delivery in FY09.
Empanelment of advisors As an indirect impact of this intervention and to facilitate PPP
36
Exchange rate assumed is 1 US$ = Rs 45. 37
IIFCL Newsletter, October 2008.
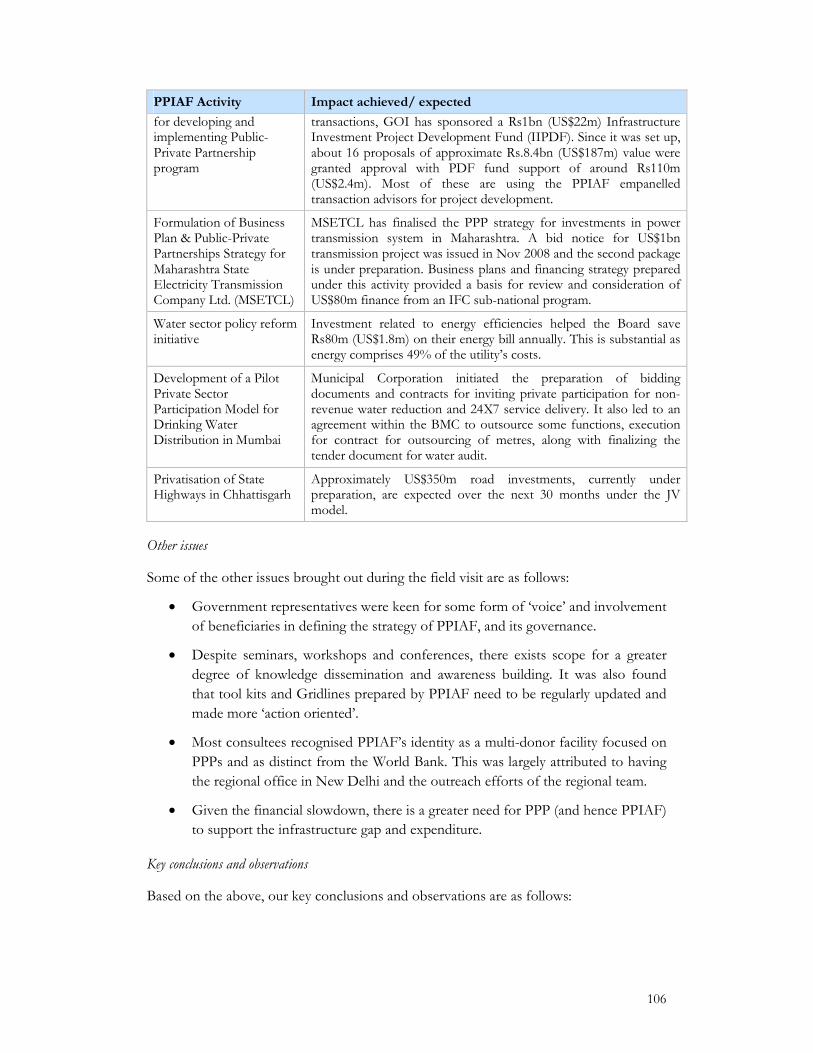
106
PPIAF Activity Impact achieved/ expected
for developing and implementing Public-Private Partnership program
transactions, GOI has sponsored a Rs1bn (US$22m) Infrastructure Investment Project Development Fund (IIPDF). Since it was set up, about 16 proposals of approximate Rs.8.4bn (US$187m) value were granted approval with PDF fund support of around Rs110m (US$2.4m). Most of these are using the PPIAF empanelled transaction advisors for project development.
Formulation of Business Plan & Public-Private Partnerships Strategy for Maharashtra State Electricity Transmission Company Ltd. (MSETCL)
MSETCL has finalised the PPP strategy for investments in power transmission system in Maharashtra. A bid notice for US$1bn transmission project was issued in Nov 2008 and the second package is under preparation. Business plans and financing strategy prepared under this activity provided a basis for review and consideration of US$80m finance from an IFC sub-national program.
Water sector policy reform initiative
Investment related to energy efficiencies helped the Board save Rs80m (US$1.8m) on their energy bill annually. This is substantial as energy comprises 49% of the utility’s costs.
Development of a Pilot Private Sector Participation Model for Drinking Water Distribution in Mumbai
Municipal Corporation initiated the preparation of bidding documents and contracts for inviting private participation for non-revenue water reduction and 24X7 service delivery. It also led to an agreement within the BMC to outsource some functions, execution for contract for outsourcing of metres, along with finalizing the tender document for water audit.
Privatisation of State Highways in Chhattisgarh
Approximately US$350m road investments, currently under preparation, are expected over the next 30 months under the JV model.
Other issues
Some of the other issues brought out during the field visit are as follows:
• Government representatives were keen for some form of ‘voice’ and involvement
of beneficiaries in defining the strategy of PPIAF, and its governance.
• Despite seminars, workshops and conferences, there exists scope for a greater
degree of knowledge dissemination and awareness building. It was also found
that tool kits and Gridlines prepared by PPIAF need to be regularly updated and
made more ‘action oriented’.
• Most consultees recognised PPIAF’s identity as a multi-donor facility focused on
PPPs and as distinct from the World Bank. This was largely attributed to having
the regional office in New Delhi and the outreach efforts of the regional team.
• Given the financial slowdown, there is a greater need for PPP (and hence PPIAF)
to support the infrastructure gap and expenditure.
Key conclusions and observations
Based on the above, our key conclusions and observations are as follows:

107
• PPIAF interventions have been useful, and played an extensive role in the
development of an enabling environment for the PPP program in India. There is
a recognised need to continue to strengthen and upscale PPIAF’s activities.
• It was universally felt that PPIAF needs to expand into the social sector,
including education and health. PPIs are minimal in these areas and PPIAF’s
innovative approaches could help generate long-term and substantial impacts.
• Overall, PPIAF should increase support at state and sub-national levels in India.
It should continue its support in mature states to explore innovative models in
emerging sectors such as public transport, water, irrigation, rural power and rural
telecoms. Simultaneously, PPIAF interventions should focus on laggard states
such as Bihar, UP and Orissa to assist with, for example, PPI processes such as
PPP cells.
• PPIAF initiatives are at times spread too thin and there may be a case to focus on
fewer initiatives but with greater impact. PPIAF could look at increasing the
average size of its interventions, which could allow for engagement of high
quality technical assistance. Further, its overall spend for India activities needs to
be re-evaluated, given the upbeat PPP environment and needs in the country.
• PPI process assistance should be continued. The development of Model
Concession Agreements has shown considerable success. PPIAF should also
consider more active involvement in some pilot projects as well as provide
project level technical assistance for effective implementation of its policy
recommendations.
• There is a need for a strong PPIAF strategy for India with more cohesive
activities. This would include objectively verifiable indicators and impact
assessment, against agreed parameters, but would retain the flexibility to be
opportunistic on a case-by-case basis within the overall strategy.
• PPIAF would benefit from working more closely with other donors active in
India (especially at the state level) and Regional Development Banks like the
ADB, which can also task manage select PPIAF projects. The option of having
PPIAF task managers for selected activities was also well-received by all
consultees.

108
11.4. Vietnam
This annex provides a summary of CEPA’s field visit to Vietnam, as a part of the
Strategic Review of the PPIAF.38 It mainly focuses on the feedback received from in-
country beneficiaries and users of PPIAF grants, but also PPIAF consultants, the private
sector, and some bilateral donors on the relevance, effectiveness, additionality and impact
of PPIAF interventions in the country.
Overview of the PPIAF portfolio in Vietnam
PPIAF’s portfolio in Vietnam comprises 22 projects, with a combined value of
US$4.225m. This is 3% of PPIAF’s global portfolio by number, and 16% of the portfolio
in the East Asia and Pacific region by value. The focus has been on enabling
environment activities, with 20 projects accounting for 88% of the portfolio value. The
remaining two interventions are for project transaction support. Of the enabling
environment activities, the PPI policy/ strategy sub-category covers 32% of total value,
regulatory frameworks represent 23% and PPI process support 18%.
6 projects were initiated before 2004 and 16 after, but the overall value ratio is 40:60,
indicating that more recent projects have been smaller. 13 of the 22 projects are less than
or equal to US$75,000. 9 projects are in water and sanitation, 7 in energy, 4 in transport
and 2 are multi-sector. There were no ICT interventions. By value, both transport and
energy accounted for around 30% each, with water and sanitation 23% and multi-sector
18%.
Relevance of PPIAF activities in India
Feedback from the field visit emphasised that beneficiaries, consultants and donors all
considered that PPIAF activities were relevant and closely aligned with both growth and
poverty alleviation objectives. The success achieved to date and the likely early
achievement of middle income status means that relevance will increase, as the
availability for concessional funds for infrastructure decreases.
A key characteristic of PPIAF’s continuing relevance will be the ability to provide quick
response, innovative and high quality independent consultancy teams. Vietnam is a
strong reformer and client institutions are similarly mature and discerning. Use of grant
funds to get immediate best practice technical assistance enhances donor positioning and
credibility.
Donor activity within the three main infrastructure sectors remained significant and
levels of coordination were high. This was partly reflected in the relatively high levels of
co-financing achieved at the project level. Co-financing of PPIAF projects in Vietnam
equals US$3.6m (or 86% of the size of the portfolio) – the highest ratio amongst the 4
countries covered under this Strategic Review. 38
Interviews in Vietnam, covering Hanoi, Lim Town and Ho Chi Minh City (HCMC), took place during 11-16 January 2009. A limited number of telephone and other email contacts were also made. These consultations were undertaken by Michael Dyson, CEPA Associate, with the assistance of Paul Reddel, the PPIAF Regional Program Leader for East Asia and Pacific.

109
Historically PPIAF interventions have contributed significantly to progressive
development of enabling policy and regulatory requirements and facilitated policy reform
by pilot testing or pioneering transaction support. Examples include leverage of the
Hanoi/HCMC axis for the “socialisation” of urban bus routes39 and non revenue water
interventions; pilot Design-Build-Lease water supply initiatives in Lim and Minh Duc;
plus support for draft water Decrees and Electricity Regulatory Authority of Vietnam
(ERAV) licensing models. This pragmatic process is aligned with the realities of the
reform process for network infrastructure in Vietnam and helps build consensus and
awareness of the pros and cons of a PPI approach. There is also a strategic clustering
around a few key clients.40
Consultations suggested that there was case to raise the fast track maximum size to at
least US$100,000 to ensure that TTLs gained access to high quality experts. It was also
highlighted that it was important in some cases to access a block of financing, without
multiple applications to small scale Trust Funds that did not have the dedicated focus of
PPIAF.
The SNTA window has only just begun to emerge but will fit well with the core
decentralisation theme to address the local infrastructure service deficit in provinces and
district towns.
Effectiveness of projects41
The PPIAF country portfolio is widely seen as effective and recognised as having helped
both initiate and sustain PPI enabling reforms, through independent analytical advice on
options, pilot design and procurement plus draft provision of decrees and standard
licensing documents. Emphasis was on the benefits of a quick and tailored response and
access to high quality, often individual consultants who could provide best practice.
There was even some anecdotal evidence suggesting that packaging in small and medium
projects was more effective than larger ones.
PPIAF has made a substantial contribution to the current reform and restructuring of the
electricity sector. PPIAF support for the ERAV and follow-on project dealing with
transmission and single buyer licenses in a competitive generation market have fostered
reform and unbundling of costs and charges, increased predictability and ensured non-
discriminatory markets. The ERAV licensing system is operational; a substantial scale up
in the issue of generation licences is expected in 2009, with the number more than
doubling as clusters of mini-hydro units are brought forward. The master plan and early
transition to a multiple buyer electricity market is also established. The ongoing process
of reform is likely to generate additional specific requests from ERAV who are very
positive on the benefits of the three PPIAF projects they have already been involved
39
This actually means competitive contracting of routes to private operators to improve service and reduce subsidies. Terminology is important in gaining acceptance in Vietnam. 40
The exception to this is the water and sanitation sector, where the line Ministry of Construction appears to be part of the problem but progress on PPI solutions is based on the decentralisation of water service provision to city and provincial authorities. 41
Of the 22 PPIAF funded projects in Vietnam, 17 projects are completed, for which it is possible to gauge the effectiveness and outcomes.
110
with or created by. The outcomes have however been mixed for the PPIAF intervention
on legal and regulatory frameworks for downstream gas.
In the transport sector, following PPIAF support for the development of PSP options in
urban transport, 16 Hanoi bus routes have been contracted via competitive tenders to 5
operators. Impacts are considered below but the experience, based on an effective
PPIAF intervention, is considered successful and another 10 routes are planned to be let
in the next two years. Future areas include ticketing, bus maintenance and workshops.
Progress in HCMC is slower but still positive.
Feedback on PPIAF support in the two pilot DBL water supply projects plus the Hanoi
and HCMC non-revenue water assignments was also highly positive. In each case the
approach deployed has proven effective and considerable scale-up potential exists.
Additionality
Most TTLs and beneficiaries felt that significant delays and cancellations would have
resulted without PPIAF funding. In some cases this would have led to loss of the reform
or pilot window as alternative suitable grant sources were limited and not easily
accessible. In this context it was reported that Vietnam no longer has access to the
Japanese PHRD grant facility operated by the World Bank and that other sector facilities
like ESMAP or ASAEF had more time consuming and uncertain procedures.
Impact of projects
During the field visit the opportunity existed to sample a set of completed PPIAF
projects for outcomes and impact, although given the extended time periods associated
with infrastructure projects the results are only now emerging – however the available
evidence was encouraging. Attribution of the outcomes and development impacts cannot
typically be solely associated with the PPIAF intervention, as other donors or DFIs are
normally involved.
In the transport sector, the impact of the 16 Hanoi bus routes mentioned above includes:
a cumulative reduction in public subsidy of around US$2.5m, generation of 1,300
additional private sector jobs and US$11m investment in 218 new buses. The increased
level of competition between the public and private sector has led to improved service
quality and environmental benefits.
PPIAF support for the energy sector including the funding of legal advice for the Phu
My 2 BOT power project has been regarded as a timely intervention for the project – the
project became the first internationally competitively tendered BOT in Vietnam and the
then second largest private investment in the power sector. The power plant became
operational in 2005 and helps service an industrial park. Its impact includes the
contribution to economic growth and the demonstration effects of the project.
In the water sector, the SAWACO performance based contract (PBC) with Manila Water
to reduce non-revenue losses is now in place and the contractor fully mobilised but it is
too soon to report on performance. Nevertheless substantial annual savings (possibly of
the order of US$7m per year) are expected. The PPIAF project has also enabled

111
SAWACO to progress and contribute to an ongoing World Bank urban water operation.
In addition, the single zone PBC is being compared with another more traditional
internal approach by SAWACO and the results will be fed into SAWACO’s
considerations of potential future operational (and structural) options involving the
private sector. A major development impact is anticipated through the application of a
GPOBA grant to both trial zones, under which up to 30,000 poor households will be
given free water connections over 4 years. The envisaged efficiency savings under the
PBC and comparator directly facilitate this pro poor activity.
The experiences of the DBL water supply pilots at Lim and Minh Duc are also beginning
to demonstrate outcomes and impacts, despite only 1 year or less of operation. In both
cases the consumer take-up of piped connections has been faster than originally
envisaged and household consumption has increased. Willingness and ability to pay both
exist and the commercial tariff underlies a business model than appears to work. Both
contractors are interested in expansion, either through direct investment or bidding for
more DBL contracts. In the case of Lim, within a year the number of consumers has
grown from 1,792 to 2,336 and further take-up to 2,500 is expected; some 14 local full-
time jobs have been created, with a further 6 part-time. For Minh Duc the initial DBL
system has risen from 1,350 consumers to 2,000 and further expansion to around 3,000 is
likely over the next few years. A similar number of new jobs have been created. In
addition the contractor, SENCO, is now in the process of trying to raise its own
investment funds of US$2m to develop a contiguous area with some 3,000 to 6,000
consumers. Both operators report that women are the major driver of increased take-up
and consumption for household uses; clinics, schools and other public services have also
clearly benefited.
Other issues
Some of the other issues brought out during the field visit are as follows:
• The financial crisis and global economic turndown will clearly impact growth and
PPI in infrastructure – however, this should also create an opportunity to shift
from a project-by-project approach to a more systematic programme, with
standard procedures and frameworks.
• The PPIAF East Asia and Pacific region covers China, Indonesia, the Pacific
Islands, Mongolia, Vietnam, Cambodia, Laos, the Philippines, PNG and, in
theory, the poorer parts of Thailand. This is very diverse and difficult to access
group of PPI clients, some strong and mature high performers while others are
beset by governance, size, location and other difficulties. No indicative country or
sector or other target budgets are reported but clearly there is a requirement for a
facility like PPIAF to service a spread of client countries (and poor regions within
them).
• The high level of co-financing and joint development partner activity
demonstrated by the PPIAF Vietnam portfolio is creditable and encouraging.

112
Indeed it suggests that such higher levels should be targeted in high performers
and lower levels accepted in more difficult or fragile clients or regions.
• The PPIAF business model is perceived as efficient and appropriate and the
brand positioning, as a multi-donor trust fund hosted by the World Bank, well
understood. No major client facing issues or questions of “capture” were raised
during the field visit.
• In-country use of internet based knowledge products appears very limited and
considerable potential exist for greater application and use of existing PPP
knowledge products to build capacity and expertise. This may require an initial
investment in face-to-face promotion followed by proactive dissemination,
possibly with a local institute as a partner to overcome any language issues.
Key emerging conclusions and observations
Based on the above, our conclusions and observations on Vietnam include the need to:
• raise the maximum fast track project budget to US$100,000, but continue the
policy of tailored, opportunity driven support with phasing for the larger projects;
• assess the case for programmatic support to the regional PMU to strategically
address the more fragile and difficult areas within the region;
• consider small follow up projects to ensure capture of the DBL impact data
through surveys and appropriate dissemination;
• respond to emerging opportunities in pricing mechanisms and restructuring the
generation business of EVN;
• widen where possible and effective, the use of non-Bank TTLs and deepen co-
operation between development partners;
• improve the take up and application of existing PPIAF knowledge products
within country, via proactive promotion and partnership arrangements.