volume 1, chapter 8-2: nutrient relations: co2
TRANSCRIPT

Glime, J. M. 2017. Nutrient Relations: CO2. Chapt. 8-2. In: Glime, J. M. Bryophyte Ecology. Volume 1. Physiological Ecology. 8-2-1 Ebook sponsored by Michigan Technological University and the International Association of Bryologists. Last updated 17 July 2020 and available at <http://digitalcommons.mtu.edu/bryophyte-ecology/>.
CHAPTER 8-2
NUTRIENT RELATIONS: CO2
TABLE OF CONTENTS
CO2 Sources and Limitations .............................................................................................................................. 8-2-2 Early Carbon Relations ................................................................................................................................ 8-2-2 Relationships Today ..................................................................................................................................... 8-2-2 Structural Adaptations .......................................................................................................................... 8-2-6 Soil CO2 ....................................................................................................................................................... 8-2-6 CO2-Concentrating Mechanisms ......................................................................................................................... 8-2-7 Aquatic CO2 ...................................................................................................................................................... 8-2-10 Role of pH .................................................................................................................................................. 8-2-12 Bogs .................................................................................................................................................................. 8-2-12 Methane ..................................................................................................................................................... 8-2-14 CO2 and Desiccation Tolerance ........................................................................................................................ 8-2-14 Translocation ..................................................................................................................................................... 8-2-14 Importance of Bryophytes in C Cycling ............................................................................................................ 8-2-15 Summary ........................................................................................................................................................... 8-2-15 Acknowledgments ............................................................................................................................................. 8-2-15 Literature Cited ................................................................................................................................................. 8-2-15

8-2-2 Chapter 8-2: Nutrient Relations: CO2
CHAPTER 8-2
NUTRIENT RELATIONS: CO2
Figure 1. Peat moss, Sphagnum fimbriatum, covering the largest area of carbon sink in the world. Photo by Michael Lüth, with permission.
CO2 Sources and Limitations
Early Carbon Relations
Colonization of life on the land of Earth began billions of years ago (Graham et al. 2014). Evidence suggests that bacteria, then eukaryotic (having a nucleus) algae, then bryophytes ventured to endure those early conditions. These early forms made possible the development of the first organic soils. To understand this progression and continuation of life, it is prudent to understand carbon cycling. For most terrestrial plants and algae, the source of this carbon is carbon dioxide (CO2). Both green algae and bryophytes produce a degradation-resistant form of carbon from that CO2 that is consequently sequestered. This, in turn, reduces the CO2 in the atmosphere, having an important impact on the Earth's carbon cycle for 40-100 million years.
This early atmosphere was high in CO2 compared to levels today (Raven & Edwards 2014). Isotope comparisons using liverwort fossils indicate that in the mid-Cretaceous in the Antarctic, CO2 concentrations ranged 1000-1400 ppm, agreeing generally with
independent proxy data and long-term carbon cycle models (Fletcher et al. 2005). Furthermore, the concentration gradient from the atmosphere to the carboxylase in the plant would further drive CO2 into the plant (Raven & Edwards 2014). This additional CO2 would permit higher photosynthetic rates per surface area of plant. Later adaptations included increasing the surface area of photosynthetic tissue through development of complex structures and air spaces to permit greater harvesting of light.
Proctor (2010) suggested that in the early atmosphere of plant evolution in the mid-Palaeozoic, the atmosphere had 10X its present concentration of CO2. It is thus unlikely that these early plants were CO2 limited. Rather they may have increased their cuticularization, then increased their air spaces to permit them to take up more CO2 and compensate for the blockage by the cuticle.
Relationships Today
In 1958, the CO2 in the atmosphere had a concentration of 315 ppm (Scripps CO2 Program 2016). In December
Chapter 8-2: Nutrient Relations: CO2 8-2-3
2016 it had grown to 404 ppm. Elbert et al. (2012) estimated that cryptogams (including Cyanobacteria, algae, fungi, lichens, and bryophytes) extract ~3.9 Pg carbon per year, or around 7% of the net production of terrestrial vegetation. Thus, the CO2 uptake by bryophytes is an important component of global carbon cycling and a necessary contributor to climate modelling.
Normally we don't think of carbon as a limiting resource, although experiments on higher plants have shown that increased carbon dioxide usually increases productivity. Mosses are typically C3 plants with high CO2 compensation points (CO2 concentration at which net CO2 fixation is zero) (Raven et al. 1998). In other words, they require high levels of CO2 to balance the CO2 lost to respiration. C3 plants are those plants that have no special mechanism for storing carbon from CO2 temporarily in a compound such as malate or oxalate. Instead, they put all their CO2 directly into the photosynthetic pathway in a 3-carbon compound, hence the term C3. This pathway is less efficient because the enzyme Rubisco (Ribulose bisphosphate carboxylase/oxidase) is much less effective at binding the atmospheric CO2 into a 3-C compound within the cell than is PEP carboxylase, the enzyme used in the C4 and CAM pathways to put the carbon in temporary storage C4 compounds for later use in photosynthesis. However, mosses are not limited by guard cell closure in obtaining CO2 and thus should be able to obtain CO2 any time of the day.
In examining 32 terrestrial C3 plants, Bauer and
Martha (1981) found an average CO2 compensation point
of 36.2 μl L-1 (=71 mg m-3). However, among these two
mosses showed a somewhat higher CO2 compensation
point of ~43 μl L-1. The compensation point for
tracheophytes ranged 31-40 μl L-1. Bain and Proctor
(1980) found that the CO2 compensation point of the
aquatic bryophytes they studied were over 100 times higher
than those of the C3 aquatic tracheophyte Elodea and the
alga Chara. They were likewise somewhat higher than
those of terrestrial bryophytes reported by Dilks (1976).
Among tracheophytes, CAM plants, convert CO2 to malate at night and store it to be used in the daytime, permitting the plants to conserve water by keeping stomata closed in the daytime. In C4 plants a bundle sheath permits plants to convert CO2 to a 4-carbon compound for use later. This likewise permits the plants to conserve water by closing stomata when the air is dry but to continue using CO2 derived from the stored 4-C compounds for photosynthesis.
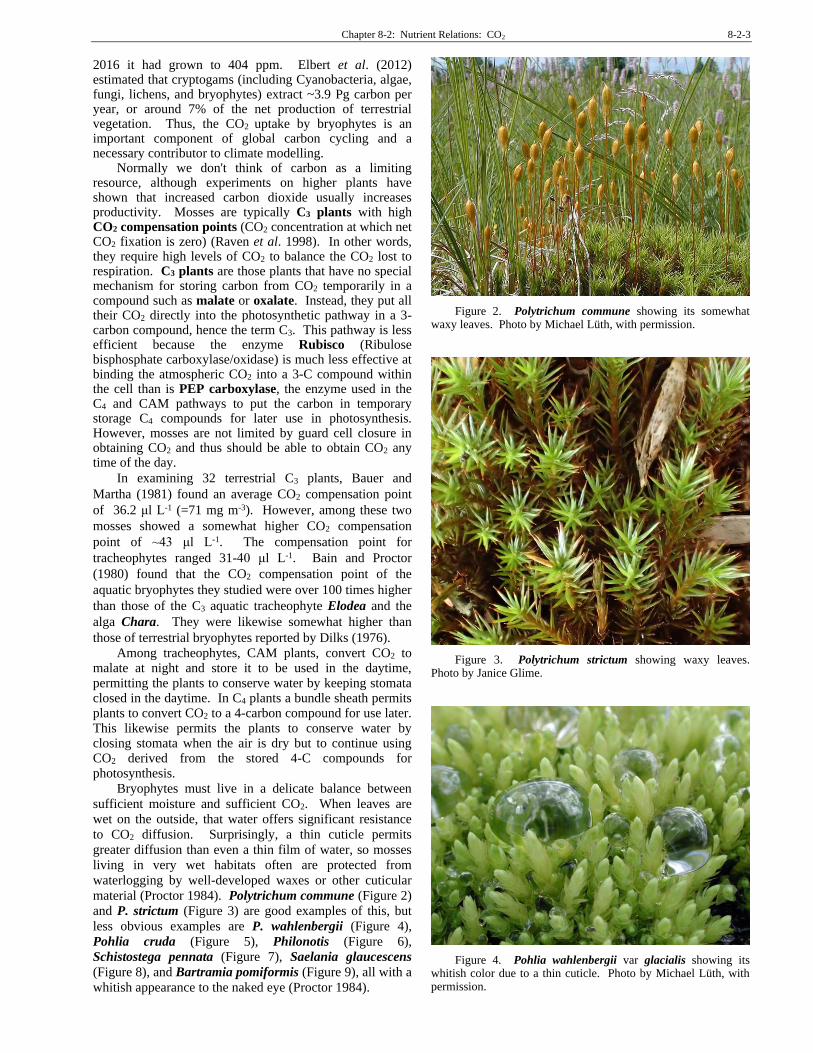
Bryophytes must live in a delicate balance between
sufficient moisture and sufficient CO2. When leaves are
wet on the outside, that water offers significant resistance
to CO2 diffusion. Surprisingly, a thin cuticle permits
greater diffusion than even a thin film of water, so mosses
living in very wet habitats often are protected from
waterlogging by well-developed waxes or other cuticular
material (Proctor 1984). Polytrichum commune (Figure 2)
and P. strictum (Figure 3) are good examples of this, but
less obvious examples are P. wahlenbergii (Figure 4),
Pohlia cruda (Figure 5), Philonotis (Figure 6),
Schistostega pennata (Figure 7), Saelania glaucescens
(Figure 8), and Bartramia pomiformis (Figure 9), all with a
whitish appearance to the naked eye (Proctor 1984).
Figure 2. Polytrichum commune showing its somewhat waxy leaves. Photo by Michael Lüth, with permission.
Figure 3. Polytrichum strictum showing waxy leaves. Photo by Janice Glime.
Figure 4. Pohlia wahlenbergii var glacialis showing its whitish color due to a thin cuticle. Photo by Michael Lüth, with permission.

8-2-4 Chapter 8-2: Nutrient Relations: CO2
Figure 5. Pohlia cruda showing its whitish color due to a thin cuticle. Photo by Michael Lüth, with permission.
Figure 6. Philonotis fontana showing its waxy leaves. Photo by Michael Lüth, with permission.
Figure 7. Schistostega pennata showing waxy leaf surface. Photo courtesy of Martine Lapointe.
Figure 8. Waxy-looking leaves of Saelania glaucescens. Photo by Ivanov, with permission.
Figure 9. Bartramia pomiformis showing waxy leaves. Photo by Jan-Peter Frahm, with permission.
Sphagnum (Figure 1) partially solves this balance by
having water-holding cells (hyaline cells) that bathe the
photosynthetic cells (Figure 10), while exposing at least
one surface (in most) of the photosynthetic cell to the
atmosphere. Furthermore, air bubbles become trapped
among the leaves and between the leaves and the stem, thus
providing an additional source of CO2. Robinson (1985)
considered that no CO2 was obtained from the hyaline
(water-holding) cells because all the chloroplasts of the
cells were positioned along the wall most exposed to light.
On the other hand, members of Leucobryum (Figure 11-
Figure 14) do indeed trap air bubbles in their colorless cells
(Robinson 1985), providing an internal source of CO2 for
the chlorophyllous cells residing there and causing these
plants to somewhat mimic the internal structure of a seed
plant. This same character seems to be present throughout
the Leucobryaceae family, permitting their multi-layered
leaves to function photosynthetically.

Chapter 8-2: Nutrient Relations: CO2 8-2-5
Figure 10. Sphagnum cells indicating the hyaline cells with pores, holding water, and chlorophyllose (photosynthetic) cells exposed to atmosphere. Photo with from Botany Website, UBC, with permission.
Figure 11. Leucobryum glaucum showing whitish color caused by hyaline cells that surround the photosynthetic cells. Photo by David T. Holyoak.
Figure 12. Leucobryum glaucum leaf cells in lamina view, showing hyaline and photosynthetic cells. Photo by Ralf Wagner <www.dr-ralf-wagner.de>.
Figure 13. Leucobryum glaucum leaf cross section showing the photosynthetic cells surrounded by hyaline cells. Photo by Ralf Wagner <www.dr-ralf-wagner.de>.
Figure 14. Whitish leaves due to hyaline cells of Leucobryum juniperoideum. Photo by Michael Lüth.
Shinde et al. (2015) determined that the moss Physcomitrella patens (Figure 15) has 814 genes that are affected by elevated CO2 (1500 ppmV). These affect transcriptional reprogramming, photosynthetic regulation, carbon metabolism, and stress responses. CO2 relationships are not simple!
Figure 15. Physcomitrella patens, demonstrating its whitish appearance due to a thin cuticle. Photo by Michael Lüth, with permission.

8-2-6 Chapter 8-2: Nutrient Relations: CO2
Structural Adaptations
Proctor (2010) explains that the maximum rate of CO2
diffusion is limited by the difference between the external
CO2 concentration and the CO2 compensation point (level
of O2 at which respiration = photosynthesis), as well as the
resistance of the moist external bryophyte cell wall to the
liquid-phase diffusion of the CO2. This is limited by the
thickness of the external cell walls. Structural differences
can increase the plant uptake. A large, simple thallose
liverwort provides a single flat photosynthetic surface.
This is improved in an epiphyte such as Metzgeria (Figure
16) that exposes both surfaces. Marchantia (Figure 17)
further increases the uptake surface by its system of
internal chambers with photosynthetic cells arranged like
tissues of a sponge (Figure 18).
Figure 16. Metzgeria furcata showing thalli exposed on both sides, thus doubling its CO2-absorbing surfaces. Photo by Michael Lüth, with permission.
Figure 17. Marchantia polymorpha pores and gemmae cups. Photo by Ralf Wagner <www.dr-ralf-wagner.de>, with permission.
Figure 18. Marchantia polymorpha cs showing pore and underlying spongy chlorophyllose cells. Photo by Walter Obermayer, with permission.
Perhaps the most obvious adaptation of plants to intake of CO2 is having stomata in leaves. This apparatus permits tracheophyte leaves to regulate moisture concentration in the leaves. However, when they are closed to conserve water, they are also closed to atmospheric CO2 that is vitally needed for photosynthesis. Mosses and leafy liverworts lack stomata in their leaves, but generally have leaves that are only one cell thick, thus exposing two sides of the cell for absorption of CO2. Some thallose liverworts, on the other hand, have a plant body that consists of multiple layers. These typically have a chambered interior with sponge-like tissues that provide lots of surface area. For these to obtain atmospheric CO2, the chambers connect to the exterior atmosphere through pores that permit its diffusion into the chamber. Raven (2002) suggested that "stomata evolved from pores in the epidermis of plant organs which were at least three cell layers thick and had intercellular gas spaces and a cuticle."
But does this sponge-like interior make a difference? Meyer et al. (2008) demonstrated that both external and internal conductances, as well as water use efficiency, were higher in the ventilated (spongy) liverworts and hornworts. Within these two taxonomic groups, however, the values were similar, suggesting that various factors must serve to optimize the involved species for that life form.
Soil CO2
Šimůnek and Suarez (1993) modelled the CO2 transport and production in soil. CO2 can be transported in the unsaturated zone in both the liquid and gas form. Both root and microbial respiration contribute to soil CO2. The rate of this respiration is affected by water content, temperature, growth, salinity, and plant and soil characteristics.
In a temperate rainforest of New Zealand, bryophytes form a nearly continuous cover (62%) on the forest floor, with a depth less than 30 mm (DeLucia et al. 2003). The CO2 was elevated relative to the atmosphere, presumably due to bacterial and fungal respiration. The net CO2 exchange was very dependent on water content. Although the CO2 uptake was quite variable, the annual net carbon uptake by the forest floor bryophytes was 103 g m-2, compared to annual loss of carbon from the forest floor (bryophyte and soil respiration) of -1010 g m-2. This

Chapter 8-2: Nutrient Relations: CO2 8-2-7
accounted for a reclamation of ~10% of the forest floor CO2 emitted by respiration.
Tarnawski et al. (1994) measured 24-hour changes in atmospheric CO2 concentrations within and above cryptogam stands in a New Zealand temperate rainforest. They found that CO2 levels within the forest exceeded those in the open by 30 ppm and had a more variable diel (denoting a period of 24 hours) pattern (up to 70 ppm). The mean CO2 level at a depth of 25 mm in the moss layer was 50% higher than those in the clearing and were higher than in the air of the rainforest.
In the Arctic tundra, there are definite differences in soil respiration rates related to microscale topography, mainly due to differences of soil water table and soil temperatures (Sommerkorn et al. 1999). The moss layer serves as a high impact modifier of the CO2 emission, assimilating 51% to 98% of the daily amount CO2 released from wet tundra soils.
For most forest floor mosses, the CO2 should be ample to supply the slow-growing mosses due to production of CO2 from litter decay. In the tropics, the CO2 concentrations on the forest floor are greater than those above the canopy (Holtum & Winter 2001), but that enriched supply is still limiting. At 10 cm above the soil the CO2 level is somewhat higher.
Because CO2 is often limiting, even in the terrestrial system, increasing levels of CO2 on the Earth could positively affect the bryophytes. Strain and Cure (1985) reported that the rate of photosynthesis in tracheophytes increases with a rise of atmospheric CO2. Because bryophytes are C3 plants, they are able to take advantage of high CO2 levels. The increased temperatures that accompany the higher CO2 through the greenhouse effect will cause greater below ground respiratory processes of roots, bacteria, and other organisms (Heal 1979; Silvola 1985). Bryophytes on the soil surface are the first photosynthetic organisms to have an opportunity to use this increased CO2. Csintalan et al. (1997) found a small, but significant increase in CO2 uptake in the drought-tolerant moss Syntrichia ruralis (Figure 19) when grown in a concentration of 700 ppm compared to that at the ambient level at that time of 350 ppm.
Figure 19. Syntrichia ruralis hydrated, a species that benefits from higher levels of CO2. Photo by Misha Ignatov, with permission.
Sonesson et al. (1992) were able to show that the boreal forest moss Hylocomium splendens (Figure 20-Figure 21) can adapt to higher ambient CO2 concentrations and utilize higher CO2. Increasing CO2 levels to 600 ppm (compared to 350 ppm), resulted in a significant increase in its photosynthesis and growth (Sonneson et al. 1996). Botting and Fredeen (2006) similarly showed that CO2 (430 ppm) was limiting to moss productivity on the sub-boreal forest floor in central British Columbia, Canada.
Figure 20. Hylocomium splendens showing its extensive cover in the boreal forest. Photo by Andrew Spink, with permission.
Figure 21. Hylocomium splendens, a species that can benefit from a higher CO2. Photo by Chmee through Creative Commons.
CO2-Concentrating Mechanisms
CO2-concentrating mechanisms are familiar in tracheophytes. In tracheophytes, allowing CO2 into the leaf through stomata means allowing water vapor out (Hanson et al. 2014). Even chloroplasts leak water as they allow CO2 in because both require the same pore size.
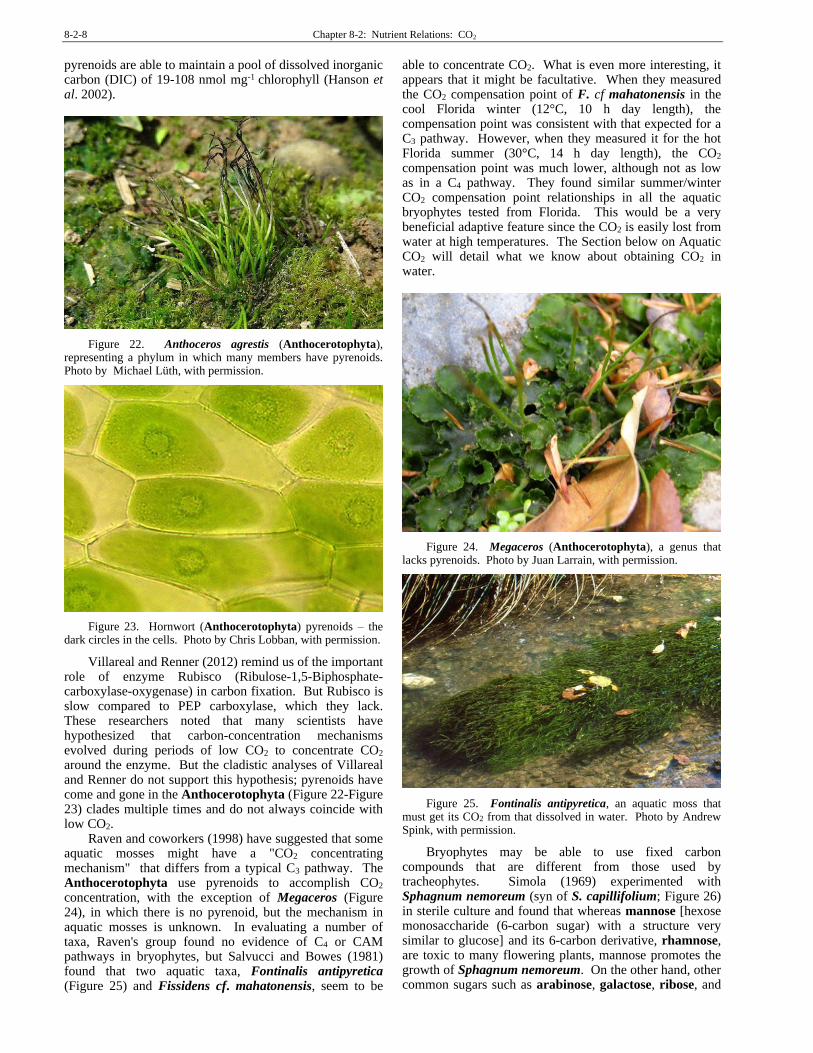
Bryophytes have neither of these carbon-storing mechanisms and it seems that all bryophytes are C3 plants. But it appears that at least some do have a means to concentrate CO2 (Meyer et al. 2008). Like members of the green algae, many hornworts (Anthocerotophyta; Figure 22-Figure 23) have pyrenoids (protein bodies in chloroplasts of some algae and hornworts) associated with the chloroplasts (Hanson et al. 2002, 2014). These
8-2-8 Chapter 8-2: Nutrient Relations: CO2
pyrenoids are able to maintain a pool of dissolved inorganic carbon (DIC) of 19-108 nmol mg-1 chlorophyll (Hanson et al. 2002).
Figure 22. Anthoceros agrestis (Anthocerotophyta), representing a phylum in which many members have pyrenoids. Photo by Michael Lüth, with permission.
Figure 23. Hornwort (Anthocerotophyta) pyrenoids – the dark circles in the cells. Photo by Chris Lobban, with permission.
Villareal and Renner (2012) remind us of the important role of enzyme Rubisco (Ribulose-1,5-Biphosphate-carboxylase-oxygenase) in carbon fixation. But Rubisco is slow compared to PEP carboxylase, which they lack. These researchers noted that many scientists have hypothesized that carbon-concentration mechanisms evolved during periods of low CO2 to concentrate CO2 around the enzyme. But the cladistic analyses of Villareal and Renner do not support this hypothesis; pyrenoids have come and gone in the Anthocerotophyta (Figure 22-Figure 23) clades multiple times and do not always coincide with low CO2.
Raven and coworkers (1998) have suggested that some aquatic mosses might have a "CO2 concentrating mechanism" that differs from a typical C3 pathway. The Anthocerotophyta use pyrenoids to accomplish CO2 concentration, with the exception of Megaceros (Figure 24), in which there is no pyrenoid, but the mechanism in aquatic mosses is unknown. In evaluating a number of taxa, Raven's group found no evidence of C4 or CAM pathways in bryophytes, but Salvucci and Bowes (1981) found that two aquatic taxa, Fontinalis antipyretica (Figure 25) and Fissidens cf. mahatonensis, seem to be
able to concentrate CO2. What is even more interesting, it appears that it might be facultative. When they measured the CO2 compensation point of F. cf mahatonensis in the cool Florida winter (12°C, 10 h day length), the compensation point was consistent with that expected for a C3 pathway. However, when they measured it for the hot Florida summer (30°C, 14 h day length), the CO2 compensation point was much lower, although not as low as in a C4 pathway. They found similar summer/winter CO2 compensation point relationships in all the aquatic bryophytes tested from Florida. This would be a very beneficial adaptive feature since the CO2 is easily lost from water at high temperatures. The Section below on Aquatic CO2 will detail what we know about obtaining CO2 in water.
Figure 24. Megaceros (Anthocerotophyta), a genus that lacks pyrenoids. Photo by Juan Larrain, with permission.
Figure 25. Fontinalis antipyretica, an aquatic moss that must get its CO2 from that dissolved in water. Photo by Andrew Spink, with permission.
Bryophytes may be able to use fixed carbon compounds that are different from those used by tracheophytes. Simola (1969) experimented with Sphagnum nemoreum (syn of S. capillifolium; Figure 26) in sterile culture and found that whereas mannose [hexose monosaccharide (6-carbon sugar) with a structure very similar to glucose] and its 6-carbon derivative, rhamnose, are toxic to many flowering plants, mannose promotes the growth of Sphagnum nemoreum. On the other hand, other common sugars such as arabinose, galactose, ribose, and

Chapter 8-2: Nutrient Relations: CO2 8-2-9
xylose are toxic to Sphagnum. While the literature is not as complete as that on tracheophytes, we know that at least Funaria hygrometrica (Figure 27) can use the sugars fructose, glucose, maltose, and sucrose as internal carbon compounds (Simola 1969).
Figure 26. Sphagnum capillifolium (nemoreum), a species for which mannose promotes growth. Photo by Bernd Haynold, through Creative Commons.
Figure 27. Funaria hygrometrica with young sporophytes, a species that can use the sugars fructose, glucose, maltose, and sucrose internally. Photo by Andrew Spink, with permission.
Further evidence of differences in carbon usage by Sphagnum come from studies on carbon isotope discrimination. In three species that occupy hollows (S. recurvum – Error! Reference source not found.), carpets (S. palustre – Figure 29), and hummocks (S. tenerum), the delta 13C values (indicating their ability to discriminate CO2 on the basis of the 12C or 13C isotope) ranged from 19.0 to 27.1, but were unrelated to species (Rice 2000). Rather, they differed significantly (p<0.001) with season. In the spring, discrimination was lower (mean 22.5), with the highest discrimination in winter (24.7). This difference was mainly due to low photosynthetic rates in winter that reduce the effects of diffusional resistance on carbon isotope discrimination. Microhabitat differences that were present in the field disappeared in the common garden and eliminated any doubt about species differences in ability to discriminate. The observed seasonal differences in carbon isotope discrimination appear to be different from those of
tracheophytes, where water limitation lowers chloroplastic demand and increases resistance to C uptake. In Sphagnum, water limitation lowers the chloroplastic demand but also decreases the resistance to C uptake, suggesting that the moss continues to incorporate carbon as it dries.
Figure 28. Sphagnum recurvum, a species of hollows. Photo by Tryon Life Community Farm, through Creative Commons.
Figure 29. Sphagnum palustre, a species of carpets. Photo by Bernd Haynold, through Wikimedia Commons.
Carbon isotope ratios have been used for dating all sorts of biological materials, including the age of peatlands. Using carbon isotope technology, MacDonald et al. (1987) found that peatland mosses consistently registered carbon ages that were considerably older than those of the macrofossils of the same layer. They found ages that ranged 1400 to 6400 years older than that of their contemporary tracheophytes, and even the live Drepanocladus crassicostatus had a 14C content that was only 85% that of other present-day taxa. They explained this moss phenomenon as an isotope exchange with older sediments, the formation of CO2 from bicarbonate by chemical processes, and the metabolic production of CO2, presumably including bacterial decomposition, especially by mycobacteria.

8-2-10 Chapter 8-2: Nutrient Relations: CO2
Aquatic CO2
In aquatic systems, CO2 is not very soluble, is easily lost to the atmosphere at warm temperatures, and availability is pH-dependent, so it can indeed be limiting. The diffusion coefficient for CO2 in water is only 10-4 times that found in air. The boundary layer between the moss and the flowing water reduces that availability even more. Aquatic bryophytes have high CO2 compensation points (> 50 µl L-1), higher than that of typical of C3 tracheophytes (Bain & Proctor 1980).
Raven et al. (1998) indicate that stream mosses such as Fontinalis antipyretica (Figure 25) have very little CO2 limitation because of the constantly flowing water that renews CO2 and the reduced boundary layer resulting from water flow. On the other hand, in deep, quiet water, this species has much more difficulty getting CO2, despite higher concentrations, due to the increased boundary layer surrounding the moss.
Unlike many aquatic tracheophytes, mosses are apparently unable to use bicarbonates as a source of CO2 (Bain & Proctor 1980; Allen & Spence 1981). Ruttner (1947) first demonstrated this limitation quantitatively in the mosses Calliergon giganteum (Figure 30), Cratoneuron filicinum (Figure 31), Eucladium verticillatum (Figure 32-Figure 33), Fissidens rufulus (Figure 34-Figure 35), Hylocomium splendens (Figure 20-Figure 21), and Neckera crispa (Figure 36) and the thallose liverwort Marchantia polymorpha (Figure 17), and Steeman Nielsen (1947) found the same in Fontinalis antipyretica (Figure 25), even though F. antipyretica has the enzyme carbonic anhydrase needed for the conversion of bicarbonate to CO2. Bain and Proctor (1980) further examined mosses from alkaline habitats, yet were unable to demonstrate any use at all of bicarbonates; Allen and Spence (1981) independently determined this once more for Fontinalis antipyretica.
Figure 30. Calliergon giganteum, a species that cannot use bicarbonate as a carbon source. Photo by Misha Ignatov, with permission.
Figure 31. Cratoneuron filicinum, a species that is unable to use bicarbonate as a carbon source. Photo by Barry Stewart, with permission.
Figure 32. Eucladium verticillatum in its wet habitat. Photo by Proyecto Musgo, through Creative Commons.
Figure 33. Eucladium verticillatum, a species that is unable to use bicarbonates as a carbon source. Photo by Barry Stewart, with permission.

Chapter 8-2: Nutrient Relations: CO2 8-2-11
Figure 34. Fissidens rufulus habitat. Photo by Michael Lüth, with permission.
Figure 35. Fissidens rufulus, a species that is unable to use bicarbonate as a carbon source. Photo by Michael Lüth, with permission.
Figure 36. Neckera crispa, a species that is unable to use bicarbonate as a carbon source. Photo by Barry Stewart, with permission.
Therefore, in aquatic systems at higher levels of pH,
when the CO2 equilibrium shifts toward bicarbonate or carbonate, CO2 becomes unavailable. In these conditions, perhaps the CO2 is transformed from bicarbonates in some taxa by lower pH values at the moss-water interface, but no experimental evidence has verified this hypothesis. Thus, the number of mosses growing in alkaline waters is limited, and it seems that many of the ones that do occur in alkaline
waters are adapted to growing in the highly aerated water of waterfalls and rapids, as, for example, Fissidens grandifrons (Figure 37) (pers. obs.). Some grow in very cold glacial meltwater in which more CO2 is soluble (Vitt et al. 1986). Others are restricted to the splash zone at the edge of the water, where CO2 is trapped as the water moves through the air, as in Cratoneuron (Figure 38) species (Vitt et al. 1986; Glime & Vitt 1987).
Figure 37. Fissidens grandifrons, in fast-flowing water where there is more CO2 than in quiet water. Photo by Janice Glime.
Figure 38. Cratoneuron commutatum var fluctuans at the edge of water. Photo by Michael Lüth, with permission.
When mosses live at great depths, light and
temperature can be low. The ability of mosses to grow slowly reduces their need for CO2 and light. In great depths of Lake Grane Langos, Denmark, Sphagnum subsecundum (Figure 39) and Drepanocladus exannulatus (Figure 40) grew faster in deep water than in shallow water! (Riis & Sand-Jensen 1997). Riis and Sand-Jensen concluded that this more rapid growth at greater depths was possible due to lower temperatures that permitted more CO2 to remain dissolved, CO2 supersaturation, and nutrient enrichment from the sediments below the thermocline.

8-2-12 Chapter 8-2: Nutrient Relations: CO2
Figure 39. Sphagnum subsecundum, a species that takes advantage of CO2 supersaturation in deep water. Photo by Michael Lüth, with permission.
Figure 40. Drepanocladus exnnulatus, a species that takes advantage of CO2 supersaturation in deep water. Photo by Michael Lüth, with permission.
Role of pH
In the aquatic system, pH is important in determining the chemical fate of the CO2. Under acidic conditions, it remains dissolved as CO2. But if the water is warm, the CO2 gas is easily lost to the atmosphere.
At circum-neutral pH levels, the CO2 in water is converted to bicarbonate. At least some tracheophytes are able to use bicarbonates, but studies on use by bryophytes are ambiguous. In basic waters, carbonates are formed and cannot be used by any of the plants.
In situations of higher pH, CO2 can be present for a short time as it is released from sediments or trapped in turbulent water (Lovalvo et al. 2010). Bryophytes could take advantage of these ephemeral concentrations before they are converted to unusable forms.
Within the cell, the enzyme carbonic anhydrase converts bicarbonates to CO2 in both bryophytes and tracheophytes (Steeman Nielsen & Kristiansen 1949; Arancibia & Graham 2003). Some tracheophytes use extracellular carbonic anhydrase to convert bicarbonates to free CO2 (Allen & Spence 1981). There is no direct evidence that bryophytes can use bicarbonates (James 1928; Ruttner 1947; Steeman Nielsen 1947; Bain & Proctor 1980; Allen & Spence 1981; Osmond et al. 1981; Glime & Vitt 1984; Prins & Elzenga 1989; Madsen et al. 1993; Ballesteros et al. 1998; Raven et al. 1998); nevertheless,
some bryophytes are able to live in the pH range of bicarbonates. I have an unconfirmed suspicion that bryophytes may convert limited amounts of bicarbonate to CO2 at the leaf surface, perhaps by the presence of H+ released from exchange sites.
To further complicate the story, Farmer et al. (1986) found that the aquatic moss Fontinalis antipyretica (Figure 25) has no PEP carboxylase and uses only Rubisco for its fixation of CO2 in photosynthesis, supporting the earlier conclusion of Steeman Nielsen (1947) that F. antipyretica cannot use bicarbonates from the water for its photosynthesis. Nevertheless, Harder (1921) had already shown that F. antipyretica increased its net assimilation from 0.01 to 0.64% when bicarbonate concentration was raised from 0.66 to 3.14 as HCO3
-. Later, Burr (1941) likewise demonstrated greater productivity in this species in water with more bicarbonate than in that with CO2. Steeman Nielsen and Kristiansen (1949) offered a possible explanation – that CO2 might enter photosynthetic reactions in its hydrated form, i.e. as bicarbonate.
Bain and Proctor (1980) found that of the 20 aquatic species tested from a variety of habitats, all but the hornwort Anthoceros husnotii with pyrenoids had pH compensation points in the range expected for CO2-dependent C3 plants. Nevertheless, many studies support the concept that all aquatic mosses are C3 plants (Ruttner 1947; Allen & Spence 1981; Osmond et al. 1981; Salvucci & Bowes 1981; Raven 1991; Raven et al. 1987, 1994, 1998), despite some living in conditions that have CO2 concentrations below the expected CO2 compensation point.
Peñuelas (1985) demonstrated what appeared to be use of NaHCO3 (sodium bicarbonate) by Fontinalis antipyretica (Figure 25) as a carbon source. During photosynthesis by this species, the pH increased to 9.6, indicating a CO2 compensation point of 1.1 mM m-3 CO2. This photosynthetic rate was higher than could be explained by CO2 alone and when HCO3
- levels were increased, the photosynthetic rate likewise increased, even though CO2 levels in the water were held constant. In fact, photosynthesis continued until the pH reached 11.8-12.0 for F. antipyretica and 10.10 for the alkaline-tolerant Fissidens grandifrons (Figure 37). But to further confuse the issue, in a different stream, Peñuelas found that F. antipyretica could not use HCO3
- to photosynthesize, suggesting either different physiological races or different acclimation to conditions. We know that there are genetic differences among populations of this highly variable species (Shaw & Allen 2000). Even if these genetic differences are expressed as a physiological mechanism to use bicarbonate, we still do not understand what that mechanism might be!
Bogs
Hummocks present unique habitats, and their CO2 relations are no exception. Rydin and Clymo (1989) described their upper parts as obtaining CO2 from air rather than water between the Sphagnum (Figure 26) plants, depending on high CO2 concentrations in the acrotelm (living layer of peat) water. In fact, they found that the CO2 concentration in that layer was twice that in the outside atmosphere (Rydin & Clymo 1989; Smolders et al. 2001).

Chapter 8-2: Nutrient Relations: CO2 8-2-13
As the atmospheric levels of CO2 rise and N deposition provides critical and often limiting nutrients, the composition of plant communities changes. This is particularly true in Sphagnum (Figure 41-Figure 46) bogs (Berendse et al. 2001). In this case, we expect productivity of tracheophytes to increase as they benefit from greater CO2, often decreasing the competitiveness of the bryophytes and causing tracheophyte expansion. Sphagnum is one of the most important groups of plants to serve as a carbon sink in the Northern Hemisphere, facilitated by its slow decomposition. But when Berendse and coworkers studied the effects of raised CO2 and N on Sphagnum and other plants in four locations in Western Europe, the elevated CO2 had no effect on Sphagnum biomass increase. N, on the other hand, caused a decrease in Sphagnum growth due to competition.
In a bog in the Netherlands, Sphagnum magellanicum (Figure 41) benefitted from elevated CO2 by exhibiting increased growth in height in the second and third growing seasons (Heijmans et al. 2001). Tracheophytes that grew close to the more rapidly growing S. magellanicum were affected negatively by the increased Sphagnum height. Mitchell et al. (2002) found that on one harvested peatland the initial colonizer was Polytrichum strictum (Figure 3). Under a treatment of added CO2 (560 ppm), the later colonizer Sphagnum fallax (Figure 42) was able to successfully compete with the P. strictum.
Figure 41. Sphagnum magellanicum, a species that increases in height growth when living in higher CO2 levels. Photo by David Holyoak, with permission.
Figure 42. Sphagnum fallax, a species that competes better in an atmosphere with higher CO2. Photo by Michael Lüth, with permission.
Van der Heijden et al. (2000a) found that not all Sphagnum had the same response to elevated CO2. Sphagnum papillosum (Figure 43), an oligo-mesotrophic species, benefitted in growth from elevated CO2 (720 ppm). On the other hand, the ombrotrophic S. balticum (Figure 44) received no growth benefit, despite elevated sugar in stems and capitula in both species. Unlike many of the studies discussed in subchapter 8-1, in this case additional N along with elevated CO2 benefitted S. papillosum, but it had no effect on S. balticum. Doubling CO2 without N addition cause lower N levels in both species.
Figure 43. Sphagnum papillosum with sundew. Photo by Michael Lüth.
Figure 44. Sphagnum balticum, a species that does not benefit when additional N accompanies elevated CO2. Photo by Michael Lüth, with permission.
The response of Sphagnum recurvum var. mucronatum (Figure 45) may explain the elevated sugars (van der Heijden et al. 2000b). Initially, elevated CO2 stimulated photosynthesis, but after 3 days of exposure it was down-regulated to pre-elevation values. However, the elevated CO2 continued to cause reduced dark respiration. At the same time there was a continuous increase in soluble sugar in the capitula. Doubling the CO2 caused a decrease of N in the capitula, but not in the stems. This N reduction was coupled with a decrease in amino acids but did not affect soluble protein levels, causing a shift in N partitioning.

8-2-14 Chapter 8-2: Nutrient Relations: CO2
Figure 45. Sphagnum recurvum var mucronatum, a species that stores elevated sugars when the CO2 is elevated. Photo by Jan-Peter Frahm, with permission.
Not all Sphagnum grows in hummocks. Sphagnum cuspidatum (Figure 46) grows primarily submersed. When it was subjected to added CO2 for 12 weeks, only the highest CO2 concentration in the water caused increased growth in length and biomass (Paffen & Roelefs 1991).
Figure 46. Sphagnum cuspidatum, a submersed moss that is indifferent to added CO2 until the levels are quite high. Photo by Michael Lüth, with permission.
In addition, some bryophytes may be able to tap into a source of carbon we usually don't consider in bryophytes. Rydin and Clymo (1989) have demonstrated that at least in Sphagnum the fixed carbon can be transported within the stem. Using 14C labelling on Sphagnum papillosum (Figure 43), they found almost the entire alcohol-soluble fraction moved from older parts to the apex, with little transfer of the insoluble fraction.
Methane
Methane (CH4) is the product of anaerobic (no oxygen) bacterial breakdown. In several bogs of Canada, the highest emissions occurred in raised-bog and patterned-poor-fen pools where the peat is degrading (Bubier 1995). Methane is much more effective as a greenhouse gas compared to CO2. And wetlands are the largest natural source for methane. Submerged Sphagnum (Figure 46) uses methane that is converted through symbiosis with partly endophytic methanotrophic (able to gain carbon
from methane) bacteria, leading to highly effective in situ methane recycling (Raghoebarsing et al. 2005). These bacteria live in the hyaline cells and on leaves where they convert the methane to CO2. This conversion provides 10-15% of the carbon source for these Sphagnum species.
CO2 and Desiccation Tolerance
Syntrichia ruralis (Figure 19) is a common desiccation-tolerant moss. When subjected to elevated CO2 it showed increased net CO2 uptake in high CO2 conditions by more than 30% (Tuba et al 1998). Both desiccation-tolerant and non-tolerant plants, bryophytes included, show initial positive responses of photosynthesis to elevated CO2, but both groups exhibit reduced or even reversed photosynthetic rates in the longer term (Tuba et al. 1999). This slightly later study implies that increased CO2 levels will have little advantage for either group of bryophytes.
Translocation
Rydin and Clymo (1989) found that carbon is transported within Sphagnum (Figure 45) plants. This could provide a physiological mechanism that moves older carbon compounds from deeper parts of the peatlands upward. This could dilute the 14C pool within the living plant and change both the location and the proportions of 12C, 13C, and 14C. If Sphagnum is able to take in carbon from deep sediments and move it upward in the water column, this would result in false readings for carbon dating. Might the moss be preferentially moving 12C upward from older peat and thus reducing its proportion of 14C? If so, we need to re-evaluate our methods for dating peat.
By contrast, it appears that mosses like Grimmia (Figure 47) that receive their water from above can actually move carbon as photosynthate from the tip of the plant to the base and even to underground parts, much as we would find in a tree (Alpert 1989). Lacking any specialized conducting cells, this moss presents a puzzle as to its mechanism of movement, although as we shall see later in this chapter, it uses the source-sink principle used by tracheophytes.
Figure 47. Grimmia caespiticia, a moss that moves photosynthetic carbon from the tip to the base. Photo by Michael Lüth, with permission.

Chapter 8-2: Nutrient Relations: CO2 8-2-15
Importance of Bryophytes in C Cycling
Porada et al. (2013) estimated that the terrestrial net uptake of carbon by bryophytes and lichens is 0.34 to 3.3 Gt yr-1. This appears to be small until you consider bogs and Arctic habitats where bryophytes dominate the vegetation. In those location, the bryophytes are significant carbon sinks.
Summary
The early atmosphere had considerably more CO2 than the current one. However, in the last 60 years, CO2 concentrations have risen from 315 to 404 ppm in the atmosphere.
Soils release CO2 through respiration by bacteria, fungi, and other soil organisms. Bryophytes are able to trap much of this CO2 before it reaches the atmosphere.
Thallose liverworts may have a spongy interior with pores to facilitate exposure of internal photosynthetic cells to CO2. Mosses are C3 plants that benefit from high CO2 concentrations and cool to moderate temperatures (up to 25ºC). They have difficulty obtaining CO2 when they are wet and the presence of cuticular waxes in species such as Polytrichum spp. and Saelania glaucescens facilitates the absorption of CO2 by repelling water. Sphagnum keeps its photosynthetic cells moist on 2-3 sides while permitting 1-2 sides to be exposed to the atmosphere.
Hornworts may have pyrenoids that concentrate CO2 around the enzyme Rubisco, facilitating photosynthesis. Some aquatic mosses may be able to concentrate CO2 and this may be facultative, being enhanced on hot days. In acid conditions they use CO2 dissolved in the water, but some evidence suggests that in the mid-pH range some species may be able to use bicarbonates.
Some bryophytes can use amino acids. At least some Sphagnum species use methane as a carbon source. And some species can move C up or down within the plant.
Bryophytes, especially in wet habitats, may be able to move water up from sediments, taking advantage of decompositional carbon. Others may move photosynthate from actively growing apical parts to lower parts for storage.
Bryophytes may serve as carbon sinks, especially in peatlands.
Acknowledgments
I appreciate the contributions of undergraduate Phil Gaudette and M. S. student Jennifer Jermalowicz Jones for their critical reading of the manuscript from the perspectives of students interested in nutrient relationships of bryophytes. Stephen Rice helped to clarify the carbon discussion.
Literature Cited Allen, E. D. and Spence, D. H. N. 1981. The differential ability
of aquatic plants to utilize the inorganic carbon supply in fresh waters. New Phytol. 87: 269-283.
Alpert, P. 1989. Translocation in the nonpolytrichaceous moss Grimmia laevigata. Amer. J. Bot. 76: 1524-1529.
Arancibia, P. and Graham, L. 2003. Carbonic anhydrase in Charophyceae and bryophytes. Abstract, p. 65. Botany 2003, Aquatic and Wetland Plants: Wet & Wild, Botanical Society of America, Mobile.
Bain, J. T. and Proctor, M. C. F. 1980. The requirement of aquatic bryophytes for free CO2 as an inorganic carbon source: Some experimental evidence. New Phytol. 86: 393-400.
Ballesteros, D., García-Sánchez, M. J., Heredia, M. A., Felle, H., and Fernández, J. A. 1998. Inorganic carbon acquisition in Riccia fluitans L. J. Exper. Bot. 49: 1741-1747.
Berendse, F., Breemen, N. van, Rydin, H., Buttler, A., Heijmans, M., Hoosbeek, M. R., Lee, J. A., Mitchell, E., Saarinen, T., Vasander, H., and Wallen, B. 2001. Raised atmospheric CO2 levels and increased N deposition cause shifts in plant species composition and production in Sphagnum bogs. Global Change Biology 7: 591-598.
Botting, R. S. and Fredeen, A. L. 2006. Net ecosystem CO2
exchange for moss and lichen dominated forest floors of old-growth sub-boreal spruce forests in central British Columbia, Canada. Forest Ecol. Mgmt. 235: 240-251.
Bubier, J. L. 1995. The relationship of vegetation to methane emission and hydrochemical gradients in northern peatlands. J. Ecol. 83: 403-420.
Burr, G. O. 1941. Photosynthesis of algae and other aquatic plants. In: Needham, J. G. Symposium on Hydrobiology, pp 163-181. Univ Wisc Press, Madison.
Csintalan, Z., Takács, A., Tuba, Z., Proctor, M. C. F., Smirnoff, N., and Grace, J. 1997. Desiccation tolerant grassland cryptogams, under elevated CO2, preliminary findings. Abstr. Biol. 21: 309-315.
DeLucia, E. H., Turnbull, M. H., Walcroft, A. S., Griffins, K. L., Tissue, D. T., Glenny, D., McSeveny, T. M., and Whitehead, D. 2003. The contribution of bryophytes to the carbon exchange for a temperate rainforest. Global Change Biol. 9: 1158-1170.
Dilks, T. J. K. 1976. Measurement of the carbon dioxide compensation point and rate of loss of 14CO2 in the light and dark in some bryophytes. J. Exper. Bot. 27: 98-104.
Elbert, W., Weber, B., Burrows, S., Steinkamp, J., Jüdel, B., Meinrat, O. A., and Pöschl, L. 2012. Contribution of cryptogamic covers to the global cycles of carbon and nitrogen. Nat. Geosci. 5: 459-462.
Farmer, A. M., Maberly, S. C., and Bowes, G. 1986. Activities of carboxylation enzymes in freshwater macrophytes. J. Exper. Bot. 37: 1568-1573.
Fletcher, B. J., Beerling, D. J., and Brentnall, S. J. 2005. Fossil bryophytes as recorders of ancient CO2 levels: Experimental evidence and a Cretaceous case study. Global Biogeochem. Cycles 19: GB2012.
Glime, J. M. and Vitt, D. H. 1984. The physiological adaptations of aquatic Musci. Lindbergia 10: 41-52.
Glime, J. M. and Vitt, D. H. 1987. A comparison of bryophyte species diversity and niche structure of montane streams and stream banks. Can. J. Bot. 65: 1824-1837.
Graham, L., Lewis, L. A., Taylor, W., Wellman, C., and Cook, M. 2014. Early terrestrialization: Transition from algal to bryophyte grade. In: Hanson, D. T. and Rice, S. K. (eds.). Photosynthesis in Bryophytes and Early Land Plants. Advances in Photosynthesis and Respiration 37: 9-28.
Hanson, D., Andrews, T. J., and Badger, M. R. 2002. Variability of the pyrenoid-based CO2 concentrating mechanism in

8-2-16 Chapter 8-2: Nutrient Relations: CO2
hornworts (Anthocerotophyta). Funct. Plant Biol. 29: 407-416.
Hanson, D. T., Renzaglia, K., and Villarreal, J. C. 2014. In tracheophytes, Diffusion limitation and CO2 concentrating mechanisms in bryophytes. In: Hanson, D. T. and Rice, S. K. (eds.). Photosynthesis in Bryophytes and Early Land Plants. Advances in Photosynthesis and Respiration 37: 95-111.
Harder, R. 1921. Kritische Versuche zu Blackmans Theorie der begrenzenden Faktoren bei der Kohlensaureassimilation. Jahrb. Wiss. Bot. 60: 531-571.
Heal, O. W. 1979. The decomposition and nutrient release in even-aged plantations. In: Ford, E. D., Malcolm, D. C, and Atterson, J. (eds.). The Ecology of Even-aged Forest Plantations. Institute of Terrestrial Ecology, Cambridge, pp. 257-291.
Heijden, E. van der, Jauiananen, J., Silvola, J., Vasanden, H., and Kuiper, R. J. P. 2000a. Effects of elevated atmospheric CO2 concentration and increased nitrogen deposition on growth and chemical composition of ombrotrophic Sphagnum balticum and oligo-mesotrophic Sphagnum papillosum. J. Bryol. 22: 175-182.
Heijden, E. van der, Verbeek, S. K., and Kuiper, R. J. P. 2000b. Elevated atmospheric CO2 and increased nitrogen deposition: Effects of C and N metabolism and growth of the peat moss Sphagnum recurvum P. Beauv. var. mucronatum (Russ.) Warnst. Global Change Biol. 6: 201-212.
Heijmans, M. M. P. D., Berendse, F., Arp, W. J., Maaseliuk, A. K., Klees, H., Visser, W. De, and Breeman, N. van. 2001. Effects of elevated carbon dioxide and increased nitrogen deposition on bog vegetation in the Netherlands. J. Ecol. 89: 269-279.
Holtum, J. A. M. and Winter, K. 2001. Are plants growing close to the floors of tropical forests exposed to markedly elevated concentrations of carbon dioxide? Austral. J. Bot. 49: 629-636.
James, W. O. 1928. Experimental researches on vegetable assimilation and respiration. XIX. The effect of variations of carbon dioxide supply upon the rate of assimilation of submerged water plants. Proc. Royal Soc. London Ser B 103: 1-42.
Lovalvo, D., Clingenpeel, S. R., McGinnis, S, Macur, R. E., Varley, J. D., Inskeep, W. P., Glime, J., Nealson, K., and McDermott, T. R. 2010. A geothermal-linked biological oasis in Yellowstone Lake, Yellowstone National Park, Wyoming. Geobiology 8: 327-336.
MacDonald, G. M., Beukens, R. P., Kieser, W. E., and Vitt, D. H. 1987. Comparative radiocarbon dating of terrestrial plant macrofossils and aquatic moss from the "ice-free corridor" of western Canada. Geology 15: 837-840.
Madsen, T. V., Enevoldsen, H. O., and Jorgensen, T. B. 1993. Effects of water velocity on photosynthesis and dark respiration in submerged stream macrophytes. Plant Cell Environ. 16: 317-322.
Meyer, M., Seibt, U., and Griffiths, H. 2008. To concentrate or ventilate? Carbon acquisition, isotope discrimination and physiological ecology of early land plant life. Philosoph. Trans. Royal Soc. B-Biol. Sci. 363: 2767-2778.
Mitchell, E. A., Buttler, A., Grosvernier, P., Rydin, H., Siegenthaler, A., and Gobat, J. M. 2002. Contrasted effects of increased N and CO2 supply on two keystone species in peatland restoration and implications for global change. J. Ecol. 90: 529-533.
Osmond, C. B., Valanne, N., Haslam, S. M., Votila, P., and Roksandic, Z. 1981. Comparisons of δ13C values in leaves
of aquatic macrophytes from different habitats in Britain and Finland: Some implications for photosynthetic processes in aquatic plants. Oecologia 50: 117-124.
Paffen, B. G. P. and Roelefs, J. G. M. 1991. Impact of carbon dioxide and ammonium on the growth of submerged Sphagnum cuspidatum. Aquat. Bot. 40: 61-71.
Peñuelas, J. 1985. HCO3- as an exogenous carbon source for
aquatic bryophytes Fontinalis antipyretica and Fissidens grandifrons. J. Exper. Bot. 36: 441-448.
Porada, P., Weber, B., Elbert, W., Pöschl, U., and Kleidon, A. 2013. Estimating global carbon uptake by lichens and bryophytes with a process-based model. Biogeosciences 10: 6989-7033.
Prins, H. B. A. and Elzenga, J.T .M 1989. Bicarbonate utilization: Function and mechanism. Aquat. Bot. 34: 59-83.
Proctor, M. C. F. 1984. Structure and ecological adaptation. In: Dyer, A. F. and Duckett, J. G. (eds.). The Experimental Biology of Bryophytes. Academic Press, London, pp 9-37.
Proctor, M. C. F. 2010. Trait correlations in bryophytes: Exploring an alternative world. New Phytol. 185: 1-3.
Raghoebarsing, A. A., Smolders, A. J., Schmid, M. C., Rijpstra, W. I. C., Wolters-Arts, M., Derksen, J., Jetten, M. S. M., Schouten, S., Damste, J. S. S., Lamers, L. P. M., Toelofs, J. G. M., Camp, H. J. M. Op den, and Strous, M. 2005. Methanotrophic symbionts provide carbon for photosynthesis in peat bogs. Nature 436: 1153-1156.
Raven, J. A. 1991. Implications of inorganic carbon utilization: Ecology, evolution, and geochemistry. Can. J. Bot. 69: 908-924.
Raven, J. A. 2002. Selection pressures on stomatal evolution. New Phytol. 153: 371-386.
Raven, J. A. and Edwards, D. 2014. Photosynthesis in early land plants: Adapting to the terrestrial environment. In: Hanson, D. T. and Rice, S. K. (eds.). Photosynthesis in Bryophytes and Early Land Plants. Advances in Photosynthesis and Respiration 37: 9-28.
Raven, J. A., MacFarlane, J. J., and Griffiths, H 1987. The application of carbon isotope techniques. In: Crawford R. M. M. (ed.). Plant Life in Aquatic and Amphibious Habitats, pp 129-144. British Ecological Society Special Symposium, Blackwell, Oxford.
Raven, J. A., Johnson, A. M., Newman, J. R., and Scrimgeour, C. M. 1994. Inorganic carbon acquisition by aquatic photolithotrophs of the Dighty Burn, Angus, UK: Uses and limitations of natural abundance measurements of carbon isotopes. New Phytol. 127: 271-286.
Raven, J. A., Griffiths, H., Smith, E. C., and Vaughn, K. C. 1998. New perspectives in the biophysics and physiology of bryophytes. In: Bates, J. W., Ashton, N. W., and Duckett, J. G. (eds.). Bryology in the Twenty-first Century. Maney Publishing and the British Bryological Society, UK, pp. 261-275.
Rice, S. K. 2000. Variation in carbon isotope discrimination within and among Sphagnum species in a temperate wetland. Oecologia 123: 1-8.
Riis, T. and Sand-Jensen, K. 1997. Growth reconstruction and photosynthesis of aquatic mosses: Influence of light, temperature and carbon dioxide at depth. J. Ecol. 85: 359-372.
Robinson, H. 1985. The structure and significance of the leucobryaceous leaf. Monogr. Syst. Bot. Missouri Bot. Gard. 11: 111-120.
Ruttner, F. 1947. Zur Frage der Karbonatassimilation der Wasserpflanzen, I. Österr. Bot. Zeits. 94: 265-294.

Chapter 8-2: Nutrient Relations: CO2 8-2-17
Rydin, H. and Clymo, R. S. 1989. Transport of carbon and phosphorus compounds about Sphagnum. Proc. Roy. Soc. London B 237: 63-84.
Salvucci, M. E. and Bowes, G. 1981. Induction of reduced photorespiration activity in submersed and amphibious aquatic macrophytes. Plant Physiol. 67: 335-340.
Scripps CO2 Program 2016. Accessed 19 January 2017 at <http://scrippsco2.ucsd.edu/research/atmospheric_co2>
Shaw, A. J. and Allen, B. 2000. Phylogenetic relationships, morphological incongruence, and geographic speciation in the Fontinalaceae (Bryophyta). Molec. Phylog. Evol. 16: 225-237
Shinde, S., Behpouri, A., McElwain, J. C., and Ng, C. K.-Y. 2015. Genome-wide transcriptomic analysis of the effects of sub-ambient oxygen and elevated atmospheric carbon dioxide levels on gametophytes of the moss, Physcomitrella patens. J. Exper. Bot. 66: 4001-4012.
Silvola, J. 1985. CO2 dependence of photosynthesis in certain forest and peat mosses and simulated photosynthesis at various actual and hypothetical CO2 concentrations. Lindbergia 11: 86-93.
Simola, L. K. 1969. The effect of various mono- and disaccharides on the growth of Sphagnum nemoreum thalli in sterile cultures. Physiol. Plant. 22: 1079-1084.
Šimůnek, J. and Suarez, D. L. 1993. Carbon dioxide transport and production in soil. 1. Model development. Water Res. Res. 29: 487-497.
Smolders, A. J. P., Tomasson, H. B. H., Pijnappel, H. W., Lamers, L. P. H., and Roelefs, J. G. M. 2001. Substrate derived CO2 is important in the development of Sphagnum spp. New Phytol. 152: 325-332.
Sommerkorn, M., Bõlter, M., and Kappen, L. 1999. Carbon dioxide fluxes of soils and mosses in wet tundra of Taimyr Peninsula, Siberia: Controlling factors and contribution of net system fluxes of CO2 from soil respiration and moss respiration. Polar Res. 18: 253-260.
Sonesson, M., Carola, G., and Martin, T. 1992. CO2
environment, microclimate and photosynthetic characteristics of the moss Hylocomium splendens in a subarctic habitat. Oecologia 92: 23-29.
Sonneson, M., Callaghan, T. V., and Carlson, B. Å. 1996. Effect of enhanced ultraviolet radiation and carbon dioxide concentration on the moss Hylocomium splendens. Global Change Biol. 2: 67-73.
Steeman Nielsen, E. 1947. Photosynthesis of aquatic plants with special reference to the carbon sources. Dansk Bot. Ark. 12: 5-71.
Steeman Nielsen, E. and Kristiansen, J. 1949. Carbonic anhydrase in submersed autotrophic plants. Physiol. Plant. 2: 325-331.
Strain, B. R., and Cure, J. D. (eds.). 1985. Direct effects on increasing carbon dioxide on vegetation. U. S. Dept. of Energy, Office of Energy Research, Durham, N.C.
Tarnawski, M. G., Green, T. G. A., Buedel, B., Meyer, A., Zellner, J., and Lange, O. L. 1994. Diel changes of atmospheric CO2 concentrations within, and above, cryptogam stands in a New Zealand temperate rainforest. N. Z. J. Bot. 32: 329-336.
Tuba, Z., Csintalen, Z., Szente, K., Nagy, Z., and Grace, J. 1998. Carbon gains by desiccation-tolerant plants at elevated CO2. Funct. Ecol. 12: 39-44.
Tuba, Z., Proctor, M. C. F., and Takács, Z. 1999. Desiccation-tolerant plants under elevated air CO2: A review. Zeit. Natur. 54c: 788-796.
Villarreal, J. C. and Renner, S. S. 2012. Hornwort pyrenoids, carbon-concentrating structures, evolved and were lost at least five times during the last 100 million years. Proc. Natl. Acad. Sci.109: 18873-18878.
Vitt, D. H., Glime, J. M., and LaFarge-England, C. 1986. Bryophyte vegetation and habitat gradients of montane streams in western Canada. Hikobia 9: 367-385.

8-2-18 Chapter 8-2: Nutrient Relations: CO2