volume 11 number issn 1996 - 0794 food science
TRANSCRIPT

African Journal of
Food Science
Volume 11 Number 12, December 2017 ISSN 1996-0794

ABOUT AJFS The African Journal of Food Science (AJFS) (ISSN 1996-0794) is published monthly (one volume per year) by Academic Journals.
African Journal of Food Science (AJFS) provides rapid publication of articles in all areas of Food Science such as Sensory analysis, Molecular gastronomy, Food safety, Food technology etc. The Journal welcomes the submission of manuscripts that meet the general criteria of significance and sc ientific excellence. Papers will be published shortly after acceptance. All articles published in AJFS are peer-reviewed.
Contact Us Editorial Office: [email protected]
Help Desk: [email protected]
Website: http://academicjournals.org/AJFS
Submit manuscript online http://ms.academicjournals.me/

Editors Dr. Hu Xiao-Qing
Thaddeus Chukwuemeka Ezeji Ohio State University and Ohio State Agricultural and Development Center (OARDC) Department of Animal Sciences 1680 Madison Avenue Wooster, Ohio 44691 USA.
Prof. Kofi E. Aidoo Department of Biological and Biomedical Sciences Glasgow Caledonian University Cowcadden Road Glasgow G4 0BA.
Dr. Barakat S.M. Mahmoud Food Safety/Microbiology Experimental Seafood Processing Laboratory Costal Research and Extension Centre Mississippi State University 3411 Frederic Street Pascagoula, MS 39567 USA.
Prof. Dr. A.N. Mirsa Department of Biosciences and Biotechnology, School of Biotechnology Fakia Mohan University, Vyasa Vihar, Balsore-756019, India.
Dr. Neela Badrie Department of Food Production, Faculty of Science and Agriculture, University of the West Indies, St. Augustine, Republic of Trinidad and Tobago, West Indies.
Prof. Yulong Yin Institute of Subtropical Agriculture (ISA), The Chinese Academy of Science (CAS), Hunan, Changsha 410125, Post Box 10, China.
State Key Lab of Food Science and Technology, Jiangnan University, 1800 Lihu Ave., Wuxi 214122, China.
Dr. R. A. Siddique Department of Veterinary Biochemistry College of Veterinary Science and Animal Husbandry Navsari Agricultural University, Navsari, 396450 Gujarat, India.
Dr. Brnčić Mladen Faculty of Food Technology and Biotechnology; Pierottijeva 6; 10000 Zagreb.
Dr. Jianbo Xiao Institute of Chinese Medical Sciences State Key Laboratory of Quality Research in Chinese Medicine University of Macau,Macau
Dr. Petr Konvalina, Ing University of South Bohemia in Ceske Budejovice, Faculty of Agriculture, Studentska 13, České Budějovice, Czech Republic
Dr. Ashish Kumar Singh Senior Scientist, Dairy Technology Division National Dairy Research Institute, Karnal-132001 Haryana, India.
Dr. K. Pandima Devi Department of Biotechnology Alagappa University Karaikudi- 630 003 Tamil Nadu India.

Editorial Board Dr. Chakradhar Reddy Dr. Khaled A. Osman
Division of Gastroenterology Department of Plant Production and Protection
University of Miami/Jackson Memorial Hospital College of Agriculture & Veterinary Medicine,
Miami, Florida, U. S. A. Qassim University, Buriadah, Al-Qassim
Dr. Sara Chelland Campbell P.O. Box 6622
Department of Nutrition, Food and Exercise Sciences Saudi Arabia.
Florida State University Tallahassee, Florida Dr. Olusegun Olaoye
U. S. A. Division of Food Sciences University of Nottingham
Dr. Naveen Dixit United Kingdom.
University of Florida Institute of Food and Agricultural Sciences Dr. Anastasios Koulaouzidis
Southwest Florida Research and Education Center Staff Gastroenterologist
U. S. A. Centre of Liver & Digestive Disorders Royal Infirmary of Edinburgh
Dr. M. Ayub Hossain 51 Little France Crescent
Bangladesh Agricultural Research Institute United Kingdom.
Gazipur-1701 Bangladesh. Dr. Ding
Dr . Aline Lamien-Meda Department of Respiratory Diseases,
Department of Biochemistry and Phytochemistry General Hospital of Chinese People’s Armed Police Forces
Institut für Angewandte Botanik und Pharmakognosie Beijing,
Veterinärmedizinische Universität Wien, Veterinärplatz 1, China.
A-1210 Wien, Austria. Dr. Ashok Kumar Malik
Department of Chemistry,
Dr. Olalekan Badmus CDLU, Sirsa,
Research and development Team, Haryana
Thames water, Leeds University, Dr. Chongbi Li
United kingdom. Biotechnology Field. Institute of Biopharmaceutical Engineering ,
Dr. Rui Cruz Zhaoqing University,
ADEA-Escola Superior de Tecnlogia China.
Universidade do Algarve Campus da Penha, Estrada da Penha Dr. Odara Boscolo
8005-139 Faro National Museum / Federal University of Rio de Janeiro)-
Portugal. Phanerogamic systematic and ethnobotany Laboratory- Botany Department,
Prof. Zheng do Rio de Janeiro, Brazil
Key Laboratory for Biotechnology on Medicinal Plants of Jiangsu Province, Xuzhou Normal University, Dr. José Lavres Junior
Xuzhou 221116, University of São Paulo,
China. Center for Nuclear Energy in Agriculture, São Paulo - Brazil Dr. Gokben Ozbey Fırat University, Vocational School of Health Services, Engineering Campus, Elaziğ Turkey.

International Jourcal of Medicine and Medical Sciences
Afi
African Journal of Food Science
Table of Contents: Volume 11 Number 12 December, 2017
ARTICLES
Rheological characteristics and baking quality of flours from Nigerian
grown wheat 376
Gloria Nwakaegho Elemo, Adetokunbo Adetola Osibanjo, Olubunmi Phebean Ibidapo, Akinyele Oluwatosin Ogunji, Wahab Bolanle Asiru, Turaki Zakari and
Oluwasina Gbenga Olabanji
Promotion of orange flesh sweet potato by demonstration of acceptance
and food product development 383 Timothy J. Bowser, Frank Ojwang, Roger Sahs and Lynn Brandenberger
Assessment of loss of carbohydrate through fermentation process of yeast (Saccharomyces cerevisiae) from small sample of maize flour dough 389 Kasahun Gudeta and Messele Admassu
Vol. 11(12) pp. 376-382, December 2017
DOI: 10.5897/AJFS2017.1565
Article Number: 31CEF7066645
ISSN 1996-0794
Copyright © 2017
Author(s) retain the copyright of this article
http://www.academicjournals.org/AJFS
African Journal of Food Science
Full Length Research Paper
Rheological characteristics and baking quality of flours from Nigerian grown wheat
Gloria Nwakaegho Elemo1, Adetokunbo Adetola Osibanjo1, Olubunmi Phebean Ibidapo1*, Akinyele Oluwatosin Ogunji1, Wahab Bolanle Asiru3, Turaki Zakari2 and
Oluwasina Gbenga Olabanji2
1Department of Food Technology, Federal Institute of Industrial Research, P. M. B. 21023 Ikeja, Lagos, Nigeria.
2Department of Cereal Research, Lake Chad Research Institute, Maiduguri, P. M. B. 1293, Maiduguri, Borno, Nigeria.
3Department of Project Development and Design Federal Institute of Industrial Research, Oshodi, P. M. B. 21023 Ikeja,
Lagos, Nigeria.
Received 16 January, 2017; Accepted 27 September, 2017
This study evaluated the rheological characteristics and baking qualities of flours from five different Nigerian grown wheat grains namely Atilla (ATL), Cettia (CET), Reyna 28 (REY), Seri MSH (SER) and Norman (NOR) along with a market brand of imported wheat flour which served as the control (CON). Rheological characteristics of the improved flour samples were studied using the Mixolab and a standard Chopin + protocol. The maximum torque during mixing (C1), the protein weakening due to mechanical work and temperature (C2), starch gelatinization (C3), stability of the starch gel formed (C4), starch retrogradation during the cooling stage (C5) were all determined. Results showed that water absorption of the improved flour samples ranged from 57.4 to 67.4% with the least value in CET and the highest in NOR. The lower water absorption of CET dough seemed to affect its stability and development. Dough development time (DDT) ranged from 0.63 to 2.17 min, with REY recording the highest value and CET the least. The physical characteristics of the bread in terms of loaf weight, volume and specific volume were also determined using standard analytical procedures.The specific volume, which is an important index of loaf quality ranged from 3.41 cm
3/g in CON to 3.85 cm
3/g in REY.
The study revealed that though there were variations in the rheological characteristics of the Nigerian grown wheat varieties compared with the imported control, nonetheless, bread loaves of good and acceptable quality can be produced from the Nigerian local wheat flours.
Key words: Rheological characteristics, baking quality, Nigerian grown wheat, Mixolab, physical characteristics. INTRODUCTION Flour from wheat (Triticum aestivum), of both hard and soft types, have been the major ingredient for leavened
bread for many years because of its functional proteins. In Nigeria, wheat bread is widely acceptable and
*Corresponding author. E-mail: [email protected].
Author(s) agree that this article remains permanently open access under the terms of the Creative Commons Attribution
License 4.0 International License

consumed both in the rural and urban areas as a consequence of changing taste, convenience and consumer subsidies. Wheat, however, is of temperate origin (Edema et al., 2005) and Nigeria has been unable to meet her requirement as a result of climatic incompatibilities, hence the country has had to rely on importation which has become rather heavy and unbearable.
The current annual value of wheat importation in Nigeria is about N635 billion whereas the total importation from 1999 till 2010 (a period of about ten years) is N1.087 trillion ($6,792,934,000) (FAOSTAT, 2015). This is a clear indication of our high dependence on foreign wheat and the need to curtail it by finding suitable local alternatives. The high demand for bread, noodles, pasta, crackers and biscuits (cookies) in Nigeria has contributed to the increased demand for flour from wheat as the basic raw material for these products and recent consumption market is estimated at close to $1 billion in U.S. exports for FY 2014 (USDA, GAIN Annual report, 2014).
In 2010, African countries spent more than $12.5 billion and Nigeria alone spent about $4.0 billion to import wheat. In Nigeria, wheat is produced commercially under irrigation, within latitudes 10° to 14° N between November to March, during the cold harmattan period of the year, which provides the much needed low temperature of 15 to 20°C for its optimum production. The improved varieties used in this study gave good grain yields of 5.0 to 8.0 t/ha with Norman giving the highest yield of 8.0 t/ha while Reyna-28 and Atilla Gan Atilla gave average grain yields of 6.1 and 5.0 t/ha, respectively. Seri MSH and Cettia have a potential yield of 5.0 t/ha. This is hoped to bring about the positive improvement capable of meeting domestic wheat requirement of 3.5 million metric tonnes, thereby reducing the huge import bill of the Nigeria Government.
Leavened bread is a baked product that is universally accepted as a convenient food and desirable to all population groups, irrespective of social or economic status. Its origin dates back to the Neolithic era and it is still one of the most consumed and acceptable staple in all parts of the world (Selomulyo and Zhou, 2007). It is basically made of strong wheat flour, a leavening agent, fat, sugar, salt and water (Badifu et al., 2005). In Nigeria, bread has become the second most widely consumed non-indigenous food product after rice (Shittu et.al., 2007) and is an important source of nourishment to Nigerians, taken extensively in many homes and eateries.
The most common type of bread produced in Nigeria is the white bread. About 6.2 billion loaves (or 5.2 million tons) of bread are supplied into the Nigerian market annually by domestic production from over 20,000 bakeries in the country and also through influx from
Elemo et al. 377 neighboring countries (http://mumpreneur.ng/product/industrial-profile-cassava-bread-production). The estimated monetary value is about N1.05 trillion per annum (FAOSTAT, 2015). These statistics are a clear signal of the need to investigate the development and utilization of improved varieties of locally grown wheat, in order to reduce the nation’s expense on wheat importation and thereby conserve foreign reserve.
The behaviour of wheat flour when mixed with water and the corresponding rheological properties of the dough formed are very important indices for product development, with respect to product quality and process efficiency [Collar and Armero, 1996; Moreira et al., 2010]. During the bread making process, flour composites are subjected to mechanical work and heat treatment that promote changes in their rheological properties (Bollaín and Collar, 2004). The unique dough forming and bread making property of wheat is attributed to gluten, the protein network formed when wheat flour is hydrated and subjected to mechanical shear.
This study therefore investigated the quality characteristics of some improved wheat varieties grown in Nigeria, in terms of the rheology and baking characteristics, in order to determine their suitability for use in the baking industry. This is in line with the current Agricultural Transformation Agenda of the Federal Government of Nigeria. MATERIALS AND METHODS
Flour samples from improved wheat varieties, coded ATL, CET, REY, SER and NOR, supplied by the Lake Chad Research Institute, Nigeria were evaluated along with a market brand of imported wheat flour which served as the control (CON). The control flour and other baking materials such as fat, baker’s yeast, sugar and salt were purchased from a local market in Lagos, Nigeria.
Mixolab analysis and rheological properties of the flour samples Rheological properties of dough are very important indices for product development in terms of product quality and process efficiency. During the baking process, wheat flour samples are subjected to mechanical work and heat treatment that promote changes in their rheological properties. The unique dough-forming and bread making properties of wheat is attributed to gluten protein, which is formed when wheat flour is hydrated and subjected to mechanical shear (Roselle et al., 2007). The Mixolab by Chopin Technologies is a test equipment for determining the rheological behaviour of dough, (accepted as ICC standard method No. 173), and is based on the water absorption, mixing, gluten, gelatinization, amylase activity and retrogradation properties of the flour. The preparation and characterization of the dough was according to Mixolab standard method (Chopin, 2009). The calculated quantity of wheat flour (from the equipment software) was placed into the Mixolab bowl and subjected to hydration, mixing and heating

378 Afr. J. Food Sci.
Figure 1. Flow chart for the production of bread (straight dough process) Source: FIIRO (2008).
according to the standard Chopin+ protocol, with a setting of 80 rpm mixing rate, 75 g dough weight, 30°C tank temperature and a total analysis time of 45 min. Parameters obtained from the recorded curve include: water absorption (%) or water required to obtain a torque of 1.1 N ±0.05;C1, which is the first maximum point on the curve at 30°C; T1, which is dough development time or time to reach C1 (in min); stability (in min), which is time at which the torque produced is greater than C1; C2, which is the degree of softening or protein weakening (in Nm) and is the first minimum on the curve at 90°C; C3, which is the peak torque or the maximum torque (in Nm)after heating and during the holding stage and is the
second maximum on the curve; C4, which is the second minimum indicating amylase activity and stability of the hot gel formed and C5, which is the last point on the curve and measures starch retrogradation during the cooling stage. Evaluation of the baking quality of the flour samples Baking performance was done using the straight dough bread making method (Figure 1), using parameters as recorded in Table 2 and the resulting bread loaves were evaluated in terms of volume,

Elemo et al. 379 Table 1. Rheological characteristics of the flour samples.
Variety Water absorption % Torque (Nm)
DDT C1 C2 C3 C4 C5 Amplitude (Nm) Stability (Min)
CON 65.9 1.07 1.14 0.39 2.07 2.13 2.76 0.07 3.82
Atila 67.1 1.95 1.09 0.43 1.78 1.90 3.05 0.08 3.42
Cettia 57.4 0.63 1.12 0.44 2.33 1.78 3.41 0.09 6.67
Reyna 28 65.7 2.17 1.12 0.46 1.97 1.57 2.94 0.07 3.85
Seri MSH 64.5 2.10 1.12 0.44 1.82 2.16 3.17 0.08 4.60
Norman 67.4 2.02 1.12 0.44 1.87 2.03 3.24 0.09 4.25
weight, crust and crumb characteristics. The loaf weight in grams was taken after baking and cooling, using the laboratory scales (CE 410I, Camry Emperors, China). The loaf volume in cm3 was determined using seed displacement method (AACC, 2000, Standard 10-05).
The specific loaf volume (volume to mass ratio) in cm3/g was calculated thereafter as:
Loaf volume
Specific volume =
Loaf weight Statistical analysis The data obtained for physical characteristics of the test bread samples were expressed as mean of triplicate values ± standard deviations and subjected to analysis of variance (ANOVA) using Statistical Package for Social Sciences (SPSS) software. Duncan Multiple Range Test was used to determine significant differences between the samples (p<0.05).
RESULTS AND DISCUSSION
Table 1 shows the rheological parameters of the dough. Results show that water absorption ranged from 57.4 to 67.4% having the least value in CET and the highest value in NOR. Water absorption is the quantity of water required for adequate consistency, in order to obtain a torque of C1=1.1±0.05 Nm according to the standard Chopin + protocol used. It is an important dough property which affects bread quality and shelf life. The C1 figures taken at the start of the test, during the constant temperature period in which dough mixing characteristics are measured, were within the stipulated 1.10±0.05 Nm for all the samples. The values ranged from 1.09 to 1.14 Nm, with the least in ATL and the highest in CON.
Dough development time (DDT) is the time to reach C1. This ranged from 0.63 to 2.17 min and REY recorded the highest value while the least was recorded by CET. The stronger the flour, the longer it takes. Reports indicated that DDT is strongly influenced by flour protein, gluten properties and flour particle size (Catteral, 1995;
Rasper and Walker, 2000). Amplitude is the curve width at C1 and indicates the protein quality or elasticity of the dough. The higher the figure, the more elastic is the dough. Values ranged from 0.07 to 0.09 Nm with the highest recorded by CET and NOR while REY and CON had the least.
Dough stability is the time (in minutes) when the torque exceeds C1 and is a measure of dough resistance to kneading. The higher the figure, the stronger is the dough. It ranged from 3.42 to 6.67 min with CET having the highest dough stability and ATL the least. The lower water absorption of CET dough seemed to influence its stability and development. This might be due to the competition between the starch granules and flour proteins for available water, which consequently affected the visco-elastic behaviour of the dough (Hatcher et al., 2009). The decrease in water absorption resulted in an increase in dough cohesiveness which explains the increased stability of the dough. Dough stability is affected mainly by gluten quality and its resistance to the kneading forces. Gluten properties are in turn determined by many factors including wheat variety, agro ecological conditions during planting, protease activity and milling conditions (Catteral, 1995; Rasper and Walker, 2000).
C2 is a measure of dough weakening due to protein reduction. As dough temperature increases during mixing, consistency decreases and the degree of decrease depends on protein quality. It is a function of mechanical work and temperature. It ranged from 0.39 to 0.46 Nm with the highest value in REY. C3 is an indication of starch gelatinization during the heating and cooking stage. It describes the starch behavior which is observed as an increase in consistency of the dough and the increase is dependent on the quality of the starch. The value ranged from 1.78 to 2.33 Nm, with CET having the highest. The amylase activity and the physical breakdown of the starch granules are associated with a reduction in viscosity in the fourth stage. The torque at C4 gives an indication about the rate of enzymatic hydrolysis and the stability of the hot gel formed. The lower the value, the less stable is the starch gel. SER had

380 Afr. J. Food Sci.
Table 2. Bread making performance.
Parameter ATL CET REY SER NOR CON
Optimum water (ml) 432 431 436 430 430 400
Optimum mixing time(min) 25 20 20 20 20 15
Total dough weight (kg) 1.5 1.5 1.5 1.5 1.5
1.5
Scaled dough (g) 300 300 300 300 300 300
Proof time (min) 180 180 180 180 180 180
Baking time (min) 25 25 25 25 25 25
ATL, Atilla; CET, Cettia; REY, Reyna 28; SER, Seri MSH; NOR, Norman; CON, Control (market brand).
Table 3. Physical characteristics of the test bread samples.
Sample code Loaf volume (cm3) Loaf weight (g) Loaf height (cm) Specific volume (cm
3/g)
ATL 987.0c±1.0 282.5
b±0.7 6.9
c±0.1 3.49
d±0.01
CET 987.5c±1.5 280.0
c±1.0 7.0c±0.1 3.53
c±0.01
REY 1087.5a±1.5 282.5
b±0.7 7.6
a±0.3 3.85
a±0.05
SER 975.5d±0.5 279.0
c±1.0 7.0
c±0.1 3.50
d±0.05
NOR 1025.5b±1.0 282.0
b±0.7 7.2
b±0.2 3.64
b±0.04
CON 987.0c±1.0 290.0
a±3.1 7.6
a±0.1 3.41
e±0.04
Values are means of triplicate determinations ± standard deviation and values with different superscripts along the columns are significantly different (p<0.05). ATL, Atilla; CET, Cettia; REY, Reyna 28; SER, Seri MSH; NOR, Norman; CON, Control (market brand).
the highest value of 2.16 Nm, implying the most stable gel in the hot phase. The torque (C5), is an indication of retrogradation or re ordering of starch molecules during the cooling phase and implies how shelf stable the flour product will be. Of the local wheat test samples, REY had the least and closest value to the control.
The result of the bread making performance is shown in Table 2. REY showed the highest optimum water uptake (436 ml) with a mixing time of 20 min, followed by ATL having 432 ml optimum water uptake but with a higher mixing time of 25 min. Water must be added to the optimal absorption level so that dough can reach a stage of maximum development. Reports have shown that optimal water uptake and mixing time are major factors for dough development and are mainly influenced by the type of wheat, protein content of flour, type of mixer as well as mixer speed (Sliwinski et al., 2004; Abang Zaidel et al., 2010).
The physical characteristics of the bread; loaf weight, volume and specific loaf volume are shown in Table 3. Loaf weight ranged from 279.0 g in SER to 290.0 g in the control (CON) and the higher value in CON was found to be significant (p<0.05), compared with the other samples. Loaf volume ranged from 975.5 to 1087.5 cm
3 with the
highest value in REY and the least in SER. Specific volume ranged from 3.41 cm
3//g in CON to 3.85 cm
3//g in
REY and the specific volume of REY was found to be significantly higher compared with the other bread samples. The specific loaf volume is regarded as the most important bread characteristic as it provides a quantitative measure of baking performance (Tronsmo et al., 2003).
Among the five flour samples tested, the study revealed that REY had the highest loaf volume and specific loaf volume. According to Lin et al. (2009), China Grain Product Research and Development Institute in 1983 documented that specific loaf volume for standard bread rangeD from 3.5 to 6.0 cm
3/g in which variation in loaf
volume could be attributed to different rates of gas evolution and the extent of starch gelatinization. The loaf height also gives an indication of the raising or swelling power of the dough, since same weight of the samples was placed in baking pans of same dimensions. CON and REY were the tallest loaves, with a height of 7.6 cm, and ATL the shortest, with 6.9 cm. Table 4 presents the Mixolab indices of the wheat doughs. The absorption index is a function of the flour components (starch, protein, fibre and additives). It ranged from 4 to 9 with ATL and NOR having the highest and CET recorded the least. The higher the value, the more is the water required for dough formation. Mixing index shows the behavior of the dough during mixing,

Elemo et al. 381
Table 4. Mixolab indices of flours from the different wheat varieties.
Parameter Wheat variety
ATL CET REY SER NOR CON
Absorption 9 4 8 8 9 8
Mixing 1 1 1 2 2 2
Gluten 7 4 7 7 7 2
Viscosity 6 8 8 6 7 5
Amylase 8 4 7 9 8 7
Retrogradation 8 8 8 8 8 6
accounting for dough stability, development and weakening. A high value corresponds to high dough stability in mixing. All the samples could be considered to have low mixing index with values between 1 and 2. Gluten index represents the behavior of the gluten when heating the dough in which high value indicates a high gluten resistance to heating. All the test dough samples had high value of 7 except CET with a value of 4. Viscosity index shows the maximum viscosity during heating and depends on both amylase and starch quality. High value corresponds to high dough viscosity during heating. CET and REY had the highest index whilel CON was least. Amylase activity index ranged from 4 to 9 with CET having the least and SER the highest. Amylase activity index is a function of the ability of the starch to withstand breakdown. A high value corresponds to low amylase activity and vice versa.
Retrogradation index is a function of association and re-arrangement of starch granules and the value is 8 in all the test samples, showing similar retrogradation behaviour, compared with a value of 6 in the control. The higher the index, the shorter the product shelf-life. This is not surprising because the control sample is a market brand and is expected to have been enhanced for optimum performance while the local wheat flours were just crude samples.
Conclusion
Results from this study have shown that though there are variations between the Nigerian grown wheat varieties and the imported control, in terms of some measured parameters, bread samples having good rheological properties and baking qualities can be produced from the local wheat flours and this is a very promising and encouraging starting point. It should be realized that the control flour has been refined and produced to optimum specifications, with added enhancers to give best results, whereas the local wheat flours were crude samples just milled directly from the grain. There is need to involve
flour millers to optimize the processing and milling of the locally grown wheat, in order to enhance flour performance. It is recommended that more locally grown wheat varieties be screened, in order to discover other promising ones. Better harvesting procedures and processing conditions are also needed to improve kernel yield and reduce contamination.
CONFLICT OF INTERESTS The authors have not declared any conflict of interests. ACKNOWLEDGEMENT The authors wish to appreciate the Lake Chad Research Institute Maiduguri, Nigeria for the gracious provision of the improved wheat flour samples used in this study. REFERENCES
American Association of Cereal Chemists (AACC) (2000). Approved
Methods of the American Association of Cereal Chemists (10th ed.) St Paul: American Association of Cereal Chemists Inc. Academy Press. pp. 362-421.
Abang Zaidel DN, Chin NL, Yusof YA (2010). A review on rheological properties and measurements of dough and gluten. J. Appl. Sci. 10:2478-2490.
Badifu GIO, Chima CE, Ajayi YL, Ogbori AF (2005). Influence of mango mesocarp flour supplementation to micronutrient, physical and organoleptic qualities of wheat based bread. Niger. Food J. 23:59-68.
Bollaín C, Collar C (2004). Dough viscoelastic response of hydrocolloid /enzyme/surfactant blends assessed by uni- and bi-axial extension measurements. Food Hydrocoll. 18:499-507.
Catteral P (1995). Flour milling. In: Technology of Bread making. Second Edition (SP Cauvain and LS Young eds), Aspen Publishers Inc. Gaithersburg. pp. 296-329.
Chopin (2009). Mixolab Applications Handbook. Chopin Technologies Publication, France. pp. 9-16.
Collar C, Armero E (1996). Physico-chemical mechanisms of bread staling during storage: Formulated doughs as a technological issue for improvement of bread functionality and keeping quality. Recent Res. Dev. Nutr. 1:115-143.
Edema MO, Sanni LO, Sanni AI (2005). Evaluation of Maize-soybean

382 Afr. J. Food Sci.
flour blends for sour maize bread production in Nigeria. Afr. J. Biotechnol. 4:911-917.
FIIRO (2008) Federal Institute of Industrial Research, Oshodi FIIRO Activities on Cassava Processing. pp. 2-43.
Food and Agricultural Organization Statistics FAOSTAT (2015). Consumption and Trade in Cassava Products. Food and Agricultural Organization Statistics FAO (2015) Trend of Cassava Production in Nigeria, from 1980- 2013. http://www.fao.org/faostat/en/#data/QC
Hatcher DW, Bellido GG, Anderson MJ (2009). Flour particle size, starch damage, and alkali reagent: impact on uni-axial stress relaxation parameters of yellow alkaline noodles. Cereal Chem. 86(3):361-368.
Lin L, Liu H, Yu Y, Lin SD, Mau J (2009). Quality and antioxidant property of buckwheat enhanced wheat bread. J. Food Chem. 37:461-467.
Moreira R, Chenlo F, Torres MD, Prieto DM (2010). Influence of the particle size on the rheological behavior of chestnut flour dough. J. Food Eng. 100:270-277.
Rasper VF, Walker CE (2000). Quality evaluation of cereals and cereal products. In: Handbook of Cereal Science and Technology: Second Edition, Revised and Expanded (K Kulp, J G Ponte, eds), Marcel Dekker, New York. pp. 505-538.
Roselle CM, Collar C, Haros M (2007). Assessment of hydrocolloid on the thermo-mechanical properties of wheat using the mixolab. Food Hydrocoll. 21:452-462.
Selomulyo VO, Zhou W (2007). Frozen bread dough: Effects of freezing
storage and dough improvers. J. Cereal Sci. 45:1-17. Tronsmo KM, Faergestad EM, Schofield JD, Magnus S (2003). Wheat
protein quality in relation to baking performance evaluated by the Chorleywood bread process and a hearth bread baking test. Cereal Sci. 38:205-215.
Shittu TA, Raji AO, Sanni LO (2007). Bread from composite cassava-wheat flour: I. Effect of baking time and temperature on some physical properties of bread loaf. Food Res. Inter. 40(2):280-282.
Sliwinski EL, Kolster P, Prins PA, Van Vliet T, (2004). On the relationship between gluten protein composition of wheat flours and large-deformation properties of their doughs. J. Cereal Sci. 39:247-264.
United States Department of Agriculture (USDA), Global Agricultural Information Network (GAIN) (2014). Grain and Feed Annual Report, Washington, USA.

Vol. 11(12) pp. 383-388, December 2017
DOI: 10.5897/AJFS2017.1647
Article Number: E8875AB66649
ISSN 1996-0794
Copyright © 2017
Author(s) retain the copyright of this article
http://www.academicjournals.org/AJFS
African Journal of Food Science
Full Length Research Paper
Promotion of orange flesh sweet potato by demonstration of acceptance and food
product development
Timothy J. Bowser1*, Frank Ojwang2, Roger Sahs3 and Lynn Brandenberger4
1Biosystems and Agricultural Engineering Department, Oklahoma State University, Stillwater, USA.
2International Potato Center, Nairobi, Kenya.
3Department of Agricultural Economics, Oklahoma State University, Stillwater, USA.
4Horticulture and Landscape Architecture Department, Oklahoma State University, Stillwater, USA.
Received 15 August, 2017; Accepted 3 October, 2017
Orange flesh sweet potato (OFSP) is a globally important staple crop. Health benefits of OFSP are substantial, especially for nutrition-endangered populations. Compared to the Irish potato (IP), OFSP is a richer source of nutrients and fiber. In some parts of the world, OFSP is unfortunately regarded as a poor farmer’s crop. This negative reputation has resulted in reduced acceptance of OFSP by populations that could benefit greatly from it. One purpose of this paper is to promote acceptance of OFSP by demonstrating sensory preference of OFSP compared to IP. The second purpose is to recognize a global effort to develop food products using OFSP. Consumer taste tests were conducted to compare OFSP and IP cooked and prepared using common methods of mashing and cubing. Published journal articles that reported development of foods with OFSP as a primary ingredient were identified. Recipe developers must have used a rigorous technique of sensory analysis to test products. Consumers did not show a significant preference for the taste or appearance of mashed or cubed OFSP compared to IP. Researchers from 9 different countries have developed food products that included OFSP in 22 different categories over a 26-year period. OFSP has been successfully utilized in the development of many well-liked food products. Continuous education and exposure of future generations of scientists and consumers to the benefits of OFSP will result in broad-based acceptance. Key words: Orange flesh sweet potato, Irish potato, sensory test, acceptance, product development.
INTRODUCTION Sweet potato (Ipomoea batatas) plays a major role worldwide as a staple crop and is especially important in
developing countries (Laurie et al., 2015). Sweet potato is thought to have originated in Latin America (Davidson,
*Corresponding author. E-mail: [email protected].
Author(s) agree that this article remain permanently open access under the terms of the Creative Commons Attribution
License 4.0 International License
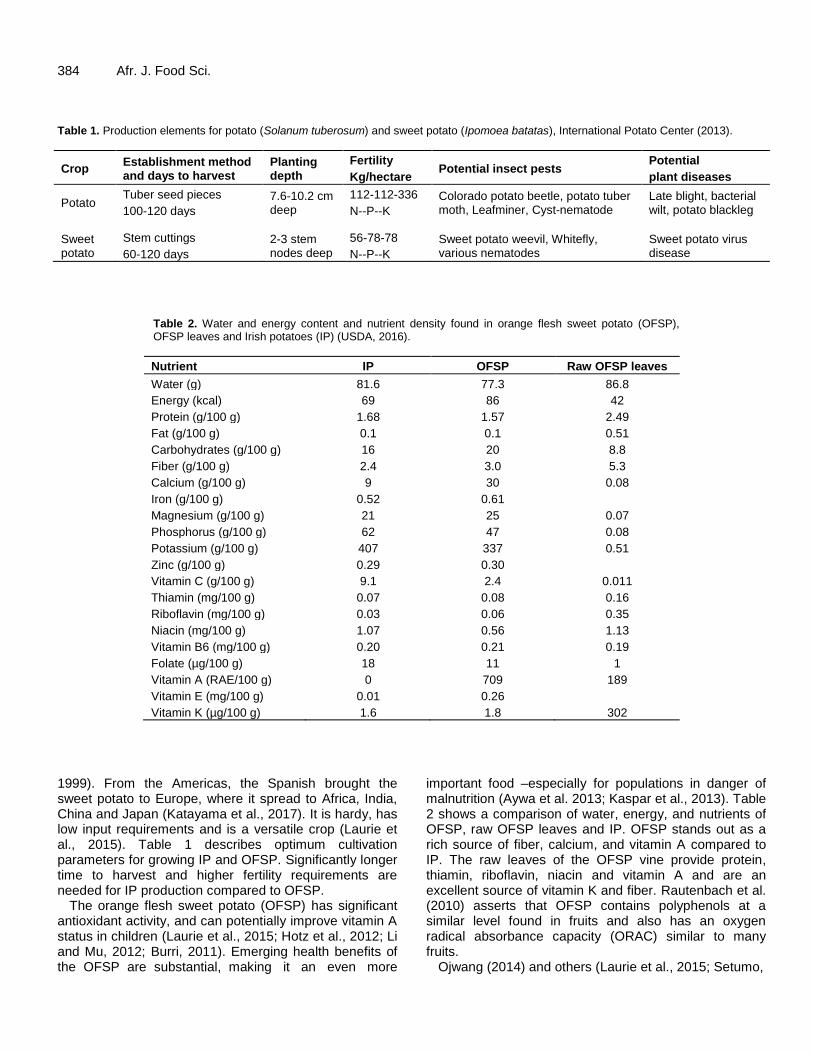
384 Afr. J. Food Sci. Table 1. Production elements for potato (Solanum tuberosum) and sweet potato (Ipomoea batatas), International Potato Center (2013).
Crop Establishment method and days to harvest
Planting depth
Fertility
Kg/hectare Potential insect pests
Potential
plant diseases
Potato Tuber seed pieces
100-120 days
7.6-10.2 cm deep
112-112-336
N--P--K
Colorado potato beetle, potato tuber moth, Leafminer, Cyst-nematode
Late blight, bacterial wilt, potato blackleg
Sweet potato
Stem cuttings
60-120 days
2-3 stem nodes deep
56-78-78
N--P--K
Sweet potato weevil, Whitefly, various nematodes
Sweet potato virus disease
Table 2. Water and energy content and nutrient density found in orange flesh sweet potato (OFSP), OFSP leaves and Irish potatoes (IP) (USDA, 2016).
Nutrient IP OFSP Raw OFSP leaves
Water (g) 81.6 77.3 86.8
Energy (kcal) 69 86 42
Protein (g/100 g) 1.68 1.57 2.49
Fat (g/100 g) 0.1 0.1 0.51
Carbohydrates (g/100 g) 16 20 8.8
Fiber (g/100 g) 2.4 3.0 5.3
Calcium (g/100 g) 9 30 0.08
Iron (g/100 g) 0.52 0.61
Magnesium (g/100 g) 21 25 0.07
Phosphorus (g/100 g) 62 47 0.08
Potassium (g/100 g) 407 337 0.51
Zinc (g/100 g) 0.29 0.30
Vitamin C (g/100 g) 9.1 2.4 0.011
Thiamin (mg/100 g) 0.07 0.08 0.16
Riboflavin (mg/100 g) 0.03 0.06 0.35
Niacin (mg/100 g) 1.07 0.56 1.13
Vitamin B6 (mg/100 g) 0.20 0.21 0.19
Folate (µg/100 g) 18 11 1
Vitamin A (RAE/100 g) 0 709 189
Vitamin E (mg/100 g) 0.01 0.26
Vitamin K (µg/100 g) 1.6 1.8 302
1999). From the Americas, the Spanish brought the sweet potato to Europe, where it spread to Africa, India, China and Japan (Katayama et al., 2017). It is hardy, has low input requirements and is a versatile crop (Laurie et al., 2015). Table 1 describes optimum cultivation parameters for growing IP and OFSP. Significantly longer time to harvest and higher fertility requirements are needed for IP production compared to OFSP.
The orange flesh sweet potato (OFSP) has significant antioxidant activity, and can potentially improve vitamin A status in children (Laurie et al., 2015; Hotz et al., 2012; Li and Mu, 2012; Burri, 2011). Emerging health benefits of the OFSP are substantial, making it an even more
important food –especially for populations in danger of malnutrition (Aywa et al. 2013; Kaspar et al., 2013). Table 2 shows a comparison of water, energy, and nutrients of OFSP, raw OFSP leaves and IP. OFSP stands out as a rich source of fiber, calcium, and vitamin A compared to IP. The raw leaves of the OFSP vine provide protein, thiamin, riboflavin, niacin and vitamin A and are an excellent source of vitamin K and fiber. Rautenbach et al. (2010) asserts that OFSP contains polyphenols at a similar level found in fruits and also has an oxygen radical absorbance capacity (ORAC) similar to many fruits.
Ojwang (2014) and others (Laurie et al., 2015; Setumo,

2014; Bienabe and Vermeulen, 2008) observed that local communities in Sub-Saharan Africa tended to favor IP and other tuber crops above OFSP for a variety of reasons. In many parts of the world, OFSP may be regarded as a mainstay for poor farmers and as a crop grown by women (Brito et al., 2012). Part of this reputation can be attributed to promotion of OFSP as a post disaster crop to increase food security (Kapinga et al., 2005). Jenkins et al. (2015) pointed out that perception of OFSP varieties may be geographically specific. Clearly, widespread promotion of OFSP is needed. The objective of this research was to help promote acceptance of OFSP by (1) demonstrating sensory preference of OFSP compared to IP by a diverse consumer group, and (2) recognizing a global effort to develop new food products from OFSP.
Consumer organoleptic tests were designed to determine consumer acceptance of flavor and appearance of IP and OFSP cooked and prepared using common methods. A neutral or preferential response to OFSP compared to IP by multi-cultural, American consumers (especially young, college-age adults) participating in this study would help reinforce the case for greater acceptance of OFSP. A review of literature was conducted to identify food product development efforts using OFSP as a primary ingredient. Use of structured sensory testing was required to consider studies as relevant. A growing, global effort to develop new food products from OFSP would also show evidence of acceptance.
MATERIALS AND METHODS
Potato cultivars
White Irish Potatoes Russet type, and Orange Flesh Sweet Potato were purchased from a Wal-Mart Supercenter (Perkins Rd, Stillwater, OK).
Preparation
The same preparation procedure was followed for each type of potato (separately and simultaneously). Potatoes were prepared immediately before being served for sensory evaluation. Individual potatoes (about 200 g each) were rinsed in tap water. Next, potatoes were peeled by hand with a swivel peeler (OXO International Ltd., New York, NY). A sharp knife was used to hand-cut potatoes into approximately 2.5 cm cubes. A brine solution was prepared by adding 4.6 g of table salt (Morton Salt, Chicago, IL) to 4 L of tap water. The brine was boiled in a steam kettle. One kg of potato cubes was dumped into the boiling water and cooked for about 13 min, until fork-tender.
Boiled potatoes were removed from the pot using a straining ladle and placed in 4-liter plastic zipper-lock bags. The bags of cooked potato cubes were stored in two insulated chests (STX-54, Igloo Products, Katy, TX) before serving. Potatoes served as cubes were removed directly from the zipper-lock bags and placed on serving plates. For mashed potatoes, the entire bag of cubes was hand kneaded in the bag. Mashed potatoes were transferred from
Bowser et al. 385 the bag to the serving plates using an ice-cream scoop. Cooked potatoes were held for no longer than 2-hours before serving.
Sensory evaluation
Consumer tests were carried out at the Sensory Analysis Laboratory of the R.M. Kerr Food and Agricultural Products Center at Oklahoma State University. The tests were performed in several sessions during the day, with a variable number of panelists in each session. The total number of consumers that participated in the tests was 104, which was a typical number reported for consumer hedonic tests evaluating vegetables (Zhao et al., 2007; Kaspar et al., 2013). The consumer group was screened for food allergies, history of potato consumption and willingness to participate in the sensory test. Consumers were 65% female and claimed their home continent as: 83% from America; 2% from Africa; 6% from Asia; 1% from Europe and 8% from other. The consumers were mostly young college-age students with 83% of the group between 18 and 24 years of age. The remaining ages ranged from 6% between 25 to 29 years; 3% between 30 and 34 years; and, 9% were 35 years or older.
Sample plates were marked for the study in advance. Paper plates were divided into four quadrants using an indelible ink marker and each plate was assigned a random, three-digit number. About 75 g of one of the following four samples were placed in the center a quadrant of every plate for evaluation: mashed and diced IP, and mashed and diced OFSP. The location of samples on the plates was randomized to balance the presentation. Hot samples were placed on the plates and served immediately to panelists.
The sensory evaluation was divided into two phases that occurred in series. The purpose of the first phase was to evaluate taste and the second to evaluate appearance. The first phase was completed with the room lights turned off and red lights used to illuminate the samples. The red light masked the different colors of the potatoes. The second phase was completed under normal, florescent lighting.
Panelists were asked to evaluate samples in both phases using a hedonic scale from 1 to 9, with 1 = dislike extremely, and 9 = like extremely. Unsalted crackers and bottled water were provided for cleansing the palate between samples. An expectorant-cup was provided if the panelist did not want to swallow the sample.
OFSP product development study selection
Published journal articles were selected that described food product development with OFSP as a primary ingredient. A systematic method of product sensory evaluation must have been incorporated in the methods. Geographical or temporal limitations were not included.
RESULTS AND DISCUSSION
Duncan‟s new multiple range test (MRT) was conducted for each potato treatment (Table 3). MRT is used to determine if a significant difference existed between the means. A 95% confidence level (P < 0.05) was selected and the analysis was conducted using SAS software (Version 8, Cary, NC). Results indicated that college-age adults evaluated the taste and appearance of mashed and cubed IP and OFSP at about the same level of preference.

386 Afr. J. Food Sci.
Table 3. Potato Evaluations, taste testing and appearance of orange flesh sweet potatoes (OFSP) and Irish potatoes (IP).
Sample Taste Appearance
Mashed OFSP 6.3 az 7.5 a
Cubed OFSP 6.0 a 6.0 a
Mashed IP 6.5 a 8.2 a
Cubed IP 6.1 a 6.5 a zNumbers in a column followed by the same letter exhibited no significant differences based on
Duncan‟s Multiple Range Test where P=0.05.
Table 4. Products with OFSP ingredients that were developed by researchers and proven to be highly acceptable based on organized sensory testing.
Product Location(s) Reference(s)
Amala (cooked paste) Nigeria Fetuga et al. (2014)
Alcoholic beverage Brazil, Assam, India Ramos et al. (2017) and Paul et al. (2014)
Baked snack Nigeria Olapade and Ogunade (2014)
Bread Nigeria, Ethiopia, Mexico Etudaiye et al. (2015), Afework et al. (2016) and Trejo-Gonzales et al. (2014)
Cake Nigeria Etudaiye et al. (2015)
Chinchin (fried snack) Nigeria Etudaiye et al. (2015)
Chips South Africa Laurie and Van Heerden (2012)
Cookies: gluten free1, peanut-sweet potato
2,
sweet potato-maize blend3)
Mississippi, USA, Georgia, USA, Nigeria
Stokes et al. (2014), Palomar et al. (1994), and Adeyeye and Akingbala (2015)
Curd (fortified with sweet potato) Orissa, India Sivakumar et al. (2008)
Dackere Cameroon Mahamat et al. (2016)
Doughnuts South Africa Laurie and Van Heerden (2012)
Flour Alabama, USA Dawkins and Lu (1991)
Gari (meal) Kwara, Nigeria Ojo and Akande (2013)
Jam South Africa Ngubane (2008)
Juice South Africa Laurie and Van Heerden (2012)
Leaves (cooked vegetable dish) South Africa Laurie and Van Heerden (2012)
Pasta Punjab, India; Kerala, India Singh et al. (2004) and Menon et al. (2016)
Pastry Cebu, Philippines; Laguna, Philippines Aller et al. (2015) and Collado et al. (2001)
Pickle Orissa, India Panda et al. (2007)
Porridge (sweet potato-soybean-moringa) Ethiopia Gebretsadikan et al. (2015)
Tortillas (sweet potato puree and soy) Louisiana, USA Gelin et al. (2003)
Yoghurt Louisiana, USA Al-Fayez (2000)
For the taste tests, red lights prevented the panelists from distinguishing between OFSP and IP based on color. The red lights were turned off during the evaluation of the samples‟ appearance. Standard, fluorescent lights illuminated the room for the visual tests. Results of this study were consistent with Kaspar et al. (2013), where consumers did not detect significant differences between potato cultivars, and Tomlins et al. (2007) where consumers in the lake zone of Tanzania rated OFSP as highly acceptable.
Students at Oklahoma State University tend to represent diverse food consumer groups because of their eclectic eating habits and the prolific range of international cuisines available. Even so, in 2015, American consumers utilized 51.5 kg of IP per capita (National Potato Council, 2016) compared to 3.3 kg of OFSP (Bond, 2017). Given the ratio of IP to OFSP consumption was greater than 15:1, it is remarkable that no significant difference was found in the sensory tests. Further studies are needed to explore the taste and

appearance evaluations conducted by other groups representing unique segments of the consumer population for IP and OFSP. The value of repeating similar tests in global communities is indicated.
Studies by researchers on sensory evaluation and sweet potato palatability have shown that products containing OFSP are well liked. Laurie and Van Heerden (2012) reported high acceptability for doughnuts, chips and juice made from OFSP and cooked leaves from OFSP vines. A jam made from OFSP was also a local favorite (Ngubane, 2008) in South Africa. The flour and other ingredients of OFSP have been studied for use in foods (Walter et al., 1999; Dansby and Bovell-Benjamin 2003; Etudaiye et al., 2015). Table 4 lists some of the OFSP-based products developed, or under development, that have been evaluated by researchers making use of organized taste panels to evaluate their results.
Based on the information presented in Table 4, separate groups of researchers operating from nine different countries investigated food products containing OFSP or its leaves. Research spanned a 26-year period, with 27%, of the articles listed published in the past five years. This is important news for researchers, growers and consumers of OFSP, because the trend to develop nutritious and good-tasting products containing OFSP appears to be geographically widespread, long-term and persistent.
A continuous stream of healthy, affordable, and attractive products containing OFSP-based ingredients are presently available. New products containing ingredients from OFSP are expected to be developed, tested and commercialized in the future. Products containing ingredients from OFSP, or its leaves, will increasingly contribute to improving the health and wellbeing of many consumers worldwide.
Limitations and challenges to the continued promotion and acceptance of OFSP primarily reside within the sphere of education. Superior health benefits, sensory acceptance and vigorous product development activity combine to give compelling evidence of the value of OFSP-based foods. The story of the full value of OFSP to the food chain must be developed and expounded to future generations of scientists and consumers. Promotion will no longer be required when the truth about OFSP is comprehended on a wide-scale.
Successful marketing of OFSP products may be challenged by many factors such as trade laws, product shelf-life, customs, climactic conditions, politics, income and packaging. Ideally, acceptance should not become a marketing issue for a proven food source that is as fundamentally important to human health and wellbeing as OFSP. Education on the merits of OFSP will result in acceptance; acceptance in turn will result in demand. Demand can be expected to drive marketing of OFSP-based products to new and sustainable levels.
Bowser et al. 387 CONFLICT OF INTERESTS The authors have not declared any conflict of interests. ACKNOWLEDGEMENTS
The authors are grateful to the following groups at the Oklahoma State University, Stillwater for their important contributions to this work: The Oklahoma Agricultural Experiment Station and the Division of Agricultural Sciences and Natural Resources for financial support; the R.M. Kerr Food and Agricultural Products Center for providing sensory testing and cooking facilities and technical support; the Department of Biosystems and Agricultural Engineering for providing professional support. This work was also supported by the USDA National Institute of Food and Agriculture, (Hatch project 1441 accession 153410) project. REFERENCES Adeyeye SA, Akingbala JO (2015). Quality characteristics and
acceptability of cookies from sweet potato – maize flour blends. Nutr. Food Sci. 45(5):703-715. http://dx.doi.org/10.1108/NFS-03-2015-0020
Afework AK, Abegaz AG, Mezgebe (2016). Development of pro-vitamin A and energy rich biscuits: Blending of orange-fleshed sweet potato (Ipomea batatas L.) with wheat (Triticum vulgare) flour and altering baking temperature and time. Afr. J. Food Sci. 10(6):77-86. http://dx.doi.org/10.5897/AFJS2015.1403
Al-Fayez MA (2000). The effect of storage on consumer preference, sugar content, and starch content of spiced, low-fat sweet potato flavored yogurt. Dissertation, Louisiana State University, Food Science Dept., Baton Rouge. 176p.
Aller MC, Villarin MD, Pascual PRL (2015). Product development of malunggay (Moringa oleifera) and sweet potato (Ipomea batatas) for pastry and fillings. Trop. Tech. J. 19(1)5:1-6. http://dx.doi.org/10.7603/s40934-015-0005-1
Aywa AK, Nawiri MP, Nyambaka HN (2013). Nutrient variation in colored varieties of Ipomea batatas grown in Vihiga County, Western Kenya. Int. Food Res. J. 20(2):819-825.
Bienabe E, Vermeulen H (2008). New trends in supermarket procurement systems in South Africa: the case of local procurement schemes from small-scale farmers by rural-based retail chain stores. London: Regoverning Markets Innovative Practices series, IIED Available at: http://pubs.iied.org/pdfs/G03263.pdf. Accessed on 24AUG16.
Bond J (2017). U.S. sweet potato production swells. Available at: https://www.usda.gov/media/blog/2017/01/5/us-sweet-potato-production-swells. Accessed on: 7SEP17.
Brito LR, Brouwer M, Falcao (2012). Sweetpotato –biotechnology in different guises on a broad range of scales. Tech. Forecast Soc. 79(2):204-212.
Burri BJ (2011). Evaluating sweet potato as an intervention food to prevent vitamin A deficiency. Comp. Rev. Food Sci. Food Safe. 10:118-130.
Collado LS, Mabesa LB, Oates CG, Corke H (2001). Bihon-type noodles from heat-moisture-treated sweet potato starch. J. Food Sci. 66(4):604-609.
Dansby MY, Bovell-Benjamin AC (2003). Production and proximate composition of a hydroponic sweet potato flour during extended storage. J. Food Process. Pres. 27:153-164.

388 Afr. J. Food Sci. Davidson A (1999). Oxford companion to food, New York: Oxford
University Press. 912p. Dawkins NL, Lu JY (1991). Physico-chemical properties and
acceptability of flour prepared from microwaved blanched sweet potatoes. J. Food Proc. Pres. 15:115-124.
Etudaiye HA, Oti E , Aniedu C, Omodamiro MR (2015). Utilization of sweet potato starches and flours as composites with wheat flour in the preparation of confectioneries. Afr. J. Biotech. 14(1):17-22. http://dx.doi.org/10.5897/AJB12.2651
Fetuga GK, Tomlins F, Henshaw M, Idowu (2014). Effect of variety and processing method on functional properties of traditional sweet potato flour (“elubo”) and sensory acceptability of cooked paste (“amala”). Food Sci. and Nutr. 2(6): 682-691. http://dx.doi.org/10.1002/fsn3.161
Gelin S, Sterba T, Gerald BL (2003). Acceptability of flour tortillas modified with sweet potato puree and soy flour. J. Am. Dietetic Assoc. 103(9):209-210.
Gebretsadikan TM, Bultosa G, Forsido SF, Astatkie T (2015). Nutritional quality and acceptability of sweet potato–soybean–moringa composite porridge. Nutr. Food Sci. 45(6):845-858.
Hotz CC, Loechl A, de Brauw P, Eozenou D, Gilligan M, Moursi B, Munhaua P, van Jaarsveld A, Carriquiry JV, Meenakshi (2012). A large-scale intervention to introduce orange sweet potato in rural Mozambique increases vitamin A intakes among children and women. British J. Nutr. 108:163-176. http://dx.doi.org/10.1017/S0007114511005174
International Potato Center (2013). Everything you ever wanted to know about sweetpotato: reaching agents of change ToT training manual. Volume 4. ISBN: 978-92-9060-427-3. http://dx.doi.org/10.4160/9789290604273.v4
Jenkins M, Shanks CB, Houghtaling B (2015). Orange-fleshed sweet potato: successes and remaining challenges of the introduction of a nutritionally superior staple crop in Mozambique. Food Nutrition Bulletin. 36(3): 327-353. DOI http://dx.coi.org/0.1177/0379572115597397
Kapinga RM, Andrade B, Lemaga A, Gani C, Crissman R, Mwanga (2005). Role of orange-fleshed sweet potato in disaster mitigation: experiences from East and Southern Africa. Afr. Crop. Sci. Conf. Proc. 7:1321-1329.
Kaspar KL, Park JS, Brown CR, Weller K, Ross CF, Mathison BD, Chew BP (2013). Sensory evaluation of pigmented flesh potatoes (Solanum tuberosum L.). Food and Nutr. Sci. 4:77-81. http://dx.doi.org/10.4236/fns.2013.41011.
Katayama K, Kobayashi A, Sakai T, Kuranouchi T, Kai Y (2017). Recent progress in sweetpotato breeding and cultivars for diverse applications in Japan. Breed. Sci. 67:3-14. http://dx.doi.org:10.1270/jsbbs.16129.
Laurie SM, Van Heerden SM (2012). Consumer acceptability of four products made from beta-carotene-rich sweet potato. Afr. J. Food Sci. 6:96-103. http://dx.doi.org/10.5897/AJFS12.014.
Laurie S , Faber M, Adebola P, Belete A (2015). Biofortification of sweet potato for food and nutrition security in South Africa. Food Res. Int. 76:962-970.
Li PG, TH Mu. (2012). Sweet potato: health benefits, production and utilization in China. In Potatoes: Production, Consumption and Health Benefits. C. Caprara (ed.). Nova Science Publishers. pp. 127-172.
Mahamat D, Tatsadjieu NL, Kaptso KG, Njintang YN (2016). Production, physicochemical and sensory characterization of sweet potato-bambara groundnut mixed semolina (dackere) as affected by germination and fermentation using Lactobacillus plantarum. Food Measure 10:595-604. http://dx.doi.org/10.1007/s11694-9342-z.
Menon RG, Padmaja AN, Jyothi V, Asha MS, Sajeev (2016). Gluten-free starch noodles from sweet potato with reduced starch digestibility and enhanced protein content. J. Food Sci. Tech. 53(9):3532-3542. http://dx.doi.org/10.1007/s13197-016-2330-9.
National Potato Council (2017). 2017 Potato Statistical Yearbook. Available at: http://www.nationalpotatocouncil.org/potato-facts/. Accessed on: 7SEP17.
Ngubane H (2008). Msinga orange-fleshed sweet potato jam project based on market research. In M. Faber, S. M. Laurie, & P. J. Van Jaarsveld (Eds.), Proceedings Orangefleshed Sweetpotato
Symposium (pp. 57–60). Pretoria, MRC/ARC: ARC, 3 October 2007,
Available at: http://www.arc.agric.za/arc-vopi/Proceedings%20Library/OFSP%20symposium%20proceedings.pdf). Accessed on 8SEP16.
Ojo A, Akande EA (2013). Quality evaluation of „gari” produced from cassava and sweet potato tuber mixes. Afr. J. Biotechnol. 12(31):4920-4924. http://dx.doi.org/10.5897/AJB12.2504
Ojwang F (2014). Personal communication with the authors. Oklahoma State University, Stillwater.
Olapade AA, Ogunade OA (2014). Production and evaluation of flours and crunchy snacks from sweet potato (Ipomea batatus) and maize flours. Int. Food Res. J. 2(1):203-208.
Palomar LS, Galvez FCF, Resurreccion AVA, Beuchat LR (1994). Optimization of a peanut-sweet potato cookie formulation. LWT Food Sci. Technol. 27(4):314-318.
Panda SH, Parmanick M, Ray RC (2007). Lactic acid fermentation of sweet potato (Ipomoea batatas L.) into pickles. J. Food Proc. Pres. 31:83-101.
Paul SK, Dutta H, Mahanta CL, Kumar GVP (2014). Process standardization, characterization and storage study of a sweet potato (Ipomoea batatas L.) wine. Int. Food Res. J. 21(3):1149-1156.
Ramos LR, Santos JS, Daguer H, Valese AC, Cruz AG, Granato D (2017). Analytical optimization of a phenolic-rich herbal extract and supplementation in fermented milk containing sweet potato pulp. Food Chem. 221:950-958. http://dx.doi.org/10.1016/j.foodchem.2016.11.069
Rautenbach F,Faber M, Laurie S, Laurie R (2010). Antioxidant capacity and antioxidant content in roots of 4 sweetpotato varieties. J. Food Sci. 75:400-405. https://doi.org/10.1111/j.1750-3841.2010.01631.x
Setumo MP (2014). A stochastic frontier approach to economics of production and marketing of orange-fleshed sweet potato at farm level: a case study of KwaZulu-National Province, South Africa. Master‟s thesis, Sovenga: University of Limpopo.
Singh S, Raina CS, Bawa AS, Saxena DC (2004). Sweet potato-based pasta product: optimization of ingredient levels using response surface methodology. Int. J. Food Sci. Technol. 39:191-200.
Sivakumar PS, Panda SH, Ray RC, Pradhan DC, Sivaramane N. (2008). Modeling consumer acceptability of β-carotene rich sweet potato curd. J. Sensory Stud. 23:791-803.
Stokes AM, Tidwell DK, Briley CA, Burey SL, Schilling MW (2014). Consumer acceptability of gluten-free sweet potato cookies. Poster session: food/nutrition science; education; management; food services/culinary; research. J. Acad. Nutr. Dietetics 119(9):A-49.
Tomlins KG, Ndunguru K, Stambul N, Joshua T, Ngendello E, Rwiza R, Amour B, Ramadhani A, Kapande A, Westby (2007). Sensory evaluation and consumer acceptability of pale-fleshed and orange-fleshed sweetpotato by school children and mothers with preschool children. J. Sci. Food Agric. 87:2436-2446. http://dx.doi.org/10.1016/j.foodchem.2011.07.072
Trejo-Gonzalez AS, Loyo-Gonzalez AG, Munguia-Mazariegos MR (2014). Evaluation of bread made from composite wheat-sweet potato flours. Int. Food Res. J. 21(4):1683-1688.
United States Department of Agriculture (USDA) (2016). USDA National Nutrient Database for Standard Reference, Release 28. Nutrient data laboratory home page available at: https://ndb.nal.usda.gov/ndb/foods?qlookup=sweet+potato&fgcd=&manu=&SYNCHRONIZER_TOKEN=74a44d5b-d287-4e45-a1f2-9fe9a45d2689&SYNCHRONIZER_URI=%2Fndb%2Ffoods. Accessed on: 8SEP16.
Walter WM, Truong VD, Espinel KR (1999). Effects of puree processing methods on the textural characteristics of an alginate-texturized sweet potato product. J. Food Qual. 22:631-640.
Zhao X, Chambers E, Matta Z, Loughin TM, Carey EE (2007). Consumer sensory analysis of organically and conventionally grown vegetables. J. Food Sci. 72(2):S87-91. http://dx.doi.org/10.1111/j.1750-3841.2007.00277.x
Vol. 11(12) pp. 389-396, December 2017
DOI: 10.5897/AJFS2017.1628
Article Number: 54811B466759
ISSN 1996-0794
Copyright © 2017
Author(s) retain the copyright of this article
http://www.academicjournals.org/AJFS
African Journal of Food Science
Full Length Research Paper
Assessment of loss of carbohydrate through fermentation process of yeast
(Saccharomyces cerevisiae) from small sample of maize flour dough
Kasahun Gudeta1* and Messele Admassu2
1Department of Biology, Wato Preparatory School, P. O. Box 42718, Sebeta, Ethiopia.
2Department of Biology, Adama Science and Technology University, P.O. Box 1888, Adama, Ethiopia.
Received 13 June, 2017; Accepted 26 July, 2017
The time used for fermentation should be limited by bakers, because if fermentation takes long time, the major nutrients in food, especially cereals can be reduced. The aim of this study is to assess the amount of carbohydrate nutrients transformed by yeast cells (Sacharomyces cerevisiae) through the fermentation of maize flour dough. Lane-Eynon and iodine-thiosulfate titration methods were used to quantify the concentration of both simple sugar and starch in the samples. Twelve samples were used for the analysis; 3 were used before the fermentation and another 3 were used after the fermentation at 17, 20 and 23 h. The amounts of starch consumed by yeast cells from the samples after fermentation time (17, 20 and 23 h) were 23.97, 49.13 and 68.45%, respectively. No simple sugar was detected after 17 h of fermentation of the samples. The results revealed that a significant amount of starch was transformed. Therefore, fermentation time should not be extended to prevent loss. Key words: Maize flour, fermentation, reducing sugar, Saccharomyces cerevisiae, starch, titration.
INTRODUCTION Fermentation has been in practice for many centuries. Since it is a traditional practice, scholars do not focus on it and tend to conduct research on the aspect of fermentation with respect to loss of carbohydrate. As reported by Margaret (2008), carbohydrate is the most importantly used macronutrient by our body. Therefore, it
has to be considered to know whether fermentation process transforms carbohydrate nutrients or not. Yeast cells are living organisms that do not prepare their own food because they lack the organelle that enables them to prepare their carbon sources through photosynthesis. Therefore, nutritionally, yeasts are categorized as
*Corresponding author. E-mail: [email protected].
Author(s) agree that this article remains permanently open access under the terms of the Creative Commons Attribution
License 4.0 International License

390 Afr. J. Food Sci. heterotrophic organisms that depend on other organisms to get their energy sources (Dickinson, 1999; Madigan et al., 2003).In Ethiopia, people use traditional way to ferment food by yeast cells, and transform some amount of glucose that is found in carbohydrate food which can in turn affect the amount of glucose that should be supplied in the blood (Michael et al., 2008; Cavalieri et al., 2003). Some people after eating get hungry immediately; it seems there are parasitic worms in their intestine which compete for the vital food substances that are ready to be absorbed into their bloodstream to supply energy to their cell (Wang et al., 1980).
Both aerobic and anaerobic respirations of yeast cells transform the nutrient content of carbohydrate food. During aerobic respiration, yeast can produce significant amount of energy by decomposing all the molecules of glucose into CO2 and water (James et al., 2005; Dickinson, 1999). But, during anaerobic respiration of yeasts, less energy can be obtained. By anaerobic respiration of yeast, the glucose used as respiratory substrate cannot completely be decomposed into CO2 and H2O but is partially decomposed and forms another organic molecule alcohol (C2H5OH) and CO2 (Vouillamoz et al., 2006; McGoven et al., 2004). During preparation of injera and bread, the dough of any cereals is sealed to facilitate anaerobic respiration that results in CO2 and alcohol (Akbar et al., 2012).
As Takano et al. (2002) reported, yeasts can consume glucose through aerobic and anaerobic respiration which is consumed by human. This mean that, yeast cells indirectly can harm us by transforming the carbohydrate nutrients of vital substances as described above. The dough that has been fermented and stayed in the container changes its quality and becomes bitter or sour. This indicates that the vital substances are already transformed by the yeast cells (Akbar et al., 2012). It was stated by different scholars that as duration of fermentation increased the vital substances especially carbohydrate used as carbon source for yeast cells and its concentration decreased from the container in which it was inoculated (James et al., 2005; Dickinson, 1999; Madigan et al., 2003). Like any other intestinal parasitic organisms consuming vital substances and affecting the amount of glucose that should be consumed by our body, the yeast also would be considered as one of the organisms that could have perished our vital substances (Margaret, 2008). In this study, the effect of yeast cells on carbohydrate food was assessed and analyzed to check whether the carbohydrate lost via fermentation process is significant or not . MATERIALS AND METHODS
Experimental apparatus used
They are: digital balance, Erlenmeyer flask, conical flask, beakers,
test tubes, centrifuge, rotary evaporator, oven, burette, pipette, graduated cylinder, volumetric flask, stopper, magnetic stirrer, heater, pH detector, maize, miller and the experimental organism is Saccharomyce cerevisiae (Baker’s yeast).
Sample collection
One kilogram of maize grain sample used for analysis was bought from market of Sebeta town. Sebeta town is located in Oromia Regional State, West south of Addis Ababa at 22 km in Ethiopia. It was dried and packed into plastic bag and transported to the laboratory for analysis. The sample was ground to a fine powder to enhance solvent extraction by sample miller (DIETZ Tech West Germany, 1998).
Sample preparation of simple sugar and starch before fermentation Two hundred gram of the ground sample was soaked and defatted by 250 ml of organic chemical acetone. Then, the acetone was removed by filtration along with oil that was found in the sample and dried in dry oven to make fragile powder again. To prepare sample for simple sugar and starch analysis of unfermented samples; first, 30 g of the defatted sample of maize powder was weighed by the digital balance and kept in 3 different flask each containing 10 g of sample. It was boiled for 15 min in 50 ml of 80% ethanol to dissolve low molecular weight of carbohydrate (reducing sugar). It was separated as supernatant and residue by centrifuge that was adjusted at 3000 rpm for 10 min, and then the supernatant solution was kept in rotary evaporator to remove the alcohol. But, the residue was kept for sample preparation of starch. After all the alcohol had been evaporated by rotary evaporator from the solution, sugar solution remained in it. But in addition to sugar, it had other various small molecules that interfere with the analysis. The solution was treated by clarifying agent of 25 ml of 10% neutral lead acetate and immediately the solution changed into yellowish color which was shaken thoroughly and filtered by centrifuge into supernatant and residue. The separated supernatant from centrifuge was again treated by 10 ml of 10% potassium oxalate that resulted in white precipitate and it was separated as residue and supernatant by centrifuge at 3000 rpm for 10 min. The supernatant solution was prepared with sample of reducing sugar used for analysis by Lane-Eynon titration method. Sample preparation of simple sugar and starch after fermentation To prepare sample for analysis of simple sugar and starch after fermentation,50 ml of distilled water was boiled with 1 M of CaCl2. H20 solution; then the sample reserved for starch analysis was dissolved into the solution for 15 min to ensure the dissolution of amylopectin as adopted by Knutson (1999). The dissolved starch solution was separated from the rest residue by low speed centrifuge adjusted at 2000 rpm for 5 min as supernatant to prevent the settlement of amylose molecules down as residue. The supernatant solution obtained was prepared sample of starch used for analysis by iodine-thiosulphate titration method.
To prepare sample for starch analysis after fermentation, 90 g of defatted sample was used for analysis. Nine different flasks contain 10 g of sample each and made into solution by 50 ml of distilled water analyzed at different time of fermentation. Next, 0.01 mg colony of yeast was weighed by digital balance (S. cerevisiae)

(Akbar et al., 2012) and was inoculated in each of the flask to ferment the sample at the same time of the day (10:00 pm).
The first 3 fermented samples were analyzed at 3:00 am after 17 h of fermentation; the second 3 samples were analyzed at 6:00 am after 20 h of fermentation and the third 3 fermented samples were analyzed at 9:00 pm after 23 h of fermentation, an interval of 3 h. As described by Akbar et al. (2012), fermentation should be monitored by moisture, pH, viable yeast count, and temperature as well as dough amount or substrate used. Hence, the moisture was controlled by adding the same volume of distilled water for the 9 inoculates. The 9 inoculated samples were kept nearby and maintained in the same temperature (min=25°C and max=29°C) at room temperature for that specific date when this experiment was done. The viable yeast count was controlled by addition of the same amount of mass of the yeast cells (S. cerevisiae) (0.01 mg) into each container and the substrate or dough sample was controlled by using the same weight of sample (10 g) in each container. After the inoculates were fermented within limited time of fermentation, all the procedures that were used for sample preparation of unfermented sample were analyzed by Lane-Eynon and Iodine-thiosulphate titration method to determine the concentration of both simple sugar and starch.
Determination of simple sugar concentration
Maize accommodates insignificant amount of non-reducing sugar (sucrose). Therefore, the preferred method used to analyze low molecular weight of carbohydrate such as glucose and maltose (reducing sugar) was Lane-Eynon’s titration method. It was used to analyze reducing sugar by the principle that a burette is added to the prepared sugar solution placed in the flask containing mixed Fehlings’ solution that reacts with copper sulfate to change Cu++ to Cu+ by reduction reaction. But, the volume of sugar solution used for unfermented samples consumed in titration was beyond 50 ml. Hence, its concentration could not be calculated by using the factor described in literature as it had been determined by International Starch Institute (1999). Thus, the concentrations of simple sugar for unfermented sample were determined by derived formula.
It was determined by the description of different scholars in the literature. Dickinson (1999) stated that maize contains 1% of double sugar and 0.5% of simple sugar, and WFP (World Food Program, 2000) reported that maize contains 2 to 3% of sugar with the average of 1.5% determined conventionally in this experiment that may represent all varieties of maize. Hence, other compositions of maize grain were obtained by subtracting 1.5 from 100%, which is equal to 98.5% as a base. First, the percent mass of different nutrients in the corn grain were calculated and determined for all
the samples by using the following modified formula. X=
Where: X: is the concentration of different nutrients in maize except simple and double sugars; D: is the total percent of the nutrients in maize grain rather than double and simple sugar, M: is the mass of maize flour sample being analyzed and P: is the total percent of
nutrients in the corn grain. Thus, X=
= 9.85 g
After the mass of other composition of maize flour in 10 g of the unfermented sample had been calculated and determined, the mass of sugar in 10 g of sample was calculated by the following
formula Z=
or Z = M- X Where: Z is the concentration of
simple and double sugar determined in 10 g of the sample, S: is the average percent of simple and double sugars in maize grain, D: is the total percent of the nutrients in maize grain rather than double and simple sugar and P: is the total percent of nutrients in the
maize grain. Hence, Z =
=
= 0.15 g or 10 g - 9.85 =
0.15 g = 150 mg.
Gudeta and Admassu 391
The determinations of simple and double sugar from the samples after fermentation were made determined based on the principle reported by Akbar et al. (2012). According to the report of Akbar et al. (2012), carbohydrate nutrients are transformed through fermentation process of yeast by pecking order. First, glucose, sucrose, maltose then finally starch were transformed. Hence, it was determined that the reducing sugars which were found in the fermented maize dough samples were transformed to generate energy for the metabolic activities of yeast cells. This indicates that there is no simple sugar in fermented samples (Table 1).
Determination of starch concentration
High concentration of carbohydrate found in maize is starch that comprises 61.7% of corn grain (International Starch Institute, 1999). The chemical method used to determine starch concentration from maize sample was iodine-thiosulfate titration method that was applied by known amount of iodine (0.06 M) required for the formation of amylose-iodide inclusion complex as it was reported by Walter (1997).
The concentration of iodine was calculated by EBAS stoichiometric calculator (Marcin, 2005-2008) stoichiometrically and checked manually for all volume of Na2S2O3.5H2O used in all replication. After the mass of Iodine was determined stoichiometrically, the mass of starch was determined by the standard found in the literature. Knuston (1999) reported that concentration of starch can be calculated from the 30% of I2 that forms poly-iodide complex between starch molecules and iodine. After the mass of I2 was calculated from the moles of I2 from each ml of Na2S2O3.5H2O, the mass of starch was then calculated from the mass of I2 by using the standard in literature. According to Knutson (1999), starch accommodates 30% of I2 in polyiodide inclusion complex. Hence, the mass of starch was determined as 70% of the total inclusion
RESULTS The percent concentration of simple and double sugar was 1.5%, which was used to calculate the mass of other nutrients in 10 g of the sample and then the mass of sugars in the unfermented sample was calculated and determined as 0.15 g as indicated in Table 1. The concentration of sugar solution could not be determined from the volume of sugar solution consumed at the end point in titration. Because, the end point was not reached by consuming 15 to 50 ml of sugar solution titrated against Fehling’s solution from burette as the factor that was determined by International Starch Institute (1999) and Dunsmore et al. (1980). This was due to the presence of very less concentration of simple and double sugar that was found in the samples.
But, for the analysis of simple and double sugar after fermentation, the results were not calculated and determined from the percent concentration of sugar calculated as in the case of unfermented sample. It was determined that there were no simple and double sugars found in the fermented sample of maize dough. Based on the report of Akbar et al. (2012), the simple and double

392 Afr. J. Food Sci.
Table 1. The determined sugar concentration from corn flour sample.
Sample type of corn dough sample 1.5% of simple and double sugar concentration found in corn dough in gram
Before fermentation 0.15 g
After fermentation of 17 h -
After fermentation of 20 h -
After fermentation of 23 h -
Table 2. The corn flour sample analysis result before fermentation.
Volume of Na2S2O3.5H2O
used in titration from burette (ml)
Moles of Na2S2O3.5H2O in titrated ml and made
reaction (moles)
Moles of I2 from titrated Na2S2O3.5H2O in titrated volume (moles)
30% mass of I2 in Amylose-Iodide
complex (g)
70% mass of starch in amylose-iodide complex (g)
12 0.001454 0.000727 0.184658 0.430869
11.5 0.001391 0.000695 0.17653 0.411903
12 0.001454 0.000727 0.184658 0.430869
Mean 0.4245
Table 3. The corn flour dough sample analysis result after fermentation of 17 h.
Volume of Na2S2O3.5H2O
used in titration from burette (ml)
Moles of Na2S2O3.5H2O in
titrated ml and made reaction (moles)
Moles of I2 from titrated Na2S2O3.5H2O
in titrated volume (moles)
30% mass of I2 in amylose-Iodide
complex (g)
70% mass of starch in amylose-iodide
complex (g)
9.5 0.001149 0.000575 0.14605 0.340783
9 0.001089 0.000545 0.13843 0.323003
8.5 0.001028 0.000514 0.130556 0.304631
Mean
0.3229
sugars are completely transformed through the fermentation process by yeast cells. Hence, it was determined that the reducing sugars which were found in the fermented maize dough samples were transformed to generate energy through the metabolic activities of yeast cells (Gerald, 2003) (Table 1).
During the unfermented sample analysis, 12, 11.5 and 12 ml volume of Na2S2O3.5H2O were consumed in titration to change the blue black color solution of poly-Iodide complex into color less solution in the conical flask at three replications. The moles of Na2S2O3.5H2O in the volume of the three repeated titrations were 0.001454, 0.001391 and 0.001454 respectively. The moles of I2 in titrated volume of Na2S2O3.5H2O solution were 0.000727, 0.000695 and 0.000727. The calculated masses of I2 from moles of I2 were: 0.184658, 0.176539 and 0.184658 g, respectively. The mass of starch calculated in the 3 replications was 0.430869, 0.411903 and 0.430869 g with the mean value of 0.4245 g (Table 2). The data in Table 3 showed that the result obtained from the sample was fermented for 17 h fermentation time. The data were
calculated from each volume of Na2S2O3.5H2O consumed at the end point during titrations. The volumes of Na2S2O3.5H2O were 9.5, 9 and 8.5 ml for the three replications. From the volume of Na2S2O3.5H2O consumed during titration of iodine-thiosulfate titration method, the moles of thiosulfate were calculated as 0.001149, 0.001089 and 0.001028, respectively. From the calculated moles of thiosulfate, the moles of I2 were calculated as 0.000575, 0.000545 and 0.000514 for the three volume of Na2S2O3.5H2O consumed in the titration, respectively. From the number of moles of I2, mass of I2 was calculated stoichiometrically as 0.14605, 0.138443 and 0.130556 g from which the mass of starch again was calculated as 0.340783, 0.323003 and 0.304631 g, respectively with the mean value of 0.3229 g.
The results that were obtained from fermented samples after 20 h of fermentation time are presented in Table 4. The results calculated from the volume of Na2S2O3.5H2O consumed at the end point in titration were 5.5, 6 and 6.5 ml for the three replications performed. The moles of thiosulfate were 0.000665, 0.000725 and 0.000786; the

Gudeta and Admassu 393
Table 4. The corn flour dough sample analysis result after fermentation of 20 h.
Volume of Na2S2O3.5H2O
used in titration from burette (ml)
Moles of Na2S2O3.5H2O
in titrated ml and made reaction
(moles)
Moles of I2 from titrated Na2S2O3.5H2O i
n titrated volume (moles)
30% mass of I2 in amylose-Iodide
complex (g)
70% mass of starch in amylose-iodide
complex (g)
5.5 0.000665 0.000335 0.08509 0.198543
6 0.000725 0.000365 0.09271 0.216323
6.5 0.000786 0.000393 0.099822 0.232918
Mean
0.2159
Table 5. The corn flour dough sample analysis result after fermentation for 23 h.
Volume of Na2S2O3.5H2O used in titration from burette (ml)
Moles of Na2S2O3.5H2O in titrated ml and made
reaction (moles)
Moles of I2 from titrated Na2S2O3.5H2O in
titrated volume (moles)
30% mass of I2 in amylose-Iodide
complex (g)
70% mass of starch in amylose- iodide complex i(g)
3.5 0.000423 0.000212 0.053848 0.125645
4.2 0.000508 0.000254 0.064516 0.150537
3.5 0.000423 0.000212 0.053848 0.125645
Mean
0.1339
Table 6. Description of transformed starch in each fermentation time interval.
First fermentation interval Second fermentation
time interval Third fermentation
time interval
Final status at end
Am
ou
nt
de
term
ine
d i
n
un
ferm
en
ted
sa
mp
le
Me
an
va
lue
aft
er
17
h
Dif
fere
nc
e
Tra
ns
form
ed
(%)
Me
an
va
lue
20
h
Dif
fere
nc
e
Tra
ns
form
ed
(%)
Me
an
va
lue
23
h
Dif
fere
nc
e
Tra
ns
form
ed
(%)
To
tal
lo
st
To
tal
rem
ain
g
Su
m
0.4
245
g
0.3
229
g
0.1
016
g
23
.97
0.2
159
g
0.1
07
g
25
.17
0.1
339
g
0.0
82
g
19
.31
68
.45
31
.55
10
0
moles of iodine were 0.000335, 0.000365 and 0.000395. From the moles of I2, the mass of I2 in the volume of Na2S2O3.5H2O consumed during titration was calculated stoichiometrically and therefore, the mass of I2 was 0.08509, 0.099822 and 0.099822 g, respectively. The mass of starch again was calculated from the mass of I as 0.198543, 0.216323 and 0.232918 g with the mean value of 0.2159 g. From the sample fermented for 23 h, the moles of thiosulfate were calculated stoichiometrically from the volume of Na2S2O3.5H2O consumed during titration at the end point where: 3.5, 4.2 and 3.5 ml for three replications; the moles of thiosulfate were calculated stoichiometrically as 0.000423, 0.000508, 0.000423 and then from the moles of thiosulfate, the
moles of I2 were also calculated with the output of: 0.000212, 0.000254 and 0.000212. The mass of I2 was again computed from the moles of I2 stoichiometrically as 0.053848, 0.064516 and 0.053848 g, respectively. The 70% mass of starch was calculated as in the case mentioned above from literature and was determined from the mass of I2 as 0.125645, 0.150537 and 0.125645 g with the mean value of 0.1339 g (Table 5).
Table 6 showed that the mean value of starch concentration calculated from unfermented samples was 0.4245 g. The mean value of concentration of starch calculated in the sample fermented for 17 hrs was 0.3229 g with the difference of 0.1016 g (23.97%). In the second fermentation time interval, the mean value of starch

394 Afr. J. Food Sci. Table 7. Description of total transformed starch in each fermentation time interval.
First fermentation interval Second fermentation time
interval Third fermentation time
interval Final status
at end
Am
ou
nt
de
term
ine
d i
n
un
ferm
en
ted
sa
mp
le
Me
an
va
lue
aft
er
17
h
Dif
fere
nc
e
Tra
ns
form
ed
(%)
Me
an
va
lue
20
h
Dif
fere
nc
e
To
tal
lo
st
Tra
ns
form
ed
(%)
Me
an
va
lue
23
h
dif
fere
nce
To
tal
lo
st
Tra
ns
form
ed
(%)
To
tal
rem
ain
ed
Su
m
0.4
245
g
0.3
229
g
0.1
016
g
23
.97
0.2
159
g
0.1
07
g
0.2
086
g
49
. 1
3
0.1
339
g
0.0
819
g
0.2
906
g
68
.45
31
.55
10
0
Table 8. The summarized concentration of starch before and after fermentation (values are mean±sd).
Types of sample Transformed (%) Mean value (g) Mean ± SD per 10 g
Before fermentation - 0.424547 0.4245 ± 0.0110
After fermentation of 17 h 23.97 0.322806 0.3229 ± 0.0181
After fermentation of 20 h 25.17 0.215928 0.2159 ± 0.0172
After fermentation of 23 h 19.31 0.133946 0.1339 ± 0.0144
concentration calculated from the sample fermented for 17 h was 0.3229 g. The mean value of starch concentration calculated from the samples fermented for 20 h was 0.2159 g and the difference between the two was 0.107 g (25.17%). During the third fermentation time interval, the mean value of starch concentration calculated for the sample fermented for 20 h was 0.2159 g; and the mean value calculated from the sample fermented for 23 h was 0.1339 g and the difference between is 0.082 g with the percent loss of 19.31%. Table 7 indicated that the total percent of starch was transformed in each fermentation interval. In 17 h of fermentation, 0.1016 g (23.97%) of starch was transformed. In the sample fermented for 20 h of fermentation time, 0.2086 g (49.13%) of starch was transformed and from the sample fermented for 23 h of fermentation time, 0.2906 g (68.45%) of starch was transformed from the total starch concentration determined in unfermented sample (0.4245 g). Table 8 shows the percent of transformed starch during each fermentation time, the mean value obtained and mean ± sd.
Figure 1 shows that the mean values of starch for each fermentation time were declined. Before fermentation, it was 0.4245 g; after fermentation of 17 h, it was 0.2329 g; after fermentation time of 20 h, it was 0.2159 g and after fermentation of 23 h, it was 0.1339 g. The figure clearly indicated that the concentration of starch depleted as the time of fermentation extended.
DISCUSSION The finding of this research showed that the carbohydrate concentration of maize flour before fermentation and after different fermentation time to assess the amount transformed. From the data that were assessed from unfermented samples, 4.25% of starch was determined from amylose-iodide inclusion after analysis that was calculated by dividing 0.4245 g by 10 g and then multiplying by 100. According to International Starch Institute (1999), the percent concentration of starch in maize is 61.7% and in another research, it was recently reported that the total carbohydrate concentration in maize grain determined was between the ranges of 44.7 and 69.60% (Sule et al., 2014).
According to the result of this study, the percent concentration of starch extracted from unfermented maize dough sample was 4.25% that did not match with the percent concentration determined by International Starch Institute (1999) (Table 2). This was due to short period of sonication time which was only 15 min that resulted in incomplete dissolution of starch. If the sonication duration was extended from 15 to 30 min or above, the concentration of starch (amylose) that form poly-iodide complex increased and the percent concentration that was determined in this study could also be increased. The second reason could also be the presence of 19% of resistant starch in maize that did not dissolve by using CaCl2.2H2O as a solvent, even if, the

Gudeta and Admassu 395
Figure 1. Raw data indicating starch lost by S. cerevisiae as the time of fermentation extended.
sonication time increased (International Starch Institute, 1999). The miller machine might not be able to grind the grain into very fine powder. As a result the molecules of starch could not be extracted from the matrix of maize dough sample.
Tables 2 to 5 indicated the mean value of unfermented sample and the mean value of fermented samples for each fermentation time. Before fermentation, it was 0.4245 g, after fermentation of 17 h the mean value was 0.3229 g, after fermentation of 20 h it was 0.2159 g and after fermentation of 23 h it was 0.1339 g, indicating the depletion of starch molecules as the duration of fermentation extended.
According to the results of this study, simple and double sugars in fermented sample were consumed by yeast cells during the first interval of fermentation time. Yeast cells (S. cerevisiae) ability to secrete different types of enzyme depends on the complexity of carbohydrate (Akbar et al., 2012; Obri, 1994). Yeast cells use from the simplest form of carbohydrates to the most complex form of carbohydrates by pecking order. Glucose is used by yeast cells on the first line; sucrose, the second, maltose, the third and finally starch that is transformed. Therefore, in the fermented sample, there were no simple and double sugars detected. The amount of simple and double sugar molecules was totally absent in the fermented sample because, after all simple and double sugar was consumed by yeast cells, starch molecules began to be transformed. The transformation of starch indicated that all simple sugars were transformed into alcohol and carbondioxide (Akbar et al., 2012).
The percent of transformed starch increased during 20 h of fermentation time from 23.97 to 25.17% because the yeast cells adapted well to their environment that has got plenty of resources. They multiplied to increase their number, resulting in higher rate of transformation of carbohydrate (Alton et al., 2002). But, during 23 h of fermentation time, it was again decreased from 25.17 to 19.31% because, the viable yeast count increased and the carrying capacity was reached. Not only was the carrying capacity reached because the resources depleted, but also due to the waste discharged from metabolic activity of yeast cells reduced the rate of the metabolic activity of the yeast cells (Table 6). This indicated the general trends of time and condition of population growth reported by Alton et al. (2002). From the amount of starch that was found in the sample, 23.97% of starch was transformed after 17 h of fermentation time. 49.13% of starch was transformed from the sample fermented after 20 h of fermentation time and 68.45% of starch was transformed after 23 h of fermentation time. During the first time of fermentation (17 h of fermentation time), 0.1016 g (23.97%) of starch was transformed; during the second time of fermentation (20 h of fermentation time) 0.2086 g or 49.13% of starch was transformed and during the third time of fermentation (23 h of fermentation) 0.2906 g or 68.45% of starch molecules was transformed. This indicated that much amount of starch molecules was found in the sample transformed and used for the carbon sources of yeast cells as the time duration of fermentation extended. This agrees with the report indicated in literature that as the carrying capacity was reached the rate of metabolic
0
0.05
0.1
0.15
0.2
0.25
0.3
0.35
0.4
0.45
Before fermrntation After fermentation of17 hrs
After fermentation of20 hrs
After fermentation of23 hrs
Star
ch c
on
cen
trat
ion
Fermentation intervals

396 Afr. J. Food Sci. activities also minimized (Alton et al., 2002) (Table 7). CONCLUSION AND RECOMMENDATIONS After the mass of starch that was found in all samples were calculated and determined, it was concluded that significant amount of vital substances was wasted by the consumption of yeast cells (S. cerrvisiae) if the duration of fermentation is elongated by the bakers of injera and bread from flour of maize grain. The depletion of starch molecules indicated that the simple sugar was already consumed by the yeast cell. The finding of the study revealed that significant concentrations of starch vital substances of carbohydrate were transformed and consumed by yeast cells as the time of fermentation extended. Therefore, the bakers should not use extended time of fermentation to save the amount of starch lost via fermentation. CONFLICT OF INTERESTS The authors declare that there is no interest of conflicts. ACKNOWLEDGEMENTS The authors thank Addis Ababa University for permitting the science laboratory to perform the extraction and analysis processes. They also thank Adama Science and Technology University for the financial support. REFERENCES
Akbar A, Aamir S, Moazzam RK, Muhammad A, Muhammad RA
(2012). Yeast, its types and role in fermentation during bread making process. Pak. J. Food Sci. 22(3):171-179
Alton B, Kathleen G, Whitney CH, Chris K, Linda L, Peter R (2002). The Dynamics of Life. National Geographic Society. Columbus USA. pp. 96-99p.
Cavalieri D, McGovern PE, Hartl Dl, Mortimer R, Polsinelli M (2003). Evidence for S. cerevisiae fermentation in ancient wine. J. Mol. Evol. 57(1):S226-S232.
Dickinson R (1999). Carbon Metabolism the Metabolism and Molecular
Physiology of Saccharomyces cerevisiae. Philadelphia, P. A. Taylor and Francis.
Dunsmore A, Mellet P, Wolf M (1980). Some Factor Affecting the Lane and Eynon Titration method for determining Reducing Sugars in Sugar products. Sugar Milingling Research Institute. pp. 72-76.
Gerald K (2003). Cell and Molecular Biology Concepts and Experiment.3
rd edition. Johnwiley and sons, inc.New York. 112p.
International Starch Institute (1999). Determination of reducing power and DE by Lane Eynon’s Method. Science Park Aarhus, Denmark.
James M, Martin J, David A (2005). Food Microbiology. 7th
edition.Singer science business media, Inc, 233 spring street, New York. P 31.
Knutson CA (1999). Evaluation of variation in Amylose. Iodine Absorbance Spectra. Bio. Pros.Res. 42:65-72.
Madigan MT, Martinko JM, Parker J (2003). Brock Bilogy of Microorganisms, 10
th edition, pearson Education Inc.
Marcin B (2005-2008). Bpp Marcin Borkowiski ul. Archite ktow 14 05-270 Marki poland (http://f 30. X8top. Net retrined on July 15, 2017 Adama.
Margaret M (2008). Body Fuel for Healthy Body’s Fat and Oil. Trisha sertori. printed in china Hong Kong. 14p.
McGoven E, Zhang J, Zhang Z, Hall G, Moreau R, Nunez A, Butrym E, Richards P, Wang S, Cheng Z, Wang C (2004). Fermented beverages of pre-and proto-historic China. National Acad. Sci. 101 (51): 17593-17598.
Michael J, Pelczar J, Chan R, Krieg L (2008). Microbiology. 37th edition
Mcgraw hill publishing company limited. New York. pp. 624-626. Obri KD (1994). Microbial studies on Corn Dough fermentation.
American Association of cereal chemists. J. Cereal Chem. 71(2):186-188).
Sule EI, Umoh VJ, Whong MZ, Abudullahi IO, Alabi O (2014). Chemical and nutritional value of maize and maize products obtained from selected market in Kaduna state, Nigeria. Afr. J. Food Sci. technol. 5(4):100- 104.
Takano H, Naito S, Ishida N, Koizumi M, Kano H (2002). Fermentation process and grain structure of baked bread from frozen dough using freez-tolerant yeast. J. Food Sci. 67(7):2725-33.
Vouillamoz JF, McGovern PE, Ergul A, Soylemezoglu G K, Tevzadze G, Meredith CP & Grando MS (2006). Genetic characterization and relationships of traditional grape cultivars from Transcaucasia and Anatolia. Plant Genetic Resources: characterization and utilization. 4 (2):144p.
Walter S (1997). Kanasa Academy of Science. Transaction of the Kanasa academy of Sceince. Method Determination Starch 28:172-174.
Wang L, Swain E, Hesseltine C (1980). Phytase of molds used in oriental food fermentation. J. Food Sci. 45(5):1262.
World Food Program (2000). Percentage concentration of carbohydrate nutrients in corn grain.

African Journal of
Food Science
Related Journals Published by Academic Journals African Journal of Microbiology Research African Journal of Plant Science International Journal of Genetics and Molecular Biology Journal of Cell and Animal Biology