volume 2: responses to management questions · volume 2: responses to management questions . ......
TRANSCRIPT

EFFECTS OF WATER PROJECT
OPERATIONS ON JUVENILE SALMONID
MIGRATION AND SURVIVAL IN THE
SOUTH DELTA
Volume 2: Responses to Management Questions
Prepared for: Collaborative Adaptive Management Team
Prepared by: Salmonid Scoping Team
January 2017

Volume 2: Responses to Management Questions Final
SALMONID SCOPING TEAM
This report has been prepared through a collaborative process involving technical experts participating on the Collaborative Adaptive Management Team (CAMT) Salmonid Scoping Team (SST). SST participants contributing to the report include John Ferguson (Co-chair), Anchor QEA, LLC; Chuck Hanson (Co-chair), Hanson Environmental, Inc.; Mike Schiewe (Co-chair retired), Anchor QEA, LLC; Pat Brandes, U.S. Fish and Wildlife Service; Rebecca Buchanan, University of Washington; Barbara Byrne, National Marine Fisheries Service; Sheila Greene, Westlands Water District; Brett Harvey, California Department of Water Resources; Rene Henery, Trout Unlimited; Joshua Israel, U.S. Bureau of Reclamation; Daniel Kratville, California Department of Fish and Wildlife; J. Michael Harty, Kearns & West; Joe Miller, Anchor QEA, LLC; Meiling Roddam, National Marine Fisheries Service1; and Briana Seapy, Kearns & West. Bruce DiGennaro has been instrumental in assisting with the preparation of this report. ACKNOWLEDGEMENTS
The SST would like to acknowledge the contribution and constructive comments provided by CAMT on earlier drafts of this review of the effects of water project operations on juvenile salmonid migration and survival in the South Delta. This report also benefited from the contributions of non-SST scientists familiar with Sacramento-San Joaquin River Delta hydrodynamics and hydrodynamic simulation modeling. Outside experts that contributed to the analysis included John DeGeorge and Stacie Grinbergs from Resource Management Associates, Jon Burau from U.S. Geological Survey, Tara Smith and Xiaochun Wang from California Department of Water Resources (DWR), Paul Hutton from Metropolitan Water District, Alison Febbo from the State Water Contractors, Tom Boardman from Westlands Water District, and Brad Cavallo from Cramer Fish Sciences. These outside experts also assisted in the analysis, presentation, and interpretation of available data, assessed the appropriate application of modeling tools and their limitations and constraints, and provided internal review of synthesis and summary of information related specifically to hydrodynamic modeling developed by the SST as part of the gap analysis technical report. In addition, the SST acknowledges and greatly appreciates Bruce DiGennaro’s significant contributions to this report; he participated in numerous SST discussions and the development of the primary findings and gaps, provided a direct and clear linkage between the SST and CAMT discussions, and conducted a technical edit of Volume 1 and Volume 2. The SST greatly appreciates the input from these external contributors.
1 Currently with State Water Resources Control Board

Volume 2: Responses to Management Questions Final
ES-1
EXECUTIVE SUMMARY
The Collaborative Adaptive Management Team (CAMT) requested that the Salmonid Scoping Team (SST) examine eight key management questions associated with the effects of water project operations on juvenile salmonid migration and survival through the Sacramento-San Joaquin River Delta, with an emphasis on effects within the South Delta (defined as the San Joaquin River and channels west and south of the San Joaquin River). Findings are summarized below. Export Effects on Flows and Velocities in the Delta
Based on hydrodynamic simulation modeling, the effect of State Water Project (SWP) and Central Valley Project (CVP) exports on flow and velocity varies with distance from the export facilities, export level, inflow, and tides. Exports have almost no effect on distributary flow at junctions such as Georgiana Slough leading off the Sacramento River toward the San Joaquin River, and a very small effect on distributary flow at junctions leading off the San Joaquin River, with the exception of the head of Old River. Within the South Delta, exports have a large effect in Old River. Effects are less in Middle River and even less in the San Joaquin River mainstem. Effects of Exports and Inflows on San Joaquin River Juvenile Survival
There is no strong evidence of a relationship between the combined export rate from CVP and SWP and survival of San Joaquin River-origin fall-run Chinook salmon through the Delta. Similarly, there is no well-defined pattern of survival of San Joaquin River steelhead relative to exports, but data are very limited. There is, however, limited evidence of a negative relationship between exports and juvenile salmon survival between Turner Cut and Chipps Island (all routes combined), with lower survival at higher exports, although there is considerable variability in survival at low levels of exports and few observations at high levels of exports (based on SST scatterplots) (Appendix E, Figure E.6-4). There is evidence of a positive relationship between inflow and survival of San Joaquin River fall-run Chinook salmon in some portions of the Delta, based on preliminary analysis of SST scatterplots; most of these data were collected without the physical barrier in place at the head of Old River. Survival in the San Joaquin River from Mossdale to Turner Cut tends to be higher for higher levels of inflow. However, survival from Turner Cut to Chipps Island (all routes combined) tends to be lower for higher levels of inflow (based on SST scatterplots). Survival of San Joaquin River steelhead increased from the Turner Cut junction to Chipps Island, and overall from Mossdale to Chipps Island, for high levels of San Joaquin River inflow (based on SST scatterplots), but available data are limited to only two years.

Volume 2: Responses to Management Questions Final
ES-2
A positive relationship has been found between April and May ratios of inflow to exports (I:E) and through-Delta survival of San Joaquin River fall-run Chinook salmon when the Head of Old River Barrier (HORB) is in place. Survival in the San Joaquin River from Mossdale to the Turner Cut junction tends to increase for higher I:E values. Data for the tidal portion of the Delta are mixed, with Chinook salmon survival being highest for an I:E ratio of approximately 2, and lowest for I:E ratios of approximately 1 or greater than 4. Steelhead survival in the South Delta tended to increase at higher levels of I:E, but observations are limited. The high correlation between inflow and exports limits the ability to evaluate survival over a range of I:E ratios. January 1 Onset of OMR Reverse Flow Management
Results of salmonid monitoring in the Sacramento River and San Joaquin River have shown that the seasonal timing of Delta entry for juvenile Endangered Species Act (ESA)-listed salmonids varies among years. Although not capturing the seasonal variation in juvenile movement, the January 1 onset of Old and Middle rivers (OMR) reverse flow management coincides with the presence of winter-run Chinook salmon in most years, spring-run Chinook salmon in many years, and steelhead in some years (Figures 4-1, 4-2, 4-3, and 4-4 in Section 4). If OMR reverse flow management were initiated based on first detection in the Delta rather than a fixed date, OMR reverse flow management would often begin earlier than January 1 for the protection of winter-run or spring-run Chinook salmon, and later than January 1 for the protection of steelhead. The January 1 trigger date provides a general approximation of a date by which juvenile winter-run Chinook have likely entered the Delta and, based on its simplicity for triggering management actions, has utility. An OMR flow of -5,000 cubic feet per second (cfs) limits the effect of exports at distributary junctions leading into the Interior Delta off the Sacramento and San Joaquin rivers. Within the interior channels of the South Delta, the OMR reverse flow limit is likely less effective at preventing or minimizing export effects on juvenile routing and residence times. There is inadequate empirical evidence from fish tracking studies to more precisely evaluate junction-specific relationships between distributary flow changes and changes in fish routing and survival. As a result, there is uncertainty in relating OMR reverse flow thresholds to overall through-Delta survival. The SST identified two technical disagreements regarding OMR reverse flow management: 1) whether improved protection of Sacramento River salmonid populations would result from an earlier onset of OMR reverse flow management based on monitoring data from Sacramento River locations (SST members disagreed over whether the data provided in this report supported such a statement); and 2) whether limiting OMR flow to -5,000 cfs is effective at preventing increased routing into the Interior Delta and (presumably) increasing survival (SST members disagreed over whether the data provided in Volume 1 or this report

Volume 2: Responses to Management Questions Final
ES-3
supported such a statement; that is, some felt the discussion and conclusion were based primarily on conceptual model predictions and reasoning, not on factual analysis). Salvage-density-based Export Restrictions
Salvage data indicate that juvenile loss at the export facilities, an estimate of mortality directly attributable to export operations, is greater during periods of more negative OMR flows. Therefore, density-based export restrictions are likely to reduce direct mortality (take) at the export facilities. Survival studies conducted to date have not been designed to measure route-specific survival at a scale that could resolve how survival along interior channels of the South Delta changes within the specific range of hydrodynamic changes governed by density-based export restrictions (e.g., OMR flow changes between -2,500 and -5,000 cfs). Therefore, there is little information to determine the effectiveness of density-based export restrictions on survival rates of juvenile salmonids that have entered this region of the Delta. Short-term restrictions of exports resulting in OMR flows more positive than the -5,000 cfs OMR reverse flow limit may do little to improve through-Delta survival for Chinook salmon due to low overall survival, but may improve juvenile steelhead through-Delta survival. There were disagreements within the SST regarding the following: 1) whether short-term restrictions of exports resulting in OMR flows more positive than -5,000 cfs would improve through-Delta survival for Chinook salmon (some SST members felt that, because there is no evidence of the effects of OMR reverse flow restrictions on survival, there is no evidence that the continued OMR reverse flow restrictions will affect survival); and 2) whether to include the hypothesis that the influence of exports on habitat may have a stronger effect on survival than the influence of exports on short-term hydrodynamics (because the argument is based on reasoning and not data analysis). Alternative Flow Metrics
The SST identified the following five metrics that could be developed and tested to potentially help refine water project operations to improve juvenile salmonid survival through the Delta: 1) Qwest; 2) hydraulic residence times; 3) percentage time flow is positive (i.e., in a downstream direction) in Old River, Middle River, and other South Delta locations; 4) proportion of CVP exports relative to total export level; and 5) proportion of Sacramento River water arriving at the export facilities relative to the total volume of Sacramento River flow entering the Delta.

Volume 2: Responses to Management Questions Final
ES-4
Biological Response Metrics
The SST identified the following eight biological metrics that could be developed and tested for assessing the effectiveness of management actions to improve juvenile salmonid survival through the Delta: 1) proportion of test fish at specific channel junctions that enter the Interior Delta; 2) survival within specific reaches or to specific locations within the Delta; 3) survival through the Delta; 4) condition of fish sampled above, within (at salvage facilities), and below the Delta; 5) proportion of returning adults that display extended Delta rearing as fry based on otolith analysis; 6) predicted risk that a juvenile salmonid would be entrained at the export facilities based on models; 7) percentage of direct (salvage) mortality relative to estimated population abundance; and 8) abundance of salmon populations leaving the Delta, or locations further downstream (e.g., Benicia or Golden Gate bridge). There was a disagreement within the SST over whether to recommend that Passive Integrated Transponder (PIT) tag technologies be applied to the Delta to facilitate monitoring of biological metrics. Some SST members believe PIT tags could expand the available evaluation methodologies, while others believe the technology will not provide any better information than is currently available through existing methodologies. Use of Available Hydrodynamic Models
The applicability of simulation models for addressing biological management issues in the Delta depends on the specific objectives of the question being addressed. The choice of an appropriate model is dependent on the spatial and temporal resolution required, complexity of hydrodynamic conditions being investigated, availability of calibration data, and availability of financial and computational resources. The hydrodynamic models perform well in terms of informing the physical changes for which they were developed, and are used for informing physical changes at locations where the models validate well. However, the models have not been, and need to be, assessed as to whether they are appropriate for evaluating hydrodynamic or water quality conditions that might affect fish migration behavior and responses to physical conditions at the spatial and temporal scales needed for such evaluations. The one-dimensional (1-D) Delta Simulation Model 2 (DSM2) hydrodynamic model (Hydro) performs well when daily average and longer flow and velocity predictions are useful, when flow mass balance across Delta regions and seasonal periods are useful, and in riverine reaches. However, this model may not provide the degree of resolution needed to represent short-term velocities (e.g., at 15-minute time steps or less), particularly at complex South Delta channel junctions, and in areas where hydrodynamics are dominated by tidal conditions. Higher dimensional two-dimensional (2-D) or three-dimensional (3-D) models are most useful where complex hydrodynamic conditions exist. In some cases, the use of 2-D simulation models may be more appropriate and cost-effective than 3-D models. Well

Volume 2: Responses to Management Questions Final
ES-5
calibrated 1- or 2-D models may perform better for many applications than poorly calibrated 3-D models. 3-D models require more field data measurements for model boundary conditions, calibration, and validation. Tests Using Hatchery-reared Fall-run Chinook Salmon
Most surrogate relationships used in the Delta have not been directly evaluated. In studies where a surrogate is used, defining the assumptions and the extent to which they have been tested is an important step for interpreting results. However, until target populations are abundant or permitted for use in studies, the use of surrogates and questions about their use will continue. Limited comparisons of migration behavior and survival for various surrogates have begun. For example, recent studies provide an opportunity to assess whether hatchery salmon from the Merced River are representative of hatchery steelhead from the Mokelumne River released in the lower San Joaquin River. Survival and migration studies for hatchery-produced juvenile winter-run Chinook salmon have also begun in recent years. Few survival or migration studies have been conducted, to date, using wild Central Valley salmonids because of the difficulty in getting enough wild fish for a meaningful study. There were no areas of formal scientific disagreement among SST members regarding the use of surrogates. However, there is disagreement among scientists about the usefulness of performing surrogacy comparisons in situations where only some of the pertinent types of surrogacy can be evaluated.

Volume 2: Responses to Management Questions Final
i
TABLE OF CONTENTS Page
1.0 INTRODUCTION........................................................................................................ 1
2.0 MANAGEMENT QUESTION 1 .................................................................................... 1
2.1 Conclusions ......................................................................................................... 2 2.1.1 Export and Inflow Effects ........................................................................ 2 2.1.2 Georgiana Slough .................................................................................... 4 2.1.3 Clifton Court Forebay Radial Gate Operations ....................................... 5 2.1.4 South Delta Temporary Barriers ............................................................. 5
2.2 Discussion of How Well the Data Informed the Question ................................. 5 2.3 Areas of Technical Disagreement ....................................................................... 6
3.0 MANAGEMENT QUESTION 2 .................................................................................... 6
3.1 Conclusions ......................................................................................................... 6 3.1.1 Chinook Salmon ...................................................................................... 6 3.1.2 Steelhead ................................................................................................. 7
3.2 Discussion ........................................................................................................... 8 3.2.1 Water Exports ......................................................................................... 8 3.2.2 Inflows ................................................................................................... 12 3.2.3 April and May I:E Effects ...................................................................... 17
3.3 Areas of Technical Disagreement ..................................................................... 20
4.0 MANAGEMENT QUESTION 3 ................................................................................... 20
4.1 Conclusions ....................................................................................................... 20 4.1.1 January 1 Onset of OMR Reverse Flow Management........................... 20 4.1.2 OMR Flow Limit of -5,000 cfs ............................................................... 25
4.2 Discussion of How Well the Data Informed the Question ............................... 28 4.3 Areas of Technical Disagreement and Uncertainty .......................................... 28
5.0 MANAGEMENT QUESTION 4 ................................................................................... 29
5.1 Conclusions ....................................................................................................... 29 5.1.1 Effects of Density-Based Export Restrictions on Direct and
Indirect Mortality ......................................................................... 29 5.1.2 Effects of Short-Term Restrictions of Exports Relative to
Low Overall Survival .................................................................... 31 5.1.3 Hypothesized Mechanisms of Exports Influence .................................. 32 5.1.4 Effects of Exports on Delta Habitat ....................................................... 33
5.2 Discussion of How Well the Data Informed the Question ............................... 34 5.3 Areas of Technical Disagreement and Uncertainty .......................................... 34
6.0 MANAGEMENT QUESTION 5 ................................................................................... 35
6.1 Additional Metrics ............................................................................................ 35

Volume 2: Responses to Management Questions Final
ii
6.1.1 Qwest..................................................................................................... 35 6.1.2 Hydraulic Residence Time in The South Delta ..................................... 35 6.1.3 Percentage of Positive (Downstream) Flow in Old River,
Middle River, and Other Interior Delta Locations ....................... 37 6.1.4 The Relative Proportion of CVP Exports During the Juvenile
Salmonid Migration Period........................................................... 38 6.1.5 Proportion of Sacramento River Water Arriving at Export
Facilities ........................................................................................ 38 6.2 Areas of Technical Disagreement ..................................................................... 39
7.0 MANAGEMENT QUESTION 6 ................................................................................... 40
7.1 Additional Metrics ............................................................................................ 41 7.1.1 Fish Routing into the Interior Delta Under Various
Operations .................................................................................... 41 7.1.2 Survival at the Route and Reach Scale .................................................. 41 7.1.3 Survival at the Delta Scale ..................................................................... 42 7.1.4 Condition of Fish Entering and Leaving the Delta................................ 43 7.1.5 Contribution of Fry Rearing to Survival and Adult
Production .................................................................................... 43 7.1.6 Probability of Export Facility Entrainment .......................................... 45 7.1.7 Estimating Direct (Salvage) Mortality Relative to Overall
Population Abundance ................................................................. 45 7.1.8 Juvenile Abundance at Chipps Island or Locations Further
Downstream Needed for Population-Level Context .................... 46 7.2 Areas of Technical Disagreement ..................................................................... 47
8.0 MANAGEMENT QUESTION 7 ................................................................................... 47
8.1 Conclusions ....................................................................................................... 47 8.1.1 The Strengths and Limitations of Each Model Govern Their
Utility............................................................................................ 47 8.1.2 Higher Dimensional Models are Most Useful Where
Complex Environmental Conditions Exist ................................... 48 8.1.3 The Availability of Field Data Measurements and Calibration
Data is an Important Consideration for Selecting the Best Model .................................................................................... 48
8.2 Model Descriptions and Limitations ................................................................. 49 8.3 Discussion of How Well the Data Informed the Question ............................... 50
8.3.1 Applicability of DSM2 Predictions Related to Salmon Migrations ..................................................................................... 50
8.3.2 Calibration with Limited Bathymetric Data ......................................... 50 8.4 Areas of Technical Disagreement ..................................................................... 51
9.0 MANAGEMENT QUESTION 8 ................................................................................... 51

Volume 2: Responses to Management Questions Final
iii
9.1 Conclusions ....................................................................................................... 52 9.1.1 Representative Assumptions Should Be Tested ..................................... 52 9.1.2 Representative Assumptions are Study Specific .................................... 52 9.1.3 The Use of Surrogates Reflects the Rarity of Natural-Origin
Target Species ............................................................................... 52 9.1.4 The Development of Correction Factors Will Require
Additional Study ........................................................................... 53 9.1.5 The Evaluation of Some Surrogacy Assumptions Is
Underway ..................................................................................... 53 9.2 Discussion of How Well the Data Informed the Question ............................... 53 9.3 Summary ........................................................................................................... 53 9.4 Areas of Technical Disagreement ..................................................................... 54
9.4.1 Acceptability of Surrogate Data ............................................................ 54 9.4.2 Level of Effort and Resources Required for Testing
Assumptions.................................................................................. 54 9.4.3 The Range of Valid Surrogacy Comparisons ......................................... 55
10.0 REFERENCES ....................................................................................... 55
LIST OF FIGURES
Figure 2-1. Daily Average Flow at Each DSM2 Node at Three Export Rates and
Three Delta Inflow Rates ...................................................................................................3 Figure 4-1. Migration Timing of Non-Clipped, Winter-Run-Sized Chinook Salmon
Originating from the Sacramento River and Its Tributaries ............................................ 21 Figure 4-2. Migration Timing of Non-Clipped, Spring-Run-Sized Chinook Salmon
Originating from the Sacramento River and Its Tributaries ............................................ 23 Figure 4-3. Migration Timing of Non-Clipped Steelhead (O. Mykiss) Originating from
the Sacramento River and Its Tributaries ......................................................................... 23 Figure 4-4. Migration Timing of Non-Clipped Steelhead (O. Mykiss) Originating from
the San Joaquin River and Its Tributaries ........................................................................ 24 Figure 5-1. Relationship Between OMR Flows and Entrainment at the CVP,
1995 to 2007 ..................................................................................................................... 30 Figure 5-2. Relationship Between OMR Flows and Entrainment at the SWP,
1995 to 2007 ..................................................................................................................... 31
LIST OF TABLES Table 2-1. Difference in Tidal Average Flow and Tidal Maximum and Minimum
Flow Based on DSM2 Model Results at Various Locations in the Delta due to Increasing Exports from 2,000 to 10,000 cfs with Delta Inflow at 12,000 cfs ....................3

Volume 2: Responses to Management Questions Final
iv
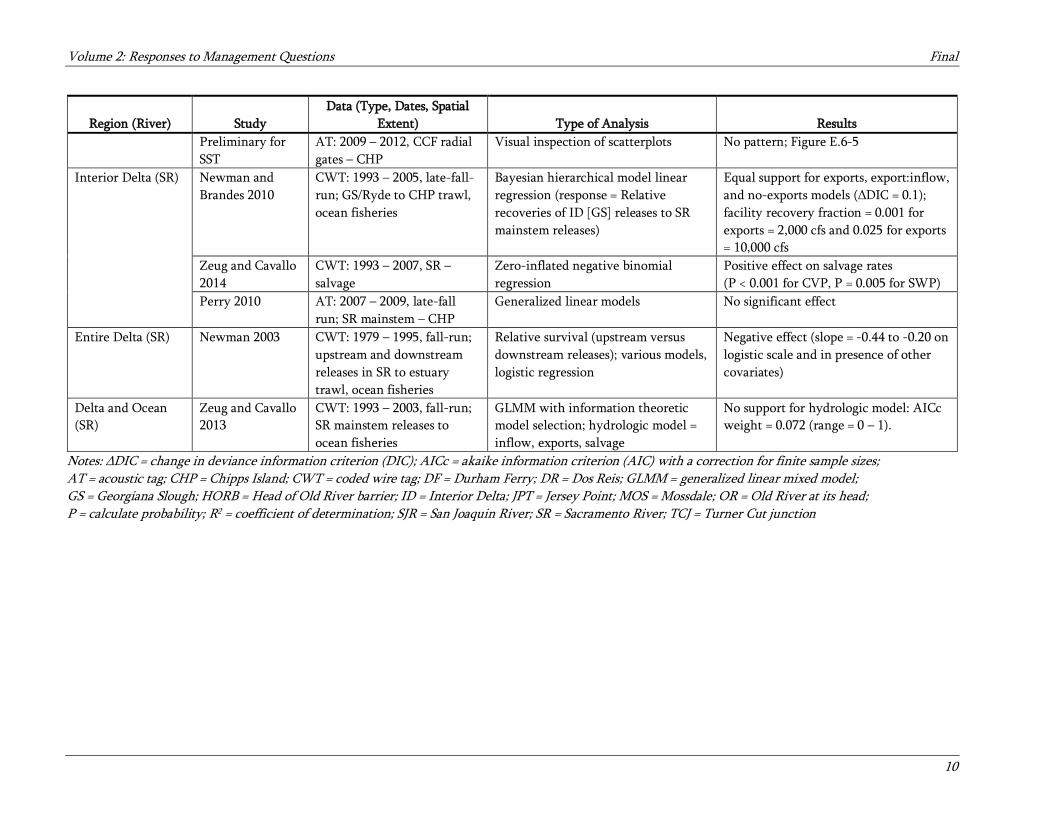
Table 3-1. Data Summary of the Effects of Exports on Survival of Juvenile Chinook Salmon .................................................................................................................9
Table 3-2. Data Summary of the Effects of Exports on Survival of Juvenile Steelhead Outmigrating from the San Joaquin River ....................................................... 11
Table 3-3. Data Summary of the Effects of Inflow on Survival of Juvenile Chinook Salmon ............................................................................................................... 14
Table 3-4. Data Summary of the Effects of Inflow on Survival of Juvenile Steelhead Outmigrating from the San Joaquin River ....................................................... 16
Table 3-5. Data Summary of the Effects of the I:E on Survival of Juvenile Chinook Salmon ............................................................................................................... 18
Table 3-6. Data Summary of the Effects of the I:E on Survival of Juvenile Steelhead Outmigrating from the San Joaquin River ....................................................... 19
Table 4-1. Date of Earliest Salvage of Genetic Winter Run Chinook Salmon from 1997 to 2015 ............................................................................................................ 22
Table 4-2. DSM2 Hydro Simulation Parameters ..................................................................... 26

Volume 2: Responses to Management Questions Final
v
LIST OF ACRONYMS AND ABBREVIATIONS
ABBREVIATION DEFINITION
1-D one-dimensional
2-D two-dimensional
3-D three-dimensional
AT acoustic tag
CAMT Collaborative Adaptive Management Team
CCF Clifton Court Forebay
cfs cubic feet per second
CVP Central Valley Project
CWT coded wire tag
DCC Delta Cross Channel
Delta Sacramento-San Joaquin River Delta
DSM2 Delta Simulation Model 2
DSM2 Hydro Delta Simulation Model 2 hydrodynamic model
ESA Endangered Species Act
ft/sec feet per second
HORB Head of Old River barrier
I:E ratio of inflow to exports
IEP Interagency Ecological Program
JPE juvenile production estimate
NMFS National Marine Fisheries Service
OMR Old and Middle rivers
PIT Passive Integrated Transponder
RPA Reasonable and Prudent Alternative
SAIL Salmon Assessment Indicators by Life Stages
SST Salmonid Scoping Team
SWFSC Southwest Fisheries Science Center
SWP State Water Project

Volume 2: Responses to Management Questions Final
1
1.0 INTRODUCTION This report addresses eight specific management questions identified by the Collaborative Adaptive Management Team (CAMT) and is based on Volume 1, which synthesizes information on juvenile migration and salmonid survival in the Sacramento-San Joaquin River Delta (Delta) related to State Water Project (SWP) and Central Valley Project (CVP) operations. This report is intended to provide CAMT and others with a technical basis for prioritizing future investigations of salmonid behavior and survival in the Delta. It was prepared through a collaborative process involving technical experts participating on the CAMT Salmonid Scoping Team (SST). Throughout the report, we use terms that describe regions of the Delta. We define Interior Delta as waters in the Delta that are outside of the mainstems of the Sacramento River and San Joaquin River. We define South Delta as the San Joaquin River and channels west and south of the San Joaquin River. Protected salmonid populations include Sacramento River winter-run Chinook salmon (Oncorhynchus tshawytscha), Central Valley spring-run Chinook salmon (O. tshawytscha), and Central Valley steelhead (O. mykiss). 2.0 MANAGEMENT QUESTION 1 To what extent do SWP and CVP export operations affect water velocity and flow direction at selected locations in the Delta? To what extent do those specific hydrodynamic changes influence salmonid migration rate or route selection, and salmonid survival? Export operations of concern include export rates and installation/operation of gates and barriers, including the Clifton Court Forebay radial gates, the Head of Old River barrier, and South Delta temporary barriers. The first component of Management Question 1 (the extent to which export operations affect flow and velocity at selected locations) is addressed below. The second component of Management Question 1 (the extent to which changes in hydrodynamics influence salmonid migration and survival) is addressed under the response to Management Question 2. A variety of existing hydrodynamic models have been used to examine the effects of SWP and CVP export operations on the magnitude and direction of flows and water velocities in the Delta. There are also historical hydrologic monitoring data available for specific locations in the Delta. We examined results from hydrodynamic simulations using the Delta Simulation Model 2 (DSM2), a one-dimensional (1-D) model. The analysis partitioned the South Delta into three primary fish migration routes: 1) the San Joaquin River mainstem; 2) Old River; and 3) Middle River (see Volume 1, Appendix B, Figure B.7). For each of these routes, we analyzed the change in flow under three export (2,000, 6,000, and 10,000 cubic feet per second [cfs]) and Delta inflow (12,000, 21,000, and 38,000 cfs) levels. We examined the change in velocity under two export (2,000 and 10,000 cfs) and Delta inflow (12,000 and 38,000 cfs) levels (Volume 1, Appendix B).

Volume 2: Responses to Management Questions Final
2
2.1 CONCLUSIONS
2.1.1 Export and Inflow Effects Based on results of DSM2 modeling, the effect of SWP and CVP exports on flow and velocity varies depending on a number of factors including tidal conditions, distance from the export facilities, installation of controllable and temporary barriers, export levels, and Delta inflow. Increases in Delta inflow result in increased channel water velocities at the upper end of the river routes and movement of the tidally dominated region of the Delta further to the west, creating a larger, riverine-dominated region in the Delta. Under lower Delta inflows, channel velocities are diminished and a larger area of the Delta is tidally dominated. Based on DSM2 model results, the effects of exports are greatest in Old River (particularly near the export facilities), less in Middle River, and even less in the San Joaquin River mainstem. This is illustrated in Figure 2-1, which is a comparison of daily average flow at three export rates (from top to bottom; 2,000, 6,000, and 10,000 cfs) and three inflow rates (from left to right; 12,000, 21,000, and 38,000 cfs). Red indicates negative tidally averaged flows and green indicates positive net flows. Based on DSM2 model results, the San Joaquin River mainstem was the least affected by exports (compared to Old and Middle rivers [OMR]), but the most affected by inflow with the Head of Old River barrier (HORB) in place. The tidal influence in the lower half of the San Joaquin River was also much greater (about eight times) than anywhere in OMR. To characterize the effect of increasing exports on flow relative to tidal effects in the lower San Joaquin River, several calculations were made using the DSM2 model results and a ratio was developed. Table 2-1 shows the difference in tidal average flow from increasing exports from 2,000 to 10,000 cfs (with Delta inflow of 12,000 cfs and HORB in; Column 2), the difference between tidal maximum and minimum flow (2,000 cfs export and 12,000 cfs inflow; Column 3), and the proportion of the difference in tidal maximum and minimum that changes when exports were increased (Column 4; which is product of Column 2 divided by Column 3). Values are presented for various Delta locations and key junctions. While the difference in daily average flow in the San Joaquin River below the mouth of Old River and in Old River below the Clifton Court Forebay (CCF) was similar under high export and inflow (-5,000 and -6,500 cfs, respectively), the percent of tidal average flow difference divided by the difference between maximum and minimum flow (Table 2-1, Column 4) was an order of magnitude less at the mouth of Old River than at Clifton Court at the lower export level of 2,000 cfs (4% and 35%, respectively). By comparison, in Middle River, the largest change in daily average flow due to the increased exports was -3,270 cfs at Railroad Cut, which was 16.5% of the difference between the daily maximum and minimum flow.

Volume 2: Responses to Management Questions Final
3
Figure 2-1. Daily Average Flow at Each DSM2 Node at Three Export Rates and Three Delta Inflow Rates
Note: The export rates were 2,000, 6,000, and 10,000 cfs, and the Delta inflow rates were 12,000, 21,000, and 38,000 cfs. The magnitude of flow is illustrated as a color from red to green (see legend at top of figure). Table 2-1. Difference in Tidal Average Flow and Tidal Maximum and Minimum Flow Based on DSM2 Model Results at Various Locations in the Delta due to Increasing Exports from 2,000 to 10,000 cfs with Delta Inflow at 12,000 cfs
Location
Tidal Average Flow Difference due to
Increasing Exports from 2,000 to 10,000 cfs at
12,000 cfs Delta Inflow
Difference Between Tidal Maximum and Minimum Flow at
Exports of 2,000 cfs and 12,000 cfs Delta Inflow
Percent of Tidal Average Flow Difference Divided by Difference Between
Maximum and Minimum Flow
San Joaquin River below mouth of Old River
5,022 cfs 143,383 cfs 4%

Volume 2: Responses to Management Questions Final
4
Location
Tidal Average Flow Difference due to
Increasing Exports from 2,000 to 10,000 cfs at
12,000 cfs Delta Inflow
Difference Between Tidal Maximum and Minimum Flow at
Exports of 2,000 cfs and 12,000 cfs Delta Inflow
Percent of Tidal Average Flow Difference Divided by Difference Between
Maximum and Minimum Flow
Old River at Grant Line Canal 184 cfs 4,472 cfs 4%
Old River below CCF 6,642 cfs 19,209 cfs 35%
San Joaquin River at the head of Old River, no
barrier installed 217 cfs 4,148 cfs 5%
Turner Cut 589 cfs 8,680 cfs 7%
Columbia Cut 1,360 cfs 16,355 cfs 8%
Increasing Delta inflow (with the HORB in place) had a positive effect on instantaneous velocity at the upper end of all three rivers. In the San Joaquin River mainstem above the head of Old River, the change in minimum instantaneous velocity due to Delta inflow increasing from 12,000 to 38,000 cfs (exports 2,000 cfs, no HORB) was 1.45 feet per second (ft/sec) (265% of the change in tidal maximum and minimum). In Old River just below the head, it was 1.44 ft/sec (206% of the change in tidal maximum and minimum), and in Middle River just below the head, it was 0.64 ft/sec (197% of the change in tidal maximum and minimum). Increased Delta inflow affected the instantaneous minimum velocity in the San Joaquin River mainstem the most between the head of Old River downstream to French Camp Slough. The effect dissipated with distance downstream toward Jersey Point. In Old River, the greatest increase was from the head of Old River to Grant Line Canal. In Middle River, the greatest increase was from the head of Middle River to Victoria Canal. Relative to the San Joaquin River and Old River, Middle River had an intermediate negative change in daily average, maximum and minimum flow and instantaneous velocity associated with increased exports, and the least positive change in flow and velocity due to increased Delta inflow. The greatest changes in flow within Middle River occurred at Victoria Canal, at the downstream end of Railroad Cut, and again at Columbia Cut. The greatest negative change in velocity due to exports increasing from 2,000 to 10,000 cfs was at Victoria Canal under conditions of high inflow and no HORB. 2.1.2 Georgiana Slough At the Georgiana Slough junction, increasing exports had a positive but small effect on flow within the junction toward the Interior Delta. The change in daily average flow into the Interior Delta was an increase of 124 cfs (2% of the difference between daily maximum and
Volume 2: Responses to Management Questions Final
5
minimum flow of 6,745 cfs [Cavallo et al. 2013]). Velocity data are not available for the Georgiana Slough junction at this time. 2.1.3 Clifton Court Forebay Radial Gate Operations Radial gate openings are timed to occur as the flooding tide reaches the CCF intake and through the early part of the ebb tidal cycle. The frequency that the radial gates are opened to flood CCF depends on the SWP export rate, the volume of water storage in the forebay, and tidal conditions. When the difference in water surface elevation between Old River and CCF is greatest, water velocities through Clifton Court Canal typically exceed 15 ft/sec at flow rates typically ranging between 10,000 and 15,000 cfs (Clark et al. 2009). 2.1.4 South Delta Temporary Barriers Results of DSM2 modeling showed that installation of temporary barriers resulted in significantly altered stage and flows in the South Delta (DWR 2011a, 2011b). The effects of barrier installation were typically localized to the channels in the immediate vicinity of each barrier and diminished with distance upstream and downstream of a barrier. For example, installation of the Middle River barrier in 2008 raised the water elevation at the barrier approximately 0.5 feet. Installation of the Grant Line Canal barrier in 2008 was found to raise water levels at the barrier by approximately 1.5 feet, and water levels in Old River and Middle River by approximately 1 foot and 0.5 feet, respectively (DWR 2011a). Barrier installation also diminished tidal variation in flow, with the effect being most pronounced in OMR with the Grant Line barrier installed. Installation of the HORB significantly reduced flow in Old River and Grant Line Canal. Comparative changes in flows and water levels in various South Delta channels with and without temporary barriers installed are presented in Volume 1, Appendix B. Similar model analyses of the effects of the temporary barriers on hydrodynamics in the South Delta in 2009 are presented in DWR (2011b). Installation of temporary barriers change local flow patterns, impact the extent and area affected by tidal conditions, increase water levels upstream of the barrier, and alter flow in Delta channels. The effect of exports and inflow on average daily flows, within the context of tides, varies with proximity to the export facilities, channel configuration and barrier deployment.
2.2 DISCUSSION OF HOW WELL THE DATA INFORMED THE QUESTION
Hydrologic simulations provide a means for evaluating local and regional changes in Delta hydrodynamic conditions associated with alternative water project operations. However, Delta channels and junctions are characterized by complex and dynamic conditions, which complicate the development and interpretation of modeling results. The 1-D DSM2 model provided a tool for assessing changes in Delta hydrodynamic conditions and has been used

Volume 2: Responses to Management Questions Final
6
extensively for water supply planning. Validation tests indicate that DSM2 is more accurate for predicting average daily metrics than 15-minute time step metrics (Volume 1, Appendix C). The model validates well at some locations, with weaker agreement between observed and predicted flow and velocity at other locations. Factors such as simplifying assumptions for Delta consumptive water use, channel bathymetry and complex geometry, and dynamic tidal conditions contribute to variability in model validation. More complex two-dimensional (2-D) or three-dimensional (3-D) simulation models may be needed in some analyses to represent more complex hydrodynamic conditions on a finer time scale experienced by juvenile salmonids migrating through the Delta (Volume 1, Appendices B and C). Selection of the appropriate simulation modeling tool should be based on the specific goals and objectives of an analysis, the level of resolution needed in model results, and the complexities of the areas being modeled in terms of dynamic tidal and flow conditions and channel geometry. The selected modeling tool should be calibrated and independently validated at a temporal and spatial scale appropriate for the desired analysis.
2.3 AREAS OF TECHNICAL DISAGREEMENT
The SST did not identify any significant technical disagreements regarding the effect of water project operation on hydrodynamic conditions in the Delta, or disagreements over the hydrodynamic models and how well they predict hydrodynamic conditions at various locations. However, the SST recognizes that there is uncertainty in all of the hydrodynamic models, including for example uncertainty associated with bathymetry data in the South Delta, Delta consumptive use data, and the ability to validate the models at various spatial scales. Selection of which model is most appropriate to use needs to be determined on a project-by-project basis. 3.0 MANAGEMENT QUESTION 2 To what extent do either: (1) water exports; (2) inflows; or (3) the ratio of San Joaquin River inflow to water exports during April and May affect the survival of Chinook salmon or steelhead out-migrating down the San Joaquin River, particularly given very low ambient rates of survival and associated issues of detection?
3.1 CONCLUSIONS
3.1.1 Chinook Salmon Results of the review found the following relative to Chinook salmon:
Volume 2: Responses to Management Questions Final
7
• There is no strong evidence of a relationship between the combined export rate from CVP and SWP and survival of San Joaquin River-origin fall-run Chinook salmon through the Delta (Volume 1, Appendix E, Section E.6.2.1.4).
• There is some evidence of a positive effect of exports on survival through the Delta to Jersey Point based on coded wire tag (CWT) data for fall-run Chinook salmon (SJRGA 2006; Newman 2008), but not acoustic tag (AT) data (based on SST scatterplots). This finding is complicated by the high correlation between inflow and exports (Volume 1, Appendix E, Section E.6.2.1).
• A negative relationship was observed between exports and through-Delta survival for fall-run Chinook salmon from the Sacramento River (Newman 2003) (Volume 1, Appendix E, Section E.6.2.1).
• From multiple years of CWT data, there appears to be a positive relationship between San Joaquin River inflow and through-Delta survival of San Joaquin River Chinook salmon, especially when the physical barrier was installed at the head of Old River (SJRGA 2007; Newman 2008). AT data (available since 2008, mostly in the absence of the physical barrier) suggest a positive association between inflow and survival from Mossdale to Turner Cut, and a negative association from Turner Cut to Chipps Island (SST scatterplots) (Volume 1, Appendix E, Section E.8.2.1).
• Several studies using CWT or AT data have found a positive effect of Sacramento River inflow on through-Delta survival of fall-run and late-fall-run Chinook salmon migrating from the Sacramento River (Newman 2003; Newman and Rice 2002; Perry 2010) (Volume 1, Appendix E, Section E.9.2.1).
• A positive relationship has been found between April and May I:E and through-Delta survival of San Joaquin River Chinook salmon when the HORB barrier is in place (SJRGA 2007). Data are limited on the reach scale, but available AT data suggest that survival in the San Joaquin River from Mossdale to the Turner Cut junction tends to increase for higher I:E values (SST scatterplots) (Volume 1, Appendix E, Section E.11.2.1).
3.1.2 Steelhead Results of the review found the following relative to steelhead: • Only two years of AT data are available (2011 and 2012). Additional AT data are
currently being analyzed through 2016, and a multi-year analysis is planned for the complete dataset for the six-year steelhead migration and survival studies. Results of these additional analyses will be used to reassess the initial findings summarized below.
• There was no well-defined pattern of survival of San Joaquin River steelhead relative to exports except for fish that migrated through the CVP, in which case higher exports were associated with higher survival probabilities to Chipps Island (SST scatterplots) (Volume 1, Appendix E, Section E.6.2.2).
• Survival of San Joaquin River steelhead increased from the Turner Cut junction to Chipps Island, and overall from Mossdale to Chipps Island, for high levels of San Joaquin River inflow (SST scatterplots). There was no association between inflow and survival

Volume 2: Responses to Management Questions Final
8
estimates between Mossdale and Turner Cut (SST scatterplots) (Volume 1, Appendix E, Section E.8.2.2).
• Survival of steelhead increased from the Turner Cut junction to Chipps Island, and overall from Mossdale to Chipps Island along the San Joaquin River or through the CVP and SWP facilities, as the April to May I:E increased. However, the pattern was weaker than the survival pattern observed for inflow (SST scatterplots). Survival estimates from Mossdale to the Turner Cut junction were similar regardless of I:E (SST scatterplots) (Volume 1, Appendix E, Section E.11.2.2).
3.2 DISCUSSION
We interpret “water exports” to refer to the daily combined export rate from the state and federal water export facilities at the SWP and the CVP. Although inflow to the Delta comes from both the San Joaquin and the Sacramento rivers, existing analyses of survival of San Joaquin River salmonids have not considered the effects of Sacramento River inflows. Thus, we limit our consideration to San Joaquin River inflow, commonly measured at Vernalis. Our primary focus is on fish outmigrating from the San Joaquin River basin, based on the question being addressed. However, below we also report data on the effects of exports, inflow, and the I:E ratio on survival of Sacramento River-origin juvenile Chinook salmon. Juvenile salmonid survival estimates for San Joaquin River fall-run Chinook salmon have declined over time and are measured at very low rates for through-Delta survival. More recent AT studies with juvenile steelhead have observed higher through-Delta survival rates. Note that at the reach scale, there are estimates of survival from Mossdale to Turner Cut, and from Turner Cut to Chipps Island. Upstream of Turner Cut, the river is more riverine; downstream, it is more estuarine and tidally influenced (although there is tidal influence upstream as well). We discuss results for these reaches because survival plummets at Turner Cut, especially for Chinook salmon (Volume 1, Appendix E, Section E.4.2.4.1). 3.2.1 Water Exports Tables 3-1 and 3-2 summarize available information regarding exports and survival of Chinook salmon and steelhead for each of the Delta regions examined. There is inconsistent and weak evidence (i.e., no strong evidence) of a relationship between the combined export rate from CVP and SWP and survival of San Joaquin River-origin fall-run Chinook salmon through the Delta (Table 3-1). There is some evidence of a positive effect of exports on fall-run Chinook salmon survival through the San Joaquin River to Jersey Point based on CWT data (SJRGA 2006; Newman 2008), but not AT data (SST scatterplots). This finding is complicated by the high correlation between inflow and exports (Volume 1, Appendix E, Section E.2.3).

Volume 2: Responses to Management Questions Final
9
Table 3-1. Data Summary of the Effects of Exports on Survival of Juvenile Chinook Salmon
Region (River) Study Data (Type, Dates, Spatial
Extent) Type of Analysis Results Riverine Portion of Delta (SJR)
Preliminary for SST
AT: 2008 – 2012, MOS – TCJ Visual inspection of scatterplots Highly variable: survival = 0 – 0.55 for exports < 3,100 cfs; survival = 0.42 – 0.52 for exports > 5,000 cfs; Figure E.6-2
Tidal Portion of Delta (SJR)
Preliminary for SST
AT: 2008, 2010 – 2012, TCJ – CHP
Visual inspection of scatterplots Variable: survival = 0.03 – 0.29 for exports ≈ 1,500 cfs; survival ≤ 0.01 for exports > 2,000 cfs; Figure E.6-2
Entire Delta (SJR) Newman 2008 CWT: 1985-2006, DR/OR to JPT
Hierarchical Bayesian Model Probability of positive effect: 79% for DR to JPT; 67% for OR to JPT
SJRGA 2006 CWT: 1994 – 2005 without HORB DF/MOS to JPT/ocean fisheries
Simple Linear Regression Positive correlation (slope = 0.0001; P < 0.10) to JPT, not to ocean (P > 0.10)
Preliminary for SST
CWT: 1994 -2006, DF/MOS - JPT
Visual inspection of scatterplots Positive trend for exports < 4,000 (only one data point > 4,000 cfs); Figure E.6-2
AT: 2008, 2010 – 2012, MOS – CHP
Visual inspection of scatterplots Highly variable: survival = 0 – 0.06 for exports < 3,100 cfs; survival ≤ 0.03 for exports > 5,000 cfs; Figure E.6-2
Delta and Ocean (SJR)
Zeug and Cavallo 2013
CWT: 1993 - 2003 DF/MOS/DR to ocean fisheries
GLMM with information theoretic model selection; hydrologic model = inflow, exports, salvage
No support for hydrologic model: AICc weight = 0.061 (range = 0 – 1)
Facilities (SJR) Zeug and Cavallo 2014
CWT: 1993 – 2007, MOS/DR – salvage
Zero-inflated negative binomial regression
Positive effect of exports on salvage rate from release points in SJR (P ≤ 0.003 for CVP and SWP)
Sutphin and Bridges 2008
Fish insertion experiments at CVP
Linear regression (response = capture in bypass)
Positive effect of bypass entrance water velocity (slope = 13.24 for velocity ≈ 0.5 – 6 ft/sec; P < 0.05)
Gingras 1997 Dye-marked fish released in CCF at radial gates
Multiple regression (response = pre-screen loss)
Negative effect (R2 = 0.75; exports = 252 - 7622 cfs)
Preliminary for SST
AT: 2009 – 2012, CVP trashracks – CHP
Visual inspection of scatterplots No pattern; survival = 0 – 0.55 for CVP exports ≈ 800 – 1,100 cfs; Figure E.6-5
Volume 2: Responses to Management Questions Final
10
Region (River) Study Data (Type, Dates, Spatial
Extent) Type of Analysis Results Preliminary for SST
AT: 2009 – 2012, CCF radial gates – CHP
Visual inspection of scatterplots No pattern; Figure E.6-5
Interior Delta (SR) Newman and Brandes 2010
CWT: 1993 – 2005, late-fall-run; GS/Ryde to CHP trawl, ocean fisheries
Bayesian hierarchical model linear regression (response = Relative recoveries of ID [GS] releases to SR mainstem releases)
Equal support for exports, export:inflow, and no-exports models (ΔDIC = 0.1); facility recovery fraction = 0.001 for exports = 2,000 cfs and 0.025 for exports = 10,000 cfs
Zeug and Cavallo 2014
CWT: 1993 – 2007, SR – salvage
Zero-inflated negative binomial regression
Positive effect on salvage rates (P < 0.001 for CVP, P = 0.005 for SWP)
Perry 2010 AT: 2007 – 2009, late-fall run; SR mainstem – CHP
Generalized linear models No significant effect
Entire Delta (SR) Newman 2003 CWT: 1979 – 1995, fall-run; upstream and downstream releases in SR to estuary trawl, ocean fisheries
Relative survival (upstream versus downstream releases); various models, logistic regression
Negative effect (slope = -0.44 to -0.20 on logistic scale and in presence of other covariates)
Delta and Ocean (SR)
Zeug and Cavallo 2013
CWT: 1993 – 2003, fall-run; SR mainstem releases to ocean fisheries
GLMM with information theoretic model selection; hydrologic model = inflow, exports, salvage
No support for hydrologic model: AICc weight = 0.072 (range = 0 – 1).
Notes: ΔDIC = change in deviance information criterion (DIC); AICc = akaike information criterion (AIC) with a correction for finite sample sizes; AT = acoustic tag; CHP = Chipps Island; CWT = coded wire tag; DF = Durham Ferry; DR = Dos Reis; GLMM = generalized linear mixed model; GS = Georgiana Slough; HORB = Head of Old River barrier; ID = Interior Delta; JPT = Jersey Point; MOS = Mossdale; OR = Old River at its head; P = calculate probability; R2 = coefficient of determination; SJR = San Joaquin River; SR = Sacramento River; TCJ = Turner Cut junction

Volume 2: Responses to Management Questions Final
11
Table 3-2. Data Summary of the Effects of Exports on Survival of Juvenile Steelhead Outmigrating from the San Joaquin River
Region (River) Study Data (Type, Dates, Spatial
Extent) Type of Analysis Results Riverine Portion of Delta (SJR)
Preliminary for SST AT: 2011 – 2012, MOS – TCJ Visual inspection of scatterplots
No pattern: survival = 0.74 – 0.89 for exports ≈ 2,500 – 5,100 cfs; insufficient data; Figure E.6-6
Tidal Portion of Delta (SJR)
Preliminary for SST AT: 2011 – 2012, TCJ – CHP Visual inspection of scatterplots
Possible non-linear; insufficient data; Figure E.6-6
Entire Delta (SJR) Preliminary for SST AT: 2011 – 2012, MOS – CHP
Visual inspection of scatterplots
Possible non-linear; insufficient data; Figure E.6-6
Facilities (SJR) Preliminary for SST AT: 2011 – 2012, CVP trashracks – CHP
Visual inspection of scatterplots
Higher survival for higher CVP exports: survival = 0.04 – 0.50 for exports ≈ 1,000 – 1,400 cfs; survival = 0.66 – 0.78 for exports ≈ 2,000 – 3,600 cfs; insufficient data; Figure E.6-7
Preliminary for SST AT: 2011 – 2012, CCF radial gates – CHP
Visual inspection of scatterplots
Highly variable, no pattern: survival = 0 – 0.74 for exports ≈ 1,200 – 2,000 cfs; survival = 0.59 – 0.68 for exports = 2,500 – 6,700 cfs; insufficient data; Figure E.6-7
Notes: SJR = San Joaquin River; MOS = Mossdale; TCJ = Turner Cut junction; CHP = Chipps Island; AT = acoustic tag

Volume 2: Responses to Management Questions Final
12
Non-hydrologic models (i.e., models that use factors other than inflow and exports, such as fish condition and water quality) have accounted for the variation in CWT ocean recovery fractions better than models using exports, inflow, and salvage, but direct inference to Delta survival is not possible because ocean-recovery fractions represent joint survival through both the Delta and the ocean (Zeug and Cavallo 2013). For the two years of AT data available (2011 and 2012), there was no well-defined pattern of survival of San Joaquin River steelhead relative to exports except for fish that migrated through the CVP. For steelhead migrating through the CVP, higher survival probabilities to Chipps Island were associated with higher export levels (Volume 1, Appendix E, Section E.6.2.2; SST scatterplots). More data are needed to adequately characterize the relationship between exports and survival in the lower San Joaquin River between the Turner Cut junction and Chipps Island for Chinook salmon and steelhead. This is because this area has particularly low survival for both species, and determining whether alternative export operations can improve survival in this area would support the higher reach-specific survivals occurring upstream of this area. Louver efficiency at the CVP is positively associated with water velocity in the facility (Sutphin and Bridges 2008), and water velocity is positively associated with export rates at the CVP (Bates and Vinsonhaler 1957; Karp et al. 1995, 2014; Sutphin and Bridges 2008). Salvage rates of Chinook salmon from San Joaquin River mainstem and Sacramento River and northern Interior Delta release points are positively associated with exports (Zeug and Cavallo 2014), and CCF pre-screen loss is negatively associated with SWP exports (Gingras 1997). Steelhead survival through the CVP to Chipps Island increases with CVP exports up to 4,000 cfs (no data are available at higher export levels); no such pattern is obvious for SWP exports and steelhead survival through CCF to Chipps Island (SCC scatterplots). However, no pattern between exports and survival through the facilities to Chipps Island is apparent for San Joaquin River Chinook salmon based on AT data (SST scatterplots). A negative relationship has been found between exports and through-Delta survival for fall-run Chinook salmon migrating from the Sacramento River in spring (Newman 2003). There was evidence of a relationship between exports and survival of late-fall-run Chinook salmon migrating through Georgiana Slough relative to those from the Sacramento River in the winter (Newman and Brandes 2010), but other models that omitted exports had comparable support from the data. Perry (2010) found no relationship between Delta survival and exports for late-fall-run Chinook salmon. 3.2.2 Inflows Tables 3-3 and 3-4 summarize available information regarding inflow and survival of Chinook salmon and steelhead for each of the Delta regions examined. Overall, data indicate that there is not a simple relationship between inflow and through-Delta survival. There is evidence of a positive relationship between inflow and survival of Chinook salmon in the
Volume 2: Responses to Management Questions Final
13
South Delta in the presence of the HORB (SJRGA 2007; Newman 2008). Newman (2008) uses data through 2006. The rock barrier was not installed in 2005, 2006, and 2011, and a non-physical barrier (i.e., a sound barrier) was tested in its place in 2009 and 2010. From 2006 to 2013, only one year (2012) had the physical barrier in place; formal data analysis that compares survival to inflow and incorporates the more recent years is underway but has not been completed.

Volume 2: Responses to Management Questions Final
14
Table 3-3. Data Summary of the Effects of Inflow on Survival of Juvenile Chinook Salmon
Region (River) Study Data (Type, Dates, Spatial
Extent) Type of Analysis Results Riverine Portion of Delta (SJR)
Preliminary for SST AT: 2008 – 2012, MOS – TCJ Visual inspection of scatterplots
Higher survival for higher inflow (survival range = 0 – 0.55, inflow range ≈ 2,300 – 11,000 cfs); Figure E.8-1, E.8-3
Tidal Portion of Delta (SJR)
Preliminary for SST AT: 2008, 2010 – 2012, TCJ – CHP
Visual inspection of scatterplots
Lower survival for higher inflow (survival range = 0.01 – 0.29, inflow range ≈ 2,400 – 11,000 cfs); Figure E.8-1, E.8-3
Entire Delta (SJR) Newman 2008 CWT: 1985-2006, DR/OR to JPT
Hierarchical Bayesian Model
Probability of positive effect of inflow: 89% for DR to JPT; 65% for OR to JPT
SJRGA 2007 CWT: 1994 – 2006 DF/MOS to JPT/ocean fisheries
Linear Regression With HORB: Positive relationship (slope = 0.0001, P < 0.01) Without HORB: no relationship
Preliminary for SST CWT: 1994 -2006, DF/MOS - JPT
Visual inspection of scatterplots
Positive pattern with HORB (survival = 0.01 – 0.46, inflow ≈ 2,600 – 6,400 cfs); non-linear pattern without HORB; Figure E.8-3
Preliminary for SST AT: 2008, 2010 – 2012, MOS – CHP
Visual inspection of scatterplots
Negative pattern without HORB (survival = 0.01 – 0.10, inflow ≈ 3,200 – 11,000 cfs); insufficient data without HORB
Delta and Ocean (SJR)
Zeug and Cavallo 2013
CWT: 1993 – 2003 DF/MOS/DR to ocean fisheries
GLMM with Information theoretic model selection; hydrologic model = inflow, exports, salvage
No support for hydrologic model: AICc weight = 0.061 (range = 0 – 1); Figures E.8-1, E.8.2, E.8-3
Facilities (SJR) Zeug and Cavallo 2014
CWT: 1993 – 2007, MOS/DR - salvage
Zero-inflated negative binomial regression
Negative effect of inflow on probability of zero counts (i.e., positive effect on getting any salvaged fish) for CVP (P = 0.002); no effect on salvage rate at CVP or SWP
Preliminary for SST AT: 2009 – 2012, CVP trashracks - CHP
Visual inspection of scatterplots
Highly variable; Figure E.8-4

Volume 2: Responses to Management Questions Final
15
Region (River) Study Data (Type, Dates, Spatial
Extent) Type of Analysis Results Preliminary for SST AT: 2009 – 2012, CCF radial
gates - CHP Visual inspection of scatterplots
No pattern; Figure E.8-4
Interior Delta (SR) Perry 2010 AT: 2007 – 2009, late-fall run; SR mainstem – CHP
Generalized linear models No significant effect, low sample size
Entire Delta (SR) Newman 2003 CWT: 1979 – 1995 fall-run; upstream and downstream releases in SR to estuary trawl, ocean fisheries
Relative survival (upstream versus downstream releases); various models, logistic regression
Positive effect (slope = 0.86 – 0.63 on logistic scale in presence of other covariates); confounded by effect of salinity
Newman and Rice 2002
CWT: 1979 – 1995 fall-run; SR releases to CHP trawl, ocean fisheries
Extended quasi-likelihood model
Positive effect (slope = 0.104 on log scale in presence of other covariates; P = 0.04); confounded by effect of salinity
Perry 2010 AT: 2007 – 2009, late-fall run; SR mainstem – CHP
Generalized linear modeling Positive relationship with survival in SR mainstem and Sutter/Steamboat Sloughs (P = 0.001); effect lessens as discharge increases (Figure E.9-1)
Delta and Ocean (SR)
Zeug and Cavallo 2013
CWT: 1993 – 2003, fall-run; SR mainstem releases to ocean fisheries
GLMM with Information theoretic model selection; hydrologic model = inflow, exports, salvage
No support for hydrologic model: AICc weight = 0.072 (range = 0 – 1)
Notes: ΔDIC = change in deviance information criterion (DIC); AICc = akaike information criterion (AIC) with a correction for finite sample sizes; AT = acoustic tag; CHP = Chipps Island; CWT = coded wire tag; DF = Durham Ferry; DR = Dos Reis; GLMM = generalized linear mixed model; GS = Georgiana Slough; HORB = Head of Old River barrier; ID = Interior Delta; JPT = Jersey Point; MOS = Mossdale; OR = Old River at its head; P = calculate probability; R2 = coefficient of determination; SJR = San Joaquin River; SR = Sacramento River; TCJ = Turner Cut junction

Volume 2: Responses to Management Questions Final
16
Table 3-4. Data Summary of the Effects of Inflow on Survival of Juvenile Steelhead Outmigrating from the San Joaquin River
Region (River) Study Data (Type, Dates, Spatial
Extent) Type of Analysis Results Riverine Portion of Delta (SJR)
Preliminary for SST AT: 2011 – 2012, MOS – TCJ
Visual inspection of scatterplots
No pattern: survival = 0.74 – 0.89, inflow ≈ 2,300 – 27,000 cfs; insufficient data; Figure E.8-5
Tidal portion of Delta (SJR)
Preliminary for SST AT: 2011 – 2012, TCJ – CHP
Visual inspection of scatterplots
Higher survival for higher inflow (survival = 0.36 – 0.78, inflow ≈ 2,300 – 27,000 cfs); insufficient data; Figure E.8-5
Entire Delta (SJR) Preliminary for SST AT: 2011 – 2012, MOS – CHP
Visual inspection of scatterplots
Higher survival for higher inflow (survival = 0.26 – 0.69, inflow ≈ 2,300 – 27,000 cfs); insufficient data; Figure E.8-5
Facilities (SJR) Preliminary for SST AT: 2011 – 2012, CVP trashracks – CHP
Visual inspection of scatterplots
Higher survival for higher inflow (survival ≤ 0.21 for inflow ≈ 2,000 – 4,000 cfs, survival = 0.50 – 0.78 for inflow ≈ 10,000 – 13,000 cfs); insufficient data; Figure E.8-6
Preliminary for SST AT: 2011 – 2012, CCF radial gates – CHP
Visual inspection of scatterplots
Higher survival for higher inflow (survival ≤ 0.28 for inflow ≈ 2,000 – 4,000 cfs, survival = 0.59 – 0.74 for inflow ≈ 10,000 – 13,000); insufficient data; Figure E.8-6
Notes: SJR = San Joaquin River; MOS = Mossdale; TCJ = Turner Cut junction; CHP = Chipps Island; AT = acoustic tag

Volume 2: Responses to Management Questions Final
17
Fall-run Chinook salmon survival in the San Joaquin River from Mossdale to Turner Cut tends to be higher for higher levels of inflow, whereas survival from Turner Cut to Chipps Island (all routes combined) tends to be lower for higher levels of inflow (Volume 1, Appendix E, Section E.8.2; SST scatterplots). There is evidence of a positive relationship between inflow and survival of Chinook salmon in the north Delta (Newman and Rice 2002; Newman 2003; Perry 2010). For late-fall-run Chinook salmon, the relationship appears to lessen as inflow increases (Volume 1, Appendix E, Section E.9.2). There is little evidence that inflow affects survival through the facilities to salvage (Zeug and Cavallo 2014), and there is no pattern between San Joaquin River inflow and estimated survival through the facilities to Chipps Island based on available AT data (Volume 1, Appendix E, Section E.8.2, SST scatterplots). For the two years of data available (2011 and 2012), survival of San Joaquin River steelhead increased from the Turner Cut junction to Chipps Island, and overall from Mossdale to Chipps Island, for high levels of San Joaquin River inflow (SST scatterplots). There was no association between inflow and survival estimates between Mossdale and Turner Cut (SST scatterplots). For the two years of data available, steelhead survival through the facilities to Chipps Island increased with San Joaquin River inflow (SST scatterplots). 3.2.3 April and May I:E Effects Tables 3-5 and 3-6 summarize available information regarding the I:E ratio and survival of Chinook salmon and steelhead for each of the Delta regions examined. A positive association has been found between April and May I:E and survival of San Joaquin River Chinook salmon when the HORB is installed (SJRGA 2007). Fall-run Chinook salmon survival in the San Joaquin River from Mossdale to the Turner Cut junction tends to increase for higher I:E values (SST scatterplots). Data for the tidal portion of the Delta are mixed, with Chinook salmon survival being highest for an I:E ratio of approximately 2, and lowest for I:E ratios of approximately 1 or greater than 4. There is no evidence linking survival through the facilities to I:E (Zeug and Cavallo 2014; SST scatterplots).

Volume 2: Responses to Management Questions Final
18
Table 3-5. Data Summary of the Effects of the I:E on Survival of Juvenile Chinook Salmon
Region (River) Study Data (Type, Dates, Spatial
Extent) Type of Analysis Results Riverine Portion of Delta (SJR)
Preliminary for SST AT: 2008 – 2012, MOS – TCJ Visual inspection of scatterplots
Variable; higher survival for higher I:E (survival = 0 – 0.55, IE ≈ 1 – 4); Figure E.11-1
Tidal Portion of Delta (SJR)
Preliminary for SST AT: 2008, 2010 – 2012, TCJ – CHP
Visual inspection of scatterplots
Variable; non-linear pattern (survival = 0 – 0.29, IE ≈ 1 – 4); Figure E.11-1
Entire Delta (SJR) SJRGA 2007 CWT: 1994 – 2006, DF/MOS to JPT/ocean fisheries
Linear regression With HORB: positive relationship (slope = 0.22, P < 0.05); without HORB: no relationship
Preliminary for SST CWT: 1994 -2006, DF/MOS - JPT
Visual inspection of scatterplots
Variable, possible non-linear relationship (survival = 0.01 – 0.79, IE ≈ 1 – 18); Figures E.11-1, E.11-12, E.11-3
Preliminary for SST AT: 2008, 2010 – 2012, MOS – CHP
Visual inspection of scatterplots
Variable, possible non-linear relationship (survival = 0 – 0.1, IE ≈ 1 – 4); Figures E.11-1, E.11-12, E.11-3
Facilities (SJR) Zeug and Cavallo 2014
CWT: 1993 – 2007, MOS/DR – salvage
Zero-inflated negative binomial regression
Modeling salvage using E:I was not as efficient as using E+I; no effect estimate reported
Preliminary for SST AT: 2009 – 2012, CVP trashracks – CHP
Visual inspection of scatterplots
No pattern: Figure E.8-4
Preliminary for SST AT: 2009 – 2012, CCF radial gates – CHP
Visual inspection of scatterplots
No pattern: Figure E.8-4
Interior Delta (SR) Newman and Brandes 2010
CWT: 1993-2005, late-fall-run; GS/Ryde to CHP trawl, ocean fisheries
Bayesian hierarchical model linear regression (response = Relative recoveries of ID (GS) releases to SR mainstem releases)
Equal support for export:inflow, exports, and no-exports models (ΔDIC = 0.1)
Entire Delta (SR) Newman and Rice 2002
CWT: 1979 – 1995, fall-run; SR releases to CHP trawl, ocean fisheries
Extended quasi-likelihood model
Insignificant effect of export:inflow
Notes: SJR = San Joaquin River; SR = Sacramento River; DF = Durham Ferry; DR = Dos Reis; MOS = Mossdale; OR = Old River at its head; TCJ = Turner Cut junction; JPT = Jersey Point; CHP = Chipps Island; GS = Georgiana Slough; ID = interior Delta; CWT = coded wire tag; AT = acoustic tag; GLMM = generalized linear mixed model; HORB = Head of Old River barrier

Volume 2: Responses to Management Questions Final
19
Table 3-6. Data Summary of the Effects of the I:E on Survival of Juvenile Steelhead Outmigrating from the San Joaquin River
Region (River) Study Data (Type, Dates, Spatial
Extent) Type of Analysis Results Riverine Portion of Delta (SJR)
Preliminary for SST AT: 2011 – 2012, MOS – TCJ
Visual inspection of scatterplots No pattern (survival = 0.74 – 0.89, I:E range ≈ 1 – 4); insufficient data; Figure E.11-4
Tidal Portion of Delta (SJR)
Preliminary for SST AT: 2011 – 2012, TCJ – CHP
Visual inspection of scatterplots Higher survival for higher I:E levels (survival = 0.36 – 0.77, I:E range ≈ 1 – 4); insufficient data; Figure E.11-4
Entire Delta (SJR) Preliminary for SST AT: 2011 - 2012, MOS – CHP
Visual inspection of scatterplots Higher survival for higher I:E levels (survival = 0.26 – 0.60, I:E range ≈ 1 – 4); insufficient data; Figure E.11-4
Facilities (SJR) Preliminary for SST AT: 2011 – 2012, CVP trashracks – CHP
Visual inspection of scatterplots Higher survival for higher I:E levels (survival = 0.4 – 0.78, I:E range ≈ 1 – 4); insufficient data; Figure E.8.6
Preliminary for SST AT: 2011 – 2012, CCF radial gates – CHP
Visual inspection of scatterplots Higher survival for higher I:E levels (survival = 0 – 0.74, I:E range ≈ 1 – 4); insufficient data; Figure E.8-6
Notes: SJR = San Joaquin River; MOS = Mossdale; TCJ = Turner Cut junction; CHP = Chipps Island; AT = acoustic tag

Volume 2: Responses to Management Questions Final
20
Steelhead survival in the South Delta tended to increase for higher levels of I:E, but observations are limited to two years of AT data available (2011 and 2012). Survival increased from the Turner Cut junction to Chipps Island, and overall from Mossdale to Chipps Island, as the April to May I:E increased. However, the pattern was weaker than the survival pattern observed for inflow (SST scatterplots). Survival estimates from Mossdale to the Turner Cut junction were similar regardless of I:E (SST scatterplots). Survival from the CVP trash rack through the facility to Chipps Island, and from the CCF radial gates to Chipps Island, increased with I:E for fish released during April and May.
3.3 AREAS OF TECHNICAL DISAGREEMENT
The SST did not identify any significant technical disagreements regarding the effect of water project operations and inflow on the fish survival topics and data discussed here in the response to Management Question 2. Throughout Volumes 1 and 2, we identify numerous data gaps and uncertainties associated with export effects on fish survival in the Delta.
4.0 MANAGEMENT QUESTION 3 To what extent does the January 1 onset of OMR flow management improve the survival of the target salmonid species?
4.1 CONCLUSIONS
In response to this question we discuss both the timing of the January 1 onset and the OMR reverse flow limit of -5,000 cfs. 4.1.1 January 1 Onset of OMR Reverse Flow Management Results of salmonid monitoring in the Sacramento and San Joaquin rivers have shown that the seasonal timing of Delta entry for juvenile Endangered Species Act (ESA)-listed salmonids varies among years. Although not capturing the seasonal variation in juvenile movement, the January 1 onset of OMR reverse flow management coincides with the presence of protected salmonids in the Delta in almost all years, but an earlier onset would often be more effective for some listed salmonids. The January 1 trigger date provides a general approximation of a date by which juvenile winter-run Chinook have likely entered the Delta and, based on its simplicity for triggering management actions, has utility. Calendar-based OMR reverse flow management targets a date range (January 1 through June 15) when ESA-listed salmonid juveniles are expected to be in geographic locations where hydrology could be altered by exports (OMR reverse flow management is called for by Action IV.2.3 of National Marine Fisheries Service [NMFS 2009]). Protected populations include Sacramento River winter-run Chinook salmon, Central Valley spring-run Chinook

Volume 2: Responses to Management Questions Final
21
salmon, and Central Valley steelhead. Of these populations, winter-run Chinook salmon are typically found in the Delta the earliest. While initiating OMR flow restrictions on January 1 each year provided protection, initiating the restrictions prior to January 1 would have provided better protection for winter-run Chinook salmon. This is because these fish were detected prior to January 1 in the Delta in all but one year from 1995 to 2015 (Figure 4-1). It is unclear how many of the winter-run-sized fish in Figure 4-1 are genetic winter-run Chinook, but fewer juveniles of other Chinook runs are present in the Delta before January compared to during the spring (Harvey and Stroble 2013). Juveniles that migrate into the Delta are likely to pass distributary junctions leading from the Sacramento River to the San Joaquin River (i.e., via the Delta Cross Channel [DCC] and Georgiana Slough); fish that migrate into the San Joaquin River are then exposed to distributary junctions leading from the San Joaquin River into interior channels south and west of the San Joaquin River). The lowest survival rates in the Delta have been observed in the San Joaquin River and interior channels south and west of the San Joaquin River (Volume 1, Appendix E, Section E.4.2).
Figure 4-1. Migration Timing of Non-Clipped, Winter-Run-Sized Chinook Salmon Originating from the Sacramento River and Its Tributaries
Notes: Data are from both Sacramento Trawls (Sherwood Harbor) and beach seines in the Sacramento area, and North and Central Delta (data available at: http://www.fws.gov/lodi/jfmp/). Sampling effort and methodology changed within and among years; therefore, the “Total Count” per water year is not intended to be an abundance index—instead, it is intended to provide context for migration timing shown, which is based on the number of fish caught in sampling, not adjusted for effort. The solid line represents total catch each year (right axis). Stacked bars represent the catch each month as a percent of the annual total catch (left axis). Black and white portions of the stacked bars represent months before January 1 and blue and white portions of the stacked bars represent months after January 1. WY2015 bar includes data through May 2015. Confirmation of winter-run Chinook salmon presence in the Delta prior to January 1 is provided by genetic identification of juvenile fish in salvage sampling in 14 of the 18 years since genetic testing began in 1997 (DWR unpublished data; Table 4-1). Considering that these fish enter the Delta from the extreme northern end, while the salvage facilities are

Volume 2: Responses to Management Questions Final
22
located at the extreme southern end of the Delta, genetic salvage data demonstrate that winter-run Chinook salmon commonly have a broad distribution in the Delta prior to the January 1 onset, including regions proximate to the export facilities. Furthermore, rapid spikes in the cumulative catch of winter-run-sized Chinook salmon in the Knights Landing rotary screw trap indicate that the bulk of the population (not just the leading edge) entered the Delta prior to January 1 in seven of the nine years for which data were available (1999 to 2007; del Rosario et al. 2013). Table 4-1. Date of Earliest Salvage of Genetic Winter Run Chinook Salmon from 1997 to 2015
Water Year Earliest Salvage 1997 11/26/1996 1998 10/3/1997 1999 10/25/1998 2000 11/22/1999 2001 11/6/2000 2002 12/5/2001 2003 12/23/2002 2004 12/8/2003 2005 12/21/2004 2006 12/20/2005 2007 12/30/2006 2008 1/26/2008 2009 2/21/2009 2010 12/8/2009 2011 12/6/2010 2012 2/14/2012 2013 12/13/2012 2014 03/03/2014 2015 no salvage
Although genetic tests cannot dependably identify spring-run Chinook salmon, spring-run-sized Chinook salmon were detected entering, or within, the Delta prior to January 1 in all but three years from 1995 and 2015 (Figure 4-2), indicating that in many years, an earlier onset of OMR flow restrictions than January 1 would have provided better protection to this population as well. In contrast, juvenile steelhead have been detected in Delta monitoring prior to January 1 in only five of the 21 years from 1995 to 2015 (Figures 4-3 and 4-4). Considering the protected populations separately, the January 1 onset of OMR reverse flow management coincides with the presence of winter-run Chinook salmon in most years, spring-run Chinook salmon in many years, and steelhead in some years. If OMR reverse flow management were initiated based on first detection in the Delta rather than a fixed

Volume 2: Responses to Management Questions Final
23
date, OMR reverse flow management would often begin earlier than January 1 for the protection of winter-run and spring-run Chinook salmon, and later than January 1 for the protection of steelhead. Considering protected salmonid populations together, protected salmonids were present in the Delta prior to the existing onset of OMR reverse flow management (January 1) in all but one year (2014) of the 1995 to 2015 period.
Figure 4-2. Migration Timing of Non-Clipped, Spring-Run-Sized Chinook Salmon Originating from the Sacramento River and Its Tributaries Notes: Data are from both Sacramento Trawls (Sherwood Harbor) and beach seines in the Sacramento area, and North and Central Delta (data available at: http://www.fws.gov/lodi/jfmp/). Sampling effort and methodology changed within and among years; therefore, the “Total Count” per water year is not intended to be an abundance index—instead, it is intended to provide context to migration timing shown, which is based on the number of fish caught in sampling, not adjusted for effort. The solid line represents total catch each year (right axis). Stacked bars represent the catch each month as a percent of the annual total catch (left axis). Black and white portions of the stacked bars represent months before January 1 and blue and white portions of the stacked bars represent months after January 1. WY2015 bar includes data through May 2015.
Figure 4-3. Migration Timing of Non-Clipped Steelhead (O. Mykiss) Originating from the Sacramento River and Its Tributaries Notes: Hatchery steelhead were not clipped until brood year 1997, so catch data from 1995-1997 include both hatchery and wild fish. Notes: Data are from both Sacramento Trawls (Sherwood Harbor) and beach seines in the Sacramento area, and North and Central Delta (data available at: http://www.fws.gov/lodi/jfmp/). Fish of all fork lengths were included. Sampling effort and methodology changed within and among years; therefore, the “Total Count” per water year is not intended to be an abundance index—instead, it is intended to provide context to migration timing shown, which is based on the number of fish caught in sampling, not adjusted for effort. The solid line represents total catch each year (right axis). Stacked bars represent the catch each month as a percent of the annual total catch (left axis). Black and white portions of the stacked bars represent months before January 1 and blue and white portions of the stacked bars represent months after January 1. WY2015 bar includes data through May 2015.

Volume 2: Responses to Management Questions Final
24
Figure 4-4. Migration Timing of Non-Clipped Steelhead (O. Mykiss) Originating from the San Joaquin River and Its Tributaries
Notes: Hatchery steelhead were not clipped until brood year 1997, so catch data from 1995-1997 include both hatchery and wild fish. Data are from the Mossdale Trawls (data available at: http://www.fws.gov/lodi/jfmp/). Fish of all fork lengths were included. Sampling effort and methodology changed within and among years; therefore, the “Total Count” per water year is not intended to be an abundance index—instead, it is intended to provide context to migration timing shown, which is based on the number of fish caught in sampling, not adjusted for effort. The solid line represents total catch each year (right axis). Stacked bars represent the catch each month as a percent of the annual total catch (left axis). Black and white portions of the stacked bars represent months before January 1 and blue and white portions of the stacked bars represent months after January 1. WY2015 bar includes data through May 2015. Therefore, we conclude that in most years, improved protection of Sacramento River salmonid populations from export effects would be provided if the onset date of OMR reverse flow management were triggered by detection of migrants at monitoring stations located on the Sacramento River upstream of distributary junctions leading toward the San Joaquin River. The locations could include the Knights Landing rotary screw trap, the Sacramento trawl, or selected beach seine sampling locations. These triggers would also provide protection for San Joaquin River salmonid populations because Sacramento River populations generally enter the Delta, and would trigger OMR reverse flow management, prior to Delta entry of San Joaquin River salmonids. Monitoring programs and locations used to initiate migrant protection measures should be based on detecting the leading edge of migrant pulses prior to, or soon after, Delta entry. Such measures would help protect the life history diversity of Central Valley salmonids and are consistent with recommendations being developed in parallel by the Salmon Assessment Indicators by Life Stages (SAIL) effort underway through the Interagency Ecological Program (IEP).

Volume 2: Responses to Management Questions Final
25
4.1.2 OMR Flow Limit of -5,000 cfs Limiting OMR flow to -5000 cfs is effective at preventing export-driven increased routing into the Interior Delta, but data are limited to quantify effects on fish survival in the South Delta. Description of Conceptual Model Juvenile salmon and steelhead have historically entered the Interior Delta (that is, moved into distributary channels off the mainstems of the Sacramento River and San Joaquin River) during migration and for rearing, regardless of OMR reverse flow management actions, and will continue to enter the Interior Delta as they have since before the state and federal water projects began operation (Erkkila 1950). However, the conceptual model predicts that if export rates incrementally increase the flow of water toward the Interior Delta at distributary junctions, the proportion of juvenile salmonids entering the Interior Delta will also incrementally increase. This expectation is based on field and laboratory studies that demonstrate juvenile routing at distributary junctions in the Delta changes positively with the proportion of flow going down each distributary (Kemp 2005; Holbrook 2009; Perry 2010). However, the relationship is not necessarily one-to-one or even linear (Cavallo et al. 2015), and requires more rigorous study at junctions with predominantly tidal (as opposed to riverine) flow. Because salmonids using routes through the Interior Delta have historically exhibited low through-Delta survival rates (Volume 1, Appendix E, Section E.4.2), the conceptual model predicts that export effects that incrementally increase the routing of juvenile salmonids (either from the Sacramento River or from the San Joaquin River) into the Interior Delta will incrementally reduce overall survival. Conversely, actions that reduce the incremental influence of exports on routing into the Interior Delta will protect juvenile salmonids from export-linked mortality and increase survival. In recent years, survival of fall-run Chinook salmon migrating from the San Joaquin River has been low in all routes, suggesting that there are limitations to the effects of route manipulation on through-Delta survival for this population. In addition to the predicted effects of exports on routing, the conceptual model predicts that OMR reverse flow management will decrease mortality by increasing the probability that juveniles that enter the South Delta (San Joaquin River mainstem and channels to the south and west of the San Joaquin River mainstem) will successfully migrate out of the South Delta to Chipps Island. Mechanisms by which this might occur include: 1) reducing entrainment at the export facilities (see Management Question 4 for a discussion of salvage and OMR reverse flows); 2) reducing confusing navigational cues caused by OMR reverse flow; and 3) increasing the duration and magnitude of ebb tide flows and velocities, relative to flood tides,

Volume 2: Responses to Management Questions Final
26
which is expected to reduce the residence time of juveniles in the South Delta and, therefore, reduce exposure time to agents of mortality. The primary information we considered when evaluating OMR reverse flow limitations were DSM2 model results under various inflow and export scenarios presented in Volume 1, Appendix B, Cavallo et al. (2013), and Cavallo et al. (2015). The DSM2 simulation model is a calibrated, widely used, and validated flow model (Kimmerer and Nobriga 2008). The inflow and export scenarios with the HORB not installed presented in Volume 1, Appendix B are the same as those evaluated in Cavallo et al. (2013) and the OMR conditions for those scenarios are provided in Table 1 of Cavallo et al. (2013), and are excerpted below in Table 4-2. The HORB-out scenarios with OMR flows nearest -5,000 cfs include the low inflow and medium export scenario (OMR flow of -5,400 cfs) and medium inflow and medium export scenario (OMR flow of -4,614 cfs). Table 4-2. DSM2 Hydro Simulation Parameters
Source: Cavallo et al. (2013)
Junctions on the Sacramento River: Results of model studies using DSM2 demonstrate that, at OMR flows of approximately -5,000 cfs, the export effect on distributary flows from the Sacramento River into the Interior Delta (Cavallo et al. 2013, 2015) is small. Our conceptual model predicts that small changes in distributary flows will result in small changes in fish routing. Based on DSM2 model results and the conceptual model, but not based on specific analyses of routing-survival relationships, we conclude that a -5,000 cfs OMR reverse flow limit provides protection compared to more negative OMR reverse flow levels that would exert a larger influence on flow routing at distributary junctions and, thus, on juvenile routing and survival. However, we did not conclude at what precise level of OMR flow more negative than -5,000 cfs exports would begin to affect distributary flows, juvenile routing, and survival.

Volume 2: Responses to Management Questions Final
27
Junctions on the San Joaquin River: By the same reasoning as described above, DSM2 model results suggest that, at OMR flows of approximately -5,000 cfs, the influence of exports on juvenile routing from the San Joaquin River into the Interior Delta is generally low (Cavallo et al. 2013, 2015); this applies to all juveniles that migrate into the San Joaquin River, regardless of origin. The modeling indicates that over a range of San Joaquin River inflow between 1,400 and 5,700 cfs, changes of export levels from near-minimum health and safety levels to levels equivalent to an OMR flow of -5,000 cfs cause the proportion of distributary flow into the Interior Delta to increase by less than 2% at all junctions except at the head of Old River, where the increase is larger but is still less than 5% (Cavallo et al. 2013). Our current understanding of the relationship between distributary flow and juvenile routing suggests these small changes in distributary flow (based on modeling) would result in small changes in juvenile routing from the San Joaquin River into the Interior Delta. However, there is inadequate empirical evidence from fish tracking studies to validate this conclusion or to more precisely evaluate junction-specific relationships between distributary flow changes and routing changes. Based on DSM2 model results and the conceptual model, but not based on specific analyses of routing-survival relationships, we conclude that a -5,000 cfs OMR reverse flow limit provides protection compared to more negative OMR reverse flow levels that would exert a larger influence on flow routing at distributary junctions and, thus, juvenile routing. However, we did not conclude at what precise level of OMR flow more negative than -5,000 cfs exports would begin to affect distributary flows and juvenile routing. San Joaquin River Mainstem: Results of DSM2 modeling also demonstrate that at OMR flows of about -5,000 cfs, the effect of exports on velocity and flow in the San Joaquin River mainstem is low compared to export effects in Old River and Middle River (Volume 1, Appendix B). Our conceptual model predicts that the influence of export-driven hydrological changes on residence time within the San Joaquin River and any associated change in survival is small compared to potential effects in Old River and Middle River. Within the Interior Channels of the South Delta (channels south and west of San Joaquin River): While an OMR flow of about -5,000 cfs is predicted to reduce export effects compared to more negative OMR flow levels, the -5,000 cfs OMR flow is predicted to be less effective at preventing or minimizing export effects on juvenile routing at junctions and residence times within the interior channels of the South Delta than in the mainstems of the Sacramento River and San Joaquin River or distributary junctions leading into the Interior Delta. This is because the export-driven influence on hydrodynamic conditions at a given OMR flow level increases with proximity to the export facilities (see Management Question 1; Volume 1, Appendix B). However, it is uncertain to what extent the low survival rates observed in South Delta reaches are a result of the greater hydrodynamic influence of exports in this area.

Volume 2: Responses to Management Questions Final
28
Salvage: See Management Question 4 for a discussion of OMR reverse flow and salvage at the export facilities. Summary: An OMR flow of -5,000 cfs limits the degree to which exports incrementally increase routing into distributaries leading into the Interior Delta off the Sacramento River and San Joaquin River. Within the interior channels of the South Delta, the OMR reverse flow limit is likely less effective at preventing or minimizing export effects on juvenile routing at junctions and residence times than in the mainstems of the Sacramento River and San Joaquin River or distributary junctions leading into the Interior Delta. There is inadequate empirical evidence from fish tracking studies to more precisely evaluate junction-specific relationships between distributary flow changes and changes in fish routing and survival. As a result, there is uncertainty in relating specific OMR reverse flow thresholds to overall through-Delta survival.
4.2 DISCUSSION OF HOW WELL THE DATA INFORMED THE QUESTION
The first component of Management Question 3 was assessed based on available data. The conclusion regarding the January 1 onset date is based on peer-reviewed analyses and our independent analysis of screw trap, trawl, beach seine, and monitoring data, which identified the earliest presence of winter-run-sized juvenile Chinook salmon at entry points to the Delta, and salvage data indicating presence of genetic winter-run Chinook salmon in the South Delta. The second component of Management Question 3 was assessed less directly and based on hydrodynamic modeling and linkages of hydrodynamic effects to fish behavior and survival from published literature. Conclusions regarding the OMR reverse flow limit of -5,000 cfs are based on: 1) peer-reviewed publications, and agency and contractor reports demonstrating that fish routing increases with distributary flow at channel junctions; and 2) DSM2 modeling, which indicates that export driven changes in distributary flow are smaller at the lower export levels associated with the -5,000 cfs OMR flow limit. Limited data are available directly linking fish survival with OMR reverse flow levels.
4.3 AREAS OF TECHNICAL DISAGREEMENT AND UNCERTAINTY
There were no disagreements with the conclusion that the January 1 onset coincides with the presence of protected salmonids in the Delta in almost all years. There was a disagreement within the SST regarding the following:
• Whether improved protection of Sacramento River salmonid populations from export effects would result from an earlier onset of OMR reverse flow management based on monitoring data from the Sacramento River upstream of distributary junctions leading toward the San Joaquin River. SST members disagreed over whether the data provided in this report supported such a statement.

Volume 2: Responses to Management Questions Final
29
• Whether limiting OMR flow to -5,000 cfs is effective at preventing increased routing into the Interior Delta, and presumably resulting in increased survival. SST members disagreed over whether the data provided in Volume 1 or this report supported such a statement. Some felt the discussion and conclusion were based primarily on conceptual model predictions and reasoning, not on factual analysis.
The SST identified that there is considerable uncertainty in quantifying how incremental changes in hydrodynamic conditions at different OMR reverse flow thresholds translate into changes in routing or survival, and identifying how negative an OMR reverse flow threshold can be while still minimizing OMR flow and export-driven effects on routing and survival. 5.0 MANAGEMENT QUESTION 4 To what extent do salvage-density-based export restrictions improve survival of targeted populations of Chinook salmon and/or steelhead? We address whether density-based export restrictions improve the survival of juvenile salmonids in the South Delta (San Joaquin River mainstem and interior channels south and west of the San Joaquin River), particularly once they have entered interior channels of the South Delta. Density-based export restrictions are an element of two Reasonable and Prudent Alternative (RPA) actions in the 2009 NMFS Biological Opinion on Long-term Operations of the CVP/SWP. Action IV.3 is implemented during November and December of each year and requires short-term export restrictions when loss or loss density of juvenile salmonids at the salvage facilities exceed specified thresholds. Action IV.2.3 limits OMR flows to no more negative than -5,000 cfs during the January 1 to June 15 period each year and requires periods of more positive OMR flows when loss or loss density of juvenile salmonids at the salvage facilities exceed specified thresholds. Because OMR reverse flow is generally managed by changing exports, we use “export restrictions” throughout to refer generally to the short-term, density-based restrictions under either RPA action. The -5,000 cfs OMR reverse flow limit is intended to provide a baseline level of protection during the general period when ESA-listed juvenile salmonids are expected to be in the Delta (see Section 3.1.1). The density-based export restrictions in both actions trigger restrictions on exports or OMR flow during periods when loss or loss density for a particular population of juvenile salmonids (estimated from salvage density) indicates that a large number of those juveniles are in the Interior Delta, and are therefore exposed to a higher level of export effects and risk of entrainment.
5.1 CONCLUSIONS
5.1.1 Effects of Density-Based Export Restrictions on Direct and Indirect Mortality

Volume 2: Responses to Management Questions Final
30
Density-based export restrictions likely reduce direct mortality (take) at the export facilities; however, their effect on through-Delta survival could not be determined. Salvage data clearly indicate that juvenile loss at the export facilities, an estimate of mortality directly attributable to export operations, is greater during periods of more negative OMR flows (Figures 5-1 and 5-2). However, both CWT and acoustic telemetry studies suggest that the majority of mortality in the Interior Delta is not attributable to direct loss at the export facilities (Volume 1, Appendix E, Section E.3.2.2). Survival studies conducted to date have not been designed to measure route-specific survival at a scale that could resolve changes along interior channels of the South Delta within the specific range of hydrodynamic changes governed by density-based export restrictions (e.g., OMR reverse flow changes between -2,500 and -5,000 cfs). Therefore, there is little information to determine the effectiveness of density-based export restrictions on survival rates of juvenile salmonids that have entered this region of the Delta.
Figure 5-1. Relationship Between OMR Flows and Entrainment at the CVP, 1995 to 2007
Note: Modified from Figure 6-65 of NMFS (2009).

Volume 2: Responses to Management Questions Final
31
Figure 5-2. Relationship Between OMR Flows and Entrainment at the SWP, 1995 to 2007
Note: Modified from Figure 6-66 of NMFS (2009). Limited data are available to assess whether altered hydrodynamic conditions influence juvenile routing at junctions or migration rate along interior channels in the South Delta, the two primary mechanisms through which density-based export restrictions are intended to improve through-Delta survival. Delaney et al. (2014) analyzed directional movement of acoustic-tagged steelhead at Railroad Cut and found that one of nine OMR-based variables was significant, showing an increasing probability of steelhead tags moving toward the export facilities as OMR reverse flow values became more negative. However, Delaney et al. (2014) also noted that the small sample size limited the ability to examine the effectiveness of OMR reverse flow management on the movement of steelhead. 5.1.2 Effects of Short-Term Restrictions of Exports Relative to Low Overall
Survival Short-term restrictions of exports resulting in OMR reverse flows more positive than the -5,000 cfs OMR flow limit may do little to improve through-Delta survival for Chinook salmon due to low overall survival, but may improve juvenile steelhead through-Delta survival. Although there is not enough information to assess improvements in juvenile salmonid survival rate attributable to density-based export restrictions (i.e., OMR flow changes between -2,500 and -5,000 cfs), current through-Delta survival rates for San Joaquin River

Volume 2: Responses to Management Questions Final
32
Chinook salmon are low under all tested hydrodynamic conditions (Volume 1, Appendix E, Figure E.2-3, Table E.2-3). Therefore, any potential improvements in survival due to short-term density-based export restrictions will be difficult to detect, and may do little to improve overall through-Delta survival of Chinook salmon (beyond the -5,000 cfs OMR reverse flow limit already in place from January 1 to June 15; see response to Management Question 3). In contrast, based on two years of available data, through-Delta survival for juvenile steelhead survival (0.32 and 0.54; Volume 1, Appendix E, Section E.2.1, Table E.2-3) is high enough to suggest that hydrodynamic changes due to density-based export restrictions may result in changes in survival rates that are both easier to detect and have a greater influence on overall through-Delta survival than for salmon. Results from more recent studies (i.e., years 2013 to 2016 of the six-year steelhead study) will provide more information and improve our ability to answer this question for steelhead. 5.1.3 Hypothesized Mechanisms of Exports Influence Hypothesized mechanisms of how exports influence juvenile routing and residence times in the interior channels of the South Delta are unstudied. As mentioned in Section 4.1.1, the potential mechanism(s) of an export influence on juvenile routing and residence time in the interior channels of the South Delta (e.g., navigation cues and travel rate) are speculative. This is because there has been relatively little research specifically examining dominant mechanisms of juvenile navigation or fine-scale movement behavior in strongly tidal regions of the Delta, particularly in relation to tidally driven changes in water velocity and water quality. Nonetheless, hydrodynamic models suggest that juvenile salmon that enter the interior channels of the South Delta are subject to a heightened influence of exports on hydrodynamics, which increases with proximity to the pumps (Volume 1, Appendix B). For fish north (and downstream) of the export facilities, it is hypothesized that density-based export reductions resulting in more positive OMR flow will reduce the proportion of juveniles routing toward the export facilities at distributary junctions within the interior channels of the South Delta (see Section 3.1.2). There is limited evidence supporting this hypothesis for steelhead at the east end of Railroad Cut. This is based on Delaney et al. (2014), which examined the effect of OMR flows using general linearized models and reported that the proportion of steelhead tags moving north or south on Old River after passing through Railroad Cut from Middle River was related to OMR flow on the day that tagged steelhead were first detected at the Old River arrays. For fish navigating to exit the Delta via Chipps Island (i.e., not via salvage), density-based export restrictions are hypothesized to reduce residence time in the South Delta and lead to improved survival due to the low survival rates observed in South Delta routes. While there is not enough information to evaluate these hypotheses, and as noted in Section 4.1.2, at current low survival rates, any improvement in survival from alternative export operations may be
Volume 2: Responses to Management Questions Final
33
difficult to detect and of limited value toward improving through-Delta survival of Chinook salmon, especially for San Joaquin River salmon. The SST considers the following research questions to be a high priority for improving our understanding of the potential mechanisms relating daily OMR flow to juvenile routing, residence time, and survival in the interior Delta:
• What is the effect of hydrodynamic changes (e.g., magnitude and duration of flow toward the ocean) on juvenile salmonid routing and movement rate toward the ocean at junctions and along channels?
• Do exports create water quality conditions (e.g., salinity gradients) that confuse juvenile salmon ability to navigate in the correct direction out of the interior Delta at junctions and along channels?
5.1.4 Effects of Exports on Delta Habitat Effects of exports on Delta habitat have not been examined, but may have a stronger effect on survival than effects on short-term hydrodynamics. Low Chinook Salmon survival exhibited under all tested hydrodynamic conditions in the South Delta, and particularly the interior channels of the South Delta, demonstrates there are conditions in this region conducive to high mortality rates that persist regardless of export changes occurring at the scale of days or weeks (Volume 1, Appendix E). An example of such a condition is habitat that supports high predator density or makes juvenile salmonids more vulnerable to predators. It is uncertain whether, and by how much, exports and inflow affect these persistent conditions. However, we can say the following:
• Research conducted to date has primarily focused on effects of short-term (i.e., within-season) changes in exports and inflow on routing and through-Delta survival, and has not collected the necessary data to relate changes in habitat to reach-specific survival.
• Habitat conditions mediate juvenile interactions with predators, food, and pathogens; both habitat conditions and channel network configuration affect how juvenile navigation and movement behavior (e.g., geomagnetic orientation and tidal surfing) translate into larger scale migration patterns.
• Long-term trends and patterns in water management (i.e., inflow, exports, and channel network reconfiguration) may influence habitat conditions that have a greater effect on survival rate than do short-term OMR reverse flow management between -2,500 and -5,000 cfs, which may partly explain the difficulty in finding a relationship between short-term changes in OMR reverse flow and juvenile salmonid survival.

Volume 2: Responses to Management Questions Final
34
5.2 DISCUSSION OF HOW WELL THE DATA INFORMED THE QUESTION
Little information is available to address this question. Conclusions regarding the relationship between density-based OMR reverse flow restrictions and direct mortality at the export facilities were informed by plots of monthly loss estimates at different levels of monthly average OMR flow. Conclusions regarding the effects of density-based OMR reverse flow management actions on indirect mortality were informed by: 1) overall low through-Delta survival rates from results of acoustic telemetry studies; and 2) the extrapolation of information on juvenile routing and residence time based on DSM2 modeled changes in tidal flow and velocity at different levels of export and inflow, coupled with the demonstrated relationship between flow and juvenile movement behavior exhibited in more riverine regions of the Delta. Existing analyses of CWT-tagged fish releases (which constitute the majority of tagging data available) were not useful for providing a definitive answer to this question because they were designed to address survival rate at a larger spatial scale than appears necessary for this question. Although AT studies provide reach-specific survival estimates, the focus of tagging studies remains on through-Delta survival, and the overall low survival rate for Chinook salmon makes it difficult to measure the small survival changes necessary to address this question.
5.3 AREAS OF TECHNICAL DISAGREEMENT AND UNCERTAINTY
There were no disagreements with the conclusion that density-based export restrictions likely reduce direct mortality (take) at the export facilities. There was a disagreement within the SST regarding the following:
• Whether short-term restrictions of exports resulting in OMR flows more positive than the -5,000 cfs OMR reverse flow limit may do little to improve through-Delta survival for Chinook salmon due to low overall survival. The disagreement was that because there is no evidence of the effects of OMR reverse flow restrictions on survival, there is no evidence that the continued OMR reverse flow restrictions will affect survival.
• Whether or not to present the hypothesis that the unexamined influence of exports on habitat may have a stronger effect on survival than export influence on short-term hydrodynamics because the argument is based on reasoning and not data analysis.
The SST identified the following uncertainties related to the effects of exports on salmonid survival:
• Whether the fish routing flow split relationship can be coupled with DSM2 flow split estimates to estimate export influence, or whether precise correlations and direct effects must be empirically measured during controlled export rate experiments at every major junction in the Delta to arrive at an acceptable conclusion.
• Whether experiments using tagged fish are capable of detecting a potential export effect when overall survival rates are low.

Volume 2: Responses to Management Questions Final
35
6.0 MANAGEMENT QUESTION 5 In considering the effectiveness of flow metrics as a management tool, are there alternative or additional metrics (e.g., OMR flows, export volumes, monthly export limits, etc.) that could be used to manage South Delta water operations, and improve survival of migrating salmonids in the South Delta? Yes. The SST identified five metrics that could be developed and tested for their potential as flow management tools to help refine SWP and CVP export operations to improve juvenile salmonid survival through the Delta. Each of the metrics identified below are concepts at this point; therefore, we described their linkages to our conceptual model. To have utility, water management actions must influence and control conditions incorporated into the metric that result in improved survival.
6.1 ADDITIONAL METRICS
6.1.1 Qwest Definition: Qwest is the average daily net flow (in both direction and magnitude) in the lower San Joaquin River at Jersey Point. Qwest is calculated, not measured. Qwest is primarily driven by Delta inflow from the San Joaquin and Mokelumne rivers, SWP and CVP export rates, and tides. Linkage to conceptual model: Based on the conceptual model, increased export rates are expected to draw more fish into the Interior Delta and water export facilities, and (via direct mortality) decrease fish survival through the Delta to Chipps Island (Volume 1, Appendix E, Section E.6). Higher (more positive) values of Qwest would indicate there is a greater net flow of water toward the ocean. This is expected to increase survival by providing conditions that provide cues for both Sacramento River- and San Joaquin River-origin salmonids migrating downstream, help guide juvenile salmonids through mainstem and Interior Delta channels toward Chipps Island, and reduce their exposure to potential sources of mortality within the Delta and entrainment at the export facilities. 6.1.2 Hydraulic Residence Time in The South Delta Definition: Hydraulic residence time is the length of time a water particle remains in an area of the Delta. Linkage to conceptual model: Water particle residence time in the South Delta is influenced by tidal dynamics and circulation; Delta inflow from the San Joaquin, Mokelumne, and Sacramento rivers; and SWP and CVP export rates. The conceptual model predicts that water velocities and flow direction in South Delta channels change in response to exports,

Volume 2: Responses to Management Questions Final
36
and the magnitude of velocity change varies depending on the magnitude of export rates, tidal condition, distance from the export facilities, Delta inflow, and channel location and configuration (Volume 1, Appendix B). The conceptual model links flow through Old River and Middle River to survival via the influence of OMR reverse flow management on migration route selection and migration rate. Specifically, more negative OMR flows are expected to draw (i.e., act as a flow cue) fish from the Sacramento River or lower San Joaquin River into the Interior Delta and toward the facilities, and prevent fish that have entered the Interior Delta from navigating northward through Delta channels to the Delta exit (Volume 1, Appendix E, Section E.7). Hydraulic residence times may be an indicator of juvenile salmonid residence times in key areas such as the South Delta. Longer fish residence time may result in higher mortality due to a longer period of exposure to potential sources of mortality. Export restrictions are expected to increase the downstream direction and magnitude of ebb tide flows and velocities, relative to flood tides. This is expected to reduce residence times of juveniles in the South Delta and, therefore, reduce exposure time to agents of mortality such as agricultural diversions, poor water quality, and predators. Background information: The XT model predicts that survival of juvenile salmonids (prey) will be proportional to migration rate in tidal reaches because juvenile salmonids slow down relative to predators, resulting in longer exposures and increased risk of mortality (Anderson et al. 2005; Volume 1, Appendix E, Section E.5.2). The SST did not specifically evaluate the effects of OMR flows on survival, and as referenced in Section 4.1.1, the effect of OMR flows on survival in the Delta remains a knowledge gap. It has been observed in the north Delta that slower migration rates are correlated with increased mortality of juvenile Chinook salmon; however, no effort was made to relate this finding directly to predator density (e.g., Perry et al. 2010). Cavallo et al. (2012) observed in an experimental study that large increases in flow in the lower Mokelumne River were followed by increased migration rates and higher survival for juvenile Chinook salmon, but the survival effect was not consistent across reaches (Volume 1, Appendix E, Section E.5.2). More broadly, there is ample evidence in the scientific literature that actively migrating fish in riverine (not tidal) conditions are assisted by flows moving in their migration direction. However, there is uncertainty associated with longer hydraulic residence time in the South Delta. Longer times could result in greater phytoplankton and zooplankton production and more food for juvenile salmonids, but when combined with slower velocities, longer residence times could also improve conditions for predators such as largemouth bass.

Volume 2: Responses to Management Questions Final
37
6.1.3 Percentage of Positive (Downstream) Flow in Old River, Middle River, and Other Interior Delta Locations
Definition: The percentage of flow that is positive in Old River, Middle River, and other Interior or South Delta locations. For example, this metric could be developed as the percentage of time within a 24-hour period that flow at a specific location is in a downstream direction. Linkage to conceptual model: Export effects on water velocity and flow were predicted by the conceptual model, and supported by model analyses, to be greatest in the immediate vicinity of the export facilities and diminish as a function of distance away from the facilities (Volume 1, Appendix B). Route selection is expected to be proportionate to the incremental effect of exports on water velocity and flow within a channel or at channel junctions (Volume 1, Appendix D, Sections D.3.2, D.8, D.9, and D.10). Flow through Old River and Middle River is linked to survival via flow, exports, and the influence of OMR reverse flow on migration rate, route selection, route survival, and salvage. Increased negative OMR flow is hypothesized to guide fish into the Interior Delta and toward the export facilities, prevent fish that have entered the Interior Delta from navigating northward through Delta channels to the Delta exit, and decrease through-Delta survival, although analyses explicitly linking migration and survival to OMR reverse flow management is limited (Volume 1, Appendix D, Section D.9). For San Joaquin River fish that have already entered the South Delta at the head of Old River, increased negative OMR flow may result in faster entry to salvage facilities at the CVP and SWP, and may be associated with higher survival from the head of Old River to Chipps Island via the Old River route (Volume 1, Appendix E, Section E.7). Background information: Currently, the magnitude of OMR reverse flow is used to regulate SWP and CVP exports. A potential mechanism for the interaction between the proportion of time flows are positive (i.e., in a downstream direction) is the change in the direction of flow cues for migration. Under a natural hydrograph, flow direction in Old River and Middle River is upstream during flood tides and downstream during ebb tides (depending in part of the magnitude of Delta inflow and tidal energy), with an overall net positive (downstream) flow direction. However, as exports increase, overall net flow can become negative (upstream) in some parts of Old and Middle rivers. Nearest the facilities, under some conditions the flow direction on the ebb tide may no longer be downstream and instantaneous flow is upstream (i.e., flow is reversed) throughout the ebb and flood tidal cycles. Juvenile salmonids are thought to be guided by directional flow cues. Therefore, under reverse flow conditions, juveniles in Old River and Middle River may move further upstream into the South Delta rather than downstream toward Chipps Island and also lose an important migration cue while migrating downstream. These factors may increase their risk of entrainment and contribute to delays in migration that could decrease survival due to factors such as predation.

Volume 2: Responses to Management Questions Final
38
6.1.4 The Relative Proportion of CVP Exports During the Juvenile Salmonid Migration Period
Definition: The proportion of CVP exports relative to total export level (SWP and CVP exports combined) during specific salmonid outmigration and water operation periods. Linkage to conceptual model: The conceptual model predicts that pre-screen mortality is higher at the SWP than at the CVP (Volume 1, Appendix E, Section E.3.1). Background information: A metric that estimates the proportion of CVP exports relative to total export level during the juvenile migration period would be a useful tool for managing the proportion of exports through each facility. Salvage rates and the survival of salvaged fish have been estimated but there is considerable uncertainty about the proportion of salmonid migrants that are salvaged annually, and the population-level effect of salvage operations (Volume 1, Appendix E, Section E.3.2.1.4). Prescreen mortality estimates at the SWP have ranged from 0.63 to 0.99 for Chinook salmon between 1976 and 1993 (Gingras 1997), and from 0.78 to 0.82 for steelhead (Clark et al. 2009) (Volume 1, Appendix E, Section E.3.1). Based on these data and the conceptual model, increasing the proportion of water exported through the CVP relative to the SWP is expected to reduce direct mortality and result in increased cohort strength and adult escapement. However, before preferentially exporting more water from the CVP, pre-screen losses at the CVP should be measured to see if they are similar to those assumed (15%). 6.1.5 Proportion of Sacramento River Water Arriving at Export Facilities Definition: The proportion of water arriving at export facilities from the Sacramento River relative to the total volume of flow entering the Delta. This metric would be based on hydrodynamic modeling. Linkage to conceptual model: The conceptual model links mortality to exports via effects of exports on Delta hydrodynamics, the effect of hydrodynamics on route selection and migration rate, and the effect of route and rate on survival. The conceptual model also links exports to mortality via direct mortality at the facilities from prescreen mortality, impingement on screens, within-facility mortality, and canal entrainment mortality. Via both direct and indirect effects, possibly including linkages that were not analyzed by the SST, the conceptual model predicts that survival in the Delta will depend at least in part on export rate (Volume 1, Appendix E, Section E.6), and that increased export rates would result in decreased survival through the Delta to Chipps Island (Volume 1, Appendix E, Section E.6.1).

Volume 2: Responses to Management Questions Final
39
For Sacramento River-origin fish, the conceptual model predicts that survival to Chipps Island is anticipated to be higher in Sacramento River mainstem routes than in Interior Delta routes (Volume 1, Appendix E, Section E.9). Therefore, lower proportions of Sacramento River water entering the Interior Delta will result in higher survival of Sacramento River-origin fish. Higher Sacramento River inflow is predicted to reduce the proportion of fish entering the Interior Delta via Georgiana Slough, Three Mile Slough, or the DCC by pushing the tidal prism downstream (Volume 1, Appendix E, Section E.9) and reducing tidal flow reversals in the Sacramento River. Background information: The conceptual model prediction that increased export rates would result in decreased survival through the Delta to Chipps Island is not well supported by the data. There is some, but not strong support, for this prediction for Sacramento River fish that take Interior Delta routes. A negative relationship between export rate and through-Delta survival was found for Sacramento River late-fall-run Chinook salmon based on CWT data (Newman and Brandes 2010), although more recent AT data from late-fall-run Chinook salmon showed no relationship (Perry 2010). Newman and Brandes (2010) and Perry et al. (2013) found that survival probability of late fall Chinook salmon through the Sacramento River was always greater than survival for migration routes through the Interior Delta. The probability of juvenile salmonids migrating into the DCC or Georgiana Slough varies in response to local hydrodynamic conditions, whether the DCC gates are closed, and in the case of Georgiana Slough, whether the non-physical (behavioral) barrier is installed and operating (DWR 2012). Perry et al. (2013) reported sensitivity of Delta survival estimates to DCC closure, but without taking into account potential changes in salinity and hydrodynamics caused by DCC closure. Perry et al. (2015) studied the effect of DCC closure on salmonid entrance into Interior Delta (via a flow simulation model), but not survival. The effects of reducing the proportion of Sacramento River water entering the Interior Delta on the survival of San Joaquin River fish are unknown. Our conceptual model would say this may improve survival by reducing confusing cues for salmon from the San Joaquin basin trying to find the ocean as they migrate through the Delta. However, it will also increase the proportion of flow exported that originates from the San Joaquin River, which may reduce the survival of San Joaquin River fish due to entrainment into the South Delta. Therefore, additional analysis and research is needed to determine how flow entering the Interior Delta from the Sacramento River affects survival among fish stocks from both river sources.
6.2 AREAS OF TECHNICAL DISAGREEMENT
There were no areas of formal scientific disagreement among SST members regarding these metrics. There was discussion of, and uncertainty over, whether the following additional approaches should be included in the list of metrics (so they were not included):

Volume 2: Responses to Management Questions Final
40
• Managing exports based on a metric (e.g., velocity and flow direction) specific to Old River, rather than using the present combined metric of OMR flows. Observations show variation in export effects between Old and Middle rivers and indicate that export effects on hydrodynamic conditions are greater on Old River.
• Managing inflow into the South Delta from specific water sources (e.g., San Joaquin versus Sacramento or Mokelumne rivers) to reduce the number of fish diverted into the South Delta and improve survival.
• Applying a season-wide limit on maximum export rate or export volume. Zeug and Cavallo (2014) report results of an analysis of CWT juvenile Chinook salmon salvage showing that the numbers of salmon salvaged increased as export rate and export volume increased. Development of a technical basis for establishing an alternative metric based on a maximum export rate or seasonal volume would require additional analyses.
7.0 MANAGEMENT QUESTION 6 Are there biological response metrics that would be useful for assessing the effectiveness of RPA actions (for example, as suggested in Anderson et al. 2014, pages 5, 42)? Yes. The SST identified eight biological metrics that could be developed and tested for assessing the effectiveness of management actions (e.g., San Joaquin River I:E ratio, OMR reverse flow management, and export reductions) to improve juvenile salmonid survival through the Delta. The metrics range from spatially explicit to population-level metrics. Some of the metrics, such as survival at the reach scale, have been measured in the past but there is no formal requirement for their use in managing water project operations at this time. Many of the metrics identified below are concepts at this point; therefore, we described their linkages to our conceptual model where appropriate (note that the current conceptual model does not link to every metric). Additional analyses that assess the underlying relationships between the metrics listed and changes in water management operations are needed to ensure that effects of changes can be measured. New metrics deemed to be informative based on these analyses could be incorporated into a model framework to determine optimal fish routings and water operations, and which metric would be the best at assessing the effectiveness of management actions. The framework would consist of life cycle, flow management, and water operation models. The model framework would evaluate the contribution of specific routings and operations to specific biological objectives such as juvenile survival, cohort replacement rate, population viability, smolt-to-adult return rate, and population abundance.

Volume 2: Responses to Management Questions Final
41
7.1 ADDITIONAL METRICS
7.1.1 Fish Routing into the Interior Delta Under Various Operations Definition: The metric would estimate the proportion of test fish at specific channel junctions that enter the Interior Delta. Linkage to conceptual model: The conceptual model predicts that:
• The effect of exports and inflows, within the context of tides, on average, minimum and maximum daily flows, varies with proximity to the export facilities, channel configuration, barrier deployment, and CCF radial gate operation (Volume 1, Appendix B).
• Route selection is expected to be proportionate to the incremental effect of exports on water velocity and flow within a channel or at channel junctions (Volume 1, Appendix D, Section D.3.2).
• Survival to Chipps Island from downstream entry points to the Interior Delta is higher for fish that remain in the San Joaquin River mainstem than for fish that enter the Interior Delta (Volume 1, Appendix E, Section E.4.1).
This metric would assess the proportion of salmonids entering the Interior Delta through key junctions and channels under various conditions (e.g., I:E ratios or less negative OMR flow), and how the proportion changes with exports and is related to SWP and CVP salvage and through-Delta survival. Key junctions and routes within both riverine and tidal reaches should be evaluated (e.g., Turner Cut, Columbia Cut, Old River, and the mouth of Middle River). Studies would be needed to determine how water operations affect channel junction flow and velocity characteristics, and how fish respond to the characteristics in terms of routing and survival. The objective of the metric is to quantify how fish respond to conditions at channel junctions, which can then be used to adjust operations (i.e., routings) to increase survival by reducing the proportion of fish entering the Interior Delta. The utility of the metric depends on there being a difference in survival between routes, and so it may be more useful in some years or for some populations than for others. 7.1.2 Survival at the Route and Reach Scale Definition: The metric would estimate survival within specific reaches or to specific locations within the Delta under various operations. These could take the form of route-specific survival (e.g., survival through Old River versus the San Joaquin River for fish observed at the head of Old River) and reach-specific survival within routes. Linkage to conceptual model: The conceptual model predicts that:

Volume 2: Responses to Management Questions Final
42
• Survival to Chipps Island from downstream entry points to the Interior Delta is higher for fish that remain in the San Joaquin River mainstem than for fish that enter the Interior Delta (Volume 1, Appendix E, Section E.4.1).
• The relationship between migration rate and survival will vary for different reaches, and will be stronger in tidal reaches (Volume 1, Appendix E, Section E.5.1).
• The relationship between I:E and survival may vary in different regions of the Delta (Volume 1, Appendix E, Section E.11.1).
Physical conditions that fish are exposed to vary among regions of the Delta because the regions (e.g., upper San Joaquin River mainstem, Interior Delta, and South Delta) are each influenced by different drivers of hydrodynamic conditions—inflow, exports, and tides. Therefore, estimates of through-Delta survival will not inform how survival varies at within-Delta scales. The objective of the metric is to assess how water project operations (inflow and exports) and tides affect salmonid survival at route and reach scales. Identifying reaches where survival is high (preferred routing) or low (needs additional research) will help inform how to increase survival through water project operations. It should be noted that survival may not vary with water project operations in some reaches. This would be instructive and would suggest that the changes in conditions that fish are exposed to from operations are insufficient to elicit or detect a response, or the underlying habitat is degraded to a point or is in such good condition that changes in hydrodynamic conditions have no effect. Also, survival has been estimated for some routes and reaches (Volume 1, Appendix E, Section E.4.2). The objective of the metric is to discuss and select key reaches and routes that will be monitored over time as water operations vary. 7.1.3 Survival at the Delta Scale Definition: The metric would estimate survival through the Delta. Through-Delta survival has been measured for juvenile Chinook salmon in most years since 1994 and for juvenile steelhead since 2011. Continued monitoring of through-Delta survival would inform trend analyses. Linkage to the conceptual model: The conceptual model predicted:
• A positive relationship between San Joaquin River inflow and through-Delta survival (Volume 1, Appendix E, Section E.8.1).
• Increased Sacramento River inflow is associated with increased survival to Chipps Island for Chinook salmon migrating from the Sacramento River (Volume 1, Appendix E, Section E.9.1).
Given the uncertainty in the available information, the SST recommends adopting an adaptive management approach to researching and managing water project operations and salmonid survival (Volume 1, Section 4). Such an approach requires regular monitoring.

Volume 2: Responses to Management Questions Final
43
Ultimately, through-Delta survival is more important than reach survival because fish need to survive through the entire Delta in order to return as adults, although the relationship between through-Delta survival and water project operations may be less predictable than reach survival because as pointed out in the preceding section, Delta regions likely respond to operations in different ways. The management objective of the metric is to monitor survival in a consistent and replicated manner to assess trends in survival among species over time, and develop data needed to evaluate key covariates influencing survival. The temporal frequency of the monitoring required will need to be assessed and discussed. For example, whereas estimating survival to evaluate the influence of key covariates may require annual monitoring, assessing changes in survival trends may require less frequent monitoring. 7.1.4 Condition of Fish Entering and Leaving the Delta Definition: The metric measures the condition of fish (represented by indicators such as fork length or disease prevalence) sampled at locations upstream of and within the Delta. Linkage to conceptual model: No predictions were made relative to disease prevalence. The conceptual model predicts that hydrodynamic effects on juvenile salmonids depends on life-stage and the size of fish (Volume 1, Appendix D, Section D.3). Background information: The SST discussed the role of fish length in relation to through-Delta survival (Volume 1, Appendix E, Section E.9.2.1) and migration rate (Volume 1, Appendix D, Section D.3). Fish condition and health is an important metric for understanding the potential effects of environmental conditions on salmonid survival upstream of the Delta and through the Delta, and fish population abundance. As fish are exposed to suboptimal conditions, the potential for fish condition and health to cause observable effects on juvenile survival occur (Jeffries et al. 2014; Hostetter et al. 2012). If condition (represented by fork length or disease) of a population of fish exiting the Delta is higher than of the entrance population, this suggests that poor-condition fish were culled, or they improved their condition on an individual level (i.e., grew) during Delta residence. In this situation, the mixed implications of changes in condition may not be that instructive. In contrast, if condition of a population of fish exiting the Delta is lower than the entrance population, this suggests the Delta is a stressor and may have delayed negative effects, which would be informative. Therefore, comparison of entrance and exit population condition can be useful if the exit population is in worse condition than the entrance population, but not necessarily the other way around. 7.1.5 Contribution of Fry Rearing to Survival and Adult Production Definition: The proportion of returning adults that displayed extended Delta rearing as fry based on otolith (microchemistry) analysis.

Volume 2: Responses to Management Questions Final
44
Linkage to conceptual model: The conceptual model predicts that how water velocity affects juvenile salmonids depends on life-stage and the size of fish (Volume 1, Appendix D, Section D.3). Background information: This metric attempts to evaluate the level of diversity in fry rearing location among adults in relation to adult abundance and water project operations experienced during rearing. It would require that otoliths of returning adults be analyzed using microchemistry techniques (e.g., Bourret et al. 2014). The contribution of fry rearing in the Delta to overall adult abundance has been assessed for winter-run Chinook salmon and fall-run Chinook salmon in the Stanislaus River. The SST did not specifically evaluate the relationship between life history observed in the Delta and population-level effects. However, it is expected that diversity in life history expression for juvenile salmonids (e.g., variable rearing strategies in the rivers and Delta, variable migration timing, and variable size at migration) contribute to increased population-level viability. It is possible that water project operations (exports and inflow), seasonal gate and barrier operations, and Delta export operations may constrain and reduce life history diversity and survival. We point out that additional analyses that incorporate a wider range of life stages (e.g., smolt-to-adult return rates or spawner-recruit relationships) may be necessary to adequately relate data from juvenile tagging studies to populations of interest (Volume 1, Appendix E, Section E.13). Studies of fry survival within and through the Delta are limited (Volume 1, Appendix E, Table E-1), yet fry rearing in the Delta is likely an important contributor to adult returns in certain years, helps buffer environmental variability across time, and supports population viability. The SST found that the conceptual model prediction that how water velocity affects juvenile salmonids depends on life stage, and the size of fish was confirmed. Larger smolts generally have a greater ability to hold and not be passively displaced compared to smaller fry; this ability could support behaviors such as selective tidal stream transport. Larger smolts typically have a faster rate of migration and may exhibit more active swimming, although species differences may have a larger effect than size differences (e.g., steelhead versus Chinook salmon). However, the SST also identified that how rearing fry or parr (as opposed to migrating fry or parr) respond to hydrodynamic factors such as water velocity is a knowledge gap (Volume 1, Appendix D, Section D.1.2.1.2). The lack of understanding regarding the effects of water year and water project operations on habitat suitability, geographic distribution, and fry growth, survival, or abundance is a significant data gap.

Volume 2: Responses to Management Questions Final
45
7.1.6 Probability of Export Facility Entrainment Definition: This metric estimates the predicted risk that a juvenile salmonid at a given location and point in time would be entrained at the export facilities in response to export operations and Delta hydrodynamic conditions (e.g., barriers, exports, and OMR reverse flow), and environmental conditions (e.g., inflow and temperature). The metric would be based on models. Linkage to conceptual model: The conceptual model predicts that:
• Mortality is linked to exports via effects of exports on Delta hydrodynamics, the effect of hydrodynamics on route selection and migration rate, and the effect of route and rate on survival (Volume 1, Appendix E, Section E.6.1).
• Direct mortality is a function of export rates (Volume 1, Appendix E, Section E.3.1). Background information: Mortality of juvenile salmon at federal and state water projects is typically attributed to three general components: pre-screen loss, entrainment into the water project intakes (as measured by louver efficiency), and within-facility or salvage loss, which includes mortality due to predation and handling within the facility and during trucking and release. Pre-screen loss is defined as loss occurring on the facility side of the trash racks at the CVP, and on the facility side of the radial gates at the entrance to CCF at the SWP, and is assumed to be due to predation. The biological goal of the metric is to evaluate operations and conditions that reduce the number of fish entering the facilities where they are exposed to a higher risk of pre-screen loss, within-facility mortality, and canal entrainment. 7.1.7 Estimating Direct (Salvage) Mortality Relative to Overall Population
Abundance Definition: The percentage of direct (salvage) mortality through the Delta relative to estimated population abundance entering the Delta. Linkage to conceptual model: The conceptual model (Volume 1, Appendix E, Section E.3) predicts that:
• Direct mortality is a function of export rates. • Pre-screen mortality is higher at the SWP than at the CVP, and is higher for Chinook
salmon than for steelhead. • Louver efficiency is higher at higher export levels. • Salvage can be used as an index for direct canal entrainment mortality through the
louvers.

Volume 2: Responses to Management Questions Final
46
Background information: The objective of this metric is to evaluate facility mortality (currently estimated from salvage counts) relative to estimates of population abundance at entry locations to the Delta (i.e., Sacramento River and San Joaquin River) to characterize effects of facility loss at the level of the fish management unit – the population. Currently, incidental take of winter-run Chinook salmon is based on estimates of the number of winter-run-sized juveniles entering the Delta. For these fish, a take limit on natural juvenile winter-run Chinook salmon of from 1 to 2% is developed each year based on the juvenile production estimate (JPE), which allows take to vary each year based on annual variation in the estimates of juvenile production and abundance. However, loss of winter-run Chinook salmon at export facilities could be estimated based on more accurate genetic tissue analysis rather than current length-at-date criteria, and related to population abundance at Sacramento based on improved estimates of Sacramento River trawl efficiencies. This metric is supported by ongoing efforts to estimate winter-run Chinook salmon population abundance at Sacramento and Chipps Island trawls using these improved methods. However, genetic markers for stocks other than winter-run Chinook salmon are ambiguous and make estimates of abundance of these populations challenging. For these stocks, additional research will be required to generate estimates of take at salvage facilities relative to population abundance at Delta entry locations. 7.1.8 Juvenile Abundance at Chipps Island or Locations Further
Downstream Needed for Population-Level Context Definition: This metric estimates the abundance of salmon populations leaving the Delta (Chipps Island) or locations further downstream (e.g., Benicia or Golden Gate bridge). Linkage to conceptual model: No predictions were made about how juvenile abundance at Chipps Island or further downstream may influence salmonid population productivity. Background information: Efforts are underway to estimate winter-run Chinook salmon abundance at Sacramento and Chipps Island trawl locations. These estimates could be incorporated into the existing winter-run Chinook salmon lifecycle model and used to improve calibration of the model and estimate the level of through-Delta survival needed to achieve population productivity and escapement goals. The Southwest Fisheries Science Center is currently extending the existing winter-run Chinook salmon lifecycle model to other Central Valley Chinook salmon runs. Similarly, if abundance estimates for other populations were available at Sacramento and Chipps Island trawl locations, or locations further downstream (e.g., Benicia or the Golden Gate bridge), these could be incorporated

Volume 2: Responses to Management Questions Final
47
into lifecycle models to provide a population-level context and estimate the level of through-Delta survival needed to achieve population productivity and escapement goals.
7.2 AREAS OF TECHNICAL DISAGREEMENT
In the course of discussing additional biological metrics, there was a technical disagreement within the SST over whether to recommend that PIT tag technologies be applied to the Delta to facilitate monitoring of biological metrics. Some SST members believe PIT tags could expand the available evaluation methodologies, while others believe the technology will not provide any better information than is currently available through existing methodologies. Based on this disagreement, recommendations on the potential use of PIT tags were not included in this response to Management Question 6. 8.0 MANAGEMENT QUESTION 7 Do DSM2 Hydro and/or other available hydrodynamic models provide outputs that are appropriate and useful for assessing how exports from the South Delta, river inflows, and tides may influence the magnitude, duration, and direction of water velocities within selected channels and channel junctions in the Delta? What are the strengths and limitations of various simulation models and their application to assessing the relationship between water project operations and salmonid migration and survival? The answer to the first the question is yes (at some locations and temporal scales) and no (at other locations and temporal scales). The correct model to use depends on the application and whether supporting information exists to calibrate and validate the model. The answer to the second question is that there is nothing inherently wrong with any of the models, but each has different strengths and limitations, as discussed below.
8.1 CONCLUSIONS
8.1.1 The Strengths and Limitations of Each Model Govern Their Utility The application of hydrodynamic simulation models for addressing biological management issues in the Delta depends on the specific objectives of the question and hypotheses being addressed. The choice of an appropriate model is dependent on (and results in tradeoffs between) the spatial and temporal resolution that is required, complexity of hydrodynamic conditions that are being investigated, availability of calibration data, and financial and computational resources available to conduct the modeling. Hydrodynamic models developed for water project planning have typically been used for long time scales (e.g., daily) and large geographic areas (e.g., San Joaquin River flow routing).

Volume 2: Responses to Management Questions Final
48
The application of current hydrodynamic simulation models to predictions of flow and velocity at South Delta channel junctions when encountered by migrating salmonids at specific times (i.e., on short time scales and within small geographic areas) may not be reliable based on the spatial and temporal resolution and model accuracy needed to support the fishery analysis (Volume 1, Appendix B, Section B.3; Volume 1, Appendix C). DSM2 Hydro, a 1-D simulation model developed primarily for water supply planning, is useful for assessing how exports and South Delta hydrodynamics can influence water velocities and flows within channels. When supported by a clearly articulated behavioral mechanism, DSM2 Hydro estimates of flows and velocities summarized over time can sometimes be used to assess fish behavior at corresponding coarse scales of time and space. However, 15-minute velocities and flows estimated from DSM2 Hydro are not appropriate for assessing fish fates and behaviors at specific times and locations. Therefore, assessing fish fate and behaviors at specific times and locations may require the application of more refined and sophisticated 2-D or 3-D hydrodynamic simulation models. The SST discussed the application of existing hydrodynamic models for assessing how exports from the South Delta, river inflows, and tides may influence the magnitude, duration, and direction of water velocities within selected channels and channel junctions in the Delta at the spatial and temporal scales needed for biological studies. There was general agreement that all of the available hydrodynamic simulation models (1-D, 2-D, and 3-D) have utility, and that model selection depends in large part on the specific hypotheses or questions to be addressed through the analysis and the associated level of hydrodynamic resolution needed to support analyses of the hypotheses or questions. However, additional model exploration, validation, and refinement would benefit the assessment of changes in salmonid migration behavior and survival in response to altered channel hydrodynamic conditions, habitat restoration, and alternative water management actions and strategies. 8.1.2 Higher Dimensional Models are Most Useful Where Complex
Environmental Conditions Exist In situations where complex hydrodynamic conditions exist (e.g., river bends and junctions, or tidally influenced areas), or if the changes in the dimensions other than the primary dimension are significant and thus cannot be ignored, a higher dimensional (2-D or 3-D) model is more appropriate. The use of 2-D simulation models may be more appropriate and cost effective than 3-D models for addressing questions regarding alternative water operational strategies, and changes in velocities and flows at specific locations in response to changes in export operations or the installation of temporary barriers. 8.1.3 The Availability of Field Data Measurements and Calibration Data is
an Important Consideration for Selecting the Best Model

Volume 2: Responses to Management Questions Final
49
The increase in detailed information provided with a 3-D model is accompanied by a commensurate increase in field data measurements required for establishing model boundary conditions, and model calibration and validation. The field data are not always available. Well-calibrated 1- or 2-D models may perform better for many applications than poorly calibrated 3-D models.
8.2 MODEL DESCRIPTIONS AND LIMITATIONS
Three types of models are commonly used in the Delta: 1-D models such as DSM2, 2-D models such as RMA2, and 3-D models such as UnTRIM. One-dimensional models average the 3-D (turbulent averaged) equations of motion over the vertical and lateral directions and have minimal computational expense compared to higher dimensional models. One-dimensional models work well in assessments where longer temporal or larger spatial scales are of interest. They also work well in situations where hydrodynamic variations in the primary dimension dominate and the variation in the other dimensions can be aggregated into the primary dimension, which is the case for some South Delta channels. Limitations of 1-D models include the limitations of 2-D and 3-D models identified below, plus the following:
• No characterization of the lateral variability in velocity or salinity • A heavy reliance on dispersion coefficients, which results in decreased accuracy
compared to higher dimensional models in complex environmental conditions Two-dimensional models average the 3-D (turbulent averaged) equations of motion over the vertical dimension, which reduces the computational complexity relative to 3-D models. The use of 2-D simulation models (e.g., RMA2) may be more appropriate and cost effective for addressing questions regarding alternative water operational strategies, and changes in velocities and flows at specific locations in response to changes in export operations or the installation of temporary barriers. Limitations of 2-D models include the limitations of 3-D models identified below, plus the following:
• No characterization of the vertical variation in velocity or salinity • A reliance on dispersion coefficients, which results in decreased accuracy compared
to well calibrated, 3-D models for unusual flow and tidal conditions Three-dimensional models estimate flow characteristics in three dimensions and through the tidal cycle, providing a detailed approximation of hydrodynamics. While a 3-D model provides more detailed hydrodynamic information, the field data needed to set up the model and the output produced by the model can be significant. Limitations of 3-D models include:
• Spatial resolution and computational cost

Volume 2: Responses to Management Questions Final
50
• Turbulence closure issues2 • Site-specific parameters • Numerical errors
Calibration is required for all models, is highly project specific, and depends on the spatial and temporal application of the model. Specific factors identified as adversely affecting hydrodynamic model calibration and validation in the South Delta include inadequate bathymetry, consumptive use, and CCF radial gate intake data. In addition, combining 1-D and higher dimensional models may prove to be an effective approach for addressing specific water management questions and fish migration and survival analyses.
8.3 DISCUSSION OF HOW WELL THE DATA INFORMED THE QUESTION
The characteristics and capabilities of each model are well understood and described in Volume 1, Appendices B and C. The performance of each model is dependent on having sufficient calibration data, and performance can be validated through empirical studies. The hydrodynamic models perform well in terms of informing the physical changes for which they were developed, and at locations where the models validate well. However, the models need to be assessed as to whether they are appropriate for evaluating fish migration behavior and responses to physical conditions at the spatial and temporal scales needed for such evaluations. There are the complex tradeoffs between model performance, hydrodynamic complexity, cost, and availability of supporting field and calibration data that need to be considered when choosing a model or evaluating model output for biological studies, which are project specific. 8.3.1 Applicability of DSM2 Predictions Related to Salmon Migrations There is uncertainty regarding the applicability of the existing 1-D, DSM2 simulation model predictions as they relate to juvenile salmonid migration through the Delta. The uncertainty stems from the results in Delaney et al. (2014), which found that modeled flow at some locations did not accurately capture the timing of measured flow changes. 8.3.2 Calibration with Limited Bathymetric Data Several potential problems (gaps) have been identified in the literature relative to hydrodynamic model calibration in the South Delta, including representation of the CCF 2 Turbulence closure is a problem in turbulence analysis that occurs when Reynolds averaging is applied to Navier–Stokes equations, which results in numerous unknowns in equations. This means that parameters cannot be solved for directly. Various methods have been suggested for dealing with this “turbulence closure” problem.

Volume 2: Responses to Management Questions Final
51
operations (MacWilliams and Gross 2013), South Delta bathymetry data, Delta Island Consumptive Use data (Siegfried et al. 2014), and challenges associated with estimating Delta outflow particularly during periods of low outflow (Monismith, in review).
8.4 AREAS OF TECHNICAL DISAGREEMENT
The SST did not discuss the circumstances under which existing hydrodynamic models are useful for assessing selected channels and channel junctions in the Delta at spatial and temporal scales needed for biological studies. This was due to uncertainties regarding the scales required and the magnitude of change in flow or velocity needed to influence salmonid migration behavior or survival within a channel or at a junction.
9.0 MANAGEMENT QUESTION 8 What information is needed to address concerns that the results of tests using hatchery-reared fall-run Chinook salmon may not be representative of results of other runs of natural-origin salmonids? Could a correction factor be developed to allow for application of such test results? Addressing concerns that hatchery reared fall-run, or late-fall-run Chinook salmon are suitable surrogates for other natural-origin fall-run Chinook salmon or other natural-origin salmonids in survival studies and other evaluations requires a test of the underlying assumption that hatchery-reared, fall-run Chinook salmon are representative of these wild stocks. Surrogacy assumptions may be assessed using concurrent tagging studies (e.g., Monzyk et al. 2009), laboratory studies (e.g., Bellinger et al. 2014), theoretical models, bioenergetics models, and weight-of-evidence approaches. The available data on some populations (e.g., winter- and spring-run Chinook salmon) are more limited than for other populations (e.g., fall-run and late-fall-run Chinook salmon). The majority of experimental survival studies conducted to date have been performed using hatchery produced fall- and late-fall-run Chinook salmon and steelhead. Survival studies using hatchery-produced winter-run Chinook salmon have been initiated only in the last several years. Little information is available on the survival of wild salmonids or on the applicability of hatchery-produced salmonids as a representative surrogate for wild stocks. In addition, little information is currently available on the primary drivers for differences in survival between populations. This includes information on the role of environmental conditions, route selection (e.g., mainstem versus interior Delta routes), migration timing and behavior, and other factors on the survival of different stocks in the Sacramento and San Joaquin rivers and Delta. To date, tagging of wild stocks in the numbers needed to test the underlying assumptions has been logistically difficult (Kjelson and Brandes 1989). Development of a correction factor to adjust results based on differences between test and target fish may be possible in the future,
Volume 2: Responses to Management Questions Final
52
but data are currently insufficient to build a reliable and accurate correction factor for translating the survival of surrogate populations (e.g., hatchery-reared, fall-run Chinook salmon) in the Delta to natural-origin salmonids. Also, it is important to acknowledge the limitations of our ability to validate assumptions for the complete set of surrogacy factors involved. As noted by Murphy et al. (2011):“Over the past 20 years, a growing body of empirical literature has demonstrated the limited effectiveness of surrogates as management tools, unless it is first established that the target species and surrogate will respond similarly to a given set of environmental conditions.”
9.1 CONCLUSIONS
9.1.1 Representative Assumptions Should Be Tested The use of surrogate species requires identifying and explicitly assessing, to the extent possible, the underlying assumptions of whether they adequately represent target species (e.g., size, behavior, and survival) for the management question at hand. It is generally recognized that most surrogate relationships used have not been directly evaluated (Murphy et al. 2011; Murphy and Weiland 2014). Therefore, in studies where a surrogate is used, defining the assumptions and the extent to which they have been tested is an important step for interpreting results—for both scientific and policy audiences (Murphy and Weiland 2014). 9.1.2 Representative Assumptions are Study Specific Determining whether a surrogate source or species represents a target species is highly contextual and is framed specifically by the species, location, and objectives of each study. More specifically, each time a surrogate species is used, it is essential to explain “…the similarities in ecological responses by the surrogate and target to the same environmental phenomena, link demographic responses to habitat extent and condition, and clearly describe the uncertainties that accompany the relationship between the status and trends of the surrogate and those of the target under common circumstances” (Murphy and Weiland 2014). 9.1.3 The Use of Surrogates Reflects the Rarity of Natural-Origin Target
Species Unless and until target populations are abundant or permitted for use in studies, the use of surrogates and questions about their use will continue. Therefore, questions about the use of tagged study fish to make inferences to the untagged natural-origin population or other hatchery populations are likely to persist.
Volume 2: Responses to Management Questions Final
53
9.1.4 The Development of Correction Factors Will Require Additional Study
Establishing a robust relationship between surrogate and target species survival is a necessary precursor to establishing a reliable correction factor. In situations where correction factors have been applied to survival studies (e.g., tag failure correction), detailed scientific studies that describe and evaluate the effectiveness of the approach have been necessary for adopting the correction factor in actual survival studies (Townsend et al. 2006). 9.1.5 The Evaluation of Some Surrogacy Assumptions Is Underway The need for testing surrogacy assumptions is recognized, and efforts are underway to clarify the conditions under which surrogate data are useful. Limited comparisons of migration behavior and survival for various surrogates have begun, and recent studies provide an opportunity to assess whether hatchery salmon from Merced River are representative of hatchery steelhead from Mokelumne River released in the lower San Joaquin River.
9.2 DISCUSSION OF HOW WELL THE DATA INFORMED THE QUESTION
Concerns about the use of surrogates in the Delta have been documented in the scientific literature (e.g., Murphy and Weiland 2014; Murphy et al. 2011). However, there are few examples where the validity of using surrogate species or hatchery fish as representatives of natural-origin target fish have been thoroughly tested, and these come from other regions outside of the Delta. In the Columbia River (i.e., the Federal Columbia River Power System), surrogate species and hatchery-origin fish are often used to evaluate the behavior and survival of target species for compliance with ESA (NMFS 2008; see RPA 52). But even here there are only a handful of studies available in the literature where an analysis of surrogacy assumptions has occurred (e.g., Buchanan et al. 2010). In short, the literature has established the importance of testing the representativeness assumption, but there are few examples of where it has actually been tested. Recognizing that testing the assumption is important does not make it easy to test when natural-origin target species are rare or protected. Therefore, the data exist to frame the management question but the problem of implementing the studies that test surrogacy assumptions remains.
9.3 SUMMARY
For the development of the best available science in ESA applications, the direct use of target species rather than surrogates should be considered as the first (and best) option to answer test questions related to behavior and survival. However, often this is not possible or allowed. In these situations, the use of surrogates should be accompanied by a description of the evidence that supports their use. This issue is addressed comprehensively by Murphy and Weiland (2014). The evidence should be described explicitly in the development of

Volume 2: Responses to Management Questions Final
54
assumptions associated with the specific study design or evaluation. In situations where it is unclear that a surrogate species is representative of a target species or population, the relationship between the two should be further evaluated to determine the efficacy of using surrogates, or the uncertainty characterized in the study proposal and final reports for managers.
9.4 AREAS OF TECHNICAL DISAGREEMENT
There were no areas of formal scientific disagreement among SST members regarding the use of surrogates. The different perspectives on the use of surrogates described here were discussed within the SST. They reflect the lack of a clear demarcation between when surrogates are appropriate to use for management and when they are not, more so than specific technical disagreements within the SST. These differences require policy decisions and the support of an explicit scientific framework and analysis to resolve them (e.g., Murphy and Weiland 2014), and are outlined below. 9.4.1 Acceptability of Surrogate Data In general, there is disagreement among scientists on the circumstances under which surrogate data are acceptable for making management and conservation decisions. In the end, each situation is unique and will have to be addressed through policy decisions. The more common positions on the use of surrogates are as follows:
• Argument 1: Management and conservation decisions must be made using the best available science, which may include surrogate data that have not been fully validated as “representative” of target species.
• Argument 2: Surrogate data should not be used to make important management and conservation decisions unless the surrogacy assumptions have been clearly identified and validated.
• Argument 3: The appropriate application of surrogates should be evaluated on a case-by-case basis (e.g., target species versus surrogate species, hatchery versus natural-origin fish, tagged versus untagged individuals, and unbiased race definitions) based on the specific question being investigated or tested.
9.4.2 Level of Effort and Resources Required for Testing Assumptions The disagreement among scientists on the level of effort and resources that should be applied to testing assumptions that surrogates adequately represent target species is as follows:
• Argument 4: There is no point in applying significant resources to test the “representative assumption” because even if invalid we will not have sufficient data from the population of interest on which to base management actions.
• Argument 5: Because surrogates are potentially the only source of data for interpreting target species, we should dedicate significant resources to getting

Volume 2: Responses to Management Questions Final
55
whatever information we can to test the “representative assumption” for whatever type of surrogacy can be evaluated to characterize the limitations of inferences to the target species.
9.4.3 The Range of Valid Surrogacy Comparisons There is further disagreement among scientists about the usefulness of performing surrogacy comparisons in situations where only some of the pertinent types of surrogacy can be evaluated. For example, use of acoustic-tagged, hatchery-reared fall-run Chinook salmon to infer what might be influencing untagged natural-origin steelhead assumes several types of surrogacy (species, size, rearing type, and tagged versus untagged). Comparisons between tagged hatchery study groups from different hatcheries, as currently available, address only the species and size surrogacies, and introduce possible differences due to hatchery source or river basin of origin. The disagreement among scientists based on comparisons using test fish of different species, size, rearing type, and whether they are tagged versus untagged is as follows:
• Argument 6: Differences in life history and behavior have been documented between species and races of salmonids, and even partial surrogacy evaluations are worthwhile because they reduce the uncertainty about the validity of at least one surrogacy assumption, even if other assumptions remain untested.
• Argument 7: Reduction in uncertainty in the surrogacy assumptions of only one or two surrogacy factors (e.g., species or size) is not a worthwhile use of resources when other surrogacy factors (e.g., tagged versus untagged) remain.
10.0 REFERENCES
Anderson, J. J., E. Gurarie, and R. W. Zabel. 2005. Mean free-path length theory of predator–prey interactions: Application to juvenile salmon migration. Ecological Modelling 186:196-211.
Bates, D. W. and R. Vinsonhaler. 1957. Use of louvers for guiding fish. Transactions of the American Fisheries Society 86:38-57.
Bellinger, K. L., G. H. Thorgaard, and P. A. Carter. 2014. Domestication is associated with reduced burst swimming performance and increased body size in clonal rainbow trout lines. Aquaculture 420:154-159.
Bourret, S. L., B. P. Kennedy, C. C. Caudill, and P. M. Chittaro. 2014. Using otolith chemical and structural analysis to investigate reservoir habitat use by juvenile Chinook salmon Oncorhynchus tshawytscha: reservoir habitat use by juvenile Oncorhynchus tshawytscha. Journal of Fish Biology 85:1507-1525.

Volume 2: Responses to Management Questions Final
56
Buchanan, R. A., J. R. Skalski, and A. E. Giorgi. 2010. Evaluating Surrogacy of Hatchery Releases for the Performance of Wild Yearling Chinook Salmon from the Snake River Basin. North American Journal of Fisheries Management 30:1258-1269.
Cavallo, B., J. Merz, and J. Setka. 2012. Effects of predator and flow manipulation on Chinook salmon (Oncorhynchus tshawytscha) survival in an imperiled estuary. Environmental Biology of Fishes 96:393-403.
Cavallo, B., P. Gaskill, and J. Melgo. 2013. Investigating the influence of tides, inflows, and exports on sub-daily flow in the Sacramento-San Joaquin Delta. Available from: http://www.fishsciences.net/reports/2013/Cavallo_et_al_Delta_Flow_Report.pdf.
Cavallo, B., P. Gaskill, J. Melgo, and S. C. Zeug. 2015. Predicting juvenile Chinook Salmon routing in riverine and tidal channels of a freshwater estuary. Environmental Biology of Fishes 98:1571-1582.
Clark, K., M. Bowen, R. Mayfield, K. Zehfuss, J. Taplin, and C. Hanson. 2009. Quantification of Pre-Screen Loss of Juvenile Steelhead in Clifton Court Forebay. State of California, California Natural Resources Agency, Department of Water Resources. March 2009.
del Rosario, R. B., Y. J. Redler, K. Newman, P. L. Brandes, T. Sommer, and K. Reece. 2013. Migration Patterns of Juvenile Winter-run-sized Chinook Salmon (Oncorhynchus tshawytscha) through the Sacramento–San Joaquin Delta. San Francisco Estuary and Watershed Science 11(1):jmie_sfews_11180.
Delaney, D., P. Bergman, B. Cavallo, and J. Malgo. 2014. Stipulation Study: Steelhead Movement and Survival in the South Delta with Adaptive Management of Old and Middle River Flows. State of California, California Natural Resources Agency, Department of Water Resources. February 2014.
DWR (California Department of Water Resources). 2011a. South Delta Temporary Barriers Project: 2008 South Delta Temporary Barriers Monitoring Report. July 2011.
DWR. 2011b. South Delta Temporary Barriers Project: 2009 South Delta Temporary Barriers Monitoring Report. July 2011.
DWR. 2012. 2011 Georgiana Slough Non-Physical Barrier Performance Evaluation Project Report. Prepared for DWR by AECOMM. September 5, 2012. Available from: http://baydeltaoffice.water.ca.gov/sdb/GS/docs/GSNPB_2011_Final_Report+Append_090512.pdf.

Volume 2: Responses to Management Questions Final
57
Erkkila, L. F., J. W. Moffett, O. B. Cope, B. R. Smith, and R. S. Nielson. 1950. Sacramento-San Joaquin Delta fishery resources, effects of Tracy Pumping Plant and Delta Cross Channel. U.S. Fish Wildl. Serv. Spec. Sci. Rep. Fish. 56. 109 pp.
Gingras, M. 1997. Mark/Recapture Experiments at Clifton Court Forebay to Estimate Pre-screening Loss to Juvenile Fishes: 1976-1993. Technical Report 55, Interagency Ecological Program for the San Francisco Bay/Delta Estuary. September 1997.
Harvey, B. N. and C. Stroble. 2013. Comparison of Genetic Versus Delta Model Length-at-Date Race Assignments for Juvenile Chinook Salmon at State and Federal South Delta Salvage Facilities. Technical Report 88 for Interagency Ecological Program for the San Francisco Bay/Delta Estuary. March 2013.
Holbrook, C. M., R. W. Perry, and N. S. Adams. 2009. Distribution and joint fish-tag survival of juvenile Chinook salmon migrating through the Sacramento-San Joaquin River Delta, 2008. USGS Open File Report 2009-1204.
Hostetter, N. J., A. F. Evans, D. D. Roby, and K. Collis. 2012. Susceptibility of Juvenile Steelhead to Avian Predation: The Influence of Individual Fish Characteristics and River Conditions. Transactions of the American Fisheries Society 141:1586-1599.
Jeffries, K. M., S. G. Hinch, M. K. Gale, T. D. Clark, A. G. Lotto, M. T. Casselman, S. Li, E. L. Rechisky, A. D. Porter, D. W. Welch, and K. M. Miller. 2014. Immune response genes and pathogen presence predict migration survival in wild salmon smolts. Molecular Ecology 23:5803-5815.
Karp, C., L. Hess, and C. Liston. 1995. Re-evaluation of louver efficiencies for juvenile Chinook salmon and striped bass, 1993. Tracy Fish Facility Studies: Volume 3. U.S. Bureau of Reclamation, Mid-Pacific Region, and Denver Technical Services Center.
Karp, C., B. Wu, and A. Schultz. 2014. Evaluation of Chinook salmon and central valley steelhead behavior at the Tracy Fish Collection Facility, Tracy, California. Tracy Fish Collection Facility Studies, California. U.S. Department of the Interior, Bureau of Reclamation, Mid-Pacific Region and the Technical Service Center. Presentation to California-Nevada Chapter of the American Fisheries Society, 48th Annual Conference, Sacramento, California: March 29, 2014.
Kemp, P. S., M. H. Gessel, and J. G. Williams. 2005. Fine-scale behavioral responses of Pacific salmonid smolts as they encounter divergence and acceleration of flow. Transactions of the American Fisheries Society 134: 390–398.
Kimmerer, W. J. and M. L. Nobriga. 2008. Investigating Particle Transport and Fate in the Sacramento-San Joaquin Delta Using a Particle Tracking Model. San Francisco

Volume 2: Responses to Management Questions Final
58
Estuary and Watershed Science.
Kjelson, M. A., and P. L. Brandes, 1989. The Use of Smolt Survival Estimates to Quantify the Effects of Habitat Changes on Salmonid Stocks in the Sacramento-San Joaquin Rivers, California. Pages 100-115 in C. D. Levings, L. B. Holtby, and M. A. Henderson, editors. Proceedings of the National Workshop on Effects of Habitat Alteration on Salmonid Stocks. Canadian Special Publication of Fisheries and Aquatic Sciences 105.
MacWilliams, M. L. and E. S. Gross. 2013. Hydrodynamic Simulation of Circulation and Residence Time in Clifton Court Forebay. San Francisco Estuary and Watershed Science, 11(2). Retrieved from: http://escholarship.org/uc/item/4q82g2bz.
Monismith, S. G. In review. A note on Delta outflow. San Francisco Estuary and Watershed Science.
Monzyk, F. R., B. C. Jonasson, T. L. Hoffnagle, P. J. Keniry, R. W. Carmichael, and P. J. Cleary. 2009. Migration Characteristics of Hatchery and Natural Spring Chinook Salmon Smolts from the Grande Ronde River Basin, Oregon, to Lower Granite Dam on the Snake River. Transactions of the American Fisheries Society 138:1093-1108.
Murphy, D. D. and P. S. Weiland. 2014. The use of surrogates in implementation of the federal Endangered Species Act—proposed fixes to a proposed rule. Journal of Environmental Studies and Sciences 4:156-162.
Murphy, D. D., P. S. Weiland, and K. W. Cummins. 2011. A critical assessment of the use of surrogate species in conservation planning in the Sacramento-San Joaquin Delta, California. Conservation Biology 25:873-878.
NMFS (National Marine Fisheries Service). 2008. Remand of the 2004 biological opinion on the Federal Columbia River Power System (FCRPS) including 19 Bureau of Reclamation projects in the Columbia basin (revised and reissued pursuant to court order, NWF v. NMFS, Civ. No. CV 01–640-RE (D. Oregon). Available from: http://www.westcoast.fisheries.noaa.gov/index.html
NMFS. 2009. Biological Opinion on long-term operations of the Central Valley Project and State Water Project. June 4. NMFS Southwest Region, Long Beach, California. Available from: http://www.westcoast.fisheries.noaa.gov/publications/Central_Valley/Water%20Operations/Operations,%20Criteria%20and%20Plan/nmfs_biological_and_conference_opinion_on_the_long-term_operations_of_the_cvp_and_swp.pdf.
Newman, K. B. 2003. Modelling paired release–recovery data in the presence of survival and capture heterogeneity with application to marked juvenile salmon. Statistical Modelling 3:157-177.

Volume 2: Responses to Management Questions Final
59
Newman, K. B. 2008. An evaluation of four Sacramento-San Joaquin River Delta juvenile salmon survival studies. March 2008.
Newman, K. B. and J. Rice. 2002. Modeling the Survival of Chinook Salmon Smolts Outmigrating Through the Lower Sacramento River System. Journal of the American Statistical Association 97:983-993.
Newman, K. B. and P. L. Brandes. 2010. Hierarchical Modeling of Juvenile Chinook Salmon Survival as a Function of Sacramento–San Joaquin Delta Water Exports. North American Journal of Fisheries Management 30:157-169.
Perry, R. W. 2010. Survival and Migration Dynamics of Juvenile Chinook Salmon (Oncorhynchus tshawytscha) in the Sacramento-San Joaquin River Delta. Ph.D. Dissertation. University of Washington.
Perry, R. W., J. R. Skalski, P. L. Brandes, P. T. Sandstrom, A. P. Klimley, A. Ammann, and R. B. MacFarlane. 2010. Estimating survival and migration route probabilities of juvenile Chinook salmon in the Sacramento–San Joaquin River Delta. N Am J Fish Manag 30(1):142–156.
Perry, R. W., P. Brandes, J. Burau, A. P. Klimley, B. MacFarlane, C. Michel, and J. Skalski. 2013. Sensitivity of survival to migration routes used by juvenile Chinook salmon to negotiate the Sacramento-San Joaquin River Delta. Environmental Biology of Fishes 96:381–392.
Perry, R. W., P. L. Brandes, J. R. Burau, P. T. Sandstrom, and J. R. Skalski. 2015. Effect of Tides, River Flow, and Gate Operations on Entrainment of Juvenile Salmon into the Interior Sacramento–San Joaquin River Delta. Transactions of the American Fisheries Society 144:445-455.
SJRGA (San Joaquin River Group Authority). 2006. 2006 Annual Technical Report. Available from: http://www.sjrg.org/technicalreport/.
SJRGA. 2007. 2007 Annual Technical Report. Available from: http://www.sjrg.org/technicalreport/.
Siegfried, L. J., W. E. Fleenor, and J. R. Lund. 2014. Physically Based Modeling of Delta Island Consumptive Use: Fabian Tract and Staten Island, California. San Francisco Estuary and Watershed Science, 12(4). Retrieved from: http://escholarship.org/uc/item/3t82s21b.
Sutphin, Z. A. and B. Bridges. 2008. Increasing juvenile fish capture efficiency at the Tracy Fish Collection Facility: An analysis of increased bypass ratios during low primary

Volume 2: Responses to Management Questions Final
60
velocities. Technical report. Tracy Fish Facility Studies Volume 35. U.S. Bureau of Reclamation, Department of the Interior, Byron, California.
Townsend, R. L., J. R. Skalski, P. Dillingham, and T. W. Steig. 2006. Correcting bias in survival estimation resulting from tag failure in acoustic and radiotelemetry studies. Journal of Agricultural, Biological, and Environmental Statistics 11:183-196. doi:10.1198/108571106X111323
Zeug, S. C. and B. J. Cavallo. 2013. Influence of estuary conditions on the recovery rate of coded-wire-tagged Chinook salmon (Oncorhynchus tshawytscha) in an ocean fishery. Ecology of Freshwater Fish 22:157-168.
Zeug, S. C. and B. J. Cavallo. 2014. Controls on the entrainment of juvenile Chinook Salmon (Oncorhynchus tshawytscha) into large water diversions and estimates of population-level loss. Plos One 9:e101479.