volume 97 number 1 january 2016 · university of the philippines, diliman, quezon city,...
TRANSCRIPT
Bulletin of the American Meteorological Society
Volume 97 Number 1 January 2016
Deep HistoryHow Haiyan Measures Up
Deep HistoryHow Haiyan Measures Up
How Haiyan Measures Up
DEEP HISTORYHow Haiyan Measures Up
THE WIDE TIGGE LEGACY
GRUAN: UPPER-AIR REFERENCE
BRIDGING A WATCH-WARNING GAP


AFFILIATIONS: Soria, Switzer, and ramoS—Earth Observatory of Singapore, and Asian School of the Environment, Nanyang Technological University, Singapore; Villanoy, Bilgera, CaBrera, Siringan, maria, and Fernandez—Marine Science Institute, University of the Philippines, Diliman, Quezon City, Philippines; Fritz—School of Civil and Environmental Engineering, Georgia Institute of Technology, Atlanta, GeorgiaCORRESPONDING AUTHOR: Adam D. Switzer, Earth Observatory of Singapore, Nanyang Technological University, 50 Nanyang Avenue, Singapore 639798, SingaporeE-mail: [email protected]
Earth Observatory of Singapore Contribution Number 95
The abstract for this article can be found in this issue, following the table of contents.DOI:10.1175/BAMS-D-14-00245.1
A supplement to this article is available online (10.1175/BAMS-D-14-00245.2)
In final form 29 May 2015 ©2016 American Meteorological Society
Typhoon Haiyan’s storm surge was about twice the height of the 1897 event in
San Pedro Bay, but the two storm surges had similar heights on the open Pacific coast.
T yphoon Haiyan affected more than 16 million people, killed 6,293 people, and destroyed more than 1.1 million dwellings in the central
Philippines (NDRRMC 2014). Haiyan is the deadliest
typhoon recorded in the Philippines, superseding Tropical Storm Thelma, which struck Ormoc City on the western coast of Leyte Island, in November 1991 (Alojado and Padua 2010; Bacani 2013; Ribera et al. 2008). Globally, Typhoon Haiyan was the dead-liest cyclonic event since Cyclone Nargis devastated Myanmar in 2008 (Fritz et al. 2009). The damage to infrastructure and agriculture cost about PHP $40 billion or about USD $900 million (NDRRMC 2014), while the total economic loss reached up to USD 13 billion (Caulderwood 2014). The damage and the death toll from Typhoon Haiyan were particularly high along the coasts surrounding San Pedro Bay on the northwestern margin of the Leyte Gulf primarily due to the storm surge generated by the typhoon. The shallow bathymetry of less than 10-m depth and funnel shape make the coasts of San Pedro Bay inherently susceptible to storm surge (Fig. 1, inset). Additional factors that contributed to local amplification of the storm surge in Leyte Gulf were the orientation of the typhoon track and associated seiches (Mori et al. 2014). Eyewitnesses described the Haiyan storm surge as dramatically worse than any coastal flooding events in recent years (Amadore 2013). Longer historical records,
REPEAT STORM SURGE DISASTERS OF TYPHOON HAIYAN AND
ITS 1897 PREDECESSOR IN THE PHILIPPINES
By Janneli lea a. Soria, adam d. Switzer, CeSar l. Villanoy, Hermann m. Fritz, PrinCeSS HoPe t. Bilgera, oliVia C. CaBrera, Fernando P. Siringan,
yVainne yaCat-Sta. maria, rioVie d. ramoS, and ian Quino Fernandez
31JANUARY 2016AMERICAN METEOROLOGICAL SOCIETY |

however, reveal a comparable predecessor to Typhoon Haiyan (Algué 1898). In October 1897, an unnamed typhoon, which for brevity will be henceforth referred to as Ty 1897, took a path across Leyte Gulf that was almost parallel to Typhoon Haiyan’s but offset to the north by ~6 km (Fig. 1). The similar track enables direct comparisons of the two typhoons and the storm surges. Here, we first characterize the destructiveness of Typhoon Haiyan before considering the importance of the 1897 predecessor in understanding storm surge hazard in the region.
TYPHOON HAIYAN. On 2 November 2013, a broad low pressure area formed in the western Pacific, to the east of Micronesia (Joint Typhoon Warning Center 2014). By 0600 UTC 3 November, it had developed into a tropical depression. At 0000 UTC 4 November, the system had attained tropical storm strength and was named Haiyan. It rapidly strengthened into a typhoon and moved west toward the Philippines (Fig. 1), and it was given the local name of Yolanda (NDRRMC 2013a). By 6 November, Haiyan’s 1-min maximum sustained winds had intensified to an estimated 241 km h–1, classified by the Joint Typhoon Warning Center (JTWC) as a super typhoon. To avoid ambiguity in the definition of “super typhoon,” we will conform to the traditional classification of tropical cyclones (World Meteorological Organization 2015) in the Pacific region with “typhoon.”
On it s f i na l nor t h-west wa rd approach to the Philippines, Haiyan steadily intensified until it reached the peak inten-sity of ~895 hPa minimum central pressure. This peak intensity was estimated by the JTWC and the Japan Meteorologica l Agency (JMA) from cloud patterns recognized on visible and infrared satellite images, in the absence of ground and in situ instruments. In Guiuan municipality on Samar Island, Doppler radar data of the Philippine Atmospheric, Geophysi-ca l a nd Ast ronom ica l Services Administration (PAGASA) indicated that just before landfa l l , at
2000 UTC 7 November [0400 Philippine Time (PHT) 8 November], Haiyan attained a minimum central pressure of 910 hPa and winds at 160 km h–1 with gusts of ~195 km h–1 (Paciente 2014). Extreme winds destroyed the Guiuan Doppler radar station about 16 min later. At 2040 UTC 7 November (0440 PHT 8 November), Haiyan crossed the small islands off the southeast tip of Samar Island, near Guiuan. Haiyan then continued westward across the Leyte Gulf to its main landfall south of Tolosa, Leyte Island, at 2300 UTC 7 November (0700 PHT 8 November), as captured by another PAGASA Doppler radar station in Cebu. Typhoon Haiyan then made four subse-quent landfalls as it crossed the central Philippines (NDRRMC 2013b).
MATERIAL AND METHODS. We evaluated eyewitness accounts, video recordings, field measure-ments, and storm surge model hydrographs to docu-ment the flow depths, surge heights, timing, and peak flood duration during Typhoon Haiyan as well as the resulting damage. Other post-Haiyan field survey reports focused on the inundation characteristics and the impact on coastal structures (Mas et al. 2015; Tajima et al. 2014). Here, we place Typhoon Haiyan’s storm surge into historical context by comparing it with the similar Ty 1897 event (Algué 1898).
Field survey. The initial field survey of the coastal areas surrounding San Pedro Bay was conducted from 23
Fig. 1. Storm tracks of three deadly typhoons crossing the central Philippines: Ty 1897, Nov 1991 Tropical Storm Thelma, and Nov 2013 Super Typhoon Haiyan. Typhoon track sources: (a) Algué (1898) and (b) International Best Track Archive for Climate Stewardship (IBTrACS) database of Knapp et al. (2010). The inset shows the comparative tracks of Ty 1897 (black dashed line) and Haiyan (colored solid lines) across Leyte Gulf.
32 JANUARY 2016|

to 28 November 2013, as soon as relief operations and the security situation permitted access to the hard-est hit areas. We recorded 73 eyewitness accounts (Table ES1; more information can be found online at http://dx.doi.org/10.1175/BAMS-D-14-00245.2) on the maximum flow depth, the timing of the initial rise, and peak and subsidence of the flood, along with wind and wave observations. Collected data were used to validate the timing and heights simulated by our storm surge models. Sub-sequent surveys from 16 to 25 January, 12 to 19 May, and 2 to 10 June 2014 en-compassed larger and more remote areas, including coasta l set t lements in southern Samar facing the Leyte Gulf and the Philippine Sea of the west-ern Pacific (Fig. 2; Table 1). To record distances and build cross-shore elevation prof i les from the water surface at the shoreline to the inundation limit, water marks were located and measured with a Trimble global positioning system (GPS) rover connected via Bluetooth to a Lasercraft XLRic laser range finder (Fritz et al. 2012). At each site, high water marks such as mud l ines on bui ld-ings, scars on the bark of trees, and rafted debris were evaluated using estab-lished protocols (Fritz et al. 2007; UNESCO 2014). In inhabited areas, the water marks were discussed with eyewitnesses to constrain still water levels, estimate the contribution of storm waves, and remove bias from localized splashup atop the surge. The high water measurements, based on different indicators at corresponding locations, tended to be consistent and have an individual
confidence of ±0.1 m. During post-survey processing, the measurements were differentially corrected with our daily setup of the local Ashtech base station and corrected for tide level at the time of peak storm surge on the basis of tide predictions provided by XTide 2, an open-source software of Flater (1998). How the Ty 1897 storm surge heights were measured remains unknown, but it is highly likely that surge heights
Fig. 2. Maximum storm surge heights, surge with waves, and runup points of Typhoon Haiyan measured in the field across the coastal communi-ties in eastern Leyte (a), and Samar (b) and (c). Surge heights of Ty 1897 from Algue (1898) are also included for comparison. The terrain map is a modified NASA land elevation radar image; dark shaded areas are ≤ 10 m, above sea level.
33JANUARY 2016AMERICAN METEOROLOGICAL SOCIETY |

Ta
bl
e 1
. Mea
sure
d m
axim
um
sto
rm s
urg
e h
eigh
ts a
nd
run
-up
po
ints
of S
up
er T
yph
oo
n H
aiya
n in
eas
tern
Ley
te a
nd
the
sou
ther
n S
amar
Isl
and
s. T
he
cod
e fo
r m
easu
rem
ents
is a
s fo
llow
s: z
is t
erra
in e
leva
tio
n, h
is t
he
flo
w d
epth
ab
ove
ter
rain
, z +
h is
th
e el
evat
ion
of t
he
wat
erm
ark
rela
tive
to
no
rmal
p
red
icte
d ti
de
leve
l at
tim
e o
f pea
k fl
oo
din
g, a
nd R
is r
un
-up
or
elev
atio
n at
th
e lim
it o
f in
un
dat
ion
. Th
e co
de
for
wat
erm
arks
is a
s fo
llow
s: T
L is
th
e tr
imlin
e, W
S is
wav
e sp
lash
, FL
is t
he
flo
od
line,
EW
is e
yew
itn
ess,
RD
is r
afte
d d
ebri
s, S
H is
sh
ip, M
I is
mu
d lin
e in
sid
e, M
O is
mu
d lin
e o
uts
ide,
an
d W
L
is w
rack
lin
e.
Po
int
Lo
cati
on
Lat
itu
de
(°N
)L
ong
itu
de
(°E
)z
(m)
h (m
)z
+ h
(m)
R (
m)
Dat
e an
d ti
me
surv
eyed
(P
HT
)W
ater
mar
k
1
Dul
ag (
San
Jose
)
10.9
869
125
.039
3
2.22
4.
60
6.82
20 Ja
n 20
1412
23T
L, W
S
2
Dul
ag (
San
Jose
)
10.9
868
125
.039
3
2.82
1.
00
3.82
20 Ja
n 20
1412
32FL
, EW
3
Tana
uan
(Cab
uyna
n)
11.0
969
125
.020
7
1.64
3.
70
5.34
20 Ja
n 20
1415
14T
L, E
W
4
Tana
uan
(Mag
ay)
11
.117
2 1
25.0
205
2.
52
2.90
5.
4220
Jan
2014
1621
EW
5
Tana
uan
(Mag
ay)
11
.116
5 1
25.0
199
2.
22
3.00
5.
2220
Jan
2014
1630
EW
6
Tana
uan
(Mag
ay)
11
.117
3 1
25.0
182
2.
62
2.70
5.
3220
Jan
2014
1641
RD
7
Her
nani
(to
wn
prop
er)
11
.323
6 1
25.6
177
3.
88
2.70
6.
5821
Jan
2014
1332
FL, E
W
8
Tacl
oban
(A
nibo
ng)
11
.254
2 1
24.9
906
3.
05
3.80
6.
8522
Jan
2014
1101
SH
9
Tacl
oban
(A
nibo
ng)
11
.254
3 1
24.9
905
5.
84
1.20
7.
0422
Jan
2014
1052
TL,
EW
10
Tacl
oban
(A
nibo
ng)
11
.257
5 1
24.9
891
3.
09
2.80
5.
8922
Jan
2014
1123
TL,
EW
11
Tacl
oban
11
.252
3 1
24.9
909
4.
09
1.00
5.
0922
Jan
2014
1138
MO
, EW
12
Tacl
oban
11
.249
4 1
24.9
934
4.
10
2.90
7.
0022
Jan
2014
1235
MI,
EW
13
Tacl
oban
11
.246
5 1
24.9
952
2.
07
2.50
4.
5722
Jan
2014
1251
MI,
EW
14
Tacl
oban
11
.247
0 1
24.9
961
2.
94
3.70
6.
6422
Jan
2014
1307
EW
15
Tacl
oban
11
.244
3 1
24.9
991
2.
391.
60
3.99
22 Ja
n 20
1414
27M
I
16
Tacl
oban
11
.243
7 1
25.0
001
1.
921.
90
3.82
22 Ja
n 20
1414
38M
I, EW
17
Tacl
oban
11
.242
3 1
25.0
018
2.
491.
60
4.09
22 Ja
n 20
1414
48M
I, EW
18
Tacl
oban
11
.241
1 1
25.0
032
2.
691.
55
4.24
22 Ja
n 20
1414
55M
I, EW
19
Tacl
oban
11
.239
4 1
25.0
053
2.
192.
90
5.09
22 Ja
n 20
1415
11M
I, EW
20
Tacl
oban
11
.242
1 1
25.0
085
7.
480.
40
7.88
22 Ja
n 20
1415
42M
O, W
S
21
Tacl
oban
11
.242
1 1
25.0
086
7.
017.
0122
Jan
2014
1552
WL,
EW
22
Tacl
oban
11
.246
4 1
25.0
095
4.
222.
10
6.32
22 Ja
n 20
1416
10T
L
23
Tacl
oban
11
.246
4 1
25.0
095
4.
221.
30
5.52
22 Ja
n 20
1416
11M
I, EW
24
Tacl
oban
11
.248
8 1
25.0
004
3.
064.
60
7.66
22 Ja
n 20
1416
52T
L, E
W
25
Bas
ey (
San
Ant
onio
)
11.2
731
125
.003
0
5.26
5.26
23 Ja
n 20
1409
44W
L
26
Bas
ey (
San
Ant
onio
)
11.2
734
125
.002
3
6.17
6.17
23 Ja
n 20
1409
56W
L
27
Bas
ey (
San
Ant
onio
)
11.2
739
125
.002
1
5.99
5.99
23 Ja
n 20
1409
47W
L
34 JANUARY 2016|

were simply referenced to the mean sea level at the time of survey. The difference between the mean sea level and the sea level at the time of peak flood during Ty 1897 implies that the accuracy of surge height measure-ments is in the range of ±0.3 m. Algué (1898) lacks description on the surge height indicators, but additional uncertainties can be potentially contributed by storm waves.
Storm surge modeling of Typhoon Haiyan. The Typhoon Haiyan storm surge in Leyte Gulf and San Pedro Bay was simulated using the open-source Delft3D Flow (Lesser et al. 2004) with a MATLAB-based graphical user inter-face called Dashboard.1 A curvilinear grid is used with a minimum resolution of 200 m and a maximum resolution of 1.2 km. The domain encompasses the whole Leyte Gulf and extends into the San Juanico Strait to the north (Fig. 3a). The bathymetry of the model domain was acquired from digitized naviga-tional charts (National Mapping and Resource Information Authority 1980). The maximum depths are found near the Leyte Gulf mouth, and the embayment shallows northward toward the San Juanico Strait (Fig. 3b). Open boundary conditions are astronomic tides using eight dominant constituents (M2, S2, N2, K2, K1, O1, P1, and Q1) extracted and inter-polated from the Ocean Topography Experi-ment (TOPEX7.2) global tidal model (Egbert and Erofeeva 2002) using the Dashboard tide database toolbox. The tidal pattern in San Juanico Strait interacting with the Samar Sea differs from the tidal pattern at Guiuan station driven by the Philippine Sea (Fig. 3c). The complex tidal interaction highlights the need for accurate bathymetry of Leyte Gulf and San Juanico Strait to properly simulate the tides in Tacloban.
Typhoon wind fields for the modeling were generated from the typhoon track data of the JTWC. We recognize an approximately 6-km offset between the JTWC typhoon track from the Doppler radar–derived track from PAGASA (Fig. 1, inset), but JTWC provides more continuous along-track wind data, required in the model. The model wind
28
Bas
ey (
San
Ant
onio
)
11.2
750
125
.001
5
6.32
6.32
23 Ja
n 20
1409
59W
L
29
Bas
ey (
San
Ant
onio
)
11.2
745
125
.007
7
2.76
3.70
6.
4623
Jan
2014
1033
TL,
EW
30
Bas
ey (
San
Ant
onio
)
11.2
775
125
.014
7
3.31
2.90
6.
2123
Jan
2014
1124
MO
, WS
31
Mar
abut
11
.107
8 1
25.2
120
1.
581.
20
2.78
23 Ja
n 20
1413
24EW
32
Her
nani
(to
wn
prop
er)
11
.323
6 1
25.6
177
3.
882.
70
6.58
21 Ja
n 20
1413
32EW
33
Her
nani
(B
atan
g)
11.2
943
125
.594
8
6.22
1.
30
7.52
23 Ja
n 20
1415
08M
O, E
W
34
Gen
eral
Mac
Art
hur
11
.246
3 1
25.5
404
1.
49
0.45
1.
9423
Jan
2014
1548
MO
, EW
35
Qui
napo
ndan
/San
to N
iño
11
.125
2 1
25.5
175
1.
64
2.40
4.
0423
Jan
2014
1653
MO
, EW
36
Gip
orlo
s
11.1
199
125
.450
7
1.62
2.
40
4.02
23 Ja
n 20
1417
22M
O, E
W
37
Bal
angi
ga
11.1
068
125
.386
0
1.31
1.
50
2.81
23 Ja
n 20
1417
39M
O, E
W
38
Law
aan
11
.138
7 1
25.3
000
1.
20
1.90
3.
1023
Jan
2014
1807
MO
, EW
39
Palo
(Sa
n Fe
rnan
do)
11
.166
1 1
25.0
085
1.
98
3.70
5.
6824
Jan
2014
1641
TL,
EW
40
Palo
(Sa
n Fe
rnan
do)
11
.165
6 1
25.0
070
2.
61
3.00
5.
6124
Jan
2014
1653
TL,
EW
41
Tacl
oban
(sou
th o
f air
port
)
11.2
005
125
.024
9
3.47
2.
90
6.37
24 Ja
n 20
1417
16T
L, E
W
42
Tacl
oban
(ba
y so
uth
of a
irpo
rt)
11
.211
5 1
25.0
251
2.
10
3.70
5.
8024
Jan
2014
1735
TL,
EW
43
Tana
uan
(San
ta C
ruz)
11
.124
7 1
25.0
220
1.
73
4.10
5.
8324
Jan
2014
1321
MO
, EW
44
Tana
uan
(San
ta C
ruz)
11
.123
7 1
25.0
215
1.
73
3.40
5.
1324
Jan
2014
1326
MO
, EW
45
Llor
ente
11
.412
4 1
25.5
485
7.
29
7.29
10 Ju
n 20
1414
09EW
1 ht tp: //pub l icw ik i .de l t ares .n l /d i sp l ay/OET /DelftDashboard
35JANUARY 2016AMERICAN METEOROLOGICAL SOCIETY |

along-track minimum central pressures and maxi-mum winds. This requirement limited us to use only the data recorded in areas directly hit by the eye of Ty 1897: the in situ barometric pressures measured at Guiuan and Tanauan. Apart from these two locations, no instrumental record on the typhoon eye exists. The minimum pressures before landfall in Guiuan and af-ter landfall in Tanauan were estimated considering the values for Ty 1897 and Typhoon Haiyan. Barometric records in Guiuan and Tanauan indicate a less intense Ty 1897 at landfall than Typhoon Haiyan. To account for the weaker intensity of Ty 1897, we took the pressure difference between Typhoon Haiyan and Ty 1897 in Guiuan and in Tanauan, and the delta values were then subtracted from the Typhoon Haiyan pressure values.
Given the barometric records of Ty 1897 in Guiuan and Tanauan, a range of wind speed values were derived from empirical wind–pressure relationships using the storm-mapping table summarized by Nakazawa and Hoshino (2009) for the western North Pacific region (Table 2). Due to the limited instrumental data on Ty
1897 we opted to use in our model the wind speed values derived from Atkinson and Holliday (1977), which is the most direct method among the wind-pressure relation-ship equations. Knaff and Zehr (2007) emphasized the uncertainties inherent in the regression method of Atkinson and Holliday (1977) in estimating wind speeds of tropical cyclones over the northwest Pacific. Despite t he rel iabi l it y concerns, the maximum wind speed estimates for Ty 1897 using Atkinson and Holliday (1977) still yielded values similar or within the range of the mean standard error [6–9 kt (1 kt = 0.5144 m s–1)] of other established robust wind–pressure relationships.
T Y P H O O N 1 8 9 7 VERSUS TYPHOON HAIYAN. Typhoon track and forward speed. The reconstructed track of Ty 1897 (Figs. 1, 2) was
files were generated by the Delft Dashboard tropical cyclone toolbox using the model by Holland (1980) and interpolated onto the computational grid. The model was initialized by wind and tide conditions at 0000 UTC 5 November 2013 and allowed to run until 2400 UTC 11 November 2013. Sea level and cur-rent outputs were saved at 1-min intervals between 1900 UTC 7 November and 0600 UTC 8 November. An earlier model of Bricker et al. (2014) used the same Delft3D software with JMA wind data forcing and a Quiring’s relationship of maximum wind radius. Their model yielded a maximum water level of less than 6 m in Tacloban.
Storm surge modeling of Ty 1897. To model the likely storm surge generated by Ty 1897, we used the same grid and boundary forcing conditions of Typhoon Haiyan, but with tides simulated from 10 to 12 October 1897. Algué (1898) reported pressures and winds recorded in various parts of the Philippines during Ty 1897, but the Dashboard typhoon module requires
Fig. 3. Geographical coverage, bathymetry, and tidal conditions of Leyte Gulf used in the model. (a) The model domain is a curvilinear grid with 200-m to 1.2-km resolution. (b) Leyte Gulf bathymetry generated from digitized navigational charts with 100-m to 1-km resolution. (c) Predicted water levels from San Juanico Strait, Tacloban City, and Guiuan, Samar.
36 JANUARY 2016|

adopted from Algué (1898) based on the synthesis report containing maps and compilation of baromet-ric curves. Instrumental records for the historical Ty 1897 came from modified aneroid barometers estab-lished by Jesuit priests on land (at churches) and at sea (on ships) in different locations of the Philippine Archipelago. The observed pressure, wind direction, and temperature were used to establish the distance and direction of the vortex (eye) of the typhoon from the observer (Algué 1904; Udías 1996). Algué’s map was georeferenced to a regional map derived from a 90 m × 90 m resolution satellite radar image, and then the typhoon track was digitized. Given the different resolutions between Algué’s map and the regional map, we expect that the digitized track has uncertainties of ~1 km in the north–south direction and ~2 km in the east–west direction.
Upon evaluating the pressure and wind observa-tions, Algué (1898) estimated the landfall timing and the forward speed of Ty 1897 between Guiuan and Tanauan. Ty 1897 made its initial landfall ~10 km south of Guiuan shortly after 0800 PHT 12 October 1897 (0000 UTC 12 October). At landfall, the barometer in Guiuan registered the lowest pressure at 710 mm (947 hPa), simultaneous with the observed relatively calm winds. The relatively calm wind con-dition indicates an eye passage in close proximity but not directly over the recording site. As such, the Guiuan dataset should be considered only as a near-minimum value. The typhoon continued westward almost following along the northern coastline of Leyte Gulf. At about 1100 PHT 12 October 1897 (0300 UTC 12 October) the eye of the typhoon was about 21 km
north-northeast (NNE) of Dulag, and 13 km south-southeast (SSE) of Tacloban, before it made a second landfall in Tanuan shortly after 1100 PHT. At land-fall, the barometer in Tanauan registered the lowest pressure of 704 mm equivalent to 938 hPa, but after further analysis was lowered to 694 mm equivalent to 925 hPa (Algué 1898, 1904). Simultaneous with the lowest pressure was an absolute calm wind lasting for about 40 min. To the north, the adjacent town of Palo also experienced the zone of absolute calm but only for 10 min. The longer duration of absolute calm in Tanauan compared to Palo suggests that Tanauan was located closer to the center of the typhoon’s eye. In a span of 2.5 h, Ty 1897 traversed about 43 geographi-cal miles (~80 km) between Guiuan and Tanuan, equivalent to a forward speed of about 17 mi h–1 or 28 km h–1 (Algué 1898, p. 66). According to Algué’s map, Ty 1897 made subsequent landfalls on three islands across the central Philippines before it exited into the South China Sea.
The Jesuits ground-based method of instrumental recording and monitoring of typhoons to establish the track and intensity prevailed for many decades (Udías 1996) until it was replaced by reconnaissance aircraft, radar, and satellite observations toward the midtwentieth century (Emanuel 2005b; Velden et al. 2006). Today, weather services combine instrumental recordings with satellite-based observations of the cloud patterns in visible and infrared satellite images to establish a central location of a typhoon and to estimate typhoon intensities. At the forefront of this satellite-based method of tropical cyclone intensity was Dvorak (1975). The Dvorak method originally
Table 2. Minimum barometric pressure of Ty 1897 recorded in Guiuan and Tanuan and the corresponding CI number and maximum wind speeds.
Parameters/location Guiuan Tanauan (initial) Tanauan (corrected)
Time and date0815 PHT
12 Oct 18971110 PHT
12 Oct 1897 1110 PHT
12 Oct 1897
Minimum central pressure (mm) 710 704 694
Minimum central pressure (hPa) 947 938 925
Observed wind condition Relative calma Absolute calm Absolute calm
1-min maximum sustained winds [kt (km h–1)] (Atkinson and Holliday 1977)
96 (179) 105 (194) 115 (212)
CI (Dvorak 1975) 6 6.5 7
CI (Dvorak 1984) 5.5 6 6
1-min maximum sustained winds [kt (km h–1)] (Dvorak 1984) 102 (189) 115 (213) 115 (213)
CI (Koba et al. 1990) 5.5 6 6.5
10-min maximum sustained winds [kt (km h–1)] (Koba 1990) 85 (157) 93 (172) 100 (185)a The relatively calm wind condition recorded in Guiuan indicates that the eye passed close but not directly over the recording site. As
such the Guiuan dataset should be considered a near-minimum value.
37JANUARY 2016AMERICAN METEOROLOGICAL SOCIETY |

developed for Atlantic conditions has been adopted and applied to other ocean basins that have different atmospheric conditions like the Pacific (e.g., Velden et al. 2006; Knaff and Zehr 2007; Lander et al. 2014). Unfortunately, there is no unified operational method among weather agencies for tracking and assigning typhoon intensities, and as such, the reported track and intensity of one storm are commonly variable. This was the case with Typhoon Haiyan, where the tracks across Leyte Gulf released by JMA and JTWC are consistently offset ~6 km to the south of the PAGASA Doppler radar-based track. The PAGASA track, however, appears more consistent with the local field observation and ground truthing (Morgerman 2014). We note that based on the PAGASA typhoon track, Typhoon Haiyan moved from Guiuan west-ward to Tolosa at about 43 km h–1 or about 1.5 times faster than Ty 1897.
Typhoon intensity and size. The wide range of instrumental recording through history and the variety of operational wind–pressure relationships among meteorological agencies make typhoon intensity classification based on the maximum wind speed inherently uncertain (Knaff and Zehr 2007; Nakazawa and Hoshino 2009). To address the issues arising from the wind speed–derived typhoon inten-sity, Knapp and Kruk (2010) and Kruk et al. (2011) proposed the use of current intensity (CI) in com-paring typhoons, particularly in establishing trends of tropical typhoon intensities. Kruk et al. (2011) recognized that because of the imagery interpreta-tion of contemporary typhoons, the satellite-derived intensity T number when converted to CI could result in intensity differences of 0.5 on the CI scale. Meanwhile, the primary sources of uncertainty for the pressure-derived intensity of historical typhoons such as Ty 1897 arise from the sparse recordings and possible instrumental errors. The historic correction of ~13 hPa applied to the minimum pressure of Ty 1897 on the Tanauan barometer record may give some indication of the magnitude of instrumental errors. For intense typhoons like Ty 1897, the historic correc-tion corresponds to a difference of 0.5 on the CI scale, which is of similar magnitude as the uncertainty of satellite-derived CI. Hence, the corresponding CI numbers for Ty 1897 and Typhoon Haiyan may provide a reasonable metric to compare the intensity between these two typhoons.
As discussed previously, the observed lowest pressure and absolute ca lm wind of Ty 1897 consistently indicate that the typhoon eye passed directly over Tanauan. Taking the minimum pressure
of 925 hPa as the closest approximation of the central minimum pressure, Ty 1897 was assigned an equiva-lent CI number of 6–7 upon landfall. For Typhoon Haiyan, ground instruments only recorded near-minimum pressures. The Doppler radar in Guiuan registered a mean sea level pressure of ~940 hPa before it was totally destroyed at the peak intensity of the typhoon (IRIDeS 2014). Independent measure-ments of PAGASA and Morgerman (2014) indicate lowest pressure at 960 hPa in Tacloban City, which was located on the northern eyewall of the typhoon, 24 km away from Typhoon Haiyan’s center. In con-trast, using the satellite-based Dvorak technique Typhoon Haiyan has a signature typhoon number of T8.0 (Lander et al. 2014), which corresponds to a CI number of 8, the highest on the scale. As such, the CI 8 Typhoon Haiyan was more intense than the CI 6 to 7 of Ty 1897.
Not only was Typhoon Haiyan more intense, it was also larger than Ty 1897 based on the eyewall size. Morgerman (2014) corroborated the eye of Typhoon Haiyan based on wind observations of eyewitnesses and a radar image, indicating a 13-km radius of the eyewall. In contrast, the Jesuit approach based on the zones of absolute and relative calm winds as indica-tors of the relative location of the typhoon eye results in an eyewall radius of 6–10 km for Ty 1897.
Given the contrasting operational methods between 1897 and 2013, it remains difficult to directly compare Typhoon Haiyan and Ty 1897 with absolute certainty. The available meteorological parameters, however, suggest that Typhoon Haiyan and Ty 1897 were nearly identical based on the trajectory, while characteristic differences prevailed concerning other aspects. Typhoon Haiyan followed a parallel track direction with a ~6-km offset to the south of Ty 1897. Typhoon Haiyan was more intense, had wider eyewall coverage, and was moving faster than Ty 1897. The possible effects of the slight variations in track, mini-mum central pressure, estimated maximum winds, and forward movement between the two typhoons on the storm surge characteristics will be explored in the following sections.
TYPHOON 1897 AND TYPHOON HAIYAN STORM SURGES. Posttyphoon field measurements. The Ty 1897 storm surge measurements of Algué (1898) were based on eyewitness accounts (Fig. 2). These field measurements indicate inundation heights exceeding 4 m in most places with a maximum height of over 7 m on the open sea coast at Hernani (Fig. 2c). Along San Pedro Bay in Basey (Fig. 2b), the water gradually rose and reached a maximum level
38 JANUARY 2016|

of 4.9 m. The peak flooding corresponded with the most violent winds from the southeast. In the nearby coast of Tacloban (Fig. 2a), water rose between 3.9 and 4.6 m. The peak flooding coincided with the winds blowing from the east to east-southeast, directly per-pendicular to the Tacloban coast. In close proximity to the eye of Ty 1897 at Tanauan and Tolosa (Fig. 2a), the water rose to 3 m.
Algué’s “Ola del Huracán” or hurricane wave was the elevation of the sea, with the surface forming like a warp pyramid whose peak approximately cor-responds to the vortex (eye) of the typhoon, analo-gous to the water surface being sucked by a vacuum pump (Algué 1898, p. 9). Moving with the typhoon, this huge wave, when launched against the shore, makes the water rise to an extraordinary height, causing severe f looding and extensive destruction (Algué 1898, p. 10). We interpret this description as equivalent to what we now call “storm surge.” Algué overestimated the contribution of the pressure drop over the wind field as the primary contributor to the significant rise of the sea surface because of the dif-ferent locations of the eye and the areas where water elevations were highest. The sea rose to about 3 m in Guiuan and Tanauan, but the rise was highest at Hernani, Basey, and Tacloban on the typhoon’s strong side to the north of the typhoon eye. The peak flooding during Ty 1897 at each of these sites consistently coincided with winds blowing directly perpendicular toward the coastline. Contrary to Algué’s attribution of the surge solely to the low central pressure, the wind field was the primary driver of the storm surge (Emanuel 2005a).
The measured high water marks after Typhoon Haiyan (Fig. 2) were separately classified into maxi-mum surge heights and surge plus storm waves. For a wider and denser spatial coverage, we combined our field measurements with the survey of Tajima et al. (2014). In both surveys, each high water mark indicator was referenced to the reconstructed tide level at the time of peak flooding. Heights differed by as much as 1 m at slightly different locations. Discrepancies of up to 2 m at corresponding locations were attributed to short-period storm waves super-imposed on top of the surge. High water marks with significant storm-wave contributions were carefully identified based on eyewitness accounts, the type of physical watermark, and the inland location. Surge height measurements from different high water mark indicators in both surveys were mostly consistent.
At Tacloban, located some 23 km to the north of Haiyan’s track (Fig. 2a), the characteristic height of the storm surge peak was 7 m. Wave contributions raised high water marks up to almost 8 m in Tacloban and Palo. On the more open and exposed Pacific coastline at Hernani (Fig. 2c), some 45 km north of the typhoon track, significant storm-wave contribu-tions resulted in high water marks exceeding 7 m. Further amplification by the wave run-up on steep slopes such as near Guiuan resulted in a maximum run-up height of 14 m (Tajima et al. 2014). Surge heights exceeding 5 m were recorded along the shores of San Pedro Bay. We detail the nature of the storm surge in San Pedro Bay, where the highest death toll was recorded, in the next section. Outside of San Pedro Bay, but still within Leyte Gulf, the surge heights were only 3–4 m between Marabut and Quinapondan (Fig. 2b) because the storm track was parallel to the coastline. Water marks as high as 5 m were attributed to storm-wave contributions. In close proximity to Haiyan’s landfall location between Tolosa and Dulag, the surge heights ranged between 3 and 5 m (Fig. 2a). At an exceptional site in Dulag, a 7-m-high water mark was compromised by significant storm-wave contribution. The lowest surge height of about 2 m was recorded at General MacArthur on the eastern coast of Samar (Fig. 2c). The site is sheltered behind fringing coral reefs located 3 km offshore and is on a bay with a narrow bottleneck entrance attenu-ating storm waves and resulting in a measurement dominated by the storm surge component.
Storm surge simulations of Typhoon Haiyan and Ty 1897 in San Pedro Bay. The Haiyan storm surge modeling results resolved an initial sea level drawdown around 2130 UTC 7 November 2013 (0530 PHT 8 November) in accordance with eyewitness accounts and the Tacloban tide gauge recording (Fig. 4). The tide gauge recorded a drawdown of at least 0.8 m before it broke down,2 while modeling suggests a drawdown of at least 1.2 m at the head of San Pedro Bay (Figs. 4a,b). The initial sea level drawdown was also observed at Basey on Samar (Amadore 2013). The drawdown was generated by persistent, strong, northerly offshore winds that initially drove the waters southward out of San Pedro Bay (Figs. 4a,b). Similar sea level drawdowns or negative surges from strong offshore winds during historic hurricanes have also been reported for the western Florida coasts (Harris 1963; Lawrence and Cobb 2005). The drawdown exposed
2 The Tacloban tide data were provided by the National Mapping and Resources Information Agency (NAMRIA) of the Republic of the Philippines.
39JANUARY 2016AMERICAN METEOROLOGICAL SOCIETY |

Fig. 4. Sea level heights in Tacloban and nearby coasts around San Pedro Bay during Typhoon Haiyan. (top) Graphical representation of the water levels from storm surge model (blue line) and from Tacloban Port tide gauge (red line). Both the actual and modeled tides show receding sea level prior to the peak surge. (a)–(i) Storm surge model sequence of Typhoon Haiyan in San Pedro Bay from 2130 UTC 7 Nov to 0130 UTC 8 Nov 2013 with colors and arrows representing water level and wind magnitude and direction, respectively.
40 JANUARY 2016|

the seafloor and dramati-cally steepened the storm tide profile. This phenom-enon is analogous to the negative leading N-wave during tsunamis, usually resulting in a higher run-up (Tadepalli and Synolakis 1994). Eyewitness accounts and modeling show that the storm tide arrived as an unusually fast-moving “tsunami like” wave front, which caused high velocity coastal flooding to heights of more than 7 m near Tacloban and Basey. Resi-dents in Basey, who stayed in their homes despite prior evacuation warnings, de-scribed a large wave similar to a tsunami striking soon after the water receded, providing only a few min-utes of lead time to seek refuge at higher elevations.
The initial rise, peak, and lowering of flood levels due to the storm surge varied considerably in time and location. In downtown Tacloban, the peak surge occurred around 0000 UTC 8 November (0800 PHT 8 November), according to videos recorded by sev-eral eyewitnesses and the detailed coverage by storm chaser Morgerman (2014). The inundation timing was further confirmed by two wall clocks located about 14 km apart along the western shores of San Pedro Bay, which were stopped as seawater f loods reached about 1.5–2 m high. In Tanauan, the clock stopped at 0720 PHT (2320 UTC 7 November); the clock in Tacloban City stopped a few minutes later at 0730 PHT (2330 UTC 7 November). The timing from the videos and wall clocks is consistent with the storm surge model. The modeled timing of the peak surge coincided with the timing of the onshore-directed winds closely linked to the forward motion of Typhoon Haiyan (Figs. 4c–g). The mod-eled peak surge of 6–8 m in San Pedro Bay occurred between 0000 and 0030 UTC (0800 and 0830 PHT) 8 November, arrived earlier along the eastern shores at the entrance of the bay, and propagated northward to the bay head. It is likely that several eyewitnesses in Dulag observed the front of the storm surge. During the passage of the eye (calm winds), eyewitnesses
saw an offshore “wall of water” about 6 m high that first was moving west toward Dulag but then suddenly redirected north toward Tacloban. The peak surge lasted for at least 30 min, and then just before 0100 UTC (0900 PHT) 8 November, the water subsided (Figs. 4h–i).
In addition, the modeled water level in Fig. 4 shows three apparent peaks corresponding to points C, G, and after point I. The peaks may coincide with the three “waves” reported by eyewitnesses (Amadore 2013; Morgerman 2014), although the timing could not be verified since the eyewitnesses did not track the timing of the three waves. In the open sea coast of Hernani, accounts of the storm surge coming in three waves also exist. The video footage from Hernani showed the building collapsing with the impact of the second wave, which corresponds to the highest and steepest peak in the storm surge model in San Pedro Bay.
The storm surge simulation of Ty 1897 (Fig. 5) showed water levels and peak surge timing that are consistent with Algué’s report (see the supplemen-tal information online at http://dx.doi.org/10.1175 / B A M S - D -14 - 0 0 24 5 . 2) . I n B a s e y, nor t h-northeasterly offshore winds forced the water to
Fig. 5. Storm surge model sequence of Ty 1897 in San Pedro Bay from 0200 to 0400 UTC 12 Oct 1897 with colors and arrows representing water level and wind magnitude and direction, respectively.
41JANUARY 2016AMERICAN METEOROLOGICAL SOCIETY |

recede (Fig. 5a). The initial rise of the surge occurred with the east-southeasterly winds (Fig. 5b), whereas south-southeasterly winds caused the peak surge in Tacloban and Basey (Figs. 5c,d). On the contrary, in Tolosa the model did not absolutely replicate the actual surge height. Algué reported surge height of ~3 m, but the model yielded 2 m. The discrep-ancy can be attributed to various factors including changes in nearshore bathymetry, storm-wave con-tribution, and uncertainties in the Ty 1897 typhoon parameters. For the most part of San Pedro Bay, the modeled surges indicate that Ty 1897 generated lower surge heights than Typhoon Haiyan (Fig. 6), which is consistent with the field measurements for both storm surge events. The magnitude dif-ference of the modeled surge heights between the two typhoons (Fig. 7) is also consistent with the magnitude difference of the measured water levels in both posttyphoon surveys.
I M P L I C AT I O N S F O R D I S A S T E R MANAGEMENT. Understanding the local storm surge hazard. The complex interactions among several factors including typhoon intensity represented
by the lowest pressure and maximum wind speed, forward movement of the typhoon, storm size, bathymetry, coastline shape, and tidal phase result in varying storm surge height and flooding duration for any storm (e.g., Emanuel 2005a; Irish et al. 2008; Needham and Keim 2014). Given the similar areas impacted by the storm surges of Ty 1897 and Typhoon Haiyan, the coastal geomorphology is assumed to be relatively constant for these two events. Lander et al. (2014) estimated a 20-cm sea level rise between 1970 and 2013, which likely did not contribute signifi-cantly to the impact of the storm surge from Typhoon Haiyan. The effect of sea level rise on the tidal phases of Ty 1897 and Typhoon Haiyan is beyond the scope of this study. We focused on differences in typhoon characteristics including track, intensity, size, and forward movement and their possible effect on the storm surge characteristics.
Despite the atmospheric differences between Ty 1897 and Typhoon Haiyan, the resulting two storm surges share notable similarities dictated by the local coastal configuration (Fig. 2). At exposed locations like Hernani, both typhoons generated peak surges exceeding 7 m with significant storm-wave contri-
butions superimposed on top of the surge. In stark contrast, sheltered locations such as General MacArthur experienced the lowest flood levels with 2-m peak surges. Another similarity in both typhoons was the water receding off Basey in San Pedro Bay prior to the peak surge. Based on the historica l accounts a nd ou r s i mu l at ion s , the 1.2-k m-wide stra it separating Jinamoc Island from Basey can be exposed as the water recedes prior to the peak surge given the shallow-water depth of ~1.5 m under normal con-ditions. In both typhoons, the surge in San Pedro Bay initially rose just before the typhoon made landfall on Leyte Island with east-erly onshore winds. The surge then peaked with the southeasterly onshore winds as the typhoon eye
Fig. 6. Modeled surge heights comparison between Ty 1897 and Typhoon Haiyan in San Pedro Bay. (a) Graphical representation of the modeled water level at Tacloban for Ty 1897 and Typhoon Haiyan. (b) Modeled maximum surge heights in San Pedro Bay during Ty 1897. (c) Modeled maximum surge heights in San Pedro Bay during Typhoon Haiyan.
42 JANUARY 2016|
moved west toward the interior of Leyte Island (Figs. 4, 5).
Irrespective of the coastal configuration, whether in exposed open sea (e.g., Hernani) or in a sheltered embayment (e.g., San Pedro Bay), the typhoon forward motion resulted in significantly different peak flooding duration between the two storm surge events. The slower forward motion of Ty 1897 resulted in longer peak floods lasting for about 3 h. In contrast, the much-faster-moving Typhoon Haiyan resulted in rapid high velocity peak f loods spanning about 30 min to nearly 1 h.
The higher and more extensive peak surge around San Pedro Bay during Typhoon Haiyan compared to Ty 1897 (Fig. 6) could be due to the latitudinal shift of the typhoon tracks, differences in the intensity and forward motion of these two typhoons, or a combina-tion of these factors. The northerly track of Ty 1897 made Tanauan the landfall location, reducing the surge near Palo and Tanauan; this is true especially given the relative absence of strong onshore winds when com-pared to Typhoon Haiyan. Meanwhile, the relatively more intense and larger Typhoon Haiyan generated stronger onshore winds on the northern and western shores of San Pedro Bay. The stronger onshore winds in turn induced surge heights almost twice those of Ty 1897, thereby extending over a wider region (Fig. 6).
Apart from typhoon intensity, the storm size was recognized as an additional important factor in gen-erating high storm surges and extensive inundation during Hurricane Katrina (Irish et al. 2008). Given the geometry of San Pedro Bay, however, the storm size might not be an equally significant factor in generating high storm surges in the case of Typhoon Haiyan. The distance from the Typhoon Haiyan track to the head of San Pedro Bay is ~40 km, which is well within the zone of maximum winds. Although when considering the more southerly track of Typhoon Haiyan, the storm size likely contributed to the ex-treme surge heights along the more exposed coasts of eastern Samar such as at Hernani.
Multihazard evacuation strategies. Figure 8 shows the damage from Typhoon Haiyan surrounding San Pedro Bay. In the northern part of Tacloban, including the downtown area, the landward limit of inundation during Typhoon Haiyan exceeded 500 m (Tajima et al. 2014). Along low-lying, swampy areas south of downtown Tacloban, and similarly at Tanauan, inun-dation extended more than 2-km inland. Overland flooding reached over 2 km, but the primary areas of damage were concentrated within 200 m of the coast, highlighting that the destructive power of storm
waves riding on top of the storm surge has a limited inland penetration [Federal Emergency Management Agency (FEMA 2011). Very few structures withstood the energy of the storm surge and superimposed storm waves (Figs. 8b,c,d,f). In areas above the surge heights, extreme typhoon winds caused greater dam-age, destroying roofs and wide swaths of coconut trees (Fig. 8e). Therefore, the combined hazards from storm surge f looding, extreme winds, and the prevailing vulnerabilities must be considered when developing appropriate evacuation strategies.
Typhoon warning and response. The Philippine gov-ernment issued typhoon forecasts and warnings for evacuations at least 18 h before Typhoon Haiyan’s landfall to achieve minimum and possibly zero casualties from the imminently approaching cyclonic storm threat (Ranada 2013; NDRRMC 2013c; IRIDeS 2014). Preliminary social surveys suggest that local residents had a mixed response to the typhoon warn-ings emerging from complex social concerns (IRIDeS 2014; Leelawat et al. 2014). These studies highlight that communication pathways, warning systems, evacuation plans, and multilevel hazard and disaster perception were significant concerns for evacuation decisions among individuals in the areas severely impacted by Typhoon Haiyan. These f indings underscore the need for the authorities responsible for disseminating weather warnings to better under-stand how typhoon warnings are transmitted from an initial source through intermediate relays to the final recipients, as well as how the potentially vulnerable
Fig. 7. Difference in water levels of the modeled maximum surge height between Ty 1897 and Typhoon Haiyan in San Pedro Bay.
43JANUARY 2016AMERICAN METEOROLOGICAL SOCIETY |

that many people along the Gulf and Atlantic coasts in the United States have incorrectly believed that they have been through major cyclonic events , although Baker (1991) rec-ognized that defining and measuring hurricane ex-perience is a difficult task. Of particular relevance to the Philippines, sev-eral residents on Leyte and Samar Islands admitted that their experience of past typhoons misled them
to believe that an evacuation lead time of minutes would be sufficient. This raises a long-lasting ques-tion: How does the experience of smaller, relatively less impactful events shape the response of the com-munity to larger, unprecedented events or those with return periods outside the living memory of residents?
On a broader note, although stronger prehistoric events (Donnelly et al. 2006; Nott 2007) remain to be explored, and as long as other historical events remain unverified, the Ty 1897 and Typhoon Haiyan storm surges may serve as worst-case scenarios for this region. These rare but disastrous events should be carefully evaluated toward enhancing community-based disaster risk awareness, planning, and response.
Fig. 8. Photos of storm dam-age around San Pedro Bay. (a) Location map. Most struc-tures proximal to the coast in (b) Tacloban, (d) Basey, and (f ) Tanauan were com-pletely destroyed by the storm surge and the overriding storm waves. Like in most coastal settlements, existing guide-lines on foreshore easement3 were completely ignored. (c) In Anibong village, just north of downtown Tacloban, stilt houses are rebuilt seaward of the stranded ships 2 months after the event. (e) In Marabut, wide swaths of palm trees chopped by the extreme winds.
3 The Water Code of the Philippines (Presidential Decree 1067) designates an easement of 40 m from seashore. This is supposed to be a “no build zone” area.
residents receive, heed, interpret, and decide to act upon these warnings.
Given the historical perspective of storm surge hazards discussed in this paper, social scientists and historians may be able to improve local historical awareness about previous typhoon experiences to aid in hazard perception and response. Historical records show that several tropical cyclones have made landfall in the area surrounding Leyte Gulf (Fig. 9; Tables 3 and 4). According to an unpublished data of PAGASA4, nine of the tropical cyclones have gener-ated storm surges (Table 3). Among these storms, residents identify the November 1984 Typhoon Ag-nes and the associated coastal flooding of more than 2-m deep in Samar and Leyte as the worst in living memory (e.g., Amadore 2013). Leik et al. (1981) noted
44 JANUARY 2016|

C O N C L U S I O N S . Historical records reveal a predecessor to Typhoon H a i y a n o c c u r r e d o n 12 October 1897. This typhoon, referred to here as Ty 1897, took a sim-ilar path of destruction through the eastern cen-tral Philippines. Ty 1897 and Haiyan had almost identical typhoon tracks, but Typhoon Haiyan was more intense, had larger maximum wind coverage, and moved faster than Ty 1897. Our combined field observations, eyewitness accounts, and computer simulations consistently indicate that Ty phoon Haiyan’s storm surge was about twice the height of the 1897 event in San Pedro Bay, but the two storm surges had similar heights on the open Pacific coast such as at Hernani. While stronger prehistoric events remain unexplored, Ty 1897 and Typhoon Haiyan storm surges may serve as extreme scenarios for this region in terms of disaster risk awareness, planning, and response.
ACKNOWLEDGMENTS. This research is sup-ported by the National Research Foundation Singapore under its Singapore NRF Fellowship scheme (National Research Fellow Award NRF-RF2010-04) and adminis-tered by Earth Observatory of Singapore and the National Research Foundation Singapore and the Singapore Ministry of Education under the Research Centres of Excellence initiative. Additional funding for the Filipino scientists has come from the Department of Science and Technology, the Philippines. We thank Antonia
Table 3. Tropical cyclones with known storm surge occurrence (represented as white solid lines in Fig. 9).
No. Name Date Max winds (kt)a Min pressure (hPa)
1 No name 12 Oct 1897 (694 mmb,c) 925
2 No name 4 May 1913 (727.8 mmc) 970
3 No name 3 Jun 1923 (739.52 mmc) 973
4 26W 14 Dec 1948 35a, JTWC
5 Wanda 23 Apr 1971 40a, JMA 993a, JMA
6 Agnes 4 Nov 1984 100a, JMA 925a, JMA
7 Skip 7 Nov 1988 70a, JMA 955a, JMA
8 Mike 12 Nov 1990 90a, JMA 935a, JMA
9 Haiyan 8 Nov 2013 125a, JMA 895a, JMA
Table 4. Tropical cyclones with unknown storm surge occurrence (represented as white dashed lines in Fig. 9).
No. Name Date Max winds (kt)a Min pressure (hPa)
1 No name 24 Nov 1912d (693.08 mme) 923
2 Wanda 20 Nov 1951 90a, JTWC 985a, JMA
3 Wilma 27 Oct 1952 130a, JTWC 930a, JMA
4 Tilda 29 Nov 1954 120a, JTWC 980a, JMA
5 Irma 15 May 1966 100a, JTWC 974a, JMA
6 Jean 14 July 1971 75a, JTWC 980a, JMA
7 Kit 7 Jan 1972 75a, JTWC 975a, JMA
8 Nelson 25 Mar 1982 105a, JTWC 940a, JMA
9 Axel 21 Dec 1994 95a, JTWC 960a, JMA
a IBTrACS database of Knapp et al. (2010) using either JTWC or JMA data.b Data of Algué (1898). c Data of Algué (1904). d This Nov 1912 typhoon is believed to be deadly (http://chroniclingamerica.loc.gov/lccn/sn83045433/1912-11-30/ed-1/seq-1/), but other reports on the damage and impact to human life were insufficient for verification (U.S. War Office 1913).e Data of Selga (1935).
Fig. 9. Landfalling tropical cyclones in the surrounding area of Leyte Gulf between 1897 and 2013. Storm tracks were from the IBTrACS database of Knapp et al. (2010). The attributes of each typhoon are summarized in Tables 3 and 4.
45JANUARY 2016AMERICAN METEOROLOGICAL SOCIETY |

Yulo-Loyzaga of Manila Observatory, who provided the Algué report. We acknowledge John Elton Chua, Livre Lacierda, Mark Anthony Bamba, Mikko Garcia, Angel Doctor, and Sorvigenaleon Ildefonso for helping us gather data in the field. We are grateful to Chris Landsea and three anonymous reviewers, whose comprehensive and insightful reviews significantly improved the manuscript. Comments from Kelvin Rodolfo, Chris Gouramanis, and Aron Meltzner were valuable in refining the final version.
REFERENCESAlgué, J., 1898: El baguio de Samar y Leyte, 12–13 de
Octubre de 1897. Manila Observatory, 74 pp.—, 1904: The Cyclones of the Far East. Bureau of Public
Printing, 283 pp.Alojado, D., and D. M. Padua, 2010: Worst typhoons
of the Philippines 1947–2009. Accessed 06 July 2014. [Available online at www.typhoon2000.ph /stormstats/WorstPhilippineTyphoons.htm.]
Amadore, L. A., 2013: Storm surge in Basey, Samar. Accessed 03 April 2013. [Available online at http://opinion.inquirer.net/66477/storm-surge-in-basey -samar.]
Atkinson, G. D., and C. R. Holliday, 1977: Tropical cyclone minimum sea level pressure/maximum sustained wind relat ionship for the western North Pacif ic. Mon. Wea. Rev., 105, 421–427, doi:10.1175/1520-0493(1977)105<0421:TCMSLP >2.0.CO;2.
Bacani, L . , 2013: Dead l iest , most dest ruct ive cyclones of the Philippines. Accessed 11 July 2014. [Available online at www.philstar.com/headlines /2013/11/11/1255490/deadliest-most-destructive -cyclones-philippines.]
Baker, E. J., 1991: Hurricane evacuation behavior. Int. J. Mass Emerg. Disasters, 9, 287–310.
Bricker, J., H. Takagi, E. Mas, S. Kure, B. Adriano, C. Yi, and V. Roeber, 2014: Spatial variation of damage due to storm surge and waves during Typhoon Haiyan in the Philippines. J. Japan Soc. Civil Eng., 70, 2, I_231–I_235.
Caulderwood, K., 2014: The ten most expensive natural disasters in 2013. Accessed 03 March 2014. [Available online at w w w.ibtimes.com/report-ten-most -expensive-natural-disasters-2013-1540058.]
Donnelly, C., N. Kraus, and M. Larson, 2006: State of knowledge on measurement and modeling of coastal overwash. J. Coastal Res., 22, 965–991, doi:10.2112/04-0431.1.
Dvorak, V. F., 1975: Tropica l cyclone intensity analysis and forecasting from satellite imagery. Mon. Wea. Rev., 103, 420–430, doi:10.1175/1520 -0493(1975)103<0420:TCIAAF>2.0.CO;2.
—, 1984: Tropical cyclone intensity analysis using satellite data. NOAA Tech. Rep. NESDIS 11, 50 pp. [Available online at ftp://satepsanone.nesdis.noaa .gov/Publications/Tropical/Dvorak_1984.pdf.]
Egbert, G. D., and S. Y. Erofeeva, 2002: Efficient in-verse modeling of barotropic ocean tides. J. Atmos. Oceanic Technol., 19, 183–204, doi:10.1175/1520 -0426(2002)019<0183:EIMOBO>2.0.CO;2.
Emanuel, K. A., 2005a: The storm surge. Divine Wind: The History and Science of Hurricanes. Oxford University Press, 147–152.
—, 2005b: The hunters. Divine Wind: The History and Science of Hurricanes. Oxford University Press, 193–202.
FEMA, 2011: Coastal construction manual: Principles and practices of planning, siting, designing, con-structing, and maintaining residential buildings in coastal areas. U.S. Department of Homeland Security FEMA P-55, Vol. 1, 242 pp.
Flater, D., 1998: XTide: Harmonic tide clock and tide predictor. Accessed 25 May 2014. [Available online at www.flaterco.com/xtide/.]
Fritz, H. M., and Coauthors, 2007: Hurricane Katrina storm surge distribution and field observations on the Mississippi Barrier Islands. Estuarine Coastal Shelf Sci., 74, 12–20, doi:10.1016/j.ecss.2007.03 .015.
—, C. D. Blount, S. Thwin, M. K. Thu, and N. Chan, 2009: Cyclone Nargis storm surge in Myanmar. Nat. Geosci., 2, 448–449, doi:10.1038/ngeo558.
—, and Coauthors, 2012: The 2011 Japan tsunami current velocity measurements from survivor videos at Kesennuma Bay using LiDAR. Geophys. Res. Lett., 39, L00G23, doi:10.1029/2011GL050686.
Harris, D. L., 1963: Characteristics of the hurricane storm surge. U.S. Department of Commerce Weather Bureau Tech. Paper 48, 19–24. [Available online at https://coast.noaa.gov/hes/images/pdf /CHARACTERISTICS_STORM_SURGE.pdf.]
Holland, G. J., 1980: An analy tic model of the wind and pressure profiles in hurricanes. Mon. Wea. Rev., 108 , 1212–1218, doi:10.1175/1520 -0493(1980)108<1212:AAMOTW>2.0.CO;2.
IRIDeS, 2014: Initial Report of International Research Institute of Disaster Science (IRIDeS): IRIDeS Fact-Finding Missions to Philippines. Tohoku University, 105 pp.
Irish, J. L., D. T. Resio, and J. J. Ratcliff, 2008: The influence of storm size on hurricane surge. J. Phys. Oceanogr., 38, 2003–2013, doi:10.1175/2008JPO3727.1.
Joint Typhoon Warning Center, 2014: JTWC western North Pacific best track data 2013. Joint Typhoon Warning Center, accessed 10 July 2014. [Available
46 JANUARY 2016|

online at www.usno.navy.mil/NOOC/nmfc-ph/RSS /jtwc/best_tracks/wpindex.php.]
Knaff, J. A., and R. M. Zehr, 2007: Reexamination of tropical cyclone wind-pressure relationships. Wea. Forecasting, 22, 71–88, doi:10.1175/WAF965.1.
Knapp, K. R., and M. C. Kruk, 2010: Quantifying inter-agency differences in tropical cyclone best track wind speed estimates. Mon. Wea. Rev., 138, 1459–1473.
Knapp, K. R., M. C. Kruk, D. H. Levinson, H. J. Diamond, and C. J. Neumann, 2010: The Inter-national Best Track Archive for Climate Steward-ship (IBTrACS): Unifying tropical cyclone best track data. Bull. Amer. Meteor. Soc., 91, 363–376, doi:10.1175/2009BAMS2755.1.
Koba, H., T. Hagiwara, S. Asano, and S. Akashi, 1990: Relationships between CI number from Dvorak’s technique and minimum sea level pressure or maxi-mum wind speed of tropical cyclone (in Japanese). J. Meteor. Res., 42, 59–67.
Kruk, M. C., K. R. Knapp, and P. A. Hennon, 2011: On the use of the Dvorak current intensity as a climate data record in the western North Pacific. 23rd Conf. on Climate Variability and Change, Seattle, WA, Amer. Meteor. Soc., 142. [Available online at https://ams.confex.com/ams/91Annual/webprogram /Paper179185.html.]
Lander, M., C. Guard, and S. J. Camargo, 2014: Super Typhoon Haiyan [in “State of the Climate 2013”]. Bull. Amer. Meteor. Soc., 95 (7), S112–S114.
Lawrence, H., and H. Cobb, 2005: Tropical cyclone report: Hurricane Jeanne, 13-28 September 2004. Accessed 11 March 2014. [Available online at www.nhc .noaa.gov/data/tcr/AL112004_Jeanne.pdf.]
Leelawat, N., C. M. R. Mateo, S. M. Gaspay, A. Suppasri, and F. Imamura, 2014: Filipinos’ views on the disaster information for the 2013 Super Typhoon Haiyan in the Philippines. Int. J. Sustainable Future Hum. Secur., 2 (2), 16–28.
Leik, R. K., T. M. Carter, J. P. Clark, S. D. Kendall, and G. A. Gifford, 1981: Community response to natural hazard warnings. Summary Final Rep. DCPA01-79-C-0214, FEMA Work Unit 2234-F, 77 pp. [Available online at http://oai.dtic.mil/oai/oai?verb =getRecord&metadataPrefix=html&identifier=ADA099509.]
Lesser, G. R., J. A. Roelvink, J. A. T. M. van Kester, and G. S. Stelling, 2004: Development and valida-tion of a three-dimensional morphological model. Coastal Eng., 51, 883–915, doi:10.1016/j.coastaleng .2004.07.014.
Mas, E., J. Bricker, S. Kure, B. Adriano, C. Yi, A. Suppasri, and S. Koshimura, 2015: Field survey report and satellite image interpretation of the 2013
Super Typhoon Haiyan in the Philippines. Nat. Hazards Earth Syst. Sci., 15, 805–816, doi:10.5194 /nhess-15-805-2015.
Morgerman, J., 2014: Super Typhoon HAIYAN in Tacloban City & Leyte, Philippines: Data & docu-mentation from the landfall zone of a category-5 cyclone. iCyclone Rep., 47 pp. [Available online at www.icyclone.com/upload/now/apr_2014/iCyclone _HAIYAN_in_Tacloban_City_040314.pdf.]
Mori, N., M. Kato, S. Kim, H. Mase, Y. Shibutani, T. Takemi, K. Tsuboki, and T. Yasuda, 2014: Local amplification of storm surge by Super Typhoon Haiyan in Leyte Gulf. Geophys. Res. Lett., 41, 5106–5113, doi:10.1002/2014GL060689.
Nakazawa, T., and S. Hoshino, 2009: Intercomparison of Dvorak parameters in the tropical cyclone datasets over the western North Pacific. SOLA, 5, 33–36, doi:10.2151/sola.2009-009.
National Mapping and Resource Information Author-ity, 1980: Nautical chart of San Pedro Bay. 1:402000. Sheet 4468.
N DR R MC , 2013a : Prepa rat ions for Ty phoon “YOLANDA” (HAIYAN). NDRMMC Situational Rep. 2, 10 pp. [Available online at www.ndrrmc .gov.ph/attachments/article/1329/Preparations _for_Typhoon_YOLANDA_(HAIYAN)_SitRep _No_02_07NOV2013_0600H.pdf.]
—, 2013b: Ef fects of Ty phoon “YOLANDA” (HAIYAN). NDRRMC Situational Rep. 10, 43 pp. [Available online at www.ndrrmc.gov.ph/attachments /article/1329/Effects_of_Typhoon_YOLANDA _(HAIYAN)_SitRep_No_10_10NOV2013_0600H .pdf.]
—, 2013c: Preparations for Typhoon “YOLANDA” (HAIYAN). NDRMMC Situational Rep. 3, 13 pp. [Available online at www.ndrrmc.gov.ph/attachments /article/1329/Preparations_for_Typhoon_YOLANDA _(HAIYAN)_SitRep_No_03_07NOV2013_0000H.pdf.]
—, 2014: Effects of Typhoon “YOLANDA” (HAIYAN). Situational Rep. 108, 67 pp. [Available online at www.ndrrmc.gov.ph/attachments/article/1329 /Effects_of_Typhoon_YOLANDA_(HAIYAN) _SitRep_No_108_03APR2014.pdf.]
Needham, H. F., and B. D. Keim, 2014: Correlat-ing storm surge heights with tropical cyclone winds at and before landfall. Earth Interact., 18, doi:10.1175/2013EI000527.1.
Nott, J., 2007: The importance of quaternary records in reducing risk from tropical cyclones. Palaeogeogr. Palaeoclimatol. Palaeoecol., 251, 137–149, doi:10.1016 /j.palaeo.2007.02.024.
Paciente, R. B., 2014: Response and lessons learned from Typhoon “Haiyan” (Yolanda). JMA/WMO Workshop
47JANUARY 2016AMERICAN METEOROLOGICAL SOCIETY |

on Effective Tropical Cyclone Warning in Southeast Asia, Session 6: Effective Early Warning: Lessons learnt from past TC Disasters. Tokyo, Japan, Japan Meteorological Agency. [Available online at www .jma.go.jp/jma/jma-eng/jma-center/rsmc-hp-pub -eg/2014_Effective_TC_Warning/documents.html.
Ranada, P., 2013: Leyte warned of storm surges. Accessed 10 November 2013. [Available online at www .rappler.com/nation/43179-yolanda-storm-surges.]
Ribera, P., R. García-Herrera, and L. Gimeno, 2008: His-torical deadly typhoons in the Philippines. Weather, 63, 194–199, doi:10.1002/wea.275.
Selga, M., 1935: Charts of remarkable typhoons in the Philippines 1902–1934. Catalogue of Typhoons 1348–1934, Manila Weather Bureau, 1–55.
Tadepalli, S., and C. E. Synolakis, 1994: The run-up of N-waves on sloping beaches. Proc. Roy. Soc. London, A445, 99–112, doi:10.1098/rspa.1994.0050.
Tajima, Y., and Coauthors, 2014: Initial report of JSCE-PICE joint survey on the storm surge disaster caused by Typhoon Haiyan. Coastal Eng. J., 56, 1450006, doi:10.1142/S0578563414500065.
Udías, A., 1996: Jesuits’ contribution to meteorology. Bull. Amer. Meteor. Soc., 77, 2307–2315, doi:10.1175/1520 -0477(1996)077<2307:JCTM>2.0.CO;2.
UNESCO, 2014: International Tsunami Survey Team (ITST) post-tsunami survey guide. UNESCO-IOC Manuals and Guides 37, 114 pp. [Available online at http://unesdoc.unesco.org/images/0022 /002294/229456E.pdf.]
U.S. War Office, 1913: Typhoons. Report of the Philippine Commission to the Secretary of War, Washington Government Printing Office, 32.
Velden, C., and Coauthors, 2006: The Dvorak tropical cyclone intensity estimation technique: A satellite-based method that has endured for over 30 years. Bull. Amer. Meteor. Soc., 87, 1195–1210, doi:10.1175 /BAMS-87-9-1195.
World Meteorological Organization, 2015: Typhoon committee operational manual: Meteorological component. Tropical Cyclone Programme Rep. TCP-23, 169 pp. [Available online at www.wmo.int/pages /prog/www/tcp/documents/TCP-23EDITION2015 .pdf.]
CLIMATE CHANGE/POLICY“ This book is timely because global climate change policy is a mess.... Drawing on concrete examples and a broad range of social science theory, this book convincingly makes the case for a social learning approach to both adaptation and emissions mitigation.” — Steve Rayner, James Martin Professor of Science and Civilization, University of Oxford
Adaptive Governance and Climate Change RONALD D. BRUNNER AND AMANDA H. LYNCH
As greenhouse gas emissions and temperatures at the poles continue to rise, so do damages from extreme weather events affecting countless lives. Meanwhile, ambitious international efforts to cut emissions have proved to be politically ineffective or infeasible. There is hope, however, in adaptive governance—an approach that has succeeded in some communities and can be undertaken by others around the globe.
In this book: • A political and historical analysis of climate change policy • How adaptive governance works on the ground • Why local, bottom-up approaches should complement global-scale
negotiations
© 2010, PAPERBACK, 424 PAGES
ISBN: 978-1-878220-97-4
AMS CODE: AGCC
LIST $35 MEMBER $22
www.ametsoc.org/amsbookstore
half-page horizontal -- 6.5” x 4.5625” 48 JANUARY 2016|

U P P L E M E N T
This document is a supplement to “Repeat Storm Surge Disasters of Typhoon Haiyan and Its 1897 Predecessor in the Philippines,” by Janneli Lea A. Soria, Adam D. Switzer, Cesar L. Villanoy, Hermann M. Fritz, Princess Hope T. Bilgera, Olivia C. Cabrera, Fernando P. Siringan, Yvainne Yacat-Sta. Maria, Riovie D. Ramos, and Ian Quino Fernandez (Bull. Amer. Meteor. Soc., 97, 31–48) • ©2016 American Meteorological Society • Corresponding author: Adam D. Switzer, Earth Observatory of Singapore, Nanyang Technological University, Singapore 639798, Singapore • E-mail: [email protected] .sg • DOI:10.1175/BAMS-D-14-00245.2
REPEAT STORM SURGE DISASTERS OF TYPHOON HAIYAN AND
ITS 1897 PREDECESSOR IN THE PHILIPPINES
by Janneli lea a. Soria, adam d. Switzer, CeSar l. Villanoy, Hermann m. Fritz, PrinCeSS HoPe t. bilgera, oliVia C. Cabrera, Fernando P. Siringan,
yVainne yaCat-Sta. maria, rioVie d. ramoS, and ian Quino Fernandez
ES3JANUARY 2016AMERICAN METEOROLOGICAL SOCIETY |
TY 1897 STORM SURGE (TRANSLATED F R O M T H E O R I G I N A L S PA N I S H DOCUMENT). Algué (1898, p. 16) describes the nature of the Ty 1897 storm surge as follows: At 0700 12 October 1897 PHT (2300 UTC 11 October), the sea, with waves on top, started to rise as strong winds from the northeast were directed toward the Hernani coast. At 0800 PHT (0000 UTC) 12 October, when winds from the northeast changed to the east, the water rose to its peak height of 7.3 m. The peak flood lasted for about 3 h before it gradually receded by 1100 PHT (0300 UTC 12 October). Meanwhile, in Basey, the prevailing northeast winds pushed the seawater offshore, exposing a wide sandy beach out to about 1.2 km between Basey and Jinamoc Island (Algué 1898, p. 23). Thereafter, the surge came in three successive waves at 30-min intervals between 0930 PHT (0130 UTC) and 1030 PHT (0230 UTC) 12 October 1897. The water gradually rose and on
the last wave reached a maximum level of 4.9 m. The peak f looding corresponded with the most violent winds from the southeast. In the nearby Tacloban Port, water rose to 4.6 m and in Cancabato Bay up to around 3.9 m. Algué (1898, p. 27) further quoted the chief of Tacloban Port in 1897, Mr. Joaquin Fontan, who recounted the water depths and the corresponding time of the rise and fall of the flood in Tacloban. The water rose waist-deep at about 1115 PHT (0315 UTC) 12 October, coinciding with winds coming from the northeast. The water may have risen about 3–4 m and remained at that height until 1415 PHT (0615 UTC) 12 October and then subsequently subsided to a knee-deep level by 1530 PHT (0730 UTC) 12 October. The peak flooding coincided with the winds blowing from the east to east-southeast, directly perpendicular to the Tacloban coast. In close proximity to the eye of Ty 1897 at Tanauan and Tolosa, the water rose to 3 m.

Fig. ES1. Photos of similar structural damage on a (top) church and on a (bottom) house sustained from Ty 1897 and Typhoon Haiyan storm surges, respectively, in Hernani, Samar.
ES4 JANUARY 2016|

Ta
bl
e E
S1. S
um
mar
y o
f eye
wit
nes
s ac
cou
nts
aro
un
d S
an P
edro
Bay
on
max
imu
m f
loo
d d
epth
s, t
imin
g, a
nd
du
rati
on
of t
he
surg
e in
un
dat
ion
two
wee
ks
afte
r th
e T
yph
oo
n H
aiya
n d
isas
ter.
Ad
dit
ion
al o
bse
rvat
ion
s in
clu
de
win
d d
irec
tio
n an
d n
um
ber
of w
ave
sets
. Th
e co
de
for
wat
erm
arks
is a
s fo
llow
s: E
W is
ey
ewit
nes
s, R
D is
raf
ted
deb
ris,
SH
is s
hip
, MI
is m
ud
line
insi
de,
MO
is m
ud
line
ou
tsid
e, T
S is
sca
rs o
n tr
ees,
BS
is s
cars
on
bu
ildin
gs, a
nd
WC
is w
all c
lock
.
Po
int
Tim
e/d
ate
Lo
calit
yL
atit
ud
e (°
N)
Lo
ngit
ud
e (°
E)
Ove
rlan
d fl
ow
dep
th
(m)
Wat
erm
ark
Tim
ing
of t
he
surg
eW
ind
dir
ecti
on
Wav
e se
tsIn
itia
l ris
eP
eak
Fal
lIn
itia
l su
rge
Pea
k su
rge
Po
st
surg
e
Tac
lob
an C
ity
116
20 P
HT
23
Nov
201
3B
aran
gay
(Bgy
.) 20
, alo
ng D
el
Pila
r St
., in
be
twee
n G
omez
an
d B
urgo
s St
.
11.2
434
125.
0015
~6
EW06
00 P
HT
~5
min
la
ter
~06
30 P
HT
217
00 P
HT
23
Nov
201
3B
gy. 2
5,
Mag
says
ay
Blv
d., c
orne
r of
Tr
ansm
itte
r R
d.
11.2
457
125.
0096
3EW
1000
PH
TA
few
min
-ut
es la
ter
Tens
of m
in-
utes
late
r
317
24 P
HT
23
Nov
201
3H
all o
f Jus
tice
, M
agsa
ysay
Blv
d.11
.246
312
5.00
952
EW09
00 o
r 10
00 P
HT
A fe
w m
in-
utes
late
rTe
ns o
f min
-ut
es la
ter
419
40 P
HT
23
Nov
201
3St
uden
t Lo
unge
, U
nive
rsit
y of
th
e Ph
ilipp
ines
Ta
clob
an,
Mag
says
ay B
lvd.
11.2
468
125.
0088
3EW
0800
PH
TA
few
min
-ut
es la
ter
~5
min
aft
er
the
peak
sur
ge
508
30 P
HT
24
Nov
201
3Se
asho
re
Espe
ras
Ave
. ne
ar B
etha
ny
Hos
pita
l
~3
EW06
45 P
HT
A fe
w m
in-
utes
late
rEa
st
609
00 P
HT
24
Nov
201
3O
ffic
e of
the
St
uden
t A
f-fa
irs
Bui
ldin
g,
UP
Tacl
oban
, M
agsa
ysay
Blv
d.
11.2
487
125.
0070
1.9
EW08
00 P
HT
A fe
w m
in-
utes
late
r09
00 P
HT
709
50 P
HT
24
Nov
201
3B
urgo
s St
.11
.239
412
5.00
512.
8EW
0445
– 05
00 P
HT
A fe
w m
in-
utes
late
r~
5 m
in a
fter
th
e pe
ak s
urge
Nor
thw
est–
nort
heas
tSo
uthe
ast
809
51 P
HT
24
Nov
201
3B
gy. 3
6, Q
uezo
n B
lvd.
, cor
ner
of
Bur
gos
St.
11.2
469
124.
9961
3.91
EW07
00 P
HT
A fe
w m
in-
utes
late
r10
00 P
HT
909
55 P
HT
24
Nov
201
3B
gy. 3
5A,
Espe
ras
Ave
.11
.238
512
5.00
575.
6EW
0700
PH
T08
00 P
HT
Wes
t-no
rthw
est–
nort
heas
t
1010
09 P
HT
24
Nov
201
3B
urgo
s St
., Ta
clob
an C
ity
11.2
464
124.
9963
3.5
RD
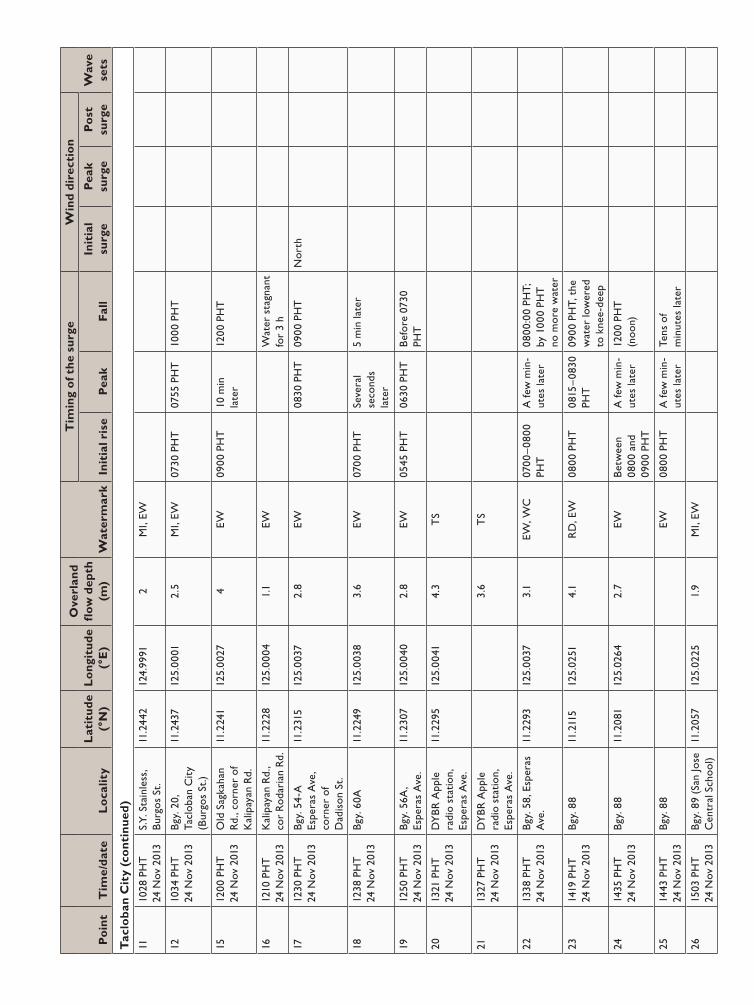
Au: in “Locality” column, please provide an ex-pansion for OSA.
Po
int
Tim
e/d
ate
Lo
calit
yL
atit
ud
e (°
N)
Lo
ngit
ud
e (°
E)
Ove
rlan
d fl
ow
dep
th
(m)
Wat
erm
ark
Tim
ing
of t
he
surg
eW
ind
dir
ecti
on
Wav
e se
tsIn
itia
l ris
eP
eak
Fal
lIn
itia
l su
rge
Pea
k su
rge
Po
st
surg
e
Tac
lob
an C
ity
(co
nti
nu
ed)
1110
28 P
HT
24
Nov
201
3S.
Y. S
tain
less
, B
urgo
s St
.11
.244
212
4.99
912
MI,
EW
1210
34 P
HT
24
Nov
201
3B
gy. 2
0,
Tacl
oban
Cit
y (B
urgo
s St
.)
11.2
437
125.
0001
2.5
MI,
EW07
30 P
HT
0755
PH
T10
00 P
HT
1512
00 P
HT
24
Nov
201
3O
ld S
agka
han
Rd.
, cor
ner
of
Kal
ipay
an R
d.
11.2
241
125.
0027
4EW
0900
PH
T10
min
la
ter
1200
PH
T
1612
10 P
HT
24
Nov
201
3K
alip
ayan
Rd.
, co
r R
odar
ian
Rd.
11.2
228
125.
0004
1.1
EWW
ater
sta
gnan
t fo
r 3
h
1712
30 P
HT
24
Nov
201
3B
gy. 5
4-A
Es
pera
s A
ve,
corn
er o
f D
adis
on S
t.
11.2
315
125.
0037
2.8
EW08
30 P
HT
0900
PH
TN
orth
1812
38 P
HT
24
Nov
201
3B
gy. 6
0A11
.224
912
5.00
383.
6EW
0700
PH
TSe
vera
l se
cond
s la
ter
5 m
in la
ter
1912
50 P
HT
24
Nov
201
3B
gy. 5
6A,
Espe
ras
Ave
.11
.230
712
5.00
402.
8EW
0545
PH
T06
30 P
HT
Bef
ore
0730
PH
T
2013
21 P
HT
24
Nov
201
3D
YB
R A
pple
ra
dio
stat
ion,
Es
pera
s A
ve.
11.2
295
125.
0041
4.3
TS
2113
27 P
HT
24
Nov
201
3D
YB
R A
pple
ra
dio
stat
ion,
Es
pera
s A
ve.
3.6
TS
2213
38 P
HT
24
Nov
201
3B
gy. 5
8, E
sper
as
Ave
.11
.229
312
5.00
373.
1EW
, WC
0700
–080
0 PH
TA
few
min
-ut
es la
ter
0800
:00
PHT;
by
100
0 PH
T
no m
ore
wat
er
2314
19 P
HT
24
Nov
201
3B
gy. 8
811
.211
512
5.02
514.
1R
D, E
W08
00 P
HT
0815
–083
0 PH
T09
00 P
HT,
the
w
ater
low
ered
to
kne
e-de
ep
2414
35 P
HT
24
Nov
201
3B
gy. 8
811
.208
112
5.02
642.
7EW
Bet
wee
n 08
00 a
nd
0900
PH
T
A fe
w m
in-
utes
late
r12
00 P
HT
(n
oon)
2514
43 P
HT
24
Nov
201
3B
gy. 8
8EW
0800
PH
TA
few
min
-ut
es la
ter
Tens
of
min
utes
late
r
2615
03 P
HT
24
Nov
201
3B
gy. 8
9 (S
an Jo
se
Cen
tral
Sch
ool)
11.2
057
125.
0225
1.9
MI,
EW

2715
06 P
HT
24
Nov
201
3B
gy. 8
9 (S
an Jo
se
Cen
tral
Sch
ool)
11.2
057
125.
0225
2.6
MO
, EW
2815
50 P
HT
24
Nov
201
3M
aras
bara
s11
.206
712
5.01
081.
7EW
2916
10 P
HT
24
Nov
201
3D
epar
tmen
t of
Bud
get
and
Man
agem
ent
re
gion
8
11.2
067
125.
0102
1.4
EWPa
st
0900
PH
T11
00 P
HT
Nor
th
3016
50 P
HT
24
Nov
201
3B
gy. 8
3-A
11.2
096
125.
0154
2.4
EW06
30 P
HT
Seve
ral
seco
nds
late
r
Bet
wee
n 08
00
and
0830
PH
TEa
st t
hen
nort
h
3113
55 P
HT
27
Nov
201
3B
gy. 6
8, A
nibo
ng11
.253
012
4.99
050.
27EW
0700
PH
TA
few
min
-ut
es la
ter
0800
PH
TN
orth
east
3215
40 P
HT
27
Nov
201
3B
gy. 8
8,
Fish
erm
an’s
Vill
age,
San
Jose
11.2
176
125.
0218
2.9
EW08
00 P
HT
Seve
ral
seco
nds
late
r
0830
PH
TN
orth
wes
t th
en e
ast
3316
40 P
HT
27
Nov
201
3B
gy. 7
0, R
awis
, A
nibo
ng11
.255
312
4.99
064
EW08
00 P
HT
A fe
w m
inut
es
late
rN
orth
wes
t th
en n
orth
-ea
st
3413
10 P
HT
28
Nov
201
3A
stro
dom
e11
.221
412
5.00
515.
7EW
Pal
o, L
eyte
3514
35 P
HT
25
Nov
201
3B
gy. S
an Jo
aqui
n11
.141
712
5.00
604.
2EW
0700
PH
TSe
vera
l se
cond
s la
ter
0800
PH
TN
orth
East
3
3614
47 P
HT
25
Nov
201
3B
gy. S
an Jo
aqui
n11
.142
612
5.00
573.
1–3.
8 m
EW07
00 P
HT
A fe
w m
in-
utes
late
r08
00 P
HT;
by
0830
PH
T, n
o m
ore
wat
er
3
3715
32 P
HT
25
Nov
201
3B
gy. B
aras
11.1
619
125.
0053
5.3
EW07
00 P
HT
Seco
nds
late
rB
etw
een
0730
an
d 08
00 P
HT
Nor
thEa
st
3816
15 P
HT
25
Nov
201
3B
gy. B
aras
11.1
657
125.
0070
2.9
BS,
EW
Aft
er s
unri
se,
may
be 0
600
PHT
Seve
ral
seco
nds
late
r
Tens
of m
in-
utes
late
rN
orth
3
3916
22 P
HT
25
Nov
201
3B
aras
11.1
661
125.
0085
3.9
Past
07
00 P
HT
A fe
w m
in-
utes
late
r
4016
38 P
HT
25
Nov
201
3B
aras
11.1
660
125.
0075
1.7
Nor
thea
stEa
st3

Po
int
Tim
e/d
ate
Lo
calit
yL
atit
ud
e (°
N)
Lo
ngit
ud
e (°
E)
Ove
rlan
d fl
ow
dep
th
(m)
Wat
erm
ark
Tim
ing
of t
he
surg
eW
ind
dir
ecti
on
Wav
e se
tsIn
itia
l ris
eP
eak
Fal
lIn
itia
l su
rge
Pea
k su
rge
Po
st
surg
e
Tan
auan
, Ley
te
4109
45 P
HT
25
Nov
201
3B
gy. S
an R
oque
11.1
076
125.
0214
1.5
EW06
30 P
HT
0700
PH
T09
00 P
HT;
by
120
0 PH
T
(noo
n), t
he
wat
er h
as
tota
lly s
ubsi
ded
Nor
th
4410
26 P
HT
25
Nov
201
3B
gy. S
anto
Niñ
o11
.105
012
5.02
04>2
EW08
00 P
HT
Seve
ral
seco
nds
late
r
0900
PH
T; b
y 10
00 P
HT,
the
w
ater
has
to
-ta
lly s
ubsi
ded
4510
40 P
HT
25
Nov
201
3B
gy. S
anto
Niñ
o11
.105
312
5.02
062.
7R
D, E
W07
00 P
HT
A fe
w m
in-
utes
late
r10
00 P
HT
3
4610
51 P
HT
25
Nov
201
3B
gy. S
an R
oque
11.1
077
125.
0217
>5EW
Bef
ore
0700
PH
T~
0400
PH
T3
4711
30 P
HT
25
Nov
201
3B
gy. S
anto
Niñ
o11
.102
712
5.02
143.
2M
I, EW
0730
–080
0 PH
TA
few
min
-ut
es la
ter
0900
PH
T3
4811
33 P
HT
25
Nov
201
3B
gy. S
an R
oque
11.1
090
125.
0219
4.9
RD
0800
PH
TSe
vera
l se
cond
s la
ter
1000
PH
T;
by 1
200
PHT
(n
oon)
, wat
er
has
tota
lly
subs
ided
4911
39 P
HT
25
Nov
201
3Sa
n R
oque
(bl
ue-
roof
ed h
ouse
)11
.109
012
5.02
207.
5EW
5011
51 P
HT
25
Nov
201
3Sa
n R
oque
(I
gles
ia n
i Cri
sto)
11.1
093
125.
0216
4.4
5113
10 P
HT
25
Nov
201
3B
gy. C
anra
mos
–B
gy. L
icod
11.1
105
125.
0158
1.9
EW07
00 P
HT
0730
PH
TN
orth
wes
tEa
st3
5213
17 P
HT
25
Nov
201
3Po
blac
ion
11.1
101
125.
0176
2.1
EW
5313
25 P
HT
25
Nov
201
3B
gy. M
agay
11.1
159
125.
0192
3.5
EWB
etw
een
0700
and
08
00 P
HT
Bet
wee
n 08
00
and
0830
PH
TEa
st-
nort
heas
tSo
uthe
ast
5413
50 P
HT
25
Nov
201
3B
gy. S
anta
Cru
z11
.124
712
5.02
214.
9EW
0800
PH
TSe
vera
l se
cond
s la
ter
Tens
of
min
utes
late
r

5514
10 P
HT
26
Nov
201
3B
islig
Ele
men
tary
Sc
hool
11.0
731
125.
0350
2.5
EW05
30 P
HT
A fe
w m
in-
utes
late
rTe
ns o
f min
-ut
es la
ter
Nor
thSo
uth
5614
19 P
HT
26
Nov
201
3B
gy. B
islig
11.0
726
125.
0343
2EW
5714
45 P
HT
26
Nov
201
3B
gy. C
abuy
nan
11.0
794
125.
0279
1.4
EW~
0600
PH
TA
few
min
-ut
es la
ter
0730
PH
TN
orth
East
5814
45 P
HT
26
Nov
201
3B
gy. C
abuy
nan
11.0
794
125.
0279
3.2
EW
5915
00 P
HT
26
Nov
201
3B
gy. S
anto
Niñ
o (z
one
IV)
11.1
002
125.
0200
3.5
MI,
EW07
00 P
HT
A fe
w m
in-
utes
late
r08
00 P
HT;
by
1000
PH
T, t
he
wat
er h
as t
o-
tally
sub
side
d
Nor
thEa
st
To
losa
, Ley
te
6011
30 P
HT
26
Nov
201
3Pr
ovin
cial
Rd.
11.0
551
125.
0367
2.5
EW07
00 P
HT
A fe
w m
in-
utes
late
r10
00 P
HT
Nor
thw
est
or n
orth
Sout
h
6112
00 P
HT
26
Nov
201
3Z
one
1, D
ona
Bri
gida
, Mir
amar
St
.
11.0
564
125.
0381
2EW
1000
PH
TSe
vera
l se
cond
s la
ter
Tens
of m
in-
utes
late
r
6213
15 P
HT
26
Nov
201
3Sa
nggu
nian
g B
ayan
Bld
g.,
Pobl
acio
n
11.0
626
125.
0384
0.6–
0.7
EW07
00 P
HT
Seve
ral
seco
nds
late
r
0900
PH
TN
orth
or
nort
heas
t
6313
30 P
HT
26
Nov
201
3Po
blac
ion
11.0
616
125.
0390
3.15
EW05
00 P
HT
0600
PH
TN
orth
Du
lag,
Ley
te
6409
45 P
HT
26
Nov
201
3B
gy. S
ungi
10.9
515
125.
0357
1EW
0630
PH
TSe
vera
l se
cond
s la
ter
Tens
of
min
utes
late
rC
alm
6510
30 P
HT
26
Nov
201
3B
gy. S
ungi
10.9
513
125.
0360
2.9
EW
6610
45 P
HT
26
Nov
201
3B
gy. S
an M
igue
l10
.961
912
5.03
610.
45EW
0700
PH
TW
est
Cal
mEa
st
6711
05 P
HT
26
Nov
201
3B
gy. L
uan
10.9
779
125.
0379
1EW
0700
PH
TSe
vera
l se
cond
s la
ter
Nor
thC
alm
Sout
h

Po
int
Tim
e/d
ate
Lo
calit
yL
atit
ud
e (°
N)
Lo
ngit
ud
e (°
E)
Ove
rlan
d fl
ow
dep
th
(m)
Wat
erm
ark
Tim
ing
of t
he
surg
eW
ind
dir
ecti
on
Wav
e se
tsIn
itia
l ris
eP
eak
Fal
lIn
itia
l su
rge
Pea
k su
rge
Po
st
surg
e
Bas
ey, S
amar
6809
21 P
HT
27
Nov
201
3B
gy. P
alay
pay
11.2
903
125.
0703
2.55
EWB
etw
een
0700
and
07
15 P
HT
Seve
ral
seco
nds
to a
few
m
inut
es
late
r
0800
PH
T; b
y 11
00 P
HT,
the
w
ater
is s
till
knee
-dee
p
6909
21 P
HT
27
Nov
201
3B
gy. P
alay
pay
11.2
902
125.
0703
3.8–
4EW
7009
41 P
HT
27
Nov
201
3B
gy. P
alay
pay
11.2
854
125.
0696
2.4
EW07
00 P
HT
Seve
ral
seco
nds
late
r
0800
PH
T; b
y 11
00 P
HT,
the
w
ater
has
to
-ta
lly s
ubsi
ded
7109
58 P
HT
27
Nov
201
3B
gy. L
oyo
11.2
798
125.
0670
3EW
0700
PH
TA
min
ute
late
rEa
st
7210
30 P
HT
27
Nov
201
3B
gy. M
erca
do11
.280
512
5.06
982.
2EW
0800
PH
TSe
vera
l se
cond
s la
ter
0830
PH
T
7311
00 P
HT
27
Nov
201
3B
gy. S
an A
nton
io11
.276
512
5.01
166.
2EW
Past
070
0 PH
TA
few
min
-ut
es la
ter
0800
PH
TEa
st