volume iv: case studies
TRANSCRIPT


420
1. Case Study I
11..11 OOuuttlliinnee ooff CCaassee SSttuuddyy 11 ((RReeccyyccllaabblleess CCoolllleeccttiioonn))The outline of the Case study 1 is summarized in the table below.
Table 1.1.1 Outline of Case Study 1Title of the Study Recyclables Collection Case Study
Study Period 6 months (July to December 2007)
Study Area ?á Residential area: Gawad Kalinga Pinagsama Villages (WesternBicutan, Taguig), Bgy. UP Campus (Quezon City)
?á Office building: Benpres Building (Bgy. San Antonio, Pasig City),Commission on Human Rights (Bgy. UP Campus, Quezon City)
?á Commercial establishment: SM City Sta. Mesa Food Court (Bgy.Santol, Quezon City)
?á School: New Era High School (Bgy. New Era, Quezon City)
Targetstakeholders
Awareness raising: communities, business establishments (private /public), and schools
Collection/recycling: collection/transportation agents, dealers, andindustries utilizing recyclable materials
Target recyclables Paper, Plastics (general types of plastics), Metals (aluminum and tin cans),Glass
Purpose of theCase Studies
?á Analysis on the impact/result of the proper segregation practice amongthe target parties through awareness raising activities using thematerials developed under the study.
?á Review and assess the possibility of developing ‘segregation at source/collection/ recycling system’ in urban areas
Main activities (1) Identification of actual recyclable collection practices in the studyareasIdentify amount of collected recyclables, which will be used as thebase line data in the study areas, through actual measurement.
(2) Development of educational / publicity materials for awareness raisingDevelop “educational / publicity materials” to promote propersegregation of recyclable materials for target communities, businessestablishments, and schools.
(3) Conduct of awareness raising activities using the educational/publicitymaterials developedBy using the educational / publicity materials developed, carry outawareness raising activities for ‘proper segregation’ for communities,business establishments, and schools in the study areas.
(4) Development of a recyclables collection plan based upon ‘wastesegregation at source” in the study areas.Develop and review the recyclables collection plan, and determine the‘methods of waste segregation at source’, ‘collection methods’, and‘recycling methods or finding final user of the material’.

421
(5) Implementation of the recyclables collection planBased upon the recyclables collection plan developed, carry outrecyclables materials collection. Record the cost and/or volume ofcollection/ transportation/ processing. Data will be used for analysis /evaluation of possibility of development of the recycling system.Duration of this activity will be 1 to 3 months.
(6) Analysis and evaluation of the recyclables collection activityBased on the data collected, compare and evaluate the wastesegregation practices or recyclable materials collected among/from thetarget entities before and after the awareness raising activities.Furthermore, analyze and evaluate the conditions, issues, and/oreconomic feasibility of the recycling system.
ExpectedOutcomes
?á Proper waste segregation at source will be promoted throughawareness raising
?á Conditions and feasibility of recycling system development in urbanarea will be identified.
Other information When implementing the case study, cooperation from industrialassociations that include TWG members in each recyclable material type,as well as barangays and LGUs.
11..22 RReeccyyccllaabblleess CCoolllleeccttiioonn iinn GGaawwaadd KKaalliinnggaa PPiinnaaggssaammaa
11..22..11 CCuurrrreenntt ccoonnddiittiioonnss aanndd iissssuueess
(1) Site profile
Gawad Kalinga (hereinafter referred to as GK) is the NPO whose mission is to provide dignity andpeace for every Filipino through providing land for the landless, homes for the homeless, and foodfor the hungry. GK has been coordinating the development of Pinagsama Villages; beneficiaries(those who are going to move in the new houses constructed by the GK projects) and volunteershave been engaged in the construction work for the village development. Residents of the GKPinagsama Village are expected to move in the new houses from the middle of August 2007.Residents of the GK Pinagsama Village are considered as low-income households, and theirsurrounding area is resided by middle-income households. The site profile is summarized in Table1.2.1, and some pictures representing the site are shown below.

422
Table 1.2.1 Profile of Gawad Kalinga PinagsamaLocation Western Bicutan, Taguig
Size 58 households distributed in two adjacent villages (Poveda andFuji Xerox, named after the sponsors)
Community organization GK Pinagsama caretaker is assigned.
Reasons for being selectedas case study site
• Community organization is present (easy to organizeactivities)
• It is highly replicable for other GK sites
• Manageable size
• Families are just starting to move in (no existing wastesegregation / recyclables collection system)
• Low-income area (the other site for residential areas isclassified as middle-income)
Construction of the Housing Planned Area for Composting
(Storage Space for Recyclables)
Common Space for Four Households Planned Area for Recyclable Storage Facility

423
Typical house in which a prospective resident iscurrently living
River next to the site (covered with plastic bags)
(2) Waste Management Practices
Waste management practices in the GK Pinagsama Village as of August 2007 are summarized inTable 1.2.2.
Table 1.2.2 Waste Management in GK Pinagsama Village before the Case StudyRecyclablesVolume/Characteristics
• Prospective residents may generate tin cans and glassbottles (but not PET bottles).
• Volunteers or visitors bring in a lot of PET bottlesSolid Waste Management • The municipal government collects household wastes
irregularly.• Since squatters do not use trashcans, they put garbage in
a plastic bag and tend to throw it into the nearby river,which is consequently filled with plastic bags (see thepicture above).
• There is no existing MRF in the village, but onecomposting area and a small recyclable storage facility(RSF) are to be established.
• There is no internal system for recyclables collection(because residents have just moved in), but each of fourhouseholds (one unit) is expected to take turns weekly tobring their recyclables to the RSF to be established in thevillage.
11..22..22 NNeeeeddss AAsssseessssmmeenntt
The needs of GK Pinagsama Village in the field of solid waste management were identified at thefocus group discussions as follows:
a. GK leaders mainly just want to have a livable environment free of litter
b. GK leaders admit that their knowledge on waste segregation is limited, and that it isnot yet a standard practice in their villages
c. They want a program that is easily replicable, is aesthetically pleasing, and promotesvalues such as cooperation with one’s neighbors, etc.

424
d. They wish to have centralized collection and selling of recyclables that the communitywould be able to benefit from
e. They want assistance in establishing their composting facility
f. As for the garbage in the creek beside the villages, they do not see this as somethingthey could address because they identify that the source of the solid waste is fromupstream sources. They say that none of their members throw garbage in the creekanymore.
11..22..33 RReeccyyccllaabblleess CCoolllleeccttiioonn PPllaann
(1) Expected Outcomes and Activities
Based on the above needs assessment, expected outcomes and corresponding activities are plannedas in the following table.
Table 1.2.3 Expected Outcomes and Activities in GK Pinagsama VillageExpected Outcome Activity
The GK Pinagsamaresidents are conductingwaste segregation at ahousehold level
• Provide the residents with one waste segregation frameincluding a pail for food wastes and hooks for bags tocontain dry wastes (recyclables and residuals) per 4housing units
• Provide the residents with a poster indicating proper wastesegregation per 4 housing units, integrated in the frame
• Give the residents instructions on proper wastemanagement
• Provide the residents with a handbook on solid wastemanagement (management of recyclables)
The GK Pinagsama Villagehas a facility to storesegregated recyclables at acommunity level
• Confirm the construction of a recyclable storage facility(RSF) with the GK caretakers
• Provide the GK Pinagsama Village with a weighing scaleand cabinets for waste paper storage
• Put posters reminding the residents of places for eachtype of recyclables in RSF
Wastes in GK Pinagsama will be handled as follows:
Table 1.2.4 Ways to Handle Wastes at GK Pinagsama Village by Waste Type
Type of SolidWaste Kitchen Waste
BiodegradableWaste (leaves,
plants)Recyclables Residuals
IntermediateContainer
Compostablescontainer in
common area- -
Residualscontainer in
common areaPerson
Responsiblefor placing
waste incorrect
container
Assigned collector Household Household AssignedCollector

425
Type of SolidWaste Kitchen Waste
BiodegradableWaste (leaves,
plants)Recyclables Residuals
Schedule ofIntermediate
Collection
Daily; andimmediately as
needed
Immediately asneeded
Immediately asneeded
Daily; andimmediately as
needed
EndDestination ofSolid Waste
Compost pit nearcreek
Compost pit nearcreek
Recyclablesstorage area
Municipalresiduals waste
truck; futureproposed
communityresidual bin
(locked)Person
Responsiblefor Transfer ofWaste to EndDestination
Assigned collector Household Household Assignedcollector
Schedule ofEnd Collection Daily Daily
To be coordinatedwith GK
administration forselling to junkshop
Upon arrival ofMunicipal Truck
(2) Structure for implementation
The solid waste management committee, which is based on the existing Gawad KalingaKapitbahayan or the neighborhood association, implements the segregation/collection ofrecyclables. The solid waste management committee has the structure as shown in Figure1.2.1. The Regional Director and the Project Director, also known as Care-takers, aremembers of Couples for Christ, while the Kapitbahayan President and the Bayanihan ActionTeam (BAT) are from the beneficiaries or residents. The Regional Director will serve as theSolid Waste Management Committee Head. The Project Directors will be the coordinators ofeach of the villages, and they will be assisted by their respective Kapitbahayan Presidents.The BAT leaders will be the coordinator to the residents; each BAT handles 5-7 households.
The set-up of the houses of the GK Pinagsama Village is that four houses or a cluster share acommon area which is use for laundry. The segregation bins will be place within the commonareas. As participation for the residents, an “Assigned Collector” will be selected every weekand will be responsible for the segregation bins. The assignment will be in rotation so thateach household will participate. The Aviary / RSF Caretaker will also be in rotation and shallbe in-charge of the Aviary and Recyclables Storage Facility.

426
Note: BAT: Bayanihan (Cooperation) Action Team
Poveda and Fuji Xerox: Sponsors to GK Pinagsama
Figure 1.2.1 Implementation Structure in GK Pinagsama Village
11..22..44 AAcchhiieevveemmeenntt
(1) Implementation Schedule
The abovementioned activities were implemented by the following schedule.
Table 1.2.5 Activity Schedule in GK Pinagsama VillageWeek Activities
23-29 Sep. 2007• Finish Solid Waste Management and Collection Plan proposals,
and discuss with key persons for approval• Finished construction of Recyclables Storage Facility
30 Sep.-14 Oct.2007
• Design, procurement and preparation of IEC materials andinfrastructure
Nov. 3, 2007 • Delivery of cabinets for RSF21-27 Oct. 2007 • Approval of a prototype waste segregation bins
Nov. 5, 2007
• Training of residents regarding proper waste segregation viasegregation activity (game) during the launching
• Installation of waste segregation frames and posters• House to house visits• Implementation of Solid Waste Management and Collection Plan
in GK Pinagsama Village• Start of monitoring.
05-17 Nov. 2007until the end of
December
• Monitoring;• Documentation
Daniel OgatisProject Director Poveda
Elsa ArboledaKapitbahayan President
Dolphy LanuzaRegional Director Metro Manila East
MerfinaCofuentes
BAT Leader
Mary AnnReyes
BAT Leader
Romualdo RodriguezProject Director Fuji Xerox
ThereseLaguiawanBAT Leader
Josephine CollamarKapitbahayan President
Residents
MerfinaCofuentes
BAT Leader
MelindaFapon
BAT Leader
Residents

427
(2) IEC Materials and Equipment Distributed
The IEC materials and equipment distributed are summarized in Table 1.2.6.
Table 1.2.6 IEC materials and Equipment Distributed in GK Pinagsama Village
Area Container / IECMaterial
No. ofUnits Notes
Waste segregationframe 20
Includes a kitchen waste pail andhooks for garbage bags,recyclables net bag
Common area of thecluster (4 housing
units) Poster on wastesegregation 20 Part of the waste segregation
framePaper cabinet (paper,newspaper, cartons) 2 One shelf per village
Sacks (for otherrecyclables) 7
Recyclables StorageFacility
(located at PovedaVillage) Weighing Scale 1
Poveda and Fuji XeroxVillage offices Program poster 2
(3) Outcomes
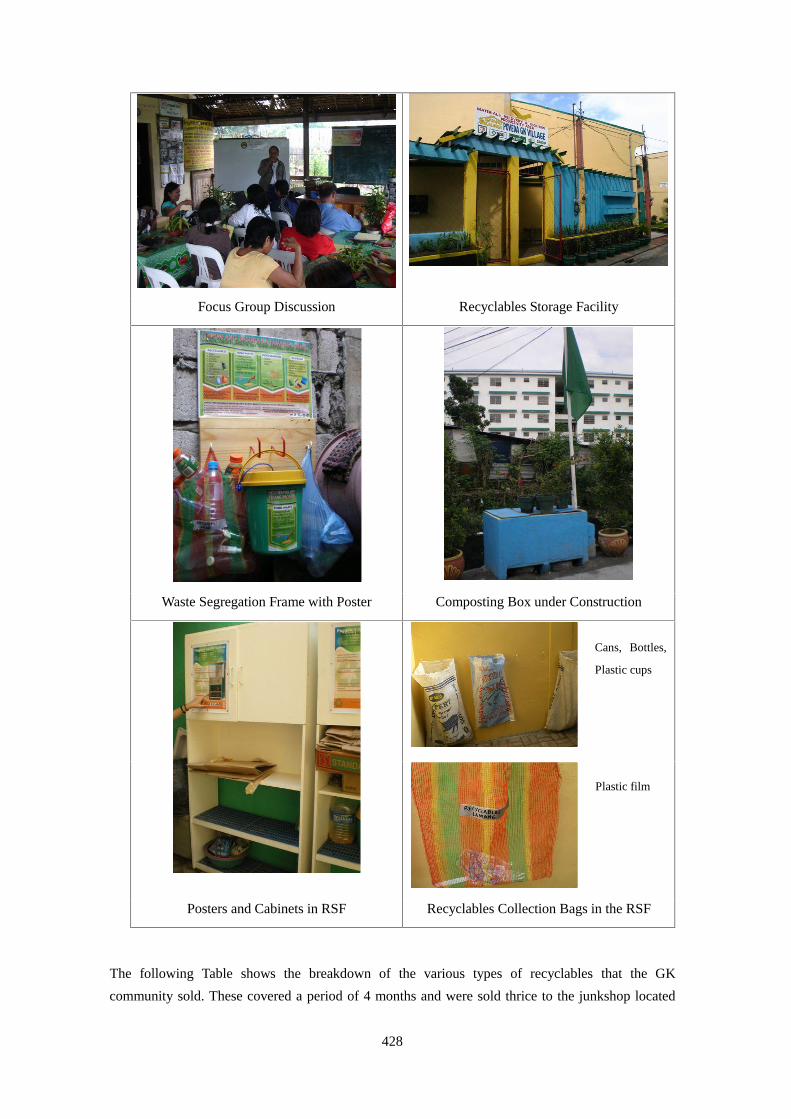
All the residents have moved into the new houses by the end of November 2007. Each of thefour units has been provided with a segregation frame with a pale for food waste and hooks forbags (see the picture “Waste Segregation Frame with Poster” below). The community hasestablished a recyclable storage facility (RSF) in their premises, and each household takes turnto transferring the recyclables from the unit courtyard to the RSF every week. Although thereis a plan to compost organic wastes generated from the residents in the community, and thecomposting box has already been constructed, they are still waiting for starting materials suchas good garden soil to be sourced elsewhere. The organic waste has not been collected forcomposting but disposed separately from residual waste for municipal waste collection.
Completed Housing Completed Housing
428
Focus Group Discussion Recyclables Storage Facility
Waste Segregation Frame with Poster Composting Box under Construction
Posters and Cabinets in RSF Recyclables Collection Bags in the RSF
The following Table shows the breakdown of the various types of recyclables that the GKcommunity sold. These covered a period of 4 months and were sold thrice to the junkshop located
Cans, Bottles,
Plastic cups
Plastic film

429
beside the creek. However most of the recyclables are still in the MRF and have yet to be weighed,waiting for bulk selling. Some residents were also observed to sell their recyclables directly to thejunkshop which is not part of the GK policy but some BAT leaders allow it since they know thatsome households are in dire need of added income. Note that the prices of the junkshop sometimesvaried throughout the course of the 4-month period.
Table 1.2.7 Volume and Value of Recyclables Collected at GK Pinagsama Villageduring the Case Study (in 4 months)
Item Weight (kg) Unit Price (PhP/ kg) Value (PhP)Cartons 32.75 3-4 32.00PET 8 21.25 170.00HDPE "Sibak" 3.75 16.00 216.80Tin cans 11 3-4 42.00Bottles (lump) 143 - 158.00Shards "bubog" 10.75 - 6.34
11..33 RReeccyyccllaabblleess CCoolllleeccttiioonn iinn UUPP BBlliissss
11..33..11 CCuurrrreenntt ccoonnddiittiioonnss aanndd iissssuueess
(1) Site profile
UP Bliss is one of the housings for those who work at the University of the Philippines.UP Bliss is composed of 11 residential buildings, and one of them is selected as the casestudy site. Each building has one janitor who collects household waste every day. Thesite profile is summarized in Table 1.3.1, and some pictures representing the site are shownbelow.
Table 1.3.1 Profile of UP BlissLocation Building 8, Pook Sikatuna BLISS, Brgy. UP Campus, Quezon CitySize 11 housing complexes (32 households in four floors per one
building)CommunityOrganization
• There are two Pooks (community unit under Barangay) inBrgy. UP Campus. One is Sikatuna Bliss (middle-incomearea) in which the case study site is located, and the other isLibis (low-income area), in which Pook level MRF is located.
Reasons for beingselected as casestudy site
• Since one of the targeted residential areas is low-income (GKPinagsama), middle-income target site was appropriate.
• Among the 11 residential buildings, the janitor at the targetedbuilding is the only one who recovers recyclables.
• Building 8 is where the Barangay Coordinator for UP Blisswas residing and it was recommended for ease ofcoordination.
• Manageable size, volume and area• The experiences in this site can be replicated in other
Buildings of the Sikatuna BLISS apartment-type housing

430
UP BLISS Housing Complex Waste Cart on the Hallway
Carts Used for Waste Collection Sorted Recyclables at BLISS MRF
Pile of un-recyclable Waste at BLISS MRF Segregated Recyclables at Barangay MRF
(2) Waste Management Practices
Waste management practices in the UP Bliss as of August 2007 are summarized in Table 1.3.2.

431
Table 1.3.2 Waste Management Practices in UP Bliss before the Case StudyRecyclablesVolume/Characteristics
• Residents generate paper, PET bottles, aluminum cans and glassbottles.
• All the recyclables are mixed with biodegradable wastes andother garbage in plastic bags.
• Roughly 2-3 small plastic bags per unit per day or one “kariton(waste push cart)” per day
Solid WasteManagement
• There is one waste bin (cart) at the hallway on each floorbrought by the eco-aide. Residents throw their garbage intothe waste bin or the eco-aide goes up the floors to get theirgarbage. The collector moves the waste bin to Libis MRF(Pook level MRF) every day.
• Each household pays PHP40 of waste collection fee everymonth. Half of the fee is paid to a collector, and the rest goesto livelihood program of the people’s organization (SKPK) towhich they are members of; therefore, residents in UP Blissthink that it is the collector that should segregate their wastes.
• The collector receives about PHP 1,200 for waste collectionevery month. In addition, the collector of Building 8 earnsabout PHP4,000 to 5,000 per month for selling recyclables he(she) recovers from the waste bin and other parts of thepremises. This is not necessarily the case for the othercollectors.
• There are two MRFs in Brgy UP Campus; one is MRF Libis(Managed by the People’s Organization), and the other is theVillage A MRF (managed by the Barangay). About threepeople are working at the Libis MRF as sorters, and fivepeople at the Village A MRF. The workers at the MRFs arepaid by the Barangay.
• The Libis MRF sells their recyclables to the Brgy level MRF.Proceeds from the selling are divided in half; the amountcollected from the recyclables is not based on the weight butby estimation by visual observation (because there is no priorweighing of Pook MRF recyclables to distinguish from thelarger MRF).
11..33..22 NNeeeeddss AAsssseessssmmeenntt
The needs of UP Bliss in the field of solid waste management were identified at the focus groupdiscussions as follows:
Stakeholder NeedsBarangay • Bgy. Captain wants to end the formation of a dumpsite within the
Libis MRF compound• The Libis MRF only accommodates solid waste from UP BLISS
and not from junkshops or the Libis community• Segregation at the household level
People’sOrganization(Sagisag ngKaalaman Para saKaunlaran, orSKPK) who managesthe Libis MRF andecoaides
• The Libis MRF should be self-reliant in terms of management andrecyclables trade
• Eco-aides are to continue their collection from the BLISSresidents with the same collection fee as before
• Proceeds from recyclables selling be allotted partly formaintenance of the Libis MRF aside from going to the 2 personnelwho sort the recyclables according to type
• Education regarding the laws on solid waste management• Organizational strengthening (formalization, IDs, guidelines)

432
Stakeholder Needs• Equipment and safety materials• Assistance in talking to the BLISS residents to segregate
biodegradable vs non-biodegradable (some have mixed feelings resegregation according to biodegradable vs. recyclable vs. residualbecause they feel that the recyclables will already be sold byindividuals from BLISS and thereby lessen their source oflivelihood)
Quezon CityEnvironmentProtection WasteManagementDepartment
• Segregation at the household level according to biodegradable,recyclable and residuals
• Residuals to only be collected on Tuesdays and Fridays, and willbe given directly to the trucks
• No accumulation of residuals for more than 24 hoursBLISS Residents • As long as their garbage is collected everyday they have no major
concern• Do not want to segregate because they pay collection fees
After the FGDs were conducted, the Barangay Captain requested the deployment of trucks from theQC EPWMD to haul the mounting garbage pile at the Libis MRF. Collection was to be temporarilyhandled directly by the barangay, while collection by the eco-aides would cease momentarily while anew collection plan is to be drafted. These actions were done independently by the Barangay in theirprerogative and capacity as the local government unit head, and did not involve the case study team.While this addressed the problem of the garbage heap in the Libis MRF, there were manymisinterpretations brought about by this action. These events occurred a month before the scheduledbarangay elections in late October 2007, and were used by political rivals to campaign against theincumbent barangay captain. Conflicts arouse between the councilor currently handling the SolidWaste Management Committee, the Barangay Coordinator for UP BLISS, the BLISS homeowners’association, and the SKPK. The eco-aides interpreted it as an immediate threat to their livelihood,because rumors have spread that the Libis MRF operations will be stopped permanently. Because ofthese events, the case study team reassessed their strategy for the area and focused on conflictresolution first between the barangay and the SKPK/ Libis MRF eco-aides. The interventions nowfocused on organizational strengthening of the eco-aides and equipping SKPK more knowledge andskills on waste management. This was done by the case study team together with the QC EPWD.Dialogues and IEC activities at the mid-income housing of UP Sikatuna BLISS were then put onhold until after the elections and designation of possibly a new SWMC head from the new barangaycouncil.
11..33..33 RReeccyyccllaabblleess CCoolllleeccttiioonn PPllaann
(1) Expected Outcomes and Activities
Based on the above needs assessment, expected outcomes and corresponding activities are plannedas in the following table.

433
Table 1.3.3 Expected Outcomes and Activities in UP BLISSExpected Outcome Activity
The eco-aides (wastecollectors) are conductingsafe waste collection andsegregation
• Prepare a handbook on solid waste management andhealth and safety risk
• Train the eco-aides on safe and proper waste collectionand segregation with the above handbook
• Provide the eco-aides with gloves and apronsThe Libis MRF keepsrecyclables at goodcondition and records ofrecyclables sold
• Provide the Libis MRF with a weighing scale, ablackboard, and a storage crate for recyclables
• Train the representative of the people’s organization tokeep records
A system to monitor wastesegregation at source(household level) isestablished
• Educate the eco-aides on the importance of wastesegregation at source
• Authorize the eco-aides as a personnel to inform the UPBLISS residents of proper waste segregation
• Formalize the eco-aide organization by formulatingGuiding Rules & Regulations
Wastes in UP Bliss will be handled as follows:
Table 1.3.4 Ways to Handle Wastes in UP Bliss
Type of SolidWaste Kitchen Waste
BiodegradableWaste
(leaves, plants)Recyclables Residuals
IntermediateContainer
Compostablescontainer in
kitchen area perhousehold
- -
PersonResponsible forplacing waste in
correct container
Household Household Household Household
Schedule ofIntermediate
Collection
Daily; andimmediately as
neededDaily Daily Tuesdays and
Fridays only
End Destination ofSolid Waste
Pig Dealers/Compost pit at
BarangayVillage A MRF
Pig Dealers/Compost pit at
Libis orBarangay
Village A MRF
Recyclablesstorage area at
Libis MRF
QCEPWMDTruckTo the
Dumpsite
PersonResponsible for
Transfer of Wasteto End Destination
ECO AID ECO AID ECO AID ECO AID
Schedule of EndCollection Daily Daily
Libis MRF willsell directly to
accreditedjunkshop after
sorting andweighing
Tuesdays andFridays

434
(2) Structure for implementation
The Organizational Chart for Implementation of Solid Waste Segregation and Collection Scheme isshown Figure 1.3.1, wherein the Barangay Captain shall be the head of the organization. Variousstakeholders involved in solid waste management shall be represented. These include the Kagawadfor Solid Waste Management, Libis MRF Management, ECO AID Representative, Bliss Coordinatorand the Representative from the Quezon City Environmental Protection and Waste ManagementDepartment.
Figure 1.3.1 Implementation Structure in UP Bliss
11..33..44 AAcchhiieevveemmeenntt
(1) Implementation Schedule
The abovementioned activities were implemented as in the schedule below.
Table 1.3.5 Activity Schedule in UP BlissWeek Activities
23-29 Sep. 200730 Sep.-14 Oct. 2007
14-20 Oct. 200721-27Oct2007
• Dialogues, conflict resolution and negotiations betweenBarangay Officials, Libis MRF, and QC EPWMD
28 Oct.- 3Nov. 2007(Barangay Elections) • Design, procurement and preparation of IEC materials
4-10 Nov. 2007• Organizational strengthening, rules and regulations
formalization• Start of monitoring of recyclables sold
11-17 Nov. 2007
• Finalize Solid Waste Management and RecyclablesCollection Plan and Eco-aide Rules and Regulations, anddiscuss with new barangay officials and QC EPWMD
• Dialogues with UP Sikatuna BLISS Management
18-24 Nov. 2007
• Creation of logo, picture taking for IDs• Painting of pushcarts• Capacity training of Libis MRF eco-aides regarding proper
recyclables sorting, weighing, safety
25 Nov.- 1 Dec. 2007 • Deployment of materials, safety gloves, weighing scale,blackboard
02-09 December 2007 • Deployment of food waste pails
Dec. 16, 2007 • Organization Christmas Party and year-end meeting• Recycling Video Film Showing
Councilor forSolid WasteManagement
Barangay Captain
Libis MRFManagement
ECO AIDRepresentative
BLISSCoordinator
QC EPWMDRepresentative

435
Week Activities• Distribution of IDs• Meeting with UP BLISS Building Coordinators and
Barangay representatives06-12 January • Deployment of aprons with SKPK logo
(2) IEC Materials and Equipment Distributed
The IEC materials and equipment distributed in UP Bliss are summarized in Table 1.3.6.
Table 1.3.6 IEC Materials and Equipment Distributed in UP BlissArea Container / IEC Material No. of Units Notes
Kitchen waste pail 11 (1pereco-aid)
With eco-aid in theircollection cartPer Sikatuna BLISS
Building Poster on household wastes 11 To be posted incommon area
Storage crates 2Black board for accounting,
signing out of pushcarts 1 Libis MRF Eco-aidesand sorters
Weighing scale 1Calculator 1
Paint and paint brushes forpushcarts
Libis MRF
Template for accountingIDs for Eco-aides 11 pieces
Aprons 11 piecesRubber Gloves 13 pairs
Eco-aides andsorter
Rubber Boots 2 pairs
(3) Outcomes
The eco-aides started using gloves and aprons for waste collection. The Libis MRF started keepingrecords (weight and price by type) of recyclables sold. All the eco-aides have been given the IDauthorized by the Barangay Captain as personnel to monitor waste segregation at segregation level.Although it is not a part of the case study activities, the Barangay to which the UP BLISS belongshas also started awareness raising activity for the promotion of waste segregation and recycling athousehold level (see the picture “Awareness Raising Team “below).

436
Focus Group Discussion Focus Group Discussion
Storage for Recyclables Blackboard for Communication and Recording
Segregation of Recyclables at Libis MRF Bin for Food Waste

437
Composting Area for Garden Waste Improved Storage for Un-recyclable Waste
Waste Segregation/Recycling Awareness RaisingTeam
Person Calling for the Community to Segregateand Recycle Wastes (with Message)
The following table shows the volume and price of recyclables collected at Libis MRF and BarangayMRF before the case study.
Table 1.3.7 Volume and Price of Recyclables Collectedat UP BLISS before the Case Study
At Libis MRFRecyclableVolume*
(monthly collection)Value**
White Paper 1 sack 6.00/ kgNewspaper/ Colored 12 sacks 0.50 – 2.00/ kgCartonsAssorted waste paper 1 sackPlastic PET 4 sacks 18 (dirty), 20 (clean)/ kgPlastic hard 3 sacks 12/ kgAluminum CansTin Cans 10 sacks 3/kgGlass 0.50 – 3/ piece
* All recyclables gathered at Libis MRF given to larger MRF to sell; no weights measured.** Prices based on personal knowledge of segregator

438
The Libis MRF was able to sell their recyclables roughly every 3-4 weeks. All transactionswere properly documented, and the data are based on actual selling prices of the junkshops theyhave done business with. The following table shows the breakdown of the different types ofrecyclables collected by the Libis MRF.
Table 1.3.8 Volume and Price of Recyclables Collected at Libis MRF during the CaseStudy
Item Weight (kg)Unit Price(PhP/ kg) Revenue (PhP)
Daily Ave.(kg/day)
White paper 89.5 8.00 694.00 0.79Newspaper 65.5 5.00 327.50 0.57Cartons 423 4.00 1,692.00 3.71Assorted paper 760 1.00 777.00 6.67PET 56 18.00 1,008.00 0.49HDPE "Sibak" 138.5 15.00 2,077.50 1.21Plastic cups 77.5 10.00 775.00 0.68Aluminum cans 5 55.00 275.00 0.04Tin cans 462.5 5.00 2,312.50 4.06Bottles (lump) - assorted pcs 342 142.40Shards 161 0.50 80.50
11..44 RReeccyyccllaabblleess CCoolllleeccttiioonn iinn BBeennpprreess BBuuiillddiinngg
11..44..11 CCuurrrreenntt ccoonnddiittiioonnss aanndd iissssuueess
(1) Site profile
Benpres Building is an office building whose tenants are related to Lopez Group including a TVnetwork and a power company. Some companies have their own canteens while there is a commoncanteen on the 5th floor for the employees who work for the companies that do not have a canteen.The site profile is summarized in Table 1.4.1, and some pictures representing the site are shownbelow.
Table 1.4.1 Profile of Benpres BuildingLocation Bgy. San Antonio, Pasig City
Size 700 employees1 building, 6 floors (18,000 sq.m.), 22 offices
Managementorganization
Administration office of Benpres Building is in charge of wastemanagement in the building. Each office (tenant) has one janitor,and there are several janitors not associated with office (clean upcommon areas)
Reasons for beingselected as case studysite
• The management of the Benpres Building is very supportive ofthe case study.
• Manageable size, volume and area

439
Overview of the Building Waste Bin for Segregation
Recyclables Sold to Junkshop Recyclables Stored at Junkshop
Bin for Recyclables at Canteen Kitchen Inside the Bin for Recyclables
(2) Waste Management Practices
Waste management practices in Benpres Building as of August 2007 are summarized as follows:

440
Table 1.4.2 Waste Management in Benpres Building before the Case StudyRecyclablesVolume/Characteristics
• Significant volume of used paper and some PET bottles andaluminum cans are generated.
• Recyclables are mixed with food residues in the offices.Solid WasteManagement
• The building does not have a solid waste management plan.• Janitors recover recyclables from waste bins in the offices,
store the recyclables in their storage for clean up tools, andsell them to a junkshop who comes to the building everyweek. The storage is too small to conduct sorting ofrecyclables.
• Some offices order their janitors to store recyclables in thebasement storage of their office, and profits from selling therecyclables go to the office administration.
• There is a communal canteen on the 5th floor. The canteenworkers sometimes take food waste back home for their pets.Hard plastics, PET bottles, and aluminum cans generated inthe canteen are segregated in the kitchen and sold to ajunkshop by the canteen workers.
• There is a large waste bin separated into three cells withdifferent color lids (blue, yellow and red). This waste binwas originally established for segregating recyclables,biodegradable, and non-biodegradable, but it has not beenutilized yet (wastes are all mixed). This is partly because thecity garbage truck does not have separate rooms forsegregated wastes.
• Some offices already have their own waste segregationschemes; however, this is not uniformly implemented in allthe offices.
• Many of the offices do not have waste bins for segregation(wet and dry wastes are all mixed).
11..44..22 NNeeeeddss AAsssseessssmmeenntt
The needs of Benpres Building were identified at the focus group discussions as follows. Major issueat Benpres Building is to improve processing of recyclables especially paper waste.
a. Building administration wants a centralized and daily collection/storage of the food-contactrecyclables to reduce pestilence
b. Administration also wants safer storage of paper recyclables to reduce fire risk
c. Janitors also wish to have better segregation by office employees to reduce efforts insegregation after collection from waste bins
11..44..33 RReeccyyccllaabblleess CCoolllleeccttiioonn PPllaann
(1) Expected Outcomes and Activities
Based on the above needs assessment, expected outcomes and corresponding activities are plannedas in the following table.

441
Table 1.4.3 Expected Outcomes and Activities in Benpres BuildingExpected Outcome Activity
Recyclables are recovered fromwaste bins with higher quality(not contacted with food waste)
• Issue a policy to promote waste segregation at thetenant offices from the Benpres BuildingAdministration
• Put posters calling for waste segregation at officesFood leftovers are segregatedfrom recyclables and residualsat offices pantries.
• Same as above• Provide office pantries with waste segregation bins
Recyclables are collected andbrought daily to commonstorage areas
• Hold meetings with janitors for the change of therecyclables collection and storage practices
• Activate the use of existing waste segregation bin inthe parking lot (for cans, plastic and glass bottles)
• Establish a storage for waste paper at the basement• For proper accounting of the “ownership” of these
recyclables, a representative of the junkshop wouldbe there daily to weigh record and monitor propersorting of said recyclables
(2) Structure for implementation
Within Benpres Building, the Benpres Building Administrator coordinates activities under the casestudy with relevant stakeholders. Benpres Building Coordinating Committee (BBCC), which is anexisting organization of Benpres Building composed of representatives from different offices andconvenes on a monthly basis, coordinates with tenant offices. Southbend Janitorial Servicesdispatch janitors to the tenant offices and coordinates with the junkshop. The cafeteriaconcessionaires have their own contract with other junkshop for selling recyclables. PasigCENRO/SWMO is in charge of collection and treatment of household wastes and contracts out themanagement to Ortigas Center Association, Inc. (OCAI). OCAI then contacts the Bagayawa garbagecollection trucks and schedules the collection within the Ortigas Center. Bagayawa is under thelarger IPM collection company servicing Pasig City.
Figure 1.4.1 Implementation Structure in Benpres Building
Ms. Ola MagnoBenpres Building Administrator
(under First Philippine Prime Holdings Corp.)
BenpresBuilding
CoordinatingCommittee
SouthbendJanitorialservices
Head
Offices
Southbend Janitors
CafeteriaConcessionaires
Representative fromRodel “Makisig”
junkshop
Ortigas CenterAssociation, Inc.
(OCAI)
Pasig CENRO/Pasig SWMO
Waste collector(Bagayawa
Truck)

442
11..44..44 AAcchhiieevveemmeenntt
(1) Implementation Schedule
The abovementioned activities were implemented as in the schedule below.
Table 1.4.4 Activity Schedule in Benpres BuildingWeek Activities
5-9 Nov. 2007 • Finish Solid Waste Management and Collection Planproposals, and discuss with key persons for approval
12-16 Nov. 2007
• Design, preparation, procurement and installation of IECmaterials and infrastructure
• Presentation of SAGIP Environment, Pasig CENRO/SWMO and OCAI to BBCC, and planning for launching ofprogram
Nov. 28, 2007
• Installation of kitchen waste pails and IEC posters for offices• Training of regarding proper waste segregation• Implementation of Solid Waste Management and Collection
Plan in Benpres• Start of monitoring
28 Nov. 2007 until endof December 2007
• Monitoring• Documentation
(2) IEC Materials and Equipment Distributed
The IEC materials and equipment distributed in Benpres Building are summarized in Table 1.3.6.In addition, Benpres Building has started utilizing the existing waste bin for segregation for theoriginal purpose and established a storage room for collected waste papers.
Table 1.4.5 IEC Materials and Equipment Distributed in Benpres BuildingArea Containers/IEC Materials Quantity Notes
Each tenant officeCommunal canteenElevator
IEC posters containinginstructions about proper solidwaste disposal
Total 24 One poster peroffice
Pantries of tenantoffices
Plastic containers for leftoverfood
11 One container perone pantry
Waste paper storageat basement
Segregation bin for paper withfour compartments
1
Outdoor waste bins Tarpaulin labels for threecompartments (recyclables,garden waste, residuals)
3
(3) Outcomes
Benpres Building has adopted the following policy for solid waste management, and BenpresBuilding Administrator has informed the tenant offices of the policy to follow.

443
1. No littering within and around the Benpres building.2. Waste materials should be placed on their proper containers.3. Waste materials should be segregated before disposal.4. Drink containers (PET Bottles, Aluminum cans) should be emptied in sinks before
disposal.5. Paper should not be crumpled.6. No smoking near the paper boxes or in the storage area.7. Segregation bins should be secured against vandalism or damage.8. Personal trashcans are encouraged to contain only residuals.
Quality of the recyclables recovered from waste bins after the start of the case study will beevaluated with the data on volume and value of the recyclables later. Recyclable segregation binsand food waste bins at the office pantries have been installed (see pictures below). Waste papersare collected and brought to a junkshop every day; this works as a part of fire prevention. Thecommon storage areas for recyclables have been established (use of the existing waste bin has beenactivated, and a storage for collected waste paper is newly established).
Recyclable Segregation Bin at Office Pantry Food Waste Bin at Office Pantry
Poster in Office Use of Existing Waste Segregation Bin

444
Collected PET Bottles Collected Recyclables Weighed by Junkshop
The following table shows the volume and value of recyclables collected at Benpres Building beforethe case study (during five working days and one weekend in May 2007).
Table 1.4.6 Volume and Value of Recyclables at Benpres Building before the CaseStudy
Recyclable Weight (kg) Unit Price (PhP/kg) Value (PhP) Daily Ave. (kg/d)
White paper 84 8.00 672.00 12.00Newspaper 70 4.00 280.00 10.00Cartons 58 2.00 116.00 8.29Assorted paper 7 1.00 7.00 1.00Shredded white 72 9.00 648.00 10.29PET 4 15.00 60.00 0.57HDPE 16 10.00 160.00 2.29Aluminum cans 1.3 1 peso/pc 72.00
*Volume is calculated based on a weekly volume.
The following data were gathered in two separate selling periods each still covering seven days ofcollection. While volumes did not vary significantly from those prior to the start of the case study, itshould be noted that the interventions for Benpres were more on improving the quality of therecyclables being received, as well as having a communal storage area for paper and wet recyclables.
Table 1.4.7 Volume and Value of Recyclables Collected at Benpres Building during theCase Study
Recyclable Weight (kg) Unit Price (PhP/kg) Value (PhP) Daily Ave. (kg/d)
White paper 60.5 8.00 484.00 8.64Newspaper 40 4.00 160.00 5.71Cartons 55.5 2.00 111.00 7.93Assorted paper 34 1.00 34.00 4.86Shredded white 12 9.00 108.00 1.71PET 8.5 15.00 127.50 1.21HDPE 4 10.00 40.00 0.57Aluminum cans 3.69 1 peso/pc 203.00 0.53

445
11..55 RReeccyyccllaabblleess CCoolllleeccttiioonn iinn CCoommmmiissssiioonn oonn HHuummaann RRiigghhttssooff tthhee PPhhiilliippppiinneess
11..55..11 CCuurrrreenntt ccoonnddiittiioonnss aanndd iissssuueess
(1) Site profile
Commission on Human Rights of the Philippines (hereinafter referred to as CHRP) is agovernment organization and has its central office in Quezon City. CHRP building islocated in Barangay UP Campus, whose land is owned by the University of the Philippines.There is a junkshop within the premises of the University; it has been collectingrecyclables before the university was established. The site profile is summarized in Table1.5.1, and some pictures representing the site are shown below.
Table 1.5.1 Profile of Commission on Human Rights of the PhilippinesLocation Bgy. UP Campus, Quezon City
Size 270 employees1 building, 3 floors, 24 offices
Managementorganization
General Services Division is in charge of waste management inthe CHRP building.
Reasons for beingselected as case studysite
• The management of CHRP is supportive of the case study.• Location within the same barangay as one of the residential
area study sites may give additional insights of dynamics atLGU level.
Overview of the Building Outdoor Waste Bin

446
Collected Waste Recyclables Recovered from Waste
Recyclables in Storage Recyclables Sorted at Junkshop
(2) Waste Management Practices
Waste management practices in the CHRP as of August 2007 are summarized as follows:
Table 1.5.2 Waste Management in Commission of Human RightsRecyclablesVolume/Characteristics
• Significant amount of paper waste is generated.• Recyclables are mixed with biodegradable or food wastes (no wet
vs. dry waste segregation).Solid WasteManagement
• There is no waste segregation practice in the office. Becauseworkers have lunch at their desks (there is no canteen in the CHRPbuilding), waste paper in the waste bin is soiled with food waste.
• The solid waste management plan has not been prepared yet.• CHRP has a policy to regarding the use of white paper (one-side
unused white paper which contains non-confidential informationshould be collected and converted into memo-pads)
• Waste paper collected by janitors is stored in a janitor lounge wherefuel oil in a coke bottle is also stored. The janitor lounge does nothave enough space for properly storing and processing recyclables.
• The junkshop who buys recyclables from the janitors at the CHRPbuilding proposes that if the recyclables are processed, he will buythem at higher price.
• Janitors are not so concerned about their health and safety duringtheir collecting recyclables.

447
11..55..22 NNeeeeddss AAsssseessssmmeenntt
The needs of CHRP in the field of solid waste management were identified at the focus groupdiscussions as follows:
a. The General Services Division wants to make their reuse policy for paper to be moreeffective
b. The General Services Division wish to minimize littering by stray cats by managing theirkitchen waste
c. Janitors wish the offices would segregate to reduce processing of the solid waste andincrease recyclables collection especially paper that is contaminated with food waste
11..55..33 RReeccyyccllaabblleess CCoolllleeccttiioonn PPllaann
(1) Expected Outcomes and Activities
Based on the above needs assessment, expected outcomes and corresponding activities are plannedas in the following table.
Table 1.5.3 Expected Outcomes and Activities in Commission on Human RightsExpected Outcome Activity
CHRP employees segregatewastes according to theinstructions
• Develop a policy on solid waste management• Give the employees and the janitors instructions on waste
segregation• Install segregation frames at each floor and waste paper
bins for each office• Take out individual trashcans from the offices
Wastes in CHRP will be handled as follows:
Table 1.5.4 Ways to Handle Wastes in CHRP
Type ofSolidWaste
LeftoverFood
Whitepaper
(both sidesused)
Whitepaper (withconfidentialinformation
)
Newspaper
Wastepaper
(Scratch,Cartons)
Recyclables (PET,
AluminumCans)
Residuals
Yardwaste(leaves
andbranches)
Intermediate Container
FoodReceptacles in officethen foodwaste binin corridor
Whitepaper
boxes inoffice
Shredder inoffice
NewspaperBoxes in
office
Wastepaper Boxes in
office
Recyclables Bin incorridor
ResidualsBin in
corridor
PersonResponsibl
e forplacingwaste incorrect
container
Officeemployees
Officeemployees
Officeemployees
Officeemployees
Office employees (assistance fromjanitor as needed when transferring
contents to wastepaper bin in corridor)Janitor
Schedule of Daily; and Daily Daily Daily Daily Daily Daily Daily

448
Type ofSolidWaste
LeftoverFood
Whitepaper
(both sidesused)
Whitepaper (withconfidentialinformation
)
Newspaper
Wastepaper
(Scratch,Cartons)
Recyclables (PET,
AluminumCans)
Residuals
Yardwaste(leaves
andbranches)
Intermediate
Collection
immediately as needed
EndDestination
of SolidWaste
Pet FoodCollector
(officeemployees)
;Composting Area forspoiled,inedible
anduncollected
leftovers
Recyclables storage
area
Recyclablesstorage area
Recyclables storage
area
Recyclables storagearea (for
immediatesorting of
recyclablescollected)
Recyclables storagearea (for
immediatesorting of
recyclablescollected)
GarbageStorageFacility;
foreventual
collectionby
EPWMDresiduals
wastetruck
Yard;Compostin
g Area
PersonResponsibl
e forTransfer ofWaste to
EndDestination
Janitor
Schedule ofEnd
CollectionDaily To be coordinated with junkshop
Monday,Wednesday
, FridayNA
(2) Structure for implementation
The waste segregation and recycling is implemented by the structure as indicated in Figure1.5.1. The General Service Division supervises the program. Representatives from each floor(floor leaders) are responsible for the dissemination of information and education regarding thesolid waste management on their corresponding floors. Administrative officer is responsiblefor the dissemination of information and education regarding the solid waste managementwithin the building and ensures that solid waste segregation and collection measures adoptedfor offices, restrooms, and yard areas are effectively implemented in coordination with the floorleaders and the maintenance supervisor.
Floor Leaders
MaintenancePersonnel
Administrative Officer
MaintenanceSupervisor
General ServiceDivision
OfficeEmployees

449
Figure 1.5.1 Structure for Implementation in Commissionon Human Rights of the Philippines
11..55..44 AAcchhiieevveemmeenntt
(1) Implementation Schedule
The abovementioned activities were implemented as in the schedule below.
Table 1.5.5 Activity Schedule in Commission on Human Rights of the PhilippinesWeek Activities
5-9 Nov. 2007 • Finish Solid Waste Management and Collection Planproposals, and discuss with key persons for approval
12-16 Nov. 2007
• Design, procurement/preparation and installation of IECmaterials and infrastructure
• Presentation of SAGIP Environment and planning forlaunching of program
19-23 Nov. 2007
• Installation of kitchen waste pails and IEC posters for offices• Room to room visits• Training of regarding proper waste segregation;• Implementation of Solid Waste Management and Collection
Plan• Start of monitoring.
26 Nov. 2007 until theend of December 2007
• Monitoring;• Documentation
(2) IEC Materials and Equipment Distributed
The IEC materials and equipment distributed in UP Bliss are summarized in Table 1.3.6.
Table 1.5.6 IEC Materials and Equipment Distributed in Commission on Human RightsArea Container / IEC Material No. of Units Notes
Waste paper box withsign
24Offices Poster identifying different
office wastes 24
Corridors Waste segregation bin withsign
7 (2 per floor forthree floors, and 1 atthe extended wing)
Includes food waste,waste paper,recyclables, andresiduals containers
Corridor Program poster 1To serve as reminderfor visitors that CHRPpractices segregation
(3) Outcomes
CHRP has adopted the following policy on solid waste management.
450
1. No Littering within and around the CHRP building premises.2. Waste materials should be placed on their proper containers.3. Waste materials should be segregated before disposal.4. Non- confidential white paper should be used on both sides before disposal.5. Paper should not be crumpled.6. Drink containers such as mineral water bottles, and aluminum cans should be emptied
of its contents before putting in the container to avoid pests.7. No smoking near the paper boxes or in the storage area.8. Segregation bins should be secured against vandalism or damage.9. Personal trash cans will be removed so that garbage segregation and collection will be
centralized at the office level.10. Employees will be encouraged to participate in segregation through IEC and
orientation sessions, also promoting the benefits of standing up, stretching and walking tothe segregation area to through their trash.
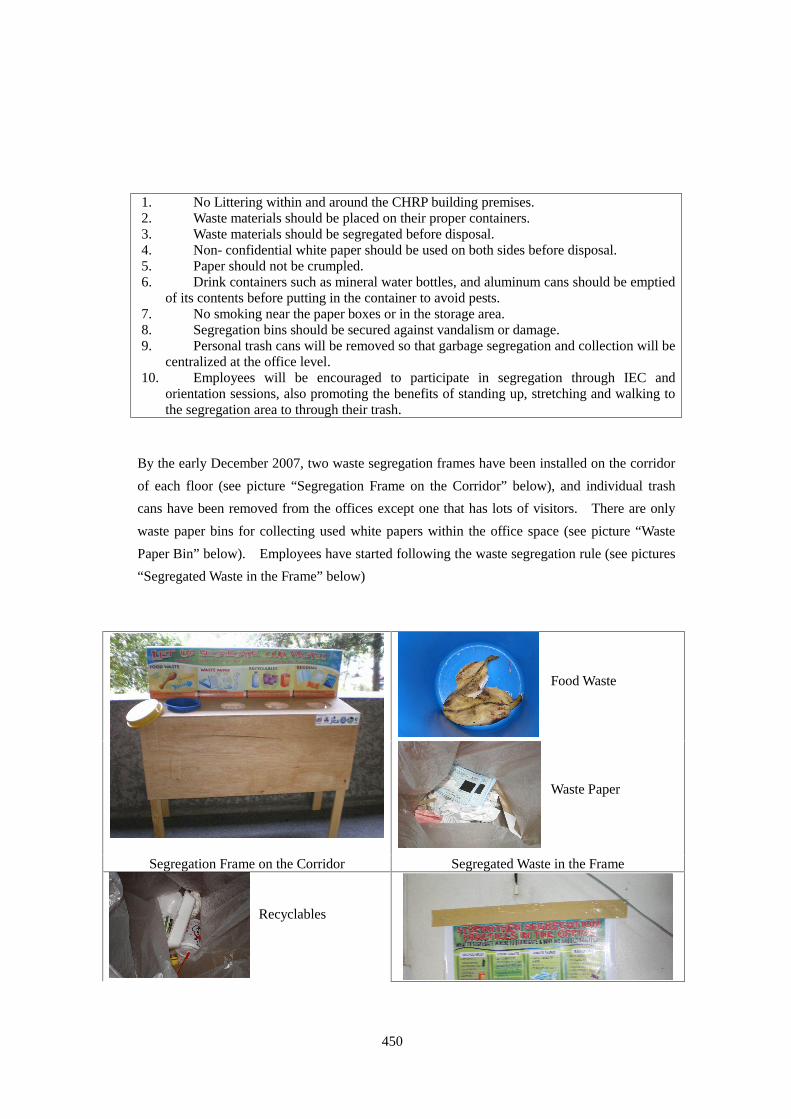
By the early December 2007, two waste segregation frames have been installed on the corridorof each floor (see picture “Segregation Frame on the Corridor” below), and individual trashcans have been removed from the offices except one that has lots of visitors. There are onlywaste paper bins for collecting used white papers within the office space (see picture “WastePaper Bin” below). Employees have started following the waste segregation rule (see pictures“Segregated Waste in the Frame” below)
Segregation Frame on the Corridor Segregated Waste in the Frame
Food Waste
Waste Paper
Recyclables

451
Segregated Waste in the Frame Poster on the Wall
Waste Paper Bin Sorted Recyclables
The following table shows the volume and value of recyclables collected at CHRP before the casestudy. They will be compared with the same kind of data after the case study period to see theimpact of the activities under the case study.
Table 1.5.7 Volume and Value of Recyclables Collected at Commission on HumanRights before the Case Study
At Primary Collection(Sold by Collectors to Junkshop)
At Consolidator(Sold by Junkshop to Consolidator)
Recyclable
Volume(per month)
Unit Price* Volume(per month)
Unit Price
White Paper 208 kg P7.00/kg 1 ton P7.00/kgNewspaper/Colored
42 kg P4.50/kg P5.00/kg
Cartons 6.5 3.00/ kg 2 tonsAssortedpaper
26 kg 2 tons
Plastic PET 3 kg P17.00/kg P18 (unprocessed)P22 (processed)
P12/ kg (colored PET)Plastic hard 1.5 kg P10.00/kg P10.00/kgResidualplastics
P0.10/ kg
AluminumCans
1.6 kg P60/kg P60/kg
Tin Cans
10-25 kilos
Glass bottles Small volume
Residuals
PET Bottles
Aluminum cans

452
The following table reflects the total volume of recyclables collected at CHRP and sold by thejanitors. This covers two transactions that they were able to record during the case study periodhowever the exact length of time this covers was indeterminate. The junkshop they sell to (BenAlmaden’s Junkshop) is located within Bgy. UP Campus, is a member of the Linis Ganda networkand has been in operation for at least 10 years.
Table 1.5.8 Volume and Value of Recyclables Collected at Commission on HumanRights during the Case Study
Recyclable Weight (kg)Unit Price(PhP/kg) Value (PhP)
White paper 96 7-8 pesos 717.00Newspaper 109 4.5 - 5.00 pesos 499.50Cartons 20 3.00 60.00Assorted paper 15 1.00 15.00PET 28 15-20 452.50HDPE 1 10.00 10.00Aluminum cans 4 52.00 208.00
11..66 RReeccyyccllaabbllee CCoolllleeccttiioonn iinn NNeeww EErraa HHiigghh SScchhooooll
11..66..11 CCuurrrreenntt ccoonnddiittiioonnss aanndd iissssuueess
(1) Site profile
New Era High School (hereinafter referred to as NEHS) is a public school and has about 3,400students. Due to an increase in students who used to go to private high schools transferred toNEHS (a public school cannot refuse the transferring students), the school facility is not enough toaccommodate all the students at one time. The school facility is used on a two-shift system; thefirst and the third grade students use the classrooms from 6:00 to 12:40, and the second and thefourth grade students from 12:40 to 19:20. The site profile is summarized in Table 1.6.1, and somepictures representing the site are shown below.
Table 1.6.1 Profile of New Era High SchoolLocation Bgy. New Era, Quezon CitySize About 3,400 students
5 buildings, 28 class roomsManagementorganization
One of the teachers has experiences in preparing a school-wide solidwaste management plan (attended one-day seminar organized byMiriam Collage)
Reasons for beingselected as casestudy site
• Profile is representative of typical urban public high school• There was a previous intervention about waste segregation
(2) Waste Management Practices
Waste management practices in the NEHS as of August 2007 are summarized as follows:

453
Table 1.6.2 Waste Management Issues in New Era High SchoolRecyclablesVolume/Characteristics
• Significant volume of PET bottles and plastic cups, and somepaper and cans are generated (students buy and eat snacksduring the morning and afternoon recess).
Solid WasteManagement
• Waste bins are in place around the campus and are alreadydesigned for segregation purposes, but the labels forsegregation have been taken off due to students’ mischief.Therefore, wastes are all mixed in the waste bins.
• There are janitors in the school to collect waste from thecommon areas. Students are in charge of bringing waste inplastic bags in the classrooms to the waste storage area.
• Students are told not to bring their snacks including drinksinto the classrooms. However, since more than 1,000students come to the small canteens to buy snacks during therecess (10 min.), students are prone to brake the rule.
• Once the waste segregation was practiced for about threemonths or so when the labels were on the waste bins. Afterthe labels were taken off, students became not practicingwaste segregation any more.
• Teachers’ workload is already heavy; it is difficult to spendextra time for them to educate their students about wastesegregation.
Waste Bin Waste Bin

454
Discarded Waste (Unsegregated) Waste Storage for Municipal Collection
11..66..22 NNeeeeddss AAsssseessssmmeenntt
The needs and concerns of NEHS in the field of solid waste management were identified at thefocus group discussions as follows:
a. Main concern of teachers is littering in the corridors, school grounds and inside theclassroom;
b. Janitor to student/ faculty ratio is 1:900 hence cleanliness and maintenance is a majorproblem;
c. Poor segregation at source makes it difficult for janitors to recover recyclables to sell;
d. Main source of solid waste problem would be waste related to eating and refreshments;
e. The mixing of biodegradable waste with recyclables and residuals causes very foul odoremitting from their mini-dumpsite within the school premises;
f. The mini-dumpsite poses a health hazard to the school population and greatly affects theatmosphere conducive to learning; and
g. Students who clean or pick up trash are teased/ laughed upon.
11..66..33 RReeccyyccllaabblleess CCoolllleeccttiioonn PPllaann
(1) Expected Outcomes and Activities
Based on the above needs assessment, expected outputs and corresponding activities are planned asin the following table.
Table 1.6.3 Expected Outcomes and Activities in New Rea High SchoolExpected Outcome Activity
Students are conductingwaste segregation according
• Hold meetings with school administrators and teachers to:(1) establish and coordinate efforts aimed at improving

455
to the instructions state of waste management and (2) determine specificplans of action that may be implemented to improve stateof waste management at NEHS
• Hold seminars for teachers (class advisers) for effectivecommunication or instruction of waste segregation topicsto students
• Hold seminars for canteen personnel for proper wet vs.dry waste segregation
• Provide NEHS with segregation frames and posters• Each class prepares waste paper bin• Hold school wide competitions for the cleanest classroom.
Wastes in NEHS will be handled as follows:
Table 1.6.4 Ways to Handle Wastes at New Era High School (Classroom)Type of Solid
Waste Paper Waste Food Waste Liquid Waste Recyclables Residuals
IntermediateContainer
Waste paperbin
Food wastecontainer
Liquid wastecontainer
Recyclablescontainer
Residualscontainer
PersonResponsiblefor placing
waste incorrect
container
To be ensured and supervised by all teachers.
Schedule ofIntermediate
CollectionDaily; and immediately as needed
EndDestination
of SolidWaste
Recyclablesstorage area
(forimmediatesorting of
recyclablescollected)
Food wastecontainer (incanteen area),
to beeventually
collected byfood wastecollector
Drainage
Recyclablesstorage area
(forimmediatesorting of
recyclablescollected)
Dumpsitearea within
schoolgrounds, for
eventualcollection by
EPWMDresiduals
waste truckPerson
Responsiblefor Transferof Waste to
EndDestination
Utility personnel assigned to classroom area.
Schedule ofEnd
Collection
Coordinatedwith barangay
junkshop.
Dailycollection bycanteen staff
As neededCoordinated
with barangayjunkshop.
As scheduledby EPWMD.
(2) Structure for implementation
The recyclables segregation/collection will be implemented by the following entities.

456
Figure 1.6.1 Structure for Implementation in New Era High School
11..66..44 AAcchhiieevveemmeenntt
(1) Implementation Schedule
The abovementioned activities were implemented by the following schedule.
Table 1.6.5 Activity Schedule in New Era High SchoolWeek Activities
23-29 Sep.2007 • Finish Solid Waste Management and Collection Plan, and discusswith key persons for their approval
30 Sep.- 3 Nov.2007
• Design, procurement, and preparation, of IEC materials andinfrastructure
Head of SWM Committee (Head Teacher)
AdministrativeOfficer
Year-LevelCoordinators
Canteen Head /Cooperative Head
CanteenPersonnel
TLE*Coordinator
Utility Personnel
Students
Teachers
TLE*: Technology andLivelihood Education

457
Week Activities
4-10 Nov. 2007• Training of canteen and utility personnel regarding proper waste
segregation;• Grand meeting with key personnel (especially teachers) regarding
implementation of Solid Waste Management and Collection Plan.
11-17 Nov. 2007
• Implementation of Solid Waste Management and Collection Planin NEHS
• Installation of segregation bins and waste paper boxes• Room to room campaigns• Start of monitoring.
18-24 Nov. 2007onwards until theend of December
• Monitoring;• Documentation
(2) IEC Materials and Equipment Distributed
The IEC materials and equipment distributed are summarized in Table 1.2.6. Each class wasasked to prepare one waste paper bin by wrapping a corrugated cardboard box with color paperso that students can distinguish them from a regular waste box.
Table 1.6.6 IEC Materials and Equipment Distributed in New Era High School
Area Container / IECMaterial No. of Units Notes
CompostablesContainer 1 Inside kitchen
Canteen Segregation Frame withsign 1
Dining area, includesbins for food waste,recyclables, liquidwaste, and residuals
Waste Paper Bin 56 (2 perclassroom)
Two classes areassigned to use aroom. Each class wasasked to prepare awaste paper bin.School Buildings
and Classrooms
Segregation Frame withsign
9 (average of 2-3per building)
Includes bins for foodwaste, recyclables,liquid waste, andresiduals
Segregation Frame withsign
3 (2 for the canteenand one near the
SSG office)
Includes bins for foodwaste, recyclables,liquid waste, andresiduals
School Grounds Tarpaulin visuallyillustrating solid waste
collection plan anddetailing categories of
waste
2Posted on the schoolbuilding wall near thegate
Program Posterdetailing the objectives
of the study1
Posted in theadministrationbuilding

458
(3) Outcomes
Segregation frames have been installed at the canteen and each floor of the school buildings, and thestudents have started segregating waste to food waste, liquid waste (leftover drinks), recyclables(plastics and cans) and residuals (see the picture “Segregation Frame at Canteen” below). A largeposter to explain waste types and proper segregation practices has been put on the wall of the schoolbuilding near the school gate so that all the students can see it (see the picture “Poster onExplanation of Waste Type”). In addition, there is a poster on recyclables collection campaign toinform students of the activities in the case study as school wide activities (see the picture “Poster onRecyclables Collection Campaign” below). Although there are some classes that have not prepareda waste paper bin, most of the classes have prepared it and started waste paper segregation (see thepicture “Waste Paper Bin” below).
NEHS has integrated recyclables collection as a school activity, and they have started to holdcleanest classroom competitions. According to the teacher in charge of coordinating therecyclables collection, there used be a pile of waste in the classrooms, but the environment has beenmuch improved since the recyclables collection campaign.
Poster on Explanation of Waste Type Poster on Recyclables Collection Campaign
Segregation Frame at Canteen Segregated Waste in the Frame
Food Waste
Funnel forLiquid Waste

459
Segregated Waste in the Frame Jar for Storing Liquid Waste (Segregation Frame)
Waste Paper Bin (for AM/PM classes) Collected Waste Paper
The following table shows the volume and price of recyclables collected at NEHS and before thecase study.
Table 1.6.7 Volume and Value of Recyclables Collectedat New Era High School before the Case Study
At Primary Collector(sold by collector to junkshop)
Recyclable
Volume*(per month) Unit Price**White Paper (wet) 49 kg Wet: P1/kg
Dry: P7/kgCartons 25 kg P4/kgPlastic PET Bottles only, cleaned and stripped of
labels – 33 kgP23/kg
Other Plastics Plastic cups + mineral bottle caps –34 kg
Plastic cups + mineral bottlecaps : P20/kg
*Amounts only reflect 2 weeks’ worth of collection.
** Price/kg indicated are as set by direct junkshop buyer; no middle-man involved.
The Table below shows the volumes and values of the recyclables sold by one of the janitors after a
Recyclables
Residuals

460
three-week period. This does not reflect however the total recyclables that were actually recovered,since the other janitor who also collects these recyclables has not yet sold her share. There are alsoreports of teachers who are now beginning to sell the paper collected from the classrooms althoughno monitoring data of this was obtained.
Table 1.6.8 Volume and Value of Recyclables Collected at New Era High School duringthe Case Study
Recyclable Weight (kg)Unit Price(PhP/kg) Value (PhP)
Daily Ave.(kg/d)
White paper 14 10.00 140.00 0.67Cartons 20 5.50 110.00 0.95PET 8 24.00 192.00 0.38HDPE 83 20.00 1,660.00 3.95spoon & fork 26 10.00 260.00 1.24tin cans 14 5.50 77.00 0.67
During the Waste Analysis and Characterization Survey (WACS) conducted by the QC EPWMD forthis site under the case study baseline data gathering, it was discovered that over a one-week period,the school generates about 24 kilos of paper, 26 kilos of plastic, and nearly 2 kilos of tin cans. Therates calculated under the recorded selling are still less than the potential rates as determined in theprevious WACS. Still there have been improvements observed – littering has reduced noticeably inthe corridors and the classrooms. One classroom that was observed to have a small garbage pile atthe back corner was given the “Most Improved Classroom” citation since it was practicingsegregation already during one of the visits to the site after project implementation.Recent visits after the Christmas vacation however revealed that some students have reverted back totheir old habits of littering and not segregating. Constant reiteration therefore is crucial in a schoolset-up, since every year there are new students coming in, and school breaks take away some of themomentum established by cleanliness campaigns such as this.
11..77 RReeccyyccllaabblleess CCoolllleeccttiioonn iinn SSMM SSttaa.. MMeessaa FFoooodd CCoouurrtt
11..77..11 CCuurrrreenntt ccoonnddiittiioonnss aanndd iissssuueess
(1) Site profile
The food court is located on the basement of the SM Sta. Mesa shopping center and has 19 tenantsthat prepare and serve food and drinks in their kitchen and 23 food stalls that only sell preparedfoods such as bread and cookies. Customers can buy their food and drinks at any of thetenants/food stalls and eat at tables in the food court. After eating, customers can throw theirwastes and leftover food and drinks into trash bins or leave them on the table. The staffs called busboys collect and segregate used plates, cups, cans, and silverwares from the tables. The reusableplates and silverwares are washed in the backyard of the food court, and plastic cups and aluminumcans are segregated for collection. The site profile is summarized in Table 1.7.1, and some pictures

461
representing the site are shown below.
Table 1.7.1 Profile of SM Sta. Mesa Food CourtLocation Quezon City (straddles the border of QC, Manila and San Juan)Size Covers most of the basement
19 tenants (with kitchen), 23 food stalls (without kitchen)Managementorganization
Food court management is in charge of solid waste managementat the food court.
Reasons for beingselected as case studysite
• Some levels of segregation of recyclables are practiced.• Replicable to the food courts in other SM shopping center.
Recyclables Collected by Busboys (DishwashingArea)
Waste Storage Area
Signage at Waste Storage Area Collected Food Waste and Plastic Bottles

462
Signage at Waste Storage Area Collected Cardboard
(2) Waste Management Practices
Waste management practices in the SM Sta. Mesa Food Court are summarized as follows:
Table 1.7.2 Waste Management in SM Sta. Mesa Food CourtRecyclablesVolume/Characteristics
• Significant volumes of PET, plastic cups, aluminum cans aregenerated.
• Segregation of recyclables (plastic cups, PET bottles, andaluminum cans) from tables in the food court is practiced.
Solid WasteManagement
• Inadequate or inconsistent orientation/training ofmaintenance employees with regards to wet vs. dry wastecollection policy as enforced on tenants.
• Tenants may not be fully aware of importance of propersegregation of waste materials generated from their kitchenoperations although there are policies on wet vs. dry wastesegregation.
• Identified types of materials segregated by busboys can stillbe expanded to maximize recyclables collected in theirefficient operations already in place.
11..77..22 NNeeeeddss AAsssseessssmmeenntt
The needs and concerns of SM Sta. Mesa Food Court were identified at the focus group discussionsas follows.
a. Food court tenants sometimes do not abide by mall policies of segregation
b. Buyer of recyclables only gets aluminum cans, cups and PET bottles, not other types ofrecyclables
c. Limited storage space for additional types of recyclables such as plastic straws, especiallysince it is not bought daily

463
d. From SM upper management, they want to see how this could be replicated in other FoodCourts
11..77..33 RReeccyyccllaabblleess CCoolllleeccttiioonn PPllaann
(1) Expected Outcomes and Activities
Based on the above needs and concerns assessment, expected outcomes and correspondingactivities are planned as in the following table.
Table 1.7.3 Expected Outputs and Activities in SM St. Mesa Food CourtExpected Output Activity
Recyclables are collectedfrom tables and sold tojunkshops in an efficientmanner
• Conduct discussions involving concerned malladministrators and hauler to determine: (1) what othertypes of recyclables may be accepted aside from the onesalready being collected; (2) steps that may be taken byadministrators to increase value of recyclables beingcollected
• Develop standard orientation/training program formaintenance staff and busboys regarding properenforcement of wet vs. dry waste segregation policies
• Conduct training on the proper enforcement of wastesegregation policies
• Find buyers of used plastic strawsTenants practice properwaste segregation
• Prepare and put on posters reminding of proper wet vs.dry segregation to be placed in conspicuous spots incommon areas
• Prepare and disseminate a booklet containing properclassification of wet vs. dry waste materials, and propersegregation methods for these
Wastes in SM St. Mesa Food Court will be handled as follows.
Table 1.7.4 Ways to Handle Wastes at SM Sta. Mesa Food Court by Waste Type
Type of SolidWaste Food Waste
Recyclables(plastic cups, PET bottles,
tin cans, straws)Residuals
IntermediateContainer Busboy Carts

464
PersonResponsible forplacing waste in
correctcontainer
Busboy personnel
Schedule ofIntermediate
CollectionDaily; and immediately as needed
End Destinationof Solid Waste Food waste collector
Recyclables collectionand segregation area; andjunkshop/recycler buyers.
Residuals bin foreventual collection by
EPWMD residuals wastetruck
PersonResponsible for
Transfer ofWaste to EndDestination
To be coordinated byOperationsSupervisor.
To be coordinated byOperations Supervisor and
Food Court Manager.
To be coordinated byOperations Supervisor
and Food CourtManager.
Schedule of EndCollection
To be coordinatedwith contact foodwaste collector
To be coordinated withbuyers.
As scheduled byEPWMD.
(2) Structure for implementation
The recyclables segregation/collection will be implemented by the following entities.
Figure 1.7.1 Structure for Implementation at SM Sta. Mesa Food Court
Food Court Manager
Tenants and FoodStall Owners
Leadmen/MaintenancePersonnel
Busboys
Mall Manager
Operations Supervisor

465
11..77..44 AAcchhiieevveemmeenntt
(1) Implementation Schedule
The abovementioned activities were implemented as in the schedule below.
Table 1.7.5 Activity Schedule in SM Sta. Mesa Food CourtWeek Activities
5-9 Nov. 2007 • Finish Solid Waste Management and Collection Planproposals, and discuss with key persons for approval
12-16 Nov. 2007
• Design, preparation, procurement and installation of IECmaterials and infrastructure
• Presentation of SAGIP Environment to SM Sta. Mesa Mallmanagement and SM Supermalls upper management
• planning for launching of program
19-23 Nov. 2007• Revisions of IEC materials incorporating SM management
comments
26 Nov. – 07December 2007
• Deployment of IEC materials for stalls• Deployment of SM food court banner
Dec. 8 2007 • Second selling of recyclables during Waste Market• Deployment of prototype push cart IEC material
Jan. 15, 2008 • Deployment of final version of push cart IEC material
(2) IEC Materials and Equipment Distributed in SM Sta. Mesa Food Court
The IEC materials and equipment distributed are summarized in Table 1.7.6.
Table 1.7.6 IEC Materials and Equipment Distributed in SM Sta. Mesa Food CourtInfrastructure
MaterialsSpecifications Quantity
IEC Posters on pushcartfront
Contains information on the busboy pushcart as asegregation module
15
Stall posters Small poster reminding tenants to segregate wet vs drywaste
30
Tarpaulin On recyclables collection project and SM Supermalls’ 1
(3) Outcomes
After the training of busboys on waste segregation and collection, they started collecting used plasticstraws as an additional recyclable (see the picture “Used Straws and Cup Caps AdditionallyCollected by Busboys” below). Although the existing waste hauler does buy used plastic straws,the Food Court has found a buyer of the straws at the monthly held Waste Market at SM Sta. Mesashopping center.
A sign to inform customers at the food court how the collected wastes are recycled is attached to apushcart that the busboy uses for waste collection, which is expected to increase awareness of thegeneral public towards recycling (see the picture “Sign for Awareness Raising of the Customers forWaste Segregation and Recycling” below).

466
Used Straws and Cup Caps AdditionallyCollected by Busboys
Waste Plastics Collected from the Food Court andSold to Junkshop
Poster on Waste Segregation Policy Poster on Proper Waste Segregation
Sign for Awareness Raising of the Customers forWaste Segregation and Recycling
Plastic Bottle Caps Collected from Tables
The following table shows the volume and price of recyclables collected at SM Sta. Mesa FoodCourt before the case study. They will be compared with the same kind of data after the case study

467
period to see the impact of the activities under the case study.
Table 1.7.7 Volume and Value of Recyclable Collected at SM Sta. Mesa Food Courtbefore the Case Study
Plastic Cups Plastic Bottles CansMonth Quantity
(kg)Peso
equivalentQuantity
(kg)Peso
equivalentQuantity
(kg)Peso
equivalent
May 2007 721 7210 279 5580 35 1750
June 2007 773 7730 352 7040 43 2150
July 1-15,2007 418 4180 192 3840 24 1200
SM Sta. Mesa Food Court was able to sell other types of recyclables, aside from those beingcollected daily by Bagayawa (PET bottles, aluminum cans and plastic cups), in two Waste Markets.These events are being held in SM and Ayala malls for more than a year, wherein the public couldbring their recyclables and e-waste to the malls and sell it to recyclers and consolidators. During thetwo Waste Markets held in SM Sta. Mesa last Oct. 27 and Dec. 8, the Food Court was able to sellvarious types of recyclables, listed in the Table below.
The volumes listed here reflect 66 days of collection, except for the PET, aluminum cans, and plasticcups, which are regularly sold to Bagayawa. During the days leading to the Waste Markets however,the Food Court stores these three recyclables over a few days and opts to sell these during the WasteMarkets. The volumes of PET, aluminum cans and plastic cups (highlighted in pink) reflect six daysof collection. Plastics and aluminum cans are sold to Polytrader Plastic Products, with recyclingfacility in Valenzuela, while the rest were sold to EJM Junkshop, operating under the QCMulti-purpose Cooperative.
Table 1.7.8 Volume and Value of Recyclable Collected at SM Sta. Mesa Food Courtduring the Case Study
Recyclable Weight (kg) Unit Price(PhP/kg)
Value (PhP) Daily Ave.(kg/d)
Newspaper 60 5.50 330.00 0.91Cartons 13 4.50 58.50 0.20PET 61.5 18.00 1,107.00 10.25HDPE 188.5 12.00 2,262.00 long storagePlastic Straws 160.5 5.00 802.50 2.43Plastic cups 161 10.00 1,610.00 26.83Assorted plastics 9 5.00 45.00 0.14Aluminum cans 15 55.00 825.00 2.50Metal scraps 26 11.00 286.00 long storageFender/ mudguard 18 10.00 180.00Bottles (lump) - assorted pcs 826 0.50 482.20 12.52Shards 39 0.50 19.50 0.59
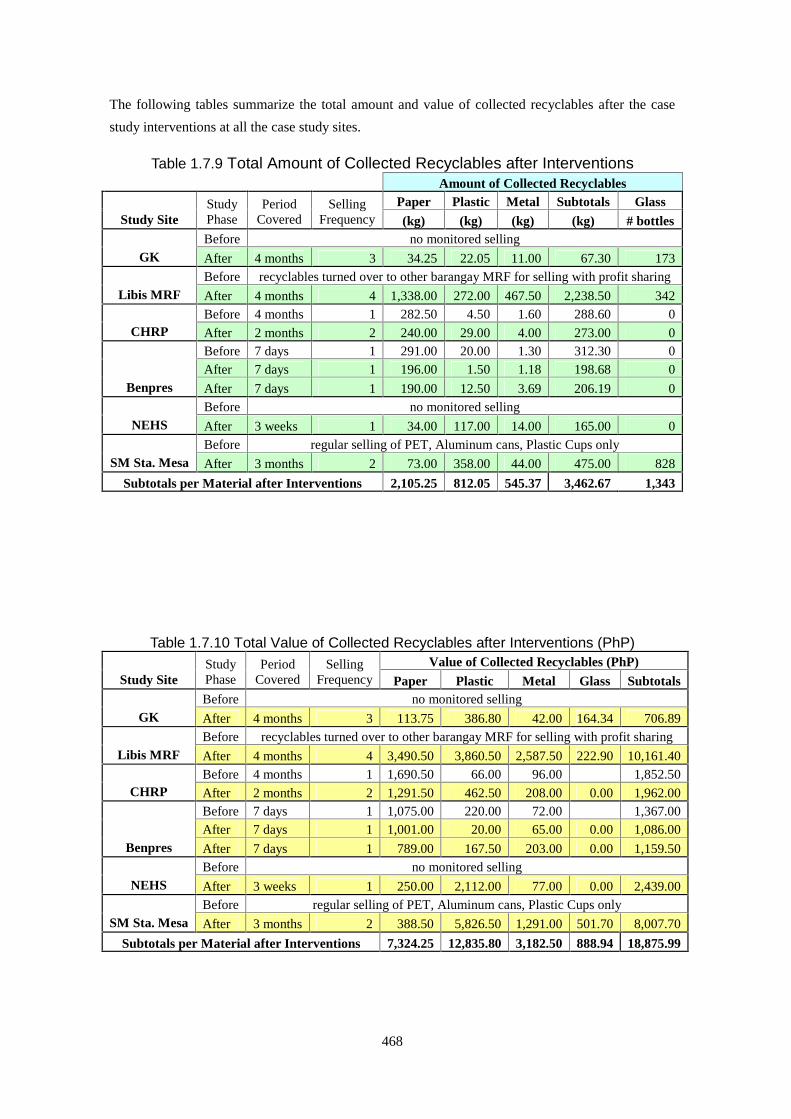
468
The following tables summarize the total amount and value of collected recyclables after the casestudy interventions at all the case study sites.
Table 1.7.9 Total Amount of Collected Recyclables after InterventionsAmount of Collected Recyclables
Paper Plastic Metal Subtotals GlassStudy Site
StudyPhase
PeriodCovered
SellingFrequency (kg) (kg) (kg) (kg) # bottles
Before no monitored sellingGK After 4 months 3 34.25 22.05 11.00 67.30 173
Before recyclables turned over to other barangay MRF for selling with profit sharingLibis MRF After 4 months 4 1,338.00 272.00 467.50 2,238.50 342
Before 4 months 1 282.50 4.50 1.60 288.60 0CHRP After 2 months 2 240.00 29.00 4.00 273.00 0
Before 7 days 1 291.00 20.00 1.30 312.30 0After 7 days 1 196.00 1.50 1.18 198.68 0
Benpres After 7 days 1 190.00 12.50 3.69 206.19 0Before no monitored selling
NEHS After 3 weeks 1 34.00 117.00 14.00 165.00 0Before regular selling of PET, Aluminum cans, Plastic Cups only
SM Sta. Mesa After 3 months 2 73.00 358.00 44.00 475.00 828Subtotals per Material after Interventions 2,105.25 812.05 545.37 3,462.67 1,343
Table 1.7.10 Total Value of Collected Recyclables after Interventions (PhP)Value of Collected Recyclables (PhP)
Study SiteStudyPhase
PeriodCovered
SellingFrequency Paper Plastic Metal Glass Subtotals
Before no monitored sellingGK After 4 months 3 113.75 386.80 42.00 164.34 706.89
Before recyclables turned over to other barangay MRF for selling with profit sharingLibis MRF After 4 months 4 3,490.50 3,860.50 2,587.50 222.90 10,161.40
Before 4 months 1 1,690.50 66.00 96.00 1,852.50CHRP After 2 months 2 1,291.50 462.50 208.00 0.00 1,962.00
Before 7 days 1 1,075.00 220.00 72.00 1,367.00After 7 days 1 1,001.00 20.00 65.00 0.00 1,086.00
Benpres After 7 days 1 789.00 167.50 203.00 0.00 1,159.50Before no monitored selling
NEHS After 3 weeks 1 250.00 2,112.00 77.00 0.00 2,439.00Before regular selling of PET, Aluminum cans, Plastic Cups only
SM Sta. Mesa After 3 months 2 388.50 5,826.50 1,291.00 501.70 8,007.70Subtotals per Material after Interventions 7,324.25 12,835.80 3,182.50 888.94 18,875.99

469
2. Case Study II
22..11 CCeelllluullaarr PPhhoonnee WWaassttee CCoolllleeccttiioonn
22..11..11 EExxeeccuuttiivvee SSuummmmaarryy
The Cell Phone Waste Collection Case Study has two main objectives, namely to increase publicawareness on proper disposal of cell phone waste and to assess the feasibility of collection in shopsor drop-off points. This study sought to establish baseline data on collection volumes and rates as anestimation of public response to such collection efforts.
The case study had a six-month implementation period, spanning from June to December 2007,which eventually extended to mid-January of 2008. This six-month period was inclusive of planning,development stages and program execution. It involved the participation of six institutions andgovernment agencies, all three network service providers, six major mobile phone manufacturers,three commercial establishments and an accredited treatment-storage-disposal facility for electronicwaste. Actual collection and monitoring under this case study was done for a four-month period,

470
which started with a formal launching on Sept. 14, 2007 at the Dusit Hotel, and ended on Jan. 9,2008. As of now however, bins for cell phone waste are still deployed at the malls for continuity ofcollection even after the case study.
Collection was primarily implemented in three Metro Manila cities, particularly only withinidentified areas of the following three malls: Glorietta and Greenbelt under the Ayala Malls (MakatiCity); SM Megamall (Mandaluyong City); and Greenhills Shopping Center (San Juan City). Sixcollection bins were positioned within each of the three malls, with four of these deployed to shopsof network service providers Smart and Sun Cellular. This totals to eighteen bins deployed incommercial establishments. Collection was also implemented within two government offices,namely the Department of Trade and Industry - Board of Investments building located along Sen. GilPuyat Ave., Makati City, and the Department of Environment and Natural Resources compoundalong Visayas Ave., Quezon City. These two offices had one bin each, generally located in the lobbyor first floor of the building.
Over the 4-month collection period, a total of 9,514 pieces of cell phone waste amounting to 280.75kilograms were collected in the 20 bins. The total potential value of collected waste from the casestudy would amount to more than PhP 1,900 for close to 281 kilograms of cell phone waste. Whiledismantling and treatment costs under current systems in the Philippines would amount to aroundPhP 2,500 for the collected waste during the past four months, the difference is manageable and canbe greatly reduced with expanded geographical coverage. Furthermore, ecological and potentialhealth benefits of proper disposal and waste diversion greatly outweigh the incurred cost.
This Case Study led to several milestones in addressing the problem of increasing cell phone waste.It established baseline public participation and collection rates given minimal interventions anddeveloped IEC materials and a blueprint for bins that entice participation without sacrificingfunctionality. A monitoring and collection protocol was devised and tested and preliminary valuesand costs with respect to program sustainability were established. Most significantly, it showed that ajoint collection program by the government and the private sector, composed of stakeholders withinthe highly competitive communications industry, is possible.
22..22 FFrraammeewwoorrkk aanndd CCoonntteexxtt
22..22..11 BBaacckkggrroouunndd aanndd RRaattiioonnaallee
(1) Electronic Waste Situation in the Philippines
1) The Growth of the Mobile Phone Industry
The Mobile Phone Industry started in the Philippines in 1991 grew linearly first five years andexpanded exponentially since then. After 16 years, there is an estimated 45 million mobile phonesubscribers distributed between the three major players in the industry at present, namely, Digitel

471
Mobile Philippines, Inc. (Sun Cellular), Globe Telecommunications, Inc. and SmartCommunications Inc. Figure 1 shows this exponential increase in subscription across the country,covering almost half of the population. This however, is not necessarily a 1:1 correspondence, sincethere are consumers who opt to have more than one line or switched to another line to avail ofproduct promotional packages.
Mobile Phone Subscribers (1991- mid 2007)
0
5
10
15
20
25
30
35
40
45
50
1991 1994 1997 2000 2003 2006
Year
#of
Uni
ts(in
Mill
ions
)
Figure 2.2-1 Mobile Phone Subscribers in the Philippines, 1991-mid 2007Source: Network service providers subscriber data
It is estimated that the average lifespan of mobile phones, commonly called cellular phones or cellphones locally, is 18 months1. This means that consumers usually change their units to more recentmodels in less than two years. This turnover rate may vary widely in the Philippines, since lowincome households would tend to prolong its use or pass on old models to relatives, while those withhigher purchasing power would keep up with the latest models. Post-paid subscribers of the majornetwork service providers are also given new units every two years as part of their subscriptionpackage. Due to consumer behavior, it would be difficult at this time to calculate the amount of cellphones purchased and in obsolescence to date. The amount of subscribers therefore would just be avery rough estimate of the number of cell phones purchased since the 1990s.
Disposal rates are more difficult to establish. To date there are no local studies conducted withregards to quantifying disposal behavior of cell phones and related waste. Most of the old units arekept at home with the anticipation that these could be of future use, however it is possible thatbatteries and other cell phone related waste are disposed with the municipal waste.
1 Marcussen, C. H. 2000. Mobile phones, WAP and the internet. Research Center of Bornholm,
Denmark. As cited by Inform, Inc. in “Waste in the wireless world”, 2002.

472
2) Policies on Electronic Waste
In the Philippines, prior to its accession to the Basel Convention in 1993, had already enacted theToxic Substances and Hazardous and Nuclear Wastes Control Act of 1990 (Republic Act 6969),declaring that it is the policy of the State to “prohibit the entry, even in transit, of hazardous andnuclear wastes and their disposal into the Philippine territorial limits for whatever purpose.2”Chapter Seven of the more recent Procedural Manual of Department Administrative Order 92-29 onHazardous Waste Management released in 2004 reiterates previous administrative orders thatelectronic assemblies and scraps are one of the recyclable materials containing hazardous substancesthat may be imported given the proper clearances from the Environmental Management Bureau(EMB)3.
In terms of electronic waste generated locally, the Implementing Rules and Regulations of RepublicAct 9003, otherwise known as the Ecological Solid Waste Management Act of 2000, outlines thestrategy for reclamation programs and buy back centers for special waste, under which electronicand electrical waste are classified4. There have been some take-back programs initiated by cellularphone companies, which will be discussed further in this report, however these have had limitedsuccess or were just taking off at the start of this study. There are also occasional RecyclablesCollection Events or Waste Markets spearheaded by the National Solid Waste ManagementCommission and the Philippine Business for the Environment, in partnership with the localgovernment unit, recyclers or waste consolidators, and the malls which serve as venues. The generalpublic is invited to bring their recyclables and non-traditional waste, such as e-waste, to the venuefor direct trade or disposal with the consolidator or recycler of these materials.
(2) The Study on Recycling Industry Development in the Philippines
1) Inception and Framework
RA 9003 mandates the Board of Investments, Department of Trade and Industry (BOI-DTI), as acore member of the National Solid Waste Commission (NSWMC), to carry out the promotion ofrecycling industries as well as creation and expansion of the recyclable materials market in thePhilippines.
To formulate policies and measures to promote recycling industries in the Philippines forenforcement of RA9003, DTI made an official request for providing technical assistance to theGovernment of Japan (GOJ). This request was validated through a Project Formulation Study in
2 Republic Act 6969 (Toxic Substances and Hazardous and Nuclear Wastes Control Act of 1990).
Section 2, Declaration of Policy.3 Department of Environment and Natural Resources Administrative Order 2004-36. Procedural
Manual Title III of DAO 92-29, “Hazardous Waste Management.”4 Department of Environment and Natural Resources Administrative Order 2001-34. Implementing
Rules and Regulations of Republic Act 9003. Rule XII, Section 6.

473
October 2005. As an outcome, the Implementation Agreement was signed between the Governmentof the Philippines (GOP) and GOJ to conduct the two-year Study on Recycling IndustryDevelopment in the Philippines (SRIDP) from July2006 to February 20085.
2) Study Objectives and Scope
The objectives of the Study on Recycling Industry Development are as follows:
• Assisting GOP to formulate “the Master Plan and Action Plan for Development ofRecycling Industry in the Philippines” in accordance with RA9003;
• Conducting case studies to examine applicability of the Master Plan and Action Plan forDevelopment of Recycling Industry in the Philippines;
• Capacity development of DTI-BOI all through the implementation of the Study.
The target recyclable materials to be studied were grouped into two categories. Traditionalrecyclables such as the different types of used paper, scrap metals, scrap plastics and glass bottles,were placed under Category I. Category II included electronic waste such as personal computers,televisions refrigerators, and cell phone batteries.
3) Case Study on Cell Phone Waste Collection
The case studies under the Study on Recycling Industry Development were to be carried out to testthe applicability of guidelines and policies to be recommended in the Master Plan and Action Plan.The case studies were to be carried out during the second year of the SRIDP. Initially the target areaswere Metro Manila and Metro Cebu, but due to certain constraints these were conducted in MetroManila only.
The Case Study on Cell Phone Waste Collection is the second of three case studies. Case Study 1 ison the use of Information, Education and Communication (IEC) materials for segregation at sourceby different types of waste generators towards increasing the amount and improving the quality ofrecyclable materials collected. Case Study 2 is on Cell Phone Waste Collection, discussed in thisreport. Case Study 3 is on Mobile Plastics Collection and Recycling. Case Studies 1& 2 wereconducted by local consultant Environmental & Sustainable Agri-Industrial Planners and Managers(SAGIP-Environment), Inc., while Case Study 3 was executed by the Philippine Plastics IndustryAssociation.
22..22..22 CCaassee SSttuuddyy GGooaallss aanndd OObbjjeeccttiivveess
The Case Study on Cellular Phone Waste Collection in the Philippines was conducted to:
• to increase public awareness on proper disposal of cell phone waste especially among cell
5 The Study on Recycling Industry in the Philippines Inception Report. 2006. Prepared by EX
Corporation, Kokusai Kogyo Co., Ltd.

474
phone users; and
• to assess the feasibility of developing cell phone waste collection in shops or drop-off points
This Case Study aimed to explore the impact of raising awareness on proper disposal of cell phonebatteries, chargers, units and accessories in three areas in Metro Manila by monitoring the volumeand corresponding value of collected waste. Furthermore, it sought to establish baseline data oncollection rates given the spatial and temporal parameters of the study, and to determine the netvalue of the collected cell phone waste.
22..22..33 SSttaakkeehhoollddeerrss IInnvvoollvveedd
(1) Composition of the Steering Committee
The Steering Committee was composed of the Department of Industry - Board of Investments (BOI),the National Solid Waste Management Commission (NSWMC), the NSWMC Secretariat through theDepartment of Environment and Natural Resources – Environmental Management Bureau, and theJapan International Cooperation Agency (JICA) Study Team. The Steering Committee metregularly to discuss direction and strategy of the Case study. Ms. Erlinda Arcellana, head of theOffice of Industrial Policy of DTI-BOI, chaired the Steering Committee.
(2) Composition of the Technical Working Group
The Technical Working Group (TWG) is a 21-partner organizations team composed of the SteeringCommittee members, Cellular Phone Manufacturers, Network Service Providers, Malls, and theE-waste collector/ recycler.
The six cellular phone manufacturers are Alcatel represented by Versatile Telecoms International Inc.,LG Electronics Philippines, Inc., Motorola Communications Philippines, Inc., Nokia Philippines,Inc., Samsung Electronics Philippines Corp., and Sony Ericsson Mobile CommunicationsInternational AB, Philippine Branch.
The three network service providers are Digitel Mobile Philippines, Inc. (Sun Cellular), GlobeTelecommunications, Inc. and Smart Communications Inc.
The three participating mall establishments are Ayala Malls Group of Ayala Land, Ortigas andCompany Limited Partnership and SM Prime Holdings, Inc.
The E-waste collector/recycler who was in charge of transport and storage was HMR EnvirocyclePhilippines, Inc., with recycling facility located in Sta. Rosa, Laguna.
This is the first time in the Philippines that the different stakeholders within the highly competitiveCellular Phone Industry have come together to work on a common undertaking.
The Technical Working Group met four times prior to the launching of the pilot project and onceafter the end of the case study period to ensure a smooth implementation of the project.

475
(3) Composition of the Case Study Team
The Case Study Team was composed of the following:
1. A Project Manager, who concurrently managed Case Study 1 and ensured the timelyand efficient execution of the project;
2. A Study Coordinator, who was coordinating closely with the major stakeholders,program partners and technical working group and assisted in the development ofinformation, education and communication campaigns.
3. A Project Administration Officer, who was in charge of administrative and fiscalconcerns of the project including logistics and procurement of materials;
4. An Information, Education and Communication (IEC) Officer, who designedappropriate strategies and materials for information, education and communicationcampaigns;
5. A Digital Artist, who was in charge of the development of the actual IEC materials;
6. Two Technical Assistants, who monitored collection and gathered data from the field ona weekly basis, and was in charge of sorting and weighing of the collected cell phonewaste.
(4) Target stakeholders for collection
Primarily, the target stakeholders identified were the product consumers, particularly the populationthat purchases cell phones and subscribers of the local service providers. The secondary targetstakeholders identified were the cellular phone retail and repair shop owners and staff for theirfrequent interaction with the consumers. Finally, the third set of targeted audience were the janitorsand maintenance personnel specifically in malls where there is a high concentration of cellular phoneretail and repair shops, since some consumers and stall tenants throw the cellular phone wastedirectly to trash bins or leave them on the floor for eventual collection.
22..22..44 SSccooppee aanndd LLiimmiittaattiioonnss
(1) Time frame and locations
The case study had a six-month implementation period, spanning from June through December 2007,which eventually extended to mid-January of 2008. This six-month period was inclusive of planning,development stages and actual program execution. Actual collection was done over a 16-week period,from September 14, 2007, to January 9, 2008.
Collection was primarily implemented in three Metro Manila cities, particularly only withinidentified areas of the following three malls: Glorietta and Greenbelt under the Ayala Malls (MakatiCity); SM Megamall (Mandaluyong City); and Greenhills Shopping Center (San Juan City). Sixcollection bins were positioned within each of the three malls, totaling eighteen bins deployed in

476
commercial establishments.
Collection was also implemented within two government offices, namely the Department of Tradeand Industry – Board of Investments building located along Sen. Gil Puyat Ave., Makati City, andthe Department of Environment and Natural Resources compound along Visayas Ave., Quezon City.These two offices had one bin each, generally located in the lobby or first floor of the building.
(2) Cellular Phone Waste Types
Initially, the cellular phone waste to be collected was confined to cellular phone batteries, whichwere perceived to be the most hazardous and problematic in terms of disposal. However, after aseries of discussions with the stakeholders and meetings at the Technical Working Group, it wasdecided that the cellular phone waste types to be collected were to be expanded to include thecellular phone unit, batteries, charges and other accessories such as but not limited to housing/casings and headsets.
(3) Resources
The Case Study was implemented with a limited budget, which could only accommodate a verystreamlined team with limited operations cost. There was also a limitation in terms of manpower inthe monitoring of the cellular phone waste collection; hence most of the monitoring activities wereconducted by the technical assistants.
Campaign materials were limited to posters which were distributed to the partners for deploymentand display in their respective shops, offices or malls. Three informative installations ormini-exhibits were produced to give customers an idea of the advantages of recycling cell phonewaste. The budget did not also allow any allocation for print ads or broadcast media. The Case Studywas still featured in a few news articles in major dailies which covered the launching of the pilotprojects in September.
Initially, the number of collection bins was limited to around 3 bins per mall. Just before the startof the collection proper, additional funds from a previous DTI-BOI project with the United NationsDevelopment Programme (UNDP) allowed construction of ten more bins. A total of twenty binswere produced.
There was no incentive program implemented in the case study. The consumers dropped theircellular phone waste on a purely voluntary basis.
(4) Logistics
Prior to collection by HMR Envirocycle, the cell phone waste deposited in the bins have to beretrieved and stored temporarily until such time that a sufficient amount has been accumulated thatwould warrant transportation from Metro Manila to the facility in Laguna. There was a limitation interms of space in the malls to maintain a temporary storage for collected cellular phone items; onlyone mall was able to provide storage space within their premises. The waste from the other sites wasbrought to the SAGIP-Environment office after retrieval from the bins, which usually occurred every

477
four weeks.
There were preparations done for the seminars for technicians and cellular phone retail and repairshop owners and staff; however these did not push through due to the high activity in the malls inpreparation for the holiday season.
22..33 MMeetthhooddss aanndd SSttrraatteeggiieessThe case study generally could be divided into four phases:
• Project planning which included research and data gathering, and consultation with theSteering Committee and Technical Working Group;
• Design and production of the cell phone waste bins and the appropriate information,education and communication (IEC) materials;
• Signing of the Memorandum of Agreement during the launching of the pilot projectsunder the 2-year JICA study and deployment of bins and IEC materials; and
• Collection proper, monitoring and data analyses.
The results of the Case Study were presented to the public during the Recycling Symposium held onJanuary 24 to 25, 2008, at the Megatrade Hall 3, SM Megamall, Mandaluyong City. Figure 2illustrates the above mentioned project phases, while Figure 3 shows the timeline of the activities.
Figure 2.3-1 Cell phone waste collection Case Study Methodology
Table 2.3-1 Schedule of ActivitiesActivities June July Aug Sept Oct Nov Dec Jan
Research and Date Gathering
Consultation with

478
Stakeholders
Design & Production of Bins& IEC Materials
Deployment & Project Launch
Collection and Monitoring
Data Analysis & Resultspresentation
22..33..11 RReesseeaarrcchh aanndd DDaattaa GGaatthheerriinngg
The Case Study Team employed three methods in gathering relevant information and research ontrends and practices on cellular phone waste collection worldwide and in the Philippines, and tostudy possible approaches and methodologies that can be used for the case study. These methodsconsisted of:
• Related literature/ internet research – The case study team searched for existing studieson cellular waste collection. Most of the related literatures were found on the internet,ranging from websites of mobile phone manufacturers, take-back projects conducted bythe manufacturers, government institutions or private groups, to scientific or academicresearch papers.
• Reconnaissance activities and meetings with malls – The CS team surveyed theidentified case study areas to locate strategic locations where consumer traffic was highand investigated other possible concerns the Case Study may face, such as security.
• Consultation with groups that conducted take-back programs – The CS team also metwith the organizations which have conducted their own cellular phone take backprograms or are planning to conduct a similar program, namely Nokia Philippines, Inc.,Globe Telecommunications Inc., and Motorola Communications Philippines Inc. tolearn from their experiences and get suggestions regarding bin design, placement andcampaign strategies.
22..33..22 CCoonnssuullttaattiioonn wwiitthh SSttaakkeehhoollddeerrss
The Case Study Team conducted a series of meetings with the various stakeholders to initially givethem an overview of the project and get their inputs on the design and implementation of the casestudy specifically with the partners who have implemented a similar take-back program.
Nokia Philippines conducted a previous collection project in conjunction with their efforts in othercountries, however while some collection bins are still deployed, the program seems to be in hiatus.Globe conducted a campaign within their office to collect cell phone waste as part of their Earth Day2007 celebrations wherein they were able to collect a significant amount of old cell phone units forjust one day of collection. Motorola Philippines on the other hand just started their take-backprogram early in 2007 and have installed 17 collection bins in their concept stores. This is also part

479
of efforts from their international office towards Extended Producer Responsibility. SamsungElectronics, Philippines likewise attempted take-back programs in their regional offices
Furthermore, the Case Study Team regularly met with the Steering Committee to give updates on thestatus of the project and get direction. The team made presentations during the five TechnicalWorking Group Meetings, initially to present the general concept of the project then the detailed planof the case study and finally to present the output of the study.
There were around 30 meetings for the period covering June to August and conducted telephoneconferences for stakeholders who were very busy.
In addition to the meetings conducted by the Case Study team, the JICA Study Team met with HMREnvirocycle and the environment manager from the Nokia Regional Office in Singapore.
22..33..33 DDrraaffttiinngg ooff tthhee MMeemmoorraanndduumm ooff UUnnddeerrssttaannddiinngg
An important process used in the Case Study was the creation of a Memorandum of Understanding(MOU), which was instrumental in binding the various stakeholders together for the project. TheMOU outlined the roles of each of the partners and other venues for their involvement. Thedocument was drafted mainly by the Steering Committee and the Case Study Team and wasconsulted and discussed during the TWG meetings prior to the launching of the pilot project.
22..33..44 DDeessiiggnn aanndd CCoonnssttrruuccttiioonn ooff CCoolllleeccttiioonn BBiinnss
The collection bin the team envisaged for case study was not only to be used as a receptacle forcellular phone waste but also as an information, education and communication (IEC) tool. Itshould therefore be attractive and functional.
Based on the data gathered from research and from the learnings of Technical Working Groupmembers which have conducted cellular phone take back program, the team designed a bin whichwould be attractive at the same time informative. The Nokia bin was made mainly of wood, withslots for cellular phone units, batteries and accessories that also merged into one inclined chute.There were no apparent exit panels for removal of the collected items, which could not be seenowing to the material composition of the bin. The Motorola bin was constructed as an uprightcollapsible carton box, with an inclined surface. It had two slots leading to two separatecompartments for mobile phones and the hand-held radios that the company also manufactures.Unlike the Nokia and Motorola bins, the receptacle used by Globe during its Earth Day collectionprogram had a clear panel that showed its contents. An informative poster was placed against afoldable wooden back panel. Owing to its size however, one has to raise the top cover and benddown to deposit the discarded item (Figure 2.3-2).
As an IEC tool, the bin had an inclined top to accommodate an interactive poster. It was made ofcombination wood and acrylic, as suggested also by the Steering Committee and consulted partners.The clear acrylic panel allowed customer to see the collected items and became a campaign strategy.The clear panel together with the design and information on the bin poster suggests a transformation

480
of the cellular phone waste to recycled products as the item dropped falls to the bottom portion of thebin.
Figure 2.3-2. Bin designs of other take-back programs

481
Figure 2.3-3 Bin dimensions and bare bin prototype
The base of the bin measured 0.40 by 0.40 meters, so as to cover minimal floor area andnot be an obstruction to customer traffic. At its highest point it measures 0.90 meters, suchthat the interactive poster would still be visible while minimizing the height of the item’sdrop. Upon consultation with the bin fabricator, the chute could only be reasonably placed0.15 meters from the top, allowing about 0.048 cubic meters collection capacity for eachbin. Figure 5 shows the dimensions of the bin. Note that the diagram did not yet includemodifications such as the right-hand slot placement, and the acrylic panels for the inclinedtop and front.
As a receptacle of cellular phone waste, the position of the slot considered the average levelof a person’s hand. The dimensions of the slot, in combination with the depth of the chute,could accommodate large analog cell phone models, but not too large to permit anypossibility of pilferage. The drop of the cellular phone waste was simulated andinterventions were placed to guide the drop and prevent unnecessary damage. Ananti-slip mat lines the chute to retard the fall of the dropped cellular phone waste item and awooden bar was placed to prevent the items from hitting and possibly destroying the

482
acrylic front panel. The foam at the bottom of the bin helps minimize the impact of thefall.
The design of the bin also considered the monitoring and collection of the cellular phonewaste. The bin was pre-numbered and a guide placed in the front panel to estimate volumebeing collected. To facilitate the removal of contents during collection, a secured backpanel door has been placed.
To make the bin look appealing, stickers of the mascot were placed all over the bin. Thefinishing was done by the study team as the budget for the bin was mostly spent onconstruction.
The 18 bins were distributed and deployed to the three malls: Glorietta and Greenbelt,Greenhills Shopping Center and SM Megamall and two to the government agencies, Boardof Investment office in Makati and the Department of Environment and Natural Resourcesoffice in Quezon City.
The bin with its IEC features is illustrated in Figure 2.3-4.
Figure 2.3-4 Cell phone waste collection bin features

483
22..33..55 DDeessiiggnn ooff IInnffoorrmmaattiioonn,, EEdduuccaattiioonn aanndd CCoommmmuunniiccaattiioonn ((IIEECC)) MMaatteerriiaallss
(1) Interactive poster on the bin
The interactive poster on the bin as an information, education and communication tool’s mainobjective was to inform the consumer about the project and encourage them to drop their cellularphone waste. The poster needed to contain all relevant information of the project since the binswere distributed in different locations in the mall as stand-alone receptacles such that need not haveauxiliary IEC materials placed beside it.
The poster contained the target items to be collected in image and text. As a consumer drops acellular phone waste, he sees the item sliding down through the transparent acrylic panel andcut-away portions of the poster, the gears on the poster connotes the transformation of waste torecycled products. The poster also lists the benefits of recycling.
The images of cellular phone and accessories were brand neutral since the case study was apartnership of cellular phone manufacturers. The poster also wanted to communicate that it was ajoint project of all major stakeholders of the cellular phone industry; hence it contained all the logosof the case study partners arranged in alphabetical order. This interactive bin poster and its featuresare shown as Figure 2.3-5.
Figure 2.3-5 Interactive bin poster features
(2) Campaign Poster
The campaign poster was the main information, education and communication material of the case

484
study. It therefore had to communicate the objective of the case study and at the same timeencourage the reader to join the case study. It was anticipated as the first point of contact of thepublic therefore its main objective is to appeal to their sensibilities and move them to be part of theproject and drop their cellular phone waste on the bin. It consequently had to include the what,when, and where, as well as what the bin looked like (see Figure 8).
Since cellular phone batteries were the primary target collection items, the tagline of the posterbecame “Recycle your old cellphone batteries!” A second line, telling the consumer to “Drop yourold broken & decommissioned cellphone batteries, cellphones & chargers for recycling!”accommodates the other types of waste for collection. Initially the Case Study Team suggestedseveral catch phrases, such as “Your old cell, recycle it well!” to make it appealing to the youth,however the Technical Working Group opted for the most direct tag line. There was a consciouseffort to encourage the reader of the poster to join the project and look for the bins which werelocated at specific malls.
Similar to the interactive poster bins, the cellular phone items are brand neutral and the logos of theall study partners were printed and arranged in alphabetical order.
Another consideration on the design was the dimension of the poster which was consulted with themall partners, and approximated the A2 ISO 216 size, with a length of 23.64 inches and a width of15.75 inches.
There were 600 posters printed. These were distributed to partners for posting display in theirstores and offices. Posters were also deployed to other institutions such as schools and officeswhich were located near the three malls.

485
Figure 2.3-6 Campaign poster features
(3) Exhibit
The informative installation exhibit’s initial objective was to set up an exhibit on cellular phonecomponents, environmental impacts, recycling and the partners’ environmental programs andcorporate social responsibility activities to be displayed for a week at the malls. It was meant to putthe Cellular Phone Waste Collection Pilot Project into a higher perspective. However, since thiswas not possible, the case study team pursued the exhibit as a compact informative installation.Upon consultation with the Technical Working Group, the installation exhibited the product lifecycle of the cellular phone and accessories, its possible negative impacts when mixed with municipalwaste, and the proper methods of disposal and resource recovery.
The informative installation exhibit consists of 4 panels with collection bin as part of the installation.The installation measured 0.5 meters on each side and was 6 feet high, and was composed oftarpaulin posters attached to a wooden frame (Figure 2.3-7).
Figure 2.3-7 Informative installation set up and dimensions
Panel 1 shows the increasing number of cellular phone usage in the developing countries and cellularphone users in the Philippines. Panel 2 where the bin is attached is a decision tree showing theadvantages of recycling cellular phones, the end products as against throwing of cellular phonewaste as regular trash. Panel 3 details the composition of cellular phones as a complete packageor by component, i.e. cellular phone unit, battery and charger, while Panel 4 features the life cycle of

486
a cellular phone. The underlying rationale of the exhibit is the importance of increased consumerknowledge and understanding for a successful campaign. The contents of the four panels are shownin Figure 2.3-7.
The exhibit was deployed to the three malls the week of September 20. Greenhills Shopping Centerdisplayed the exhibit at the Cell Phone Tiangge Area and SM Megamall at the Cyberzone Area in the4th floor for the entire duration of the project.
Note that all IEC materials and the bin had the logos of all project partners.


488
(4) Seminar
The Case Study Team as part of the Cell phone Waste Collection Study planned to hold two types ofInformation, Education and Communication Sessions at the Greenhills Shopping Center, one for thetenants and the other for the technicians. Of the three sites, Greenhills has the highestconcentration of cell phone retain and repair shops, which number around 750 during the peakseason. These sessions aim to inform Greenhills tenants and technicians of the ongoing study on Cellphone Waste Collection with the end goal of making them understand the study and hopefullyencourage them to be active stakeholders not only in the study but in the Cell Phone WasteCollection and Recycling Process.
Although, the primary target of the project are the direct consumers or the population that purchasecell phones, we consider the tenants and technicians as critical partners because they deal with thedirect consumers and their main products are cell phones.
However the said seminars did not push through due to the busy schedule of the tenants who werepreparing for the holiday season. The team has turned over the materials to Greenhills ShoppingCenter in the event that they decide to conduct the seminar themselves.
22..33..66 LLaauunncchhiinngg aanndd CCaammppaaiiggnn PPrrooppeerr
The project was launched on September 14, 2007 at the Dusit Hotel through the signing of theMemorandum of Understanding between all the stakeholders. All the partners were present and theevent was covered by several broadsheets and government media agencies.
The posters and the bins were distributed before the launch and the partners were allowed to postand deploy the posters and bin on the day of the launch. Table 2.3-2 lists the types of areas these binswere placed and their distribution across the study sites, while Figure 2.3-9gives the spread of thesites across Metro Manila and the maps of their locations in the malls.
Table 2.3-2 Types of locations of bin distribution
Type of Location Glorietta-Greenbelt GreenhillsSM
MegamallDTI-BOI DENR Totals
Entrances/ Exits 3 3 6
Main Lobby 1 1 2
Corridors and activityareas
2 1 3
Cell phone shop areas/
technology hubs
1 3 1 5
Network Service Providers
Service Centers
2 2 4
Totals 6 6 6 1 1 20

489
Figure 2.3-9 Project sites and location maps of bins in the malls
22..33..77 MMoonniittoorriinngg aanndd CCoolllleeccttiioonn
Collection of cellular phone waste started on the launch date, September 14, 2007 and ran untilJanuary 9, 2008, which completed a 4-month collection period.
During this four month collection and monitoring period, the case study team visited each of the binson a weekly basis and documented the number of cellular phone waste categorized by type:
• whole units or major parts thereof
• plastic housings,
• cell phone batteries,
• chargers,
• accessories, and

490
• miscellaneous items such as CDs, leather casings, watches, zinc-carbon batteries, andothers.
On a monthly basis, the case study team sorted and weighed the consolidated cellular phone waste atthe mall level according to type. Batteries were further sorted according to the following types:
• Lithium ion (Li-ion)
• Lithium polymer (Li-polymer)
• Nickel Metal Hydride (Ni-MH)
• Nickel Cadmium (Ni-Cd)
• Lithium Nickel Hydride (Li-NH) and
• unknown batteries such as those with missing or unreadable labels
Cell phone waste types and the different battery were stored separately in plastic bags after weighing.Old units were ensured to be devoid of their batteries, and battery terminals were taped to preventunwanted reactions and short circuiting.
The cellular phone waste are gathered and stored in a temporary facility on a per need basis. Formalls which had high volume like Greenhills Shopping Center, the gathering and storing in thetemporary storage area provided by Greenhills Shopping Center. For Glorietta-Greenbelt and SMMegamall, the cellular phone waste were gathered and stored temporarily at theSAGIP-Environment Office. Figure 12 outlines the monitoring and collection protocol used in thecase study.
For the whole duration of the case study, the cellular phone waste collected was transported andstored in Laguna Facility HMR Envirocycle in three separate trips.

491
Figure 2.3-10. Monitoring and Collection Protocol22..44 OOuuttccoommeess aanndd AAnnaallyysseess
22..44..11 CCoolllleeccttiioonn DDaattaa aanndd RReessuullttss
The collection data were processed and analyzed using seven iterations:
• Collection volume per bin location, in number of pieces
• Total collection volume across sites, in number of pieces and weight
• Collection rate per site, in number of pieces
• Collection trends in the malls
• Cell phone waste distribution per site, in number of pieces
• Distribution of CP waste types in number of pieces and weight
• Distribution of battery types per site and per type, by weight
These iterations give insights on consumer participation and behavior, collection rates and trends,and the nature of waste collected.
(1) Collection volumes
1) Collection volumes per bin location
The amounts of collected waste vary across the different types of bin locations in the malls, asshown in Figure 2.4-1A-C. The most collected waste in across all of the sites was predictably theCell Phone “Tiangge” or “flee market” in the second floor of the Greenhills Shopping Center mainbuilding (Figure 2.4-1B). This is where almost all the cell phone retail and repair stalls are located.

492
These stalls, numbering almost 750 during peak season, could be as small as 1.2 x 1.2 meters in floorarea. During monitoring activities, it was discovered that the high collected volumes in these areasare not mainly due to customer or stall tenant participation, but were instead due to the janitors whowould deposit e-waste accumulated from the stalls. These wastes are sometimes given by the stallsbut more often than not these were still coming from mixed waste receptacles.
The collected volumes outside the Greenhills Cell Phone Tiangge area and those from other studysites would be more reflective of public participation to the project. For Glorietta-Greenbelt, highestparticipation was noted in the Activity Center (Figure 2.4-1A) while in SM Megamall, theentrances/exits and the Cyberzone bin yielded the highest collection (Figure 2.4-1C).
2) Total collection volumes across sites
Greenhills Shopping Center contributed the highest collection in terms of pieces and weight,comprising 82% and 62% respectively (Figure 2.4-2A-B).

493
5%
82%
1%2%
10%
AyalaGreenhillsSMGovt BdlgsService Centers
A:
Collection perPiece
22%
5% 11%
62%
Ayala
Greenhills
SM
Govt Bdlgs
B:
Collection byWeight (kg)
Figure 2.4-1 Collection volume per bin location
Collection per BinGlorietta and Greenbelt
8
83
19 2239 39
8
7
13
23
64
2513
22
36
36
10
18
43
4
24
46 3
13
2
0
50
100
150
200
250
DigitalExchange
ActivityCenter
Corridor Entrance/Exit
Entrance/Exit
Entrance/Exit
Pie
ces
ofR
ecyc
labl
es
AccessoriesWhole UnitsChargersHousingBatteries
ACollection per Bin
Greenhills Shopping Center
303 331182 109
1,7961,522
1,058
279
237
225
255
236
158
0
500
1,000
1,500
2,000
2,500
3,000
CP Shops CP Shops CP Shops V-mall SMART SUN
Pie
ces
ofR
ecyc
labl
es
AccessoriesWhole UnitsChargersHousingBatteries
BCollection per Bin
SM Megamall
126 139102
127
41
2
43
16
96
50
9752
16
1619
11 14
14
1
37
3
8
10
3
4
0
50
100
150
200
250
300
Cyberzone Entrance/Exit Entrance/Exit Entrance/Exit SMART SUN
Pie
ces
ofR
ecyc
labl
es
AccessoriesWhole UnitsChargersHousingBatteries
C


495
(2) Collection rates and trends
1) Collection rates per site
Figure 2.4-3A-F show the collection rates for each of the case study sites across the four monthcollection period. Running totals are kept during the weekly monitoring, however, after retrievaleach month, counting starts from zero.
Figure 2.3-3A shows that there was an upsurge in collection during the last two months for Gloriettaand Greenbelt, which coincided with the holiday season. Presumably during this time there are morevisitors who frequent the malls, and more participants who dispose of their old cell phone units andaccessories possibly due to future purchases of newer models.
There were high collection rates for the first two months at the Greenhills Shopping Center (Figure 2.3-3B) due to the cellular phone waste accumulated months before the case study started. It maybe surmised the collection rate for months 3 and 4 are the normal monthly volume. Note that thenumber of collected items from Greenhills reached close to three thousand pieces in both months 1and 2. The graphs cover only 4 bins, excluding the two bins located with the Network ServiceProvider Shops within the complex.
The collection rate at SM Megamall, was relatively constant throughout the four month study(Figure 2.3-3c). Similar to the Greenhills graph, this excludes the two bins located in the NSP shops.
No trend can be established for the Sun Shops and Smart Wireless Centers (Figure 2.3-3D), whilethe collection for the first months in the two government agencies was high (Figure 2.3-3E-F). Itmay be surmised that these service shops and government agencies have visitors who do notfrequent these locations, and while they may have seen the collection bins during one visit, they maynot have succeeding appointments for them to drop by and deposit their cell phone waste.

496
Figure 2.4-3 Collection Rates (# of pieces) per site
Glorietta - Greenbelt CP Waste (6 bins)
0
50
100
150
200
250
1 2 3 4
Week
Pie
ces
ofR
ecyc
labl
es
Month 1
Month 2
Month 3
Month 4
AGreenhills CP Waste (4 bins)
0
500
1000
1500
2000
2500
3000
1 2 3 4
Week
Pie
ces
ofR
ecyc
labl
es
Month 1Month 2Month 3Month 4
BSMMegamall (4bins)
0
50
100
150
200
250
300
350
1 2 3 4
Week
Pie
ces
ofR
ecyc
labl
es
Month 1Month 2Month 3Month 4
C
Service Shops
0
10
20
30
40
50
60
70
1 2 3 4 5 6 7 8 9 10 11 12 13 14 15 16
Week
Pie
ces
ofR
ecyc
labl
es
Smart GSCSun GSCSmart SMSun SM
DDTI-BOIRecyclables
0
10
20
30
40
50
60
70
80
1 2 3 4
WeekNo.
Qty
.ofR
ecyc
labl
es
Month1Month2Month3Month4
EDENRRecyclables
0
10
20
30
40
50
60
70
80
1 2 3 4
WeekNo.
Qty
.ofR
ecyc
labl
es
Month1Month2Month3Month4
F

497
2) Collection patterns in the malls
Participation was noticed to have an oscillating pattern throughout the collection period (Figure 2.3-4A-C). Collection rates are notably high during the first week, when the bins have just beenemptied of their contents. Participation dips during the middle of the month, but accelerates afterthe third week, when the bins are becoming full. Note also that in the first month, participation didnot take off until the second week, attributing to a gestation period in terms of public awareness.
This shows that visual access to the contents of the bin is an important feature that piques thecuriosity of passers-by and entices them to participate.
Figure 2.4-4 Collection patterns in malls
(3) Collected cell phone waste types
1) CP waste types per site
Chargers and batteries comprise the larger percentages of collection in Glorietta and Greenbelt,SM Megamall and the government agencies, however, plastic casings that were mostly obtained
C o lle c tio n T ren d sG lo rie tta -G re en b e lt
020406080
100120140
0 1 2 3 4
W e e k
Col
lect
ion
Rat
e(V
olum
e/T
ime) M onth 1
M onth 2M onth 3M onth 4
A
C o lle c tio n T re n d sG re e n h ills S h o p p in g C e n te r
0
2 0 0
4 0 0
6 0 0
8 0 0
1 ,0 0 0
1 ,2 0 0
1 ,4 0 0
0 1 2 3 4
W e e k
Col
lect
ion
Rat
e
(Vol
ume
/Tim
e)
M o n th 1M o n th 2M o n th 3M o n th 4
B
C o llec tio n T re n d sS M M eg am all
020406080
100120140160180
0 1 2 3 4
W e e k
Col
lect
ion
Rat
e(V
olum
e/T
ime)
M onth 1M onth 2M onth 3M onth 4
C

498
from the Greenhills bins comprised most of the collected waste in terms of number of pieces(Figure 2.3-5A-E).
2) CP waste types distribution of total collected volume
A total of 9,514 pieces of cell phone waste were collected during the 4-month study period. Interms of number of pieces, plastic housings comprised more than half of the volume (53%),indicating that these have the highest turnover and disposal rate (Figure 2.3-6A). Consumerswould often change the look of their cell phones by purchasing decorative housings.
In terms of weight, total collected volume amounted to 280.75 kilograms. Chargers constituted thehighest percentage in terms of weight (40%), followed by batteries, as shown in Figure 2.3-6B.The volume in terms of weight is significant for recyclables trade or disposal of these items sincemarket prices use this unit of measure. Hence the chargers may be bringing in the most significantvalue, but at the same time this could be offset by the disposal cost of the batteries which alsoregistered a significant percentage of total weight.
3) CP battery distribution per site and per type
More than half of the batteries were recovered from the Greenhills Shopping Center, while 27%were recovered from SM Megamall (Figure 2.3-7A). In terms of the battery types obtained, 58%were lithium based (Li-ion or Lipolymer), while nickel metal hydride (Ni-MH) batteriescomprised 31%. Nickel cadmium (Ni-Cd) batteries, considered to be the most hazardous,contributed 8% by weight of the total batteries. Half of the Ni-Cd were obtained from SMMegamall. Other batteries were of the more rare Li-NH type, while around 3% were unidentifiable(Figure 2.3-7B).

499
Figure 2.4-5 Cell phone waste types per site
CPWaste Types (pieces)Glorietta - Greenbelt
40%
7%
35%
11%
7%
BatteriesHousingChargersWhole UnitsAccessories
A
CPWaste Types(pieces)Greenhills13%
64%
11%
1%
11%
BatteriesHousingChargersWhole UnitsAccessories
B
CPWaste Types(pieces)SMMegamall
51%
7%
31%
6%5%
BatteriesHousingChargersWhole UnitsAccessories
C
DTI-BOI Percentage Composition(by piece)
43%
2%
38%
14%3%
BatteryHousingChargerUnitAccessories
D
DENR Percentage Composition(by piece)
40%
6%
45%
6% 3%
BatteryHousingChargerUnitAccessories
E

500 A:
Distributionper site
B:
Distributionper battery
type
27%
5% 11%
57%
Glorietta-GreenbeltGreenhills Shopping CtrSM MegamallGovernment Agencies
31%
8%
0%
3%
11%
47%
Li-ionLi polymerNi-MHNi-CdLi-NHUnknown
Figure 2.4-6 Cell phone waste type distribution
Figure 2.4-7 CP Battery distribution
A:
Collection perPiece
53%
15%
20%
2%10%
UnitHousingChargersBatteriesAccessories
Total # ofPieces:
9,514
40%
29%
2% 6%
23%
UnitsHousingChargersBatteriesAccessories
B:
Collection byWeight (kg)
TotalWeight:
280.75kg

501
22..44..22 RRaatteess,, VVaalluueess aanndd CCoossttss
(1) General collection rates
General collection rates for each type of cell phone waste were computed over the 16-week period.Table 2.4-1 presents the amount of each type in terms of pieces and weight, as well as the monthlyrates of collection. Considering collection rates at the current levels of effort, it would take 14 yearsto fill up one container van of mixed cell phone waste for possible exportation and treatment. Effortstherefore have to be increased at least ten-fold in terms of geographic distribution, number of bins,and publicity.
Table 2.4-1 Collection rates per CP waste typeCollection Volume Monthly Rate
Cell Phone Waste collected per Type # pcs wt in kg pcs/ month kg/month
CP Units 189 15.80 47.25 3.95
Housing 5,090 64.45 1,272.50 16.11
Chargers 1,440 112.60 360.00 28.15
Batteries 1,891 80.95 472.75 20.24
Accessories 904 6.95 226.00 1.74
All cell phone waste collected 9,514 280.75 2,378.50 70.19
Collection Period for 12 tonnes (one container van) 14 years
(2) Value of collected waste
The potential value of the collected waste was computed at two levels: the immediate value of thewaste sold as electronic and plastic scrap, and the potential added value if the cell phone unitsobtained will be dismantled to recover recyclable parts.
Table 2.4-2 summarizes the values that could be obtained from the collected waste during the casestudy. Current market prices were obtained from estimations given by HMR Envirocycle. Note thatbased on both market price and volume collected, chargers gave the highest value among thedifferent types of CP waste. Continued inclusion of other types of CP waste with recoverablematerials of high value, such as the copper wires from chargers, add to the sustainability of thecollection program.
Calculations on post-dismantling value were based on average percentagecompositions by weight of each cell phone component. These percentage compositions
were based on data obtained from HMR Envirocycle on the mass of the cell phonecomponents vis-à-vis the total mass of the phone. The total weights of each componentwere then computed based on the 189 phones amassed during the study period. Notethat these are theoretical values and were not based on actual weighing. Computations
are presented inTable 2.4-3.

502
Table 2.4-2 Potential value of CP waste collectedCP Units and Parts Totals
Parameter Phones Housing Chargers Batteries Accessories
Amount of collected waste(kg) 15.8 64.45 112.6 80.95 6.95 280.75
Buying Price per weight
(PhP/ kg) 2.50 3.00 8.00 2.50
Immediate Value ofCollected Waste (PhP) 39.5 193.35 900.80 0 17.375 1,151.03
Potential Post-dismantlingvalue (PhP)
based on materials that could be derived after cell phone unitdismantling using % by weight compositions from HMR Envirocycle 795.04
Total Value of Collected CP Waste (PhP) 1,946.06
Table 2.4-3 Potential post-dismantling value of CP units collected
Cell Phone ComponentsPercentageComposition
Average Mass
per Unitvalue/wt
Collected weight
From 189 unitsCollected Value
Unit of Measure (kg part/kg unit) kg/ phone PhP/kg kg PhP
Plastic 0.2966 0.0248 3.00 4.6859 14.05779
Keypad 0.0505 0.0042 0.7986
Rubber 0.0092 0.0008 0.1459
Screw 0.0097 0.0008 4.00 0.1540 0.615973
Speaker 0.0154 0.0013 2.50 0.2430 0.607591
Metal 0.0139 0.0012 4.00 0.2190 0.875848
Printed wiring board (PWB) 0.2465 0.0206 200.00 3.8944 778.8825
Liquid Crystal display (LCD) 0.0318 0.0027 0.5031
Battery 0.5058 0.0423 7.9921
Total 795.0397

503
Table 2.4-4 Potential dismantling and disposal cost of CP waste collectedParameter Price Unit Collected Amt Subtotal
dismantling cost (labor) 3.39 per phone 189 phones 639.84
treatment/ disposal cost:
LCD from units to be dismantled 22.50 per kilo 0.50 kg 11.32
treatment/ disposal cost: batteries 22.50 per kilo 80.95 kg 1,821.38
Potential Cost of Disposal (CP Waste from Case Study) 2,472.54
Total Value of Recyclables (CP Waste from Case Study) 1,946.06
Net Value -526.47
Table 2.4-5 Cost of publicity, collection, monitoring and transportationParameter Price Unit Qty Subtotal
Campaign posters cost 70.72 per pc 600 42,430.00
Exhibit installation cost 2,790.00 per pc 3 8,370.00
Collection bin cost 5,012.00 per pc 20 100,240.00
Monitoring cost (labor) 682.00 per man-day 56 38,192.00
Transportation cost 1,800.00 per round trip 3 5,400.00
Total Cost of Collection Efforts under the Case Study 194,632.00
(3) Cost of dismantling and disposal
The potential cost of dismantling and disposal were based on several assumptions:
• A skilled laborer with the proper equipment could dismantle one cell phone unit in fiveminutes;
• Minimum wage is set at PhP 325/ day;
• Disposal costs for LCDs and batteries would be PhP 22.50/ kilo;
• The amount of LCDs to be disposed are based on theoretical post-dismantling weights;
• The amount of batteries to be disposed are based on actual collected weights during the4-month study.
Table 2.4-4 shows the computations for potential expenses and compares it against the potentialvalue that could be obtained from the recovery of recyclables from the collected scrap. The costs fordismantling and disposal are higher than the expected market value of the cell phone waste collected

504
by around PhP 500. This difference is manageable and could be compensated by longer periods ofcollection, and increasing collection of high-value CP waste such as cell phone units and chargers.Furthermore, the value of the collected CP waste was only based on the market value of recoverablerecyclables. This did not yet consider the value of ecological and potential health benefits of properdisposal and waste diversion, which when taken into account, would greatly outweigh the incurredcost of disposal.
(4) Cost of case study execution
Capital outlay, such as the costs of IEC materials and bin production, as well as monitoring andtransportation costs, are summarized in Table 2.4-5. Of these expenditures, the most significant costwas the production of the bin. Note that this amount did not include other expenditures such as:
• Cost of meetings and coordination;
• Cost of pilot project launching ceremonies;
• Final prepping of the bin (printing and mounting of the interactive poster and stickers,costs of anti-slip mats, foams and keys); and
• Transportation costs for bin and informative installation deployment.
While capital outlay may seem costly, it must be considered that this case study was an investmenttowards establishing baseline data and public receptiveness to such a collection scheme towardspolicy formulation and fine-tuning for future programs. Given the small scale, bin fabrication andposter printing costs have higher unit prices. For succeeding collection programs, costs for collection,monitoring and transportation could be decreased by:
• Ordering collection bins in larger bulk numbers to decrease unit cost by about 10%;
• Limiting data gathering activities to monthly sorting and weighing which does not needtechnical expertise, thereby reducing professional fees and number of man-days;
• Providing sufficient storage space at the mall level to maximize vehicle’s 4-tonne capacityand to reduce number of trips by HMR Envirocycle;
• Coinciding pull-out of cell phone waste during Waste Markets held at the malls withHMR Envirocycle as participating recycler; and
• Increasing counterparts from the Cell Phone Industry such as involvement in publicitycampaigns
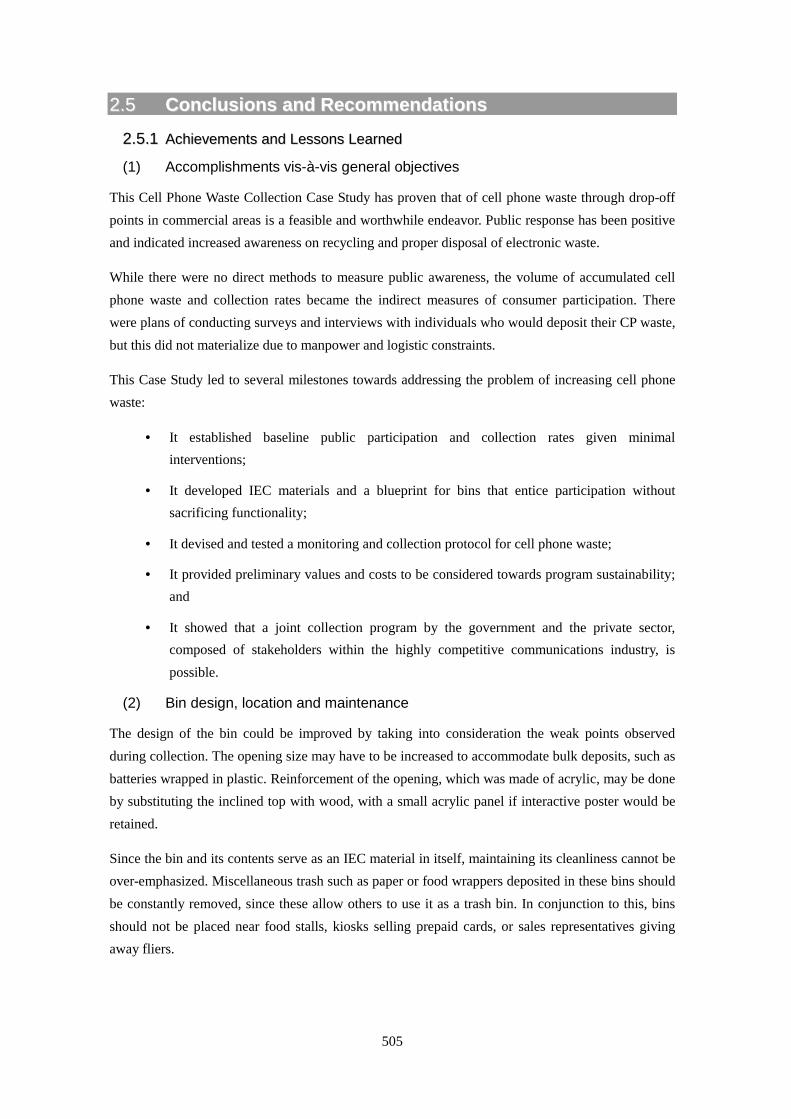
505
22..55 CCoonncclluussiioonnss aanndd RReeccoommmmeennddaattiioonnss
22..55..11 AAcchhiieevveemmeennttss aanndd LLeessssoonnss LLeeaarrnneedd
(1) Accomplishments vis-à-vis general objectives
This Cell Phone Waste Collection Case Study has proven that of cell phone waste through drop-offpoints in commercial areas is a feasible and worthwhile endeavor. Public response has been positiveand indicated increased awareness on recycling and proper disposal of electronic waste.
While there were no direct methods to measure public awareness, the volume of accumulated cellphone waste and collection rates became the indirect measures of consumer participation. Therewere plans of conducting surveys and interviews with individuals who would deposit their CP waste,but this did not materialize due to manpower and logistic constraints.
This Case Study led to several milestones towards addressing the problem of increasing cell phonewaste:
• It established baseline public participation and collection rates given minimalinterventions;
• It developed IEC materials and a blueprint for bins that entice participation withoutsacrificing functionality;
• It devised and tested a monitoring and collection protocol for cell phone waste;
• It provided preliminary values and costs to be considered towards program sustainability;and
• It showed that a joint collection program by the government and the private sector,composed of stakeholders within the highly competitive communications industry, ispossible.
(2) Bin design, location and maintenance
The design of the bin could be improved by taking into consideration the weak points observedduring collection. The opening size may have to be increased to accommodate bulk deposits, such asbatteries wrapped in plastic. Reinforcement of the opening, which was made of acrylic, may be doneby substituting the inclined top with wood, with a small acrylic panel if interactive poster would beretained.
Since the bin and its contents serve as an IEC material in itself, maintaining its cleanliness cannot beover-emphasized. Miscellaneous trash such as paper or food wrappers deposited in these bins shouldbe constantly removed, since these allow others to use it as a trash bin. In conjunction to this, binsshould not be placed near food stalls, kiosks selling prepaid cards, or sales representatives givingaway fliers.

506
(3) Establishments with high concentration of cell phone shops
IEC activities for cell phone retailers and repair technicians should be a pursued in future collectionprojects. Considering that majority of the gathered waste were sourced from these shops but weredeposited by mall maintenance crew, true segregation at source would entail the formers’ activeparticipation.
A different approach may be necessary for establishments with high concentrations of retail andrepair shops. The interventions by mall management with respect to involvement of maintenancecrew could be extended to their tenants through, for instance, requisite seminars on wastemanagement prior to providing or renewing leases. Collection protocols and standard operatingprocedures for e-waste management should be in place for stalls and maintenance crew. In thiscontext, bins would have to be redesigned to have larger capacities, and the interactive features toattract passers-by (i.e. the poster, chute, and acrylic panels), would not be necessary.
22..55..22 PPrroojjeecctt CCoonnttiinnuuiittyy
During the last Technical Working Group meeting, it was agreed upon that cell phone wastecollection will continue after this case study, spearheaded by the participating malls in coordinationwith HMR Envirocycle. This will cover the same types of cell phone wastes, since sustainabilitywould be dependent on recoverable recyclables to offset disposal of batteries. It will now includeother branches, increasing the geographic coverage to include northern and southern Metro Manila,where residential areas are concentrated.
The cell phone and telecommunications industry players will continuously be involved through anad-hoc committee that will meet regularly with the Steering Committee, which will still be chairedby DTI-BOI, for policy discussions and possible formation of a recycling association for cell phonewaste, similar to existing associations for traditional recyclables such as paper, plastics, metal andglass. Current take-back programs will be continued and collection data would be accessible to thecommittee.
22..55..33 RReeccoommmmeennddaattiioonnss aanndd FFuuttuurree CChhaalllleennggeess
(1) Insights for policy
Increased involvement of the cell phone manufacturers in addressing the waste produced by theindustry would be an ideal approach consistent with the Extended Producer Responsibility (EPR)principle. While there are a few take-back programs being conducted by individual manufacturerslocally in consolidation with international corporate social responsibility policies, the impact of theseprograms is still to be felt.
A major difficulty in tackling proper cell phone waste disposal would be the inclusion of so-called“gray” items, such as generic/ competition/imitation cell phone units, batteries, chargers andaccessories, which dominate the market. Major manufacturers cannot be held responsible forproducts that do not carry their legitimate brand name. This would be where government and anindustry-based recycling committee should step in. The Case Study Team believes that the
507
Network Service Providers should also be tapped, since while consumers may not necessarilypurchase cell phone items of any major manufacturer, they are definitely subscribers of one of thethree Networks. They are also Filipino-owned or Philippine-based corporations, which wouldfacilitate decision making and program implementation.
The formation of an industry-based recycling association would admittedly take time and possibly apolicy push to be realized. Firstly, local definitions and criteria of electronic waste with respect tohazardous and special waste have to be spelled out. Mechanics of collection, operational cost sharing,and disposal protocols would have to be established and agreed upon by the members. Differentcollection strategies, from regulatory, mandatory to voluntary approaches, should also be explored.As mentioned previously, there may be a need to develop guidelines for commercial establishmentswith a high number of cell phone shops, or electronic shops for that matter, to handle the e-wastegenerated.
22..55..44 EExxppaannddiinngg ppuubblliicciittyy eeffffoorrttss
The reach of the publicity materials in the case study was limited mainly to customers who frequentthe malls where the bins were deployed. Connecting with the waste generators at the household levelcould be achieved by print and broadcast media, capitalizing on the momentum established by thepilot project. Adequate funds should be allocated for these publicity efforts, with possible financialsupport from Industry. Other untapped resources and strategies could be explored; for instancemarketing events such as concerts, product launches and promotions could be used as venues for cellphone waste collection programs.
22..55..55 RReesseeaarrcchh oonn cceellll pphhoonnee wwaassttee ccoommppoossiittiioonn
Much information can still be obtained from the cell phone waste collected under this case study.The CP waste could be sorted further in terms of original vs. imitation batteries or units, and theidentification of the chemical make-up of these imitation batteries. Items could also be profiledaccording to brand, make or material type. Old cell phone units could also be dismantled to studytheir components and material composition. Further studies in this direction would providetechnical teeth to policy formulation.

3. Case Study III
33..11 PPIILLOOTT PPRROOJJEECCTT OONN MMOOBBIILLEE PPLLAASSTTIICC CCOOLLLLEECCTTIIOONNAANNDD RREECCYYCCLLIINNGG
33..11..11 BBaacckkggrroouunndd ooff tthhee PPrroojjeecctt
The Study on Recycling Industry Development in the Philippines, which the Department of Tradeand Industry, through the Board of Investments, is undertaking with technical assistance from theJapan International Cooperation Agency (JICA) aims to formulate a Master Plan and Action Plan todevelop the Philippine recycling industry in line with Republic Act 9003 or the Ecological SolidWaste Management Act of 2000.
In line with the Study, the JICA Study Team and DTI-BOI, in coordination with relevant governmentagencies and the private sector, identified pilot projects to test the viability of recycling guidelinesfor plastics, paper, glass bottles, metals and electronic wastes as well as prepare Information andEducation Campaign (IEC) materials to promote awareness on recycling.
The Philippine Plastics Industry Association, Inc. (PPIA), a non-stock, non-profit industryassociation, with office address at 122 A. Del Mundo St., between 10th and 11th Avenues, Grace Park,Caloocan City, was engaged by Japan International Cooperation Agency (JICA), through EXCorporation, on 29 June 2007 to implement a six-month pilot project entitled “Mobile PlasticCollection and Recycling”.
33..11..22 PPrroojjeecctt OObbjjeeccttiivveess
The objective of this project is to enhance the recycling rate of plastics with focus on “plastic bags”through a mobile plastic collection and recycling approach and establish a mechanism foroperational sustainability.

509
33..11..33 PPrroojjeecctt CCoonncceepptt
(1) With the emergence of recyclers of post-consumer plastic bags and films, thereis a need to link up the generators of scrap plastics especially post-consumerplastic bags with the recyclers to develop a recycling market and to significantlyreduce the volume of residual wastes.
(2) The Mobile Plastic Collection/ Recycling Project will serve as a showcase of thepresent capabilities for recycling plastic scraps and to increase awareness onthe proper handling of waste plastics as prescribed in the Recycling Guidelinesto increase their recovery and recycling.
(3) The project involves the lease of a modified truck equipped with:
• Plastic Melting Oven and Grinder for processing on-site the plastic sando bags and PSscrap (only when collected recyclables are contaminated)
Figure 3.1-1 Mobile Plastic Recycling Truck
• Bins for carrying plastic recyclables and to serve as visual aids for barangays,households and schools that such plastic types are being collected and recycled. Thebins are segregated into:
1) Polyethylene Terepthalate (PET)
2) Polyethylene Rigids (PE Rigids)
3) Polyethylene Flexibles (PE Flexibles)
4) Polypropylene (PP)

510
5) Polystyrene (Foam PS, EPS)
Figure 3.1-2 Segregation Bins
33..11..11 TThhee ssppeecciiffiiccaattiioonnss ooff tthhee MMeellttiinngg OOvveenn aarree aass ffoolllloowwss::
• Made of Steel casserole with cover, double jacketed body and LPG fired withthree-line burner.
• It has a melting capacity of 50 kgs per batch of 1 to 1.5 hours.
• A cylindrical steel downspout is added to facilitate the discharge of melted wasteplastic sando bags during casting into the metal molds.
• The chimney is installed with scrubber containing NaOH to absorb smoke emissionduring melting.
• A motorized blunger is installed for homogeneous mixing.
• The temperature recorder measures the melting temperature
33..11..22 PPrroocceessss ddeessccrriippttiioonn ffoorr tthhee MMeellttiinngg OOvveenn::
• Molded functional products were produced by melting the collected post consumerwaste plastic sando bags in a preheated used cooking oil at 150 to 200oC for one to 1.5hours using the fabricated portable melting unit.
• Melting 1 part (by weight) of waste plastic sando bags into 1 part (by weight) usedcooking oil was found most suitable.

511
33..11..33 PPrroodduuccttss mmaannuuffaaccttuurreedd ffrroomm tthhee MMeellttiinngg OOvveenn::
• The resulting molten waste plastic sando bags is easily molded by casting andconverted into final products in the metal molds which displayed potential uses fortabletops, planters, catwalk/paving blocks and other valuable functional products
•
Figure 3.1-3 Plastic Melting Oven
33..11..44 TTaarrggeett PPllaassttiiccss
While PPIA encourages thesegregation of plasticrecyclables covered under therecycling guidelines, we onlytargeted Polyethylene andPolypropylene Films and Bags(PE/PP films and bags) andFoam Polystyrene (Foam PS)in our dispatch and collectionefforts as the other plasticrecyclables have existingrecycling markets.
Figure 3.1-4 DensificationProcess

512
33..11..55 PPllaassttiicc BBaagg RReeccyycclliinngg
There are recyclers of plastic film bags located in Metro Manila. These firms either source theirraw materials from post-industrial plastic films from bag manufacturers or post-consumer bags fromdumpsite and other sources.
Types of Plastic Bags Examples
High Density Polyethylene (HDPE) grocery, wet market bags or sando bags, and trash bags
Low Density Polyethylene (LDPE) Bags for sugar, rice, toys, shopping bags in departmentstores
Polypropylene (PP) packaging for T-shirt or clothing
Post-industrial plastic films particularly those made into plastic bags are 100% being recycled orconverted anew into pellets. Once recycled, films can be used to manufacture a variety of products.For example, it is used in applications, such as trash bags and construction films. It is also used inhousehold products, like garbage cans, wastebaskets and recycling bins.
Recyclers accept post-consumer plastic bags from LGUs as long as they can collect by the truckloador at least 500 kilos per hauling on a regular basis. Payatas junkshops currently supply theserecyclers.
For purposes of this study, PPIA partnered with the Metro Plastic Recycling Association, Inc.(MPRAI) for the recycling of plastic bags collected from the plastic sites. MPRAI cooperated byway of accepting non-commercial quantities of post-consumer plastic bags from the pilot sites.
There is a lot of potential for developing the recycling market for post-consumer plastic bags inMetro Manila which requires the cooperation by LGUs cascading to the barangays and thehouseholds.
By collecting the recyclables from the households, they not only reduce the volume of waste goingto the dumpsite but also derive income from trading additional recyclables with the junk shopoperators.
Recyclable materials sorted at source and kept clean and dry sell higher than when they are stainedby garbage. This becomes an incentive for the Eco-aides to teach households to properly segregateand/or even clean the recyclables themselves.
33..11..66 FFooaamm PPoollyyssttyyrreennee RReeccyycclliinngg
Foam PS is currently sourced directly from fast food restaurants. PPIA is currently linking up with

513
Polystyrene Packaging Council of the Philippines (PPCP) for the processing of Foam PS.
33..11..77 OOppeerraattiioonnaall FFrraammeewwoorrkk
(1) PPIA coordinates with the National Solid Waste Management CommissionSecretariat and LGU Solid Waste Management Offices in theimplementation of this project.
(2) The project has a two-fold approach:
1) First, promote the proper segregation by the households of plastic recyclables
including plastic bags and Foam PS following the established recycling
guidelines at the household level with the cooperation of Barangay eco-aides.
2) Second, link-up the barangays and schools with plastic recyclers for the
collection of post-consumer plastic bags and Foam PS
(3) PPIA will only process the plastic bags and Foam PS through the melting ovenin the event that the collected wastes are contaminated.
(4) Barangays and schools shall be given incentives to increase collection andsegregation of plastics. For barangays and schools, PPIA shall donateplastic trash bags for every kilo of plastic bags or Foam PS collected. Forschools, PPIA shall install special standing bins to be strategically locatedinside schools as drop off points for plastic bags and foam PS. PPIA shallalso install plastic drums (120 liter) for temporary storage of target scrapsinside the school MRFs.
33..11..88 SSiittee SSeelleeccttiioonn CCrriitteerriiaa
The efforts of households in the barangays play a significant role in the recycling activities as theireffort to segregate and properly handle recyclable materials will greatly affect the efficiency of scrapdealers and recyclers.
PPIA encouraged barangays to cascade to the households the segregation and inclusion of plasticbags and Foam PS as part of their recyclables.
Barangays, on the other hand, may encourage buyers and junk shop dealers of plastic recyclables(especially PET, and rigid PE/ PP post consumer waste) to accept the collected plastic “sando” bagsand take the responsibility in delivering the same to the recyclers. For barangays to sell therecyclables at a higher value, they may choose to deliver the waste plastic bags directly to therecycler. Thus, the project’s priority is for the recyclables to end up with the recyclers.

514
(1) Criteria for Barangays:
PPIA, in consultation with the Solid Waste Management Offices of the Cities of Caloocan, Quezonand Valenzuela and the National Solid Waste Management Commission (NSWMC) Secretariat,arrived at the following criteria for selection:
1) Must have an operational Material Recovery Facility (MRF) with an
established network with junk shop operators.
2) Has a record of plastic recyclables collected and traded
3) Located near Barangays which makes clustering possible
For purposes of studying the effectivity of the criteria, PPIA chose LGUs with different levels ofMRF operation.
Table 3.1-1 Pilot LGUsCriteria LGU Coordinator Pilot Sites
Operational MRF
Quezon City
Quezon CityEnvironmental Protection& Waste ManagementDepartment
- 4 Barangays
Semi-operationalMRF
Caloocan City
Environmental SanitationServices (ESS), CaloocanCity
- 1 Cluster of 4Barangays
- 1 Cluster of 6Barangays
No MRF
Valenzuela City
Waste ManagementOffice, Valenzuela City
- 1 Barangay
(2) Criteria for Schools:
Pilot schools must have a staging area for collected plastic bag and Foam PS prior to pick-up byPPIA. Upon the recommendation by the QC EPWMD, and in consultation with the NSWMCSecretariat, PPIA selected Miriam College and Claret School of Quezon City as pilot sites.

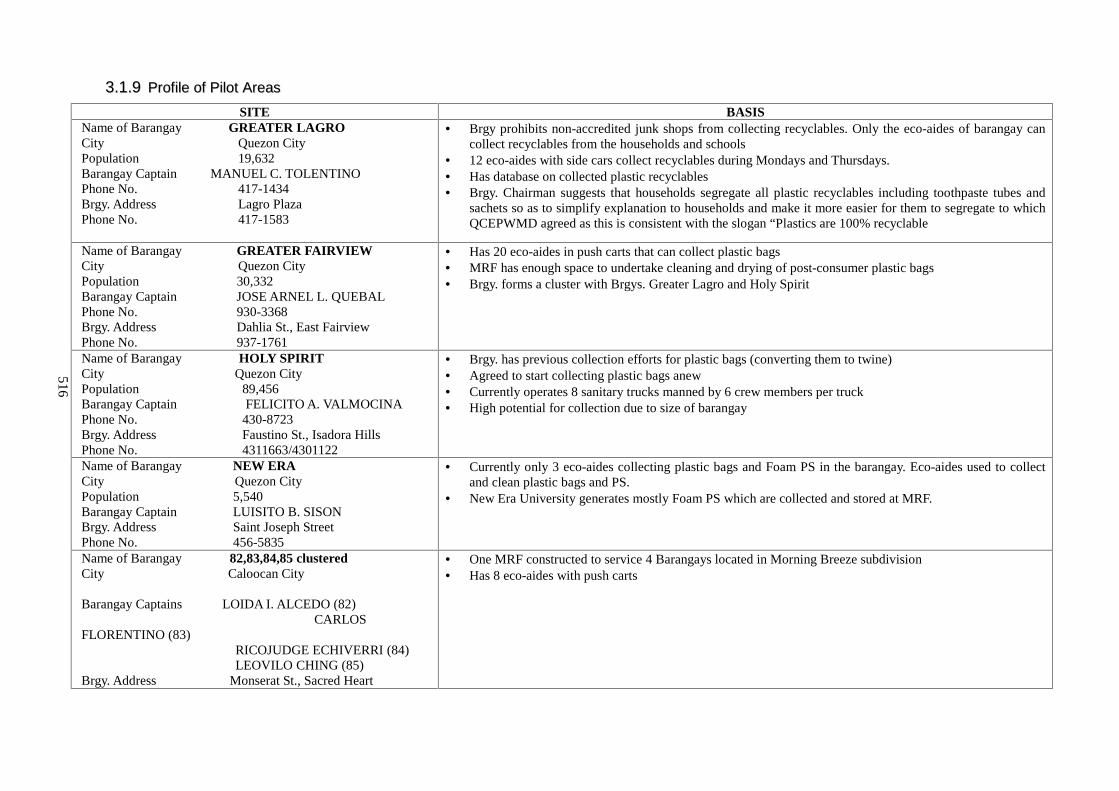
516
33..11..99 PPrrooffiillee ooff PPiilloott AArreeaassSITE BASIS
Name of Barangay GREATER LAGROCity Quezon CityPopulation 19,632Barangay Captain MANUEL C. TOLENTINOPhone No. 417-1434Brgy. Address Lagro PlazaPhone No. 417-1583
• Brgy prohibits non-accredited junk shops from collecting recyclables. Only the eco-aides of barangay cancollect recyclables from the households and schools
• 12 eco-aides with side cars collect recyclables during Mondays and Thursdays.• Has database on collected plastic recyclables• Brgy. Chairman suggests that households segregate all plastic recyclables including toothpaste tubes and
sachets so as to simplify explanation to households and make it more easier for them to segregate to whichQCEPWMD agreed as this is consistent with the slogan “Plastics are 100% recyclable
Name of Barangay GREATER FAIRVIEWCity Quezon CityPopulation 30,332Barangay Captain JOSE ARNEL L. QUEBALPhone No. 930-3368Brgy. Address Dahlia St., East FairviewPhone No. 937-1761
• Has 20 eco-aides in push carts that can collect plastic bags• MRF has enough space to undertake cleaning and drying of post-consumer plastic bags• Brgy. forms a cluster with Brgys. Greater Lagro and Holy Spirit
Name of Barangay HOLY SPIRITCity Quezon CityPopulation 89,456Barangay Captain FELICITO A. VALMOCINAPhone No. 430-8723Brgy. Address Faustino St., Isadora HillsPhone No. 4311663/4301122
• Brgy. has previous collection efforts for plastic bags (converting them to twine)• Agreed to start collecting plastic bags anew• Currently operates 8 sanitary trucks manned by 6 crew members per truck• High potential for collection due to size of barangay
Name of Barangay NEW ERACity Quezon CityPopulation 5,540Barangay Captain LUISITO B. SISONBrgy. Address Saint Joseph StreetPhone No. 456-5835
• Currently only 3 eco-aides collecting plastic bags and Foam PS in the barangay. Eco-aides used to collectand clean plastic bags and PS.
• New Era University generates mostly Foam PS which are collected and stored at MRF.
Name of Barangay 82,83,84,85 clusteredCity Caloocan City
Barangay Captains LOIDA I. ALCEDO (82)CARLOS
FLORENTINO (83)RICOJUDGE ECHIVERRI (84)LEOVILO CHING (85)
Brgy. Address Monserat St., Sacred Heart
• One MRF constructed to service 4 Barangays located in Morning Breeze subdivision• Has 8 eco-aides with push carts

517
SITE BASISParish
Name of Barangay 126,127,128,129,130,131 clusteredCity Caloocan CityBarangay Captains FERNANDO ENRIQUEZ (126)
JOSEFINO A. MIRANDA (127)ORLANDO M. GUARINO (128)RODOLFO SANGALANG (129)RAMON P. DOMINGO (130)RICARDO LIZARONDO (131)
Brgy. Address Tagaytay St., Caloocan City
• 6 Barangays clustered on the basis of proximity situated along Tagaytay and Binhagan Streets in CaloocanCity
• Each barangay deputizes 1 recyclables collector in push carts• Collected plastic bags are immediately transferred to MRF of Brgy. 82-85 cluster due to space limitation
Name of Barangay MARULASCity Valenzuela CityBarangay Captain MICHAELITO BENOZA
• Valenzuela Waste Management Office (WMO) suggested Barangay Marulas as a pilot project consideringthat the Valenzuela Ecology Center is located there and can serve as a staging area of the collected plasticbags.
Table 3.1-2 SITE SELECTION: SCHOOLSSITE BASIS
MIRIAM COLLEGEDr. Patricia Licuanan, PhD.PresidentKatipunan Road, Loyola HeightsQuezon City 1108Tel No. 580-5400 o 29
• 9,000 students and 800 employees• MRF segregates PP plastic cups, PET bottles, aluminum cans, paper and EPS• Melting oven (2nd generation) is currently used for demo purposes only.
CLARET SCHOOL OF QUEZON CITYRev. Fr. SALVADOR G. AGUALADA JR., CMFSchool DirectorMahinhin St., UP VillageDiliman, Quezon CityTel No. 921-8136
• 4,500 students and 350 employees• Claret’s MRF sells recyclables to junkshop in Payatas. MRF is manned by 2 utility men from Payatas
junk shop.• Getting the students to donate their used plastic bags will require clearance from school administration. Mr.
De Lima agreed to push the Pilot Project with the school admin.

518
33..22 OOppeerraattiioonnaall PPrroocceedduurreePPIA developed an operating procedure for the dispatch and collection of the Mobile Truck whichaccompanied the MOA signed with pilot sites. PPIA evaluates the quality of recyclables whetherthey are in conformance with recycling guidelines. If in conformance with recycling guidelines,PPIA was supposed to contact the recycler for pick-up from PPIA. However, in actual operation,PPIA delivered the recyclables to the recycler after collecting from the pilot sites.
In the three (3) months of implementation, the plastic bags and Foam PS collected from the pilotsites were all found to be in conformance with the recycling guidelines and thus, were delivered tothe recycler instead of processing on-site through the melting machine.
Figure 3.2-1 Process Flowchart

519
At Brgy. Greater Lagro, Holy Spirit and New Era plastic bags were already clean when given to theBrgy. Eco-aides but in Brgy. Greater Fairview, there were instances that Eco-aides have to clean anddry the plastic bags.
In Caloocan, plastic bags picked up from households were already clean.
Lack of awareness and discipline at the household level remains an issue in the implementation ofthe project.
33..33 MMOOAA wwiitthh BBaarraannggaayyssPPIA entered into a Memoranda of Agreement with the pilot sites in time for the formal launch ofthe pilot project scheduled on 14 September 2007.
In Quezon City, PPIA signed MOAs with QC EPWMD, Brgys. Greater Fairview, Greater Lagro,Holy Spirit and New Era.
In Caloocan, PPIA had informal agreements with Caloocan ESS and the 2 Barangay clusters in lieuof the MOA pending with the Office of the Mayor.
In Valenzuela City, the PPIA MOA with the Office of the Mayor and Brgy. Marulas were shelveddue to the barangay elections. The previous council of Brgy. Marulas favorably endorsed the projectto the Brgy. Chairman, however, he was eventually defeated during the elections.
Figure 3.3-1 PPIA MOA Signing with Pilot Sites
QC Environmental Protection & Waste Mgmt.
Brgy. Greater Fairview
BBrrggyy.. HHoollyy SSppiirriitt
Brgy. Greater Lagro

520
Under the MOA executed with Barangays the following are the corresponding roles of Barangaysand PPIA.
33..33..11 RRoollee ooff BBaarraannggaayyss::
o Conduct a house-to-house Information and Education Campaign on the properhandling of plastic recyclables including plastic bags and Foam Polystyrene (PS);
o Collect recyclables and store inside the Material Recovery Facility (MRF) until thepreferred volume for collection are reached. The preferred volume for the collectionof plastic bags and Foam PS are 25 kilograms each bundled in such weight;
o Record all collected plastic recyclables before discharging to junk shops; and
o Contact PPIA for the collected plastic sando bags and foam PS during the pilotproject and eventually make arrangements with the existing accredited junk shopsor plastic recyclable dealers operating within the area.
33..33..22 RRoollee ooff PPPPIIAA::
o Conduct an orientation on the Guidelines on Proper Handling of PlasticRecyclables and provide IEC materials (e.g. leaflets, etc.) to eco-aides;
o Schedule and dispatch the PPIA Mobile Plastic Recycling and Collection Truck tothe respective barangay upon its advise when the preferred volume for collectionare reached; and
o Operate the melting oven only when deemed necessary.
33..33..33 MMOOAA wwiitthh SScchhoooollss
PPIA met with Miriam College and Claret School of Quezon City to formalize the partnershipon the implementation of the pilot project. The outcome is as follows:

521
Table 3.3-1 Status of Pilot SchoolsPILOT SCHOOL STATUS
MIRIAM CO LLEGE - MOA signed on 6 November 2007 contains the ff.features:
- Conduct of Orientation for school personnel
- PPIA donated 5 Glutton bins for the ff academic units:
- Grade School
- High School
- College Building
- Child Study Center
- Southeast Asian Institute of the Deaf
- PPIA donated 3 drums for the MRF
- Provision of paper for 3,000 letters to parents
- Collection of Plastic bags is 28 kgs. and Foam PS is 49kgs.
CLARET SCHOOL OFQUEZON CITY
- Existing informal agreement with Schooladministration
- School’s collection of plastic bags generated inside thecampus started on September 3rd
- PPIA donated 3 Glutton bins and 2 drums to furtherpromote collection
- Total plastic bag collected as of 11 Dec is 196.5 kgs.
33..44 IInnffoorrmmaattiioonn aanndd EEdduuccaattiioonn CCaammppaaiiggnn
33..44..11 FFllyyeerrss PPrroommoottiinngg tthhee RReeccyycclliinngg GGuuiiddeelliinneess
PPIA developed a flyer informing the households on the various types of plastic recyclables andencouraging them to properly segregate.
During the orientation meeting with eco-aides, we emphasized that recyclable materials sorted atsource and kept clean and dry sell higher than when they are stained by garbage. This becomes anincentive for the Eco-aides to teach households to properly segregate and/or even clean therecyclables themselves.

522
Figure 3.4-1 PPIA IEC Flyer
33..44..22 OOrriieennttaattiioonn MMeeeettiinnggss wwiitthh BBaarraannggaayy EEccoo--aaiiddeess
PPIA conducted orientation meetings with Brgy. eco-aides on Sept 19, 2007 in Quezon City and Sept25, 2007 in Caloocan City. The presentation was conducted in Tagalog, the local vernacular, so asto explain the project concept in a simple language to the eco-aides.
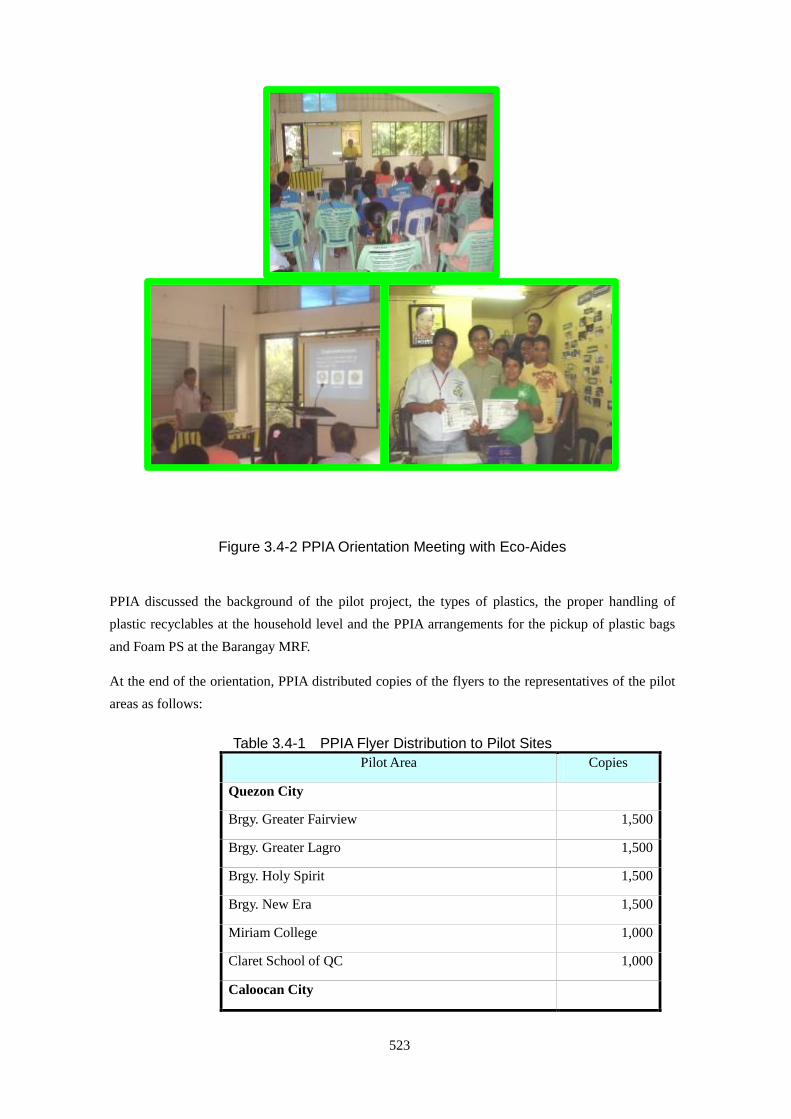
523
Figure 3.4-2 PPIA Orientation Meeting with Eco-Aides
PPIA discussed the background of the pilot project, the types of plastics, the proper handling ofplastic recyclables at the household level and the PPIA arrangements for the pickup of plastic bagsand Foam PS at the Barangay MRF.
At the end of the orientation, PPIA distributed copies of the flyers to the representatives of the pilotareas as follows:
Table 3.4-1 PPIA Flyer Distribution to Pilot SitesPilot Area Copies
Quezon City
Brgy. Greater Fairview 1,500
Brgy. Greater Lagro 1,500
Brgy. Holy Spirit 1,500
Brgy. New Era 1,500
Miriam College 1,000
Claret School of QC 1,000
Caloocan City

524
Brgy. 82-85 Cluster 1,000
Brgy. 126-131Cluster 1,000
Total 20,000
33..44..33 TToouurr ooff PPllaassttiicc RReeccyycclliinngg PPllaannttss
PPIA organized a plant tour for QC EPWMD, Caloocan ESS and pilot barangays and schools of twoplastic recycling facilities in Valenzuela City on 19 December 2007 namely:
Ø Plastic Bag Recycling
Phil-Ecoplast Recycling Industries Company, Inc.
1150 Oliveros Cmpd., F. Bautista St., Ugong, Valenzuela City
Ø Rigid Plastics Recycling
New Foundland Plastic Manufacturing Corp.
#73 B. Maysan Rd., Valenzuela City
The purpose of the plant visit is to provide the barangays with an appreciation of the actual recyclingprocess for plastic scraps especially the plastic bags which are the target recyclables in our project.
This activity was likewise intended to strengthen the link-up between the barangays and therecyclers in order to make the project sustainable and continue beyond the project schedule.
33..44..44 RRaaddiioo PPlluuggggiinngg ffoorr tthhee PPiilloott PPrroojjeecctt
PPIA held two radio plugs for the pilot project on November 17 and 24, 2007 at DZXL RadioMindanao Network hosted by Ariel Fernandez. The topic of the discussion is Plastic Recyclables asLivelihood for Barangays. PPIA was headed by Ms. Mary G. Ng, PPIA president; Crispian Lao,PPIA vice president; Benson Tang, MPRAI president; Alfred Chan, Commissioner NSWMC andMark Delumen, PPIA Secretariat. Two representatives from the barangays were Brgy. ChairmanRommel L. Carreon, Brgy. 738, Zone 80 (San Andres, Manila) and Brgy. Chairman Rodolfo G. Peña,Brgy. 699, Zone 76 (Malate, Manila).
33..44..55 PPooiinntt--RReewwaarrdd SSyysstteemm
As an incentive to barangays and schools, PPIA rewards them a packof trash bags (25 pcs.) for every 25 kilo of collected plastic bags andFoam PS.

525
This barter system is well-received by the pilot areas. The trash bags are made from 100% recycledHDPE material sourced from the pilot sites.
33..55 DDiissppaattcchh aanndd CCoolllleeccttiioonn SSttaattuussAs of 15 January 2008, PPIA diverted a total of 1,206.81 kilograms of plastic bags and 46 kilogramsof scrap PS coming from Quezon City and Caloocan City.
Plastic bags collected per Barangay are pre-weighted in the Barangay MRF and recorded in the PPIATruck Collection Logbook and duly countersigned by a Barangay representative. Once this isbrought to Phil-Ecoplast Recycling Industries Company, Inc., the plastic bag recycling plant, locatedin Ugong, Valenzuela City, it is again weighed for verification and thus, we use the net weight asreported to us by Phil-Ecoplast Recycling Industries Company, Inc.
Table 3.5-1 Waste Diversion as of 15 January 2008
BRGY/SCHOOL CollectionDate LGU
Scrap PlasticBag (Kgs.)
ScrapFoam PS
(Kgs.)
1 Brgy. 82-85 Cluster 8-Oct-07 CAL 62.00
2 Brgy. 126-131 Cluster 8-Oct-07 CAL 24.00
3 Brgy. Greater Lagro 16-Oct-07 QC 42.00
4 Brgy. Greater Fairview 16-Oct-07 QC 40.00
5 Brgy. Holy Spirit 16-Oct-07 QC 15.00
6 Brgy. South Triangle c/o Brgy.Holy Spirit
16-Oct-07 QC 55.00
7 Brgy. 82-85 Cluster 23-Oct-07 CAL 20.00
8 Claret School of QC 13-Nov-07 QC 75.00
9 Brgy. New Era 13-Nov-07 QC 4.50 21.00
10 Brgy. Holy Spirit 13-Nov-07 QC 19.00
11 Brgy. Greater Fairview 13-Nov-07 QC 166.00
12 Brgy. 82-85 Cluster 14-Nov-07 QC 61.36
13 Brgy. 126-131 Cluster 14-Nov-07 CAL 36.95
14 Brgy. 82-85 Cluster 10-Dec-07 CAL 48.00
15 Brgy. Greater Fairview 11-Dec-07 QC 158.50
16 Brgy. New Era 11-Dec-07 QC 5.00 25.00
17 Miriam College 11-Dec-07 QC 11.00
18 Claret School of QC 11-Dec-07 QC 118.50

526
BRGY/SCHOOL CollectionDate LGU
Scrap PlasticBag (Kgs.)
ScrapFoam PS
(Kgs.)
19 Brgy. 82-85 Cluster 15-Jan-08 CAL 168.00
20 Brgy. 126-131 Cluster 15-Jan-08 CAL 77.00
TOTAL 1,206.81 46.00
Foam PS is temporarily stored inside the PPIA building until such time that it accumulates to a truckload before delivering to the Polystyrene Packaging Council of the Philippines or a PPCP-endorsedrecycler.
0
50
100
150
200
250
300
350
OCT NOV DEC JAN
QCCAL
Figure 3.5-1 PPIA Collection Graph
In the first three months of project implementation, the collection drive steadily increased. The levelof awareness by the households improved during the second month of IEC when eco-aides viewedthe Mobile Plastic Collection and Recycling Truck accompanied by LGU Solid Waste Managementand PPIA representatives. The eco-aides realized that the proponents are serious in their efforts toimplementing the project and increase waste diversion. The information relayed by the eco-aidesenthused households to practice segregation of plastic bags and Foam PS (in the case of Brgy. NewEra) in the succeeding months which explains the increase.
For January, PPIA collected 245 kilos from Caloocan City 85 kilos of which were supposed to becollected last December. PPIA expects to collect 300 kilos from Quezon City.
Table 3.5-2 Total Collection Per LGU in Kgs. as of 15 January 2008

527
OCT NOV DEC JAN TOTAL
QUEZON CITY 152 285.5 318 300* 1055.5
CALOOCAN CITY 106 98.31 133 160 497.3
TOTAL 258 383.81 451 465 1557.81
*Projected
33..66 CChhaannggeess iinn PPoolliittiiccaall LLeeaaddeerrsshhiippThe October 29 Barangay Elections brought changes to the political landscape in the Barangayswhere we are implementing the pilot project. Although the incumbent Barangay Chairmen haveuntil November 30 to complete their terms the impact on certain Barangays were immediate.
FORMER BRGY CAPT. NEW BRGY CAPT.
QUEZON CITY
Brgy. Greater Lagro Manuel C. Tolentino Atty. Renato Galimba
Brgy. Holy Spirit Felicito Valmocina Estrella Valmocina
Brgy. New Era Arch. Luisito B. Sison Dr. Salvador Corpuz
CALOOCAN CITY
Brgy. 83 Carlos Florentino Ricky Aquino
VALENZUELA CITY
Brgy. Marulas Dr. Michaelito L. Benoza Ernesto “Boy” De Guzman
RE-ELECTED
QUEZON CITY
Brgy. Greater Fairview Jose Arnel L. Quebal
CALOOCAN CITY
Brgy. 82
Brgy. 84
Brgy. 85
Loida I. Alcedo
Rj Echiverri
Leovilo Ching
QUEZON CITY
In Brgy. Greater Lagro the loss of Chairman Manuel Tolentino meant the end of the Eco-boys in

528
padyaks (side cars). As reported to us by the QC Environmental Protection and Waste ManagementDepartment (EPWMD), the Eco-boys who derive their allowances from the Chairman’s office havestopped operating since November 2007. According to EPWMD, the incoming Chairman, Atty.Renato Galimba, is reviewing the effectivity of the solid waste management program of theBarangay.
Meanwhile, there was continuity in Brgy. Holy Spirit as Felicito Valmocina, who finished his thirdterm will be replaced by his wife Estrella.
Likewise in Brgy. New Era, Architect Luisito Sison was replaced by Kagawad Dr. Salvador Corpuz,who was a member of the Environment Committee of the Barangay who approved the signing of ourMOA with them on 23 October.
In Brgy. Fairview, it was a landslide victory for Chairman Jose Arnel Quebal who governs over thebiggest Barangay in Quezon City.
CALOOCAN CITY
Three of the four Barangay Chairmen were re-elected which augurs well for the project..
VALENZUELA CITY
With the loss of Brgy. Marulas Chairman, Dr. Michaelito Benoza, we will have to re-introduce theproject to the new Brgy. Council. The previous Council of Brgy. Marulas favorably endorsed theproject to the Brgy. Chairman, however, he was eventually defeated during the elections.
33..77 FFaaccttoorrss AAffffeeccttiinngg tthhee SSuucccceessss ooff tthhee PPrroojjeeccttThe result of collection in pilot barangays indicated that a prerequisite for effective collection ofplastic recyclables are the ff::
Factor Effect on the Project
Political Changes in political leadership can disrupt project implementationregardless of the MOA executed with a predecessor as successoris not bound to the MOA. This is the case for Barangay Lagro.
Infrastructure There is a need for an operational MRF which is a storage spacewith roofing and partitioned areas to hold recyclable materials inseparate cells for plastic, glass, metal, aluminum, paper, etc.Brgy. Marulas in Valenzuela does not have a MRF and isincapable of recovering recyclables as a source of wastediversion. Brgys. 126-131 in Caloocan has a small MRF anddoes not have enough space to store collected plastic bags andrelies on Brgys.82-85 MRF for storage.

529
Eco-aides with push carts or karitons are necessary for the IECand collection drive at the household level.
Economic Barangays consider the economic benefit they will derive fromparticipating in the project. All of the barangays agreed on a bartersystem for the collection of plastic bags and Foam PS except onebarangay which prefers selling their collected scraps.
Social Income classes have a bearing on the project. Although athorough survey is required to verify this, the higher income classtends to consume and generate more scrap. Brgy. Fairview, Brgy.Lagro and Brgys. 82-85 in Caloocan which are inhabited bysubdivision dwellers tend to contribute more scrap collection forthe project.
Education is important as indicated by schools which significantlycontributed to the waste diversion efforts. Schools are suitablesites for project replication because training the students toproperly segregate their wastes is an effective way of preparingthe future generation as stewards of the environment.
Legal Ordinances that accredit eco-aides or junk shops operating in thebarangay help ensure recovery of recyclables from thehouseholds. This is practiced by Brgy. Fairview and Brgy. Lagrowhich accounted for 90 percent of the collection in Quezon CityBarangays.
33..88 CCoonncclluussiioonnConsidering that the project started from zero to 1.5 MT waste diversion of plastic bags and FoamPS in the pilot areas, the project succeeded in introducing a new source for increasing the wastediversion target for LGUs, barangays and schools.
On the one hand, Quezon City Barangays is continuing the collection of target recyclable materialsbeyond the project duration.
On the other hand, Caloocan City is expandingsegregation of target recyclables as a city-wide projectcovering 188 barangays. According to the CaloocanEnvironmental Sanitation Services (ESS), they aretargeting 50 percent of the barangays to implementedsegregated collection which would already include plasticbags starting July 1, 2008 as part of its waste diversionefforts for the city.

530
Claret School of Quezon City and Miriam College are now segregating plastic bags. Miriam is alsocollecting Foam PS which is relatively more than the sando bags.
The success in the two pilot schools indicate that schools are suitable sites for project replicationbecause training the students to properly segregate their wastes is an effective way of preparing thefuture generation as stewards of the environment.
The result of collection in pilot barangays indicated that a prerequisite for effective collection ofplastic recyclables are the ff: 1) support and political will of the barangay chairman 2) operational
MRF, 3) household level collection mechanism(i.e. eco-aides with karitons or sidecars), andclustering of barangays to ensure minimumcollection.
The linkage between the barangays andrecyclers will have a snowball effect onneighboring barangays as the recycling marketfor post-consumer plastic bag expands.
33..99 PPrroojjeecctt SSuussttaaiinnaabbiilliittyySome pilot sites have already been turned over to MPRAI. This is the case for Caloocan City.
PPIA will continue the collection operation on pilot areas not yet turned over to MPRAI.
PPIA will proceed with the collection and dispatch once new areas are identified based on set criterianamely:
1) support and political will of the barangay chairman
2) operational MRF
3) household collection mechanism (i.e. eco-aides with karitons, sidecars)
4) clustering of barangays to ensure maximum collection
PPIA recommends ordinances or measures to ensure success and continuation regardless politicalleadership i.e. accrediting eco-aides so that recyclables fall in the hands of barangay.