volume no. i issue no. 57 tata global beverages ltd , 2016 · pdf filetata global beverages...
TRANSCRIPT
.
.
0
50
100
150
Jan
-15
Feb
-15
Mar
-15
Ap
r-1
5
May
-15
Jun
-15
Jul-
15
Au
g-1
5
Sep
-15
Oct
-15
No
v-1
5
De
c-1
5
Jan
-16
Nifty TGB
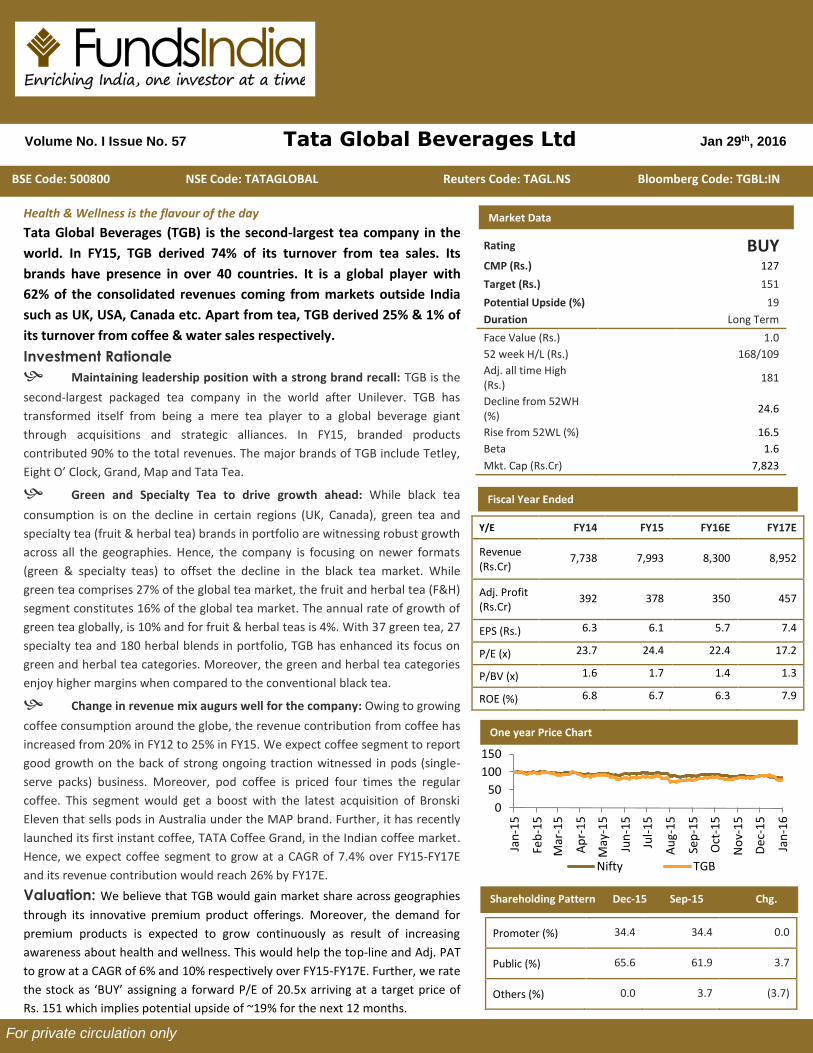
One year Price Chart
Health & Wellness is the flavour of the day
Tata Global Beverages (TGB) is the second-largest tea company in the
world. In FY15, TGB derived 74% of its turnover from tea sales. Its
brands have presence in over 40 countries. It is a global player with
62% of the consolidated revenues coming from markets outside India
such as UK, USA, Canada etc. Apart from tea, TGB derived 25% & 1% of
its turnover from coffee & water sales respectively.
Investment Rationale
Maintaining leadership position with a strong brand recall: TGB is the
second-largest packaged tea company in the world after Unilever. TGB has
transformed itself from being a mere tea player to a global beverage giant
through acquisitions and strategic alliances. In FY15, branded products
contributed 90% to the total revenues. The major brands of TGB include Tetley,
Eight O’ Clock, Grand, Map and Tata Tea.
Green and Specialty Tea to drive growth ahead: While black tea
consumption is on the decline in certain regions (UK, Canada), green tea and
specialty tea (fruit & herbal tea) brands in portfolio are witnessing robust growth
across all the geographies. Hence, the company is focusing on newer formats
(green & specialty teas) to offset the decline in the black tea market. While
green tea comprises 27% of the global tea market, the fruit and herbal tea (F&H)
segment constitutes 16% of the global tea market. The annual rate of growth of
green tea globally, is 10% and for fruit & herbal teas is 4%. With 37 green tea, 27
specialty tea and 180 herbal blends in portfolio, TGB has enhanced its focus on
green and herbal tea categories. Moreover, the green and herbal tea categories
enjoy higher margins when compared to the conventional black tea.
Change in revenue mix augurs well for the company: Owing to growing
coffee consumption around the globe, the revenue contribution from coffee has
increased from 20% in FY12 to 25% in FY15. We expect coffee segment to report
good growth on the back of strong ongoing traction witnessed in pods (single-
serve packs) business. Moreover, pod coffee is priced four times the regular
coffee. This segment would get a boost with the latest acquisition of Bronski
Eleven that sells pods in Australia under the MAP brand. Further, it has recently
launched its first instant coffee, TATA Coffee Grand, in the Indian coffee market.
Hence, we expect coffee segment to grow at a CAGR of 7.4% over FY15-FY17E
and its revenue contribution would reach 26% by FY17E.
Valuation: We believe that TGB would gain market share across geographies
through its innovative premium product offerings. Moreover, the demand for
premium products is expected to grow continuously as result of increasing
awareness about health and wellness. This would help the top-line and Adj. PAT
to grow at a CAGR of 6% and 10% respectively over FY15-FY17E. Further, we rate
the stock as ‘BUY’ assigning a forward P/E of 20.5x arriving at a target price of
Rs. 151 which implies potential upside of ~19% for the next 12 months.
Rating BUY CMP (Rs.) 127
Target (Rs.) 151
Potential Upside (%) 19
Duration Long Term
Face Value (Rs.) 1.0
52 week H/L (Rs.) 168/109
Adj. all time High (Rs.)
181
Decline from 52WH (%)
24.6
Rise from 52WL (%) 16.5
Beta 1.6
Mkt. Cap (Rs.Cr) 7,823
Promoter (%) 34.4 34.4 0.0
Public (%) 65.6 61.9 3.7
Others (%) 0.0 3.7 (3.7)
Market Data
Y/E FY14 FY15 FY16E FY17E
Revenue (Rs.Cr)
7,738 7,993 8,300 8,952
Adj. Profit (Rs.Cr)
392 378 350 457
EPS (Rs.) 6.3 6.1 5.7 7.4
P/E (x) 23.7 24.4 22.4 17.2
P/BV (x) 1.6 1.7 1.4 1.3
ROE (%) 6.8 6.7 6.3 7.9
Fiscal Year Ended
Jan 29th, 2016
BSE Code: 500800 NSE Code: TATAGLOBAL Reuters Code: TAGL.NS Bloomberg Code: TGBL:IN
For private circulation only
Volume No. I Issue No. 57 Tata Global Beverages Ltd
Shareholding Pattern
Dec-15 Sep-15 Chg.
Tata Global Beverages Ltd: Second-largest tea company in the world
Tata Global Beverages (TGB) is the second-largest tea company in the world. In FY15, TGB
derived 74% of its turnover from tea sales. TGB has transformed itself from being a mere tea
player to a global beverage giant through acquisitions and strategic alliances with global
brands like Pepsi and Starbucks. Its brands have presence in over 40 countries. It is a global
player with 62% of the consolidated revenues coming from markets outside India such as UK,
USA, Canada etc. Further, Tata Coffee is a 57% subsidiary of TGB.
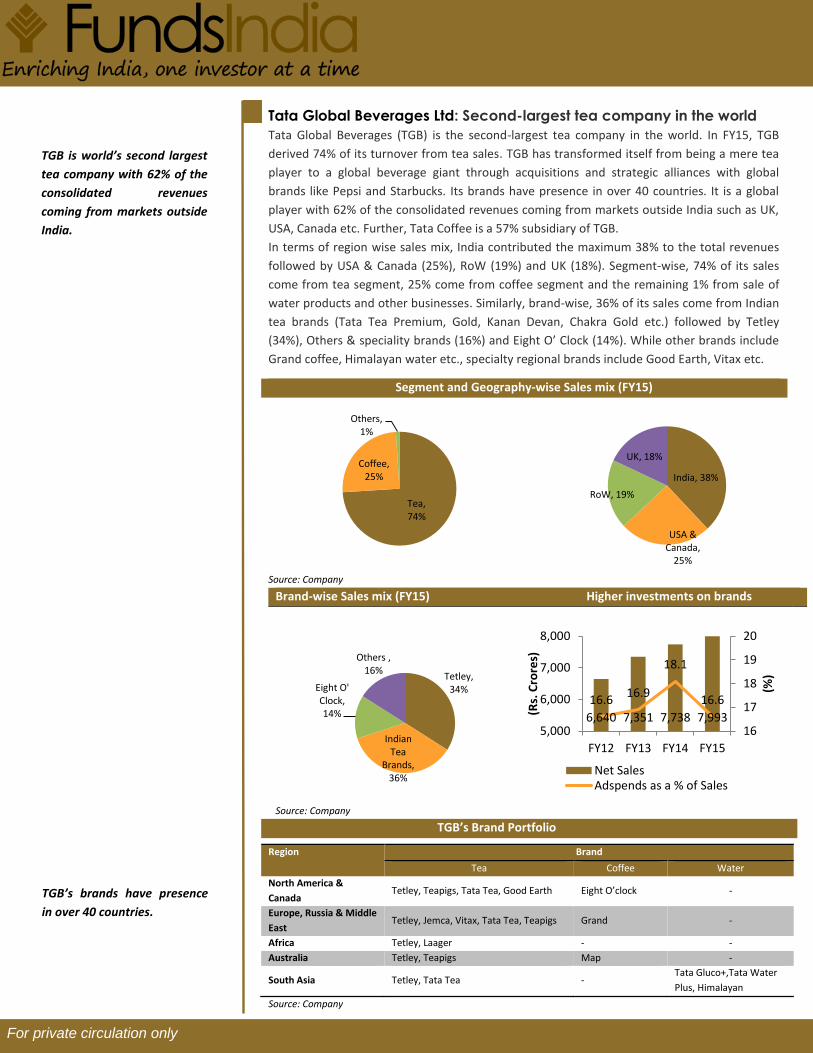
In terms of region wise sales mix, India contributed the maximum 38% to the total revenues
followed by USA & Canada (25%), RoW (19%) and UK (18%). Segment-wise, 74% of its sales
come from tea segment, 25% come from coffee segment and the remaining 1% from sale of
water products and other businesses. Similarly, brand-wise, 36% of its sales come from Indian
tea brands (Tata Tea Premium, Gold, Kanan Devan, Chakra Gold etc.) followed by Tetley
(34%), Others & speciality brands (16%) and Eight O’ Clock (14%). While other brands include
Grand coffee, Himalayan water etc., specialty regional brands include Good Earth, Vitax etc.
Segment and Geography-wise Sales mix (FY15)
Source: Company
Brand-wise Sales mix (FY15) Higher investments on brands
Source: Company
TGB’s Brand Portfolio
Region Brand
Tea Coffee Water
North America &
Canada Tetley, Teapigs, Tata Tea, Good Earth Eight O’clock -
Europe, Russia & Middle
East Tetley, Jemca, Vitax, Tata Tea, Teapigs Grand -
Africa Tetley, Laager - -
Australia Tetley, Teapigs Map -
South Asia Tetley, Tata Tea - Tata Gluco+,Tata Water
Plus, Himalayan
Source: Company
Tea, 74%
Coffee, 25%
Others, 1%
India, 38%
USA & Canada,
25%
RoW, 19%
UK, 18%
Tetley, 34%
Indian Tea
Brands, 36%
Eight O' Clock, 14%
Others , 16%
6,640 7,351 7,738 7,993
16.616.9
18.1
16.6
16
17
18
19
20
5,000
6,000
7,000
8,000
FY12 FY13 FY14 FY15
(%)
(Rs.
Cro
res)
Net SalesAdspends as a % of Sales
TGB is world’s second largest
tea company with 62% of the
consolidated revenues
coming from markets outside
India.
For private circulation only
TGB’s brands have presence
in over 40 countries.

TGB has broadened its product portfolio through key acquisitions & JVs
Year
Target
Country
2000 Tetley UK
2005 Good Earth USA
2006 Eight O' Clock Coffee USA
2006 Jemca Czech Republic
2007 Mount Everest Mineral Water India
2007 Vitax Poland
2009 Grand Russia
2011 JV with PepsiCo India India
2012 JV with Starbucks India
2014 Bronksi Eleven Australia
Source: Company
Sharp focus on green tea to aid growth
TGB is the second-largest tea company in the world. In FY15, TGB derived 74% of its
consolidated turnover from tea sales. In India, TGB has maintained its leadership position led
by its strong brands, Tata Tea, Tata Tea Gold, Agni and Kanan Devan. While black tea
consumption is on the decline in certain regions (UK, Canada), green tea and specialty tea
(fruit & herbal tea) brands in portfolio are witnessing robust growth across all the
geographies. Hence, the company is focusing on newer formats (green & specialty teas) to
offset the decline in the black tea market. While green tea comprises 27% of the global tea
market, the fruit and herbal tea (F&H) segment constitutes 16% of the global tea market. The
annual growth rate of green tea globally, is 10% and for fruit & herbal teas is 4%. With 37
green tea, 27 specialty tea and 180 herbal blends in portfolio, TGB has enhanced its focus on
green and herbal tea categories. These categories are witnessing high growth both in the
international as well as domestic markets. Moreover, the green and herbal tea categories
enjoy higher margins when compared to the conventional black tea.
Interestingly, tea as a category in India is growing at around 4-5%, green tea is growing at a
CAGR of ~30%. The green tea market in India is estimated at Rs. 129 crores with TGB leading
the market. In the domestic market, TGB is building its green tea portfolio under the Tetley
brand. Currently, TGB has green tea brands in its portfolio, namely Tetley Green Tea and Tata
Tea Acti Green. In UK, TGB launched a range of Tetley Super Green Teas in various flavors to
tap growing green tea market. Likewise, in 2015, a premium line of specialty teas, called the
Tetley Signature collection was launched in Canada. Similarly, in the UK market, Tetley
recently launched Tetley Super Fruits.
With sharp focus on the green tea category, we expect tea revenues to grow at a CAGR of
~5% in FY15-17E led by wide product portfolio, premiumisation coupled with increasing
awareness about health and wellness.
Key Brands of Tata Global Beverages
TGB has transformed itself
from being a mere tea player
to a global beverage giant
through acquisitions and
strategic alliances with global
brands like Pepsi and
Starbucks.
With 37 green tea, 27 specialty
tea and 180 herbal blends in
portfolio, TGB has enhanced
its focus on green and herbal
tea categories.
For private circulation only
For private circulation only

We expect coffee segment to
grow at a CAGR of 7.4% over
FY15-FY17E and its revenue
contribution would reach 26% by
FY17E.
For private circulation only
Change in revenue mix would augur well for the company
Owing to growing coffee consumption around the globe, the revenue contribution has
increased from 20% in FY12 to 25% in FY15. Coffee segment, the second highest contributor
to the total revenues, derives revenue from branded coffee, coffee plantations and from
JVs. We expect this segment to report good growth on the back of strong ongoing traction
witnessed in pods (single-serve packs) business. Further, pod coffee is priced four times the
regular coffee. This segment would get a boost with the latest acquisition of Bronski Eleven
that sells pods in Australia under the MAP brand. TGB is also present in the pods segment in
USA (through Eight O’Clock Coffee). The company receives royalty income from pod sales for
which it entered an agreement with Keurig. Further, it has recently launched its first instant
coffee, TATA Coffee Grand, in the Indian coffee market. Similarly, Eight O’Clock Coffee (EOC)
launched an instant coffee offering recently. Going forward, TGB is planning to launch Map
in New Zealand and Indonesia. Hence, we expect coffee segment to grow at a CAGR of 7.4%
over FY15-FY17E and its revenue contribution would reach 26% by FY17E.
Starbucks JV has potential to become a significant value driver for TGB
Tata Starbucks Pvt. Ltd., the 50:50 JV between TGBL and Starbucks Coffee International Inc
US), was formed in 2012, owns and operates Starbucks stores in India. In the first year alone,
the JV opened 12 stores across Mumbai & Delhi. As of Q2FY16, Tata Starbucks has set up 78
stores in six Indian cities (Mumbai, Delhi, Bengaluru, Chennai, Pune and Hyderabad). The
coffee retail market has huge potential in India due to multiple factors including rising
disposable income, young working population and increasing pace of westernization. With
the aggressive expansion of the company (6 new Starbucks stores added in H1FY16), we
expect Starbucks store count to reach 100 stores in next 2-3 years. So far, TGB has invested
Rs. 150 crore in this JV. Tata Starbucks JV is still in investment phase and incurred a loss of
Rs. 47 crores in FY15. However, we believe this JV to achieve breakeven in next 3-4 years.
Betting big on water business
NourishCo, the 50:50 JV with PepsiCo India, produces and markets Tata Water Plus (India’s
1st nutrient water) and Tata Gluco Plus (glucose-based flavoured drink). Even, Himalayan
water is marketed through this JV. While Himalayan brand has a pan-India presence, the
other two have been rolled out only in Tamil Nadu, Andhra Pradesh, MP, Maharashtra,
Karnataka, Gujarat and UP. Further, Himalayan is now also available at some mainstream
super-markets in Singapore and TGB is also evaluating options for scale up in other
international markets. This segment has grown at a CAGR of about 15% over the last three
years. Further, the management expects in the next 2 years 20% of TGB's India revenue to
come from its water segment.
India’s market shows promising outlook; overseas subsidiaries to witness a revival
The revenue contribution of India to TGB’s consolidated topline has risen from 30.3% in
FY12 to 38% in FY15. In 2012, TGB overtook HUL to become the leader of India's branded tea
market and has maintained its volume and value leadership. With UK and US on slow growth
trajectory, TGB is again focusing on its growth back home. Owing to the challenging
environment, sales growth of subsidiaries moderated to 0.5% in FY15 pulling down the
consolidated sales growth to 2.8% YoY in FY15. The subdued growth witnessed in
subsidiaries was on the back of challenging market conditions in the UK (Tetley tea business)
and US (Eight O’ Clock coffee revenues). However, in the near term, we expect the EOC
business to get the benefit of falling coffee prices.
India’s contribution to TGB’s
topline has increased from 30%
in FY12 to 38% in FY15.

We expect the top-line of the company to grow at a CAGR of 6% over FY15-FY17E.
India’s contribution to the total revenues on the rise
Source: Company, In-house research
Margins to improve from FY17E onwards
After remaining stagnant for the last two years at 9.7%, TGB’s EBITDA margins are expected
to shrink to 8.8% in FY16 as input costs (both tea & coffee prices) remained higher in H1FY16.
Of late, Arabica coffee prices have fallen 30% YoY and are trending back to near trough levels.
Hence, we expect margins to expand to 9.9% in FY17E. With enhanced focus on brand
building, we expect premiumisation to gain traction supporting margins for the company.
Further, rising contribution of coffee in revenues would boost margins as coffee segment
(13.2% EBIT margin in FY15) enjoys higher margins when compared to tea segment (10.5%
EBIT margin in FY15).
Earnings to pick momentum from FY17E onwards
During FY15-FY18E, we expect the top-line of the company to grow at a CAGR of 6% as TGB
continues to deliver robust performance in its India business coupled with revival in overseas
subsidiaries. Further, we estimate 10% CAGR in Adjusted PAT over FY15-17E mainly on
account of EBITDA margin expansion from FY17E onwards owing to the recent correction
seen in input costs and better product mix. Due to the sluggish performance of subsidiaries in
H1FY16E, ROCE & ROE is projected to drop from 10.1% & 6.7% levels witnessed in FY15 to
9.4% & 6.3% respectively in FY16E. With the revival in the performance of subsidiaries, we
believe TGB to report improvement in its ROE and ROCE from FY17E onwards. While ROE is
likely to improve from 6.3% in FY16E to 7.9% in FY17E, ROCE is projected to increase from
9.4% in FY16E to 11.2 % in FY17E.
30.3% 31.8% 35.9% 38.0%
0.0%
20.0%
40.0%
FY12 FY13 FY14 FY15
For private circulation only
Key Risks:
1 Rise in the prices of green tea leaf and green coffee bean could put pressure on the
gross profit margins.
2 Forex volatility could impact the realisations negatively.
3 Heightened competitive intensity in the industry may deteriorate the margins
EBITDA margins to expand to 9.9% in FY17E Return Ratios expected to improve from FY17E onwards
Source: Company, In-house research
7,738 7,993 8,300 8,952
9.7 9.78.8
9.9
5.1 4.7 4.25.1
0
2
4
6
8
10
12
0
2,000
4,000
6,000
8,000
FY14 FY15 FY16E FY17E
%
Rs.
Cro
res
Revenue EBITDA Margin (%) PAT Margin (%)
6.8 6.7 6.3 7.9
9.9 10.1 9.4 11.2
-
2.0
4.0
6.0
8.0
10.0
12.0
FY14 FY15 FY16E FY17E
%
RoE RoCE

Balance Sheet (Consolidated)
Profit & Loss Account (Consolidated)
Y/E (Rs.Cr) FY14 FY15 FY16E FY17E
Total operating
Income 7,738 7,993 8,300 8,952
Raw Material cost 3,677 3,837 4,092 4,324
Employee Cost 793 858 880 940
Other operating
expenses 2,516 2,524 2,597 2,804
EBITDA 752 775 732 884
Depreciation 129 133 149 159
EBIT 623 642 583 726
Interest cost 87 82 65 60
Other income 82 70 66 63
Profit before tax 618 630 584 729
Tax 184 216 199 233
Profit after tax 434 414 386 496
Minority Interests 29 26 27 31
P/L from Associates (13) (11) (9) (8)
Adjusted PAT 392 378 350 457
E/oincome/ (Expense) 89 (130) - -
Reported Profit 480 248 350 457
Y/E (Rs.Cr) FY14 FY15 FY16E FY17E
Paid up capital 62 62 62 62
Reserves and
Surplus 5,787 5,431 5,614 5,889
Net worth 5,849 5,493 5,676 5,951
Minority Interest 924 876 903 933
Total Debt 1,438 1,324 1,290 1,202
Other non-current
liabilities 432 461 491 525
Total Liabilities 8,643 8,154 8,360 8,611
Total fixed assets 1,052 1,077 1,088 1,099
Goodwill 4,188 3,892 3,892 3,892
Investments 611 622 622 622
Net Current
assets 2,498 2,249 2,418 2,629
Other non-current
assets 293 314 340 369
Total Assets 8,643 8,154 8,360 8,611
Y/E (Rs.Cr) FY14 FY15 FY16E FY17E
Pretax profit 707 500 584 728
Depreciation 129 133 149 159
Chg in Working
Capital 8 (132) (119) (132)
Others (168) 86 (1) (3)
Tax paid (255) (169) (199) (233)
Cash flow from
operating activities 422 418 413 519
Capital expenditure (204) (179) (160) (170)
Chg in investments (1) (75) - -
Other investing
cashflow 84 80 66 63
Cash flow from
investing activities (120) (175) (94) (107)
Equity
raised/(repaid) - - - -
Debt raised/(repaid) (122) (199) (34) (88)
Dividend paid (162) (161) (167) (181)
Other financing
activities (79) (32) (73) (69)
Cash flow from
financing activities (363) (392) (274) (338)
Net chg in cash (62) (149) 45 74
Cash Flow Statement (Consolidated)
Profit & Loss Account (Consolidated)
Profit & Loss Account (Consolidated)
Y/E FY14 FY15 FY6E FY17E
Valuation (x)
P/E 23.7 24.4 22.4 17.2
EV/EBITDA 14.5 14.0 12.9 10.5
EV/Net Sales 1.4 1.4 1.1 1.0
P/B 1.6 1.7 1.4 1.3
Per share data (Rs.)
EPS 6.3 6.1 5.7 7.4
DPS 2.2 2.3 2.4 2.6
BVPS 94.6 88.8 91.8 96.2
Growth (%)
Net Sales 5.3 3.3 3.8 7.9
EBITDA (2.2) 3.1 (5.6) 20.9
Net Profit (2.3) (3.6) (7.3) 30.4
Operating Ratios (%)
EBITDA Margin 9.7 9.7 8.8 9.9
EBIT Margin 9.1 8.9 7.8 8.8
PAT Margin 5.1 4.7 4.2 5.1
Return Ratios (%)
RoE 6.8 6.7 6.3 7.9
RoCE 9.9 10.1 9.4 11.2
Turnover Ratios (x)
Net Sales/GFA 3.8 3.4 3.3 3.3
Sales/Total Assets 0.8 0.8 0.9 0.9
Sales/Working Capital 4.8 4.6 4.7 4.7
Liquidity&Solvency Ratios (x)
Current Ratio 2.8 2.7 2.7 2.8
Interest Coverage Ratio 7.2 7.8 9.0 12.1
Debt/Equity 0.2 0.2 0.2 0.2
For private circulation only
Key Ratios (Consolidated)

Rating Criteria
Large Cap. Mid/Small Cap.
Return Return
BUY More than equal to 10% More than equal to 15%
HOLD Between 10% & -5% Between 15% & 0%
SELL Less than -5% Less than 0%
Time Horizon 12 months
Disclaimer: This document has been prepared by Funds India and Dion Global Solution Ltd. (the company) and is being
distributed in India by Funds India. The information in the document has been compiled by the research department. Due
care has been taken in preparing the above document. However, this document is not, and should not be construed, as an
offer to sell or solicitation to buy any securities. Any act of buying, selling or otherwise dealing in any securities referred to in
this document shall be at investor’s sole risk and responsibility. This document may not be reproduced, distributed or
published, in whole or in part, without prior permission from the Company.
© Copyright – 2015 - Dion Global Solution Ltd and Funds India.
Funds India Uttam Building, Third Floor| No. 38 & 39| Whites Road| Royapettah|Chennai – 600014| T: +91 7667 166 166 Email: [email protected]
Contact Us: