volume to value - strategies for maximizing your · pdf filevolume to value - strategies for...
TRANSCRIPT

January 11, 2012
Volume to Value -
Strategies For Maximizing Your Margins

Introduction
• Housekeeping Matters
• Presenters
2
Paul Butler, Associate Director
Navigant Healthcare
312.583.4176
Richard Bajner, Associate Director
Navigant Healthcare
312.583.3740
Michael R. Callahan, Partner
KattenMuchin Rosenman LLP
312.902.5634
kattenlaw.com/callahan/
Laura Keidan Martin, Partner
KattenMuchin Rosenman LLP
312.902.5487
kattenlaw.com/laura-keidan-martin/

Today’s Objectives
• Review the Changing Health Care Landscape
• Cornerstones Of the New Emerging Payment Models
• Case Studies of New Reimbursement and Delivery Models
• Panel Discussion
3

The Changing Healthcare Landscape
4

The Changing Healthcare Landscape
• Consolidation of market
• Provider margins are under attack
• New models of provider integration are emerging
• Increased fraud enforcement
• Shift from ‚Volume to Value‛ as a basis of reimbursement
5

The New Emerging Models – Moving from Volume to Value
6

Why Are New Models Emerging
• Hospitals are seeking way to build relationships with providers
• Pressure on future reimbursement increases / focus on decreasing overall cost structure to maintain margins will require organizational redesign and implementation
• CMS, employers, and payers are demanding delivery of high quality healthcare at lower costs
… value based purchasing of healthcare
7

Cornerstones of the New Model
Organizational Transformation
• Delivery Model
• Aligned Incentives
• Legal Structure / Governance
• HIE / Analytics / Reporting
• Clinical Integration
8
Clinical Integration
• Focus on Quality
• Focus on Cost Efficiency
• Focus on Care Coordination
• Focus on Risk Management

Cornerstones of the New Model – Delivery Model
• Right hospitals
• Right clinicians
• Defined clinical pathways and protocols, including alert monitoring systems
• Right site of care
9

Cornerstones of the New Model – Aligned Incentives
• Identify opportunities to mutually benefit from improved performance
₋ Bundling readmissions into base rate to maintain current episode payment
₋ Share savings from reducing supply unit cost
• Requires aligning external payment model (payer to provider) with internal funds flow (hospital to physician)
• Line of site into episode view for tracking performance requires ability to track hospital, physician, post acute claims
• Requires investment of HIE / Analytics / Reporting
10

11
Cornerstones of the New Model – Legal Structures / Governance
• Choice of legal entity
• Equity participation and associated rights
• Board composition
• Committee infrastructure
• Contractual relationships
Key to success: Involving and empowering physician champions in decision making to achieve physician buy-in and participation in quality and cost-saving initiatives.
11

Clinical Integration – Definition
Clinical Integration is:
An active and ongoing program to evaluate and modify the clinical practice patterns of the physician participants so as to create a high degree of interdependence and cooperation to control costs and ensure quality.
12

Clinical Integration – Definition
If joint payer contracting is reasonably necessary to the achievement of those efficiencies and the anticompetitive
effects of the joint contracting do not exceed the pro-competitive benefits of the efficiencies, the activities of the
clinical integration network will not violate the antitrust laws.
13

Key Regulatory Parameters: Stark Law
• The Stark Law provides that a physician may not:
1) Refer Medicare or Medicaid patients to an entity
2) For the furnishing of “designated health services” (“DHS”)
3) If there is a financial relationship between the referring physician (or an immediate family member) and the entity
4) Unless an exception applies
• Bottom line: Every compensation arrangement between a DHS entity and a physician must satisfy a Stark exception, or else the physician cannot refer Medicare/Medicaid patients to the DHS entity.
• Potentially applicable exceptions include employment, personal services, indirect compensation, prepaid plans and risk sharing arrangements.
14

15
Key Regulatory Parameters: Anti-Kickback Statute (AKS)
• Prohibits an individual from ‚knowingly and willfully‛ offering, paying, soliciting, or receiving any remuneration (direct or indirect, in cash or in kind) in return for or to induce referrals or recommendations for services or items covered by a federal health care program — In short, no payment for referrals.
• The government asserts that it need only prove that one purpose of the remuneration is to induce referrals unless a safe harbor applies.
• As with the Stark Law, numerous exceptions and safe harbors may apply, but unlike Stark, penalties for violations can be both civil and criminal.
15

16
Gainsharing CMPs
• A hospital may not knowingly make a payment directly or indirectly to a physician as an inducement to reduce or limit items or services to Medicare or Medicaid fee-for-service beneficiaries under the physician’s direct care.
• Hospitals that make (and physicians that receive) such payments are liable for CMPs of up to $2,000 per patient.
• Favorable OIG advisory opinions issued regarding specific gainsharing arrangements that included safeguards against kickback risk, such as incentive caps, volume-neutral compensation formulas and per capita (rather than admission based) distributions.
₋ Offering participation to physicians who are not already on the medical staff may be viewed as an attempt to induce referral pattern changes.
₋ Targets should be rebased from year to year to ensure that physicians are not compensated for previously achieved performance improvements.
16

Reimbursement and Delivery Models – Payment Transformation

Moving from Volume to Value
20th Century(‚Cost and Volume‛)
21st Century(‚Value‛)
Vertical integration Clinical Integration
Steerage Collaboration
Eliminate “middle man” New value proposition
Medical Management Evidence Based Approaches
Transfer Pricing Value Based Pricing
Target small and/or local employers Target all purchasers
Medical cost analysis Patient outcome analysis
Fully insured Evolving economic structure
Preferred providers/exclusive networks Rational delivery system
Gatekeepers Empowered consumers/patients
Site specific medical records Integrated electronic health record
Physicians as passive participants Physicians economically integrated
18

We Will Focus On Emerging Shared Savings Models
• The models that most payers and providers are implementing include a version of
₋ Shared Savings
₋ Patient Centered Medical Home
₋ Bundled / Episodic Payment
• Key Decision Points
₋ What shared savings model will create the greatest value for both payer and provider?
₋ What population will shared savings be measured?
₋ What mechanism will the payer / provider implement to share savings?
₋ What risks will providers need to manage?
₋ What are the specific steps / investments the payer and provider need to undertake to be able to operationalize the shared savings model?
19

Payment, Incentive, & Delivery Alignment Framework
FFS All Services
Full Cap
De
gre
e o
f F
ina
nci
al R
isk
Full Capitation
Shared Savings
FFS + P4P
Selective Capitation
PCP
Episodic Bundling
Degree of Clinical Integration
20

The Shared Savings Model - Gives & Gets
Entity Revenues / Volume Growth/Benefits Expenses / Costs
Hospitals & Physicians
• Volume growth from health plan steerage • Volume growth from reduced physician
splitting/improved loyalty • Shared savings, trend savings associated with
foregone utilization with plans and CMS • Clinical integration investment dollars from payers • Underlying reductions in variable & fixed costs • Infrastructure investment from payers and CMS • Medical management funding from payer
• Foregone utilization • Costs to build out infrastructure • Medical management costs • Investment in HIE, analytics and
reporting
Patients
• Personalized patient care programs • Access to Health Coaches, Nurse Managers, Health
Risk Appraisals, etc.
• Optional: increased patient out of pocket expenses for unhealthy behaviors, non-compliance
Health Plan
• Reductions in avoidable utilization through medical management investments & shared savings incentives
• High performing provider alternatives to plug into new products (co-branded products, narrow networks)
• HIE investment to connect hospitals, physicians
• Clinical integration investment dollars
• PMPM medical management fees • Innovative shared savings models
Think of the financial model as a series of ‚gives & gets‛, with clear revenue and expense tradeoffs between hospitals, physicians and payers
21

The Approach To Each Model
• Step 1: Assess the opportunities
₋ Identify and quantify reductions opportunities – avoidable days, readmissions, length of stay, avoidable emergency room visits, etc.
₋ Calculate the cost savings reduction opportunity through improved process, utilization management, discharge planning, etc.
• Step 2: Design the solutions
₋ Design changes to the delivery model required to achieve cost savings
₋ Design changes the payment model required to support and incentivize change
• Step 3: Implement the program
₋ Implement the operational model for achieving results
₋ Establish metrics/analytics and reporting to support corrective action
22

Shared Savings Model

Shared Savings
• Shared savings is a payment strategy that offers incentives for providers to reduce health care spending for a defined patient population by offering them a percentage of net savings realized as a result of their efforts.
• Shared savings can be applied to some or all of the services that are expected to be used by a patient population.
24

Requirements of Shared Savings
• Payers and Providers must agree on savings opportunities that can achieved and also provide a meaningful incentive for the providers
• The financial model will need to provide reasonable protection that calculated savings do not reflect random variation in health care costs
• Providers need tools to succeed if they are to transform care delivery, including timely, trended performance data with targets and benchmarks, and giving practices the ability to manipulate such data.
• To be successful performance measures which focus on both cost and quality, must be aligned across all payers, governmental and commercial. A common framework will be required.
• Models will need to be evaluated for effectiveness and providers/payer must refine the shared-savings payment model over time to maximize effectiveness.
25

• Cost savings will be achieved and measured annually.
• Providers will need to consider how the model will change over time as the provider gains efficiencies. Convert to % of premium and when?
Sample Financial Model
Premium
$380 PMPM
Medical Costs
$340 PMPM
5% Savings
Opportunity
$17 PMPM
Care Management
Fee
Plan Shared Savings
Provider Shared
Savings
Admin/Profit $40PMPM
26

How will Savings Be Achieved?
• Care Management Programs
₋ Personalized care coaches
₋ Standardized care work flows
₋ Chronic and acute care management programs
₋ Referral management program
• Member Engagement
₋ Customized benefit designs
₋ Higher cost sharing on discretionary, elective services
₋ Transparency tools to encourage members to use high quality, low cost providers (labs, imaging, hospitals, etc.)
₋ Personalized patient care plans
₋ Nurse hotline
• Provider Portal / Reporting
₋ Gold card authorization process (reduces administrative costs)
₋ Secure messaging
₋ Payer-data driven analytics and reporting (to track shared savings progress to plan)
27

How will Savings Be Achieved?
• Savings opportunities can only be as robust as the clinical process mapping activities that will ultimately identify savings opportunities
28
• Hypertension
• CAD
• Diabetes
Stage A
High Risk, but no heart disease or symptoms of HF
• Previous MI
• LV systolic dysfunction
• Asymptomatic valvular disease
Stage B
Heart Disease, but no symptoms of HF
• Known structural heart disease
• Shortness of breath and fatigue
• Reduced exercise tolerance
Stage C
Heart Disease with prior or current symptoms of HF
• High symptoms at rest despite maximal therapy
• Recurrent hospitalizations
Stage D
Refractory HR requiring intervention
• Treat hypertension • Smoking cessation • Treat lipid disorders • Regular Exercise
• All measures under Stage A • ACE inhibitors as appropriate • Beta-Blockers as appropriate
• All measures under Stage A • Diuretics, ACE inhibitors, Beta-
Blockers • Dietary Restrictions
• All measures under Stage A, B, C • Mechanical assist devices • Continuous IV infusions • Hospice care
Stage Symptoms Therapy
Sources: BCBSTX Clinical Practice Guidelines

Measuring and Distributing Shared Savings
• How will savings be determined?
₋ Comparison to budget
₋ Payor considers the past health care costs associated with an attributed population, projected forward for future costs
₋ Comparison to a control/benchmark group
₋ Payer compares the rate of change in PMPM cost of the attributed population to a comparison group or the full regional network of providers
₋ If the trend rate falls below the control group, the difference in trend rates is used to calculate the amount of savings.
• How will savings be distributed?
₋ Withhold requirements?
₋ Quality and/or cost savings requirements?
₋ Frequency of distribution?
29

• FFS
• Quality Performance Incentive
• Shared Savings
Funding (upside / downside)
• Medical Care Management Fees
• Disease Specific
Contact Capitation (Centers of Excellence)
• Bundled Payment
How Might The Model Evolve Over Time?
• FFS
• Quality Performance Incentive
• Shared Savings Funding (upside only)
• Medical Care Management Fees
Attributed Member Pilots
Narrow Network / Co-Branded Products
Year 1
Year 2 Year 3
30
• Global Budget Incentive
• % of Premium w/ reinsurance
• Own Health Plan / Joint
Venture
• Direct Contracting
• Insurance Exchange
• Rationalization
31
What is an ACO?
• An organization of healthcare providers that agrees to be accountable for the quality, cost, and overall care of Medicare beneficiaries who are enrolled in the traditional fee-for-service program who are assigned to it.
• For ACO purposes, “assigned” means those beneficiaries for whom the professionals in the ACO provide the bulk of primary care services. Assignment will be invisible to the beneficiary, and will not affect their guaranteed benefits or choice of doctor. A beneficiary may continue to seek services from the physicians and other providers of their choice, whether or not the physician or provider is a part of an ACO.
31

32 6
32
ACO Structure - Example

33
Who can become an ACO?
• Physicians and other ACO professionals in group practices including PAs, APNs, and clinical nurse specialists and suppliers
• Physicians and other ACO professionals in networks of practices
• Partnerships or joint venture arrangements between hospitals and ACO professionals
• Hospitals employing physicians/professionals
• FQHCs and RHCs
• Other forms that the Secretary of Health and Human Services may determine appropriate
33

34
ACO Requirements
• Have a formal legal and shared governance structure that is recognized under state law, i.e., corporation, partnership, LLC, to receive and distribute shared savings under final ACO regs that is recognized under state law
• 75% of control of ACO board controlled by ACO participants
• Have a sufficient number of primary care professionals for the number of assigned beneficiaries (to be 5,000 at a minimum)
• Agree to participate in the program for not less than a 3-year period
• Have sufficient information regarding participating ACO healthcare professionals as the Secretary determines necessary to support beneficiary assignment and for the determination of payments for shared savings
34

35
ACO Requirements (cont’d.)
• Have a management structure that includes clinical and administrative systems
• Have defined processes to:
₋ Promote evidenced-based medicine
₋ Report the necessary data to evaluate quality and cost measures; this could incorporate requirements of other programs, such as the Physician Quality Reporting Initiative (PQRI), Electronic Prescribing (eRx), and Electronic Health Records (EHR)
₋ Coordinate care
• Demonstrate it meets patient-centeredness criteria, as determined by the Secretary
• Quality assurance program must establish internal performance standards for quality, costs and outcomes improvements and hold ACO providers accountable, including termination
35

36
How will ACOs qualify for shared savings?
• Consistent with the overall purpose of the Affordable Care Act, the intent of the Shared Savings Program is to achieve high-quality health care for patients in a cost-effective manner. As part of CMS’s goal to provide better care for individuals, defined as ‚safe, effective, patient-centered, timely, efficient, and equitable,‛ the regulations propose:
₋ Measures to assess the quality of care furnished by an ACO;
₋ Requirements for data submission by ACOs;
₋ Quality performance standards
₋ Incorporation of reporting requirements under the Physician Quality Reporting System; and
₋ Requirements for public reporting by ACOs
• ACOs that do not meet quality performance thresholds for all measures would not be eligible for shared savings, regardless of how much per capita costs were reduced
36

37
Final Performance Measures
• Quality measures are in four domains: ₋ Patient/caregiver experience (7) ₋ Care coordination/patient safety (6) ₋ Preventive health (8) and, ₋ At-risk populations (12): includes 6 measures for diabetes (5 scored as a single
composite), 1 for hypertension, 2 for IVD, 1 for heart failure, and 2 for CAD ₋ EHR adoption by PCPs will be included as a quality measure in the Care
Coordination/Patient Safety domain and will be given double weight in scoring
• Changes over time: ₋ CMS can specify higher standards and/or new measures to improve quality of care
• Patient experience survey:
₋ CMS will pay to administer patient experience surveys (CAHPS) in 2012 and 2013 ₋ Beginning in 2014, ACOs must select an approved survey vendor to administer the
survey and report results to CMS
• Alignment with PQRS reporting
₋ Use of GPRO tool to report ACO measures qualifies you for the physician quality reporting bonus payments – good example of alignment and reinforcing incentive for ACO
37

38
Value Based Purchasing Program Measures
For the FY 2013 Hospital VBP Program, CMS adopted final rules on April 30th, effective July 1st, on the use of clinical process-of-care measures as well as
measures from the Hospital Consumer Assessment of Healthcare Providers and Systems, (HCAHPS) survey that document patients’ experience of care.
38

39
Value-Based Purchasing Program
Under the VBP Program, CMS will pay acute care inpatient prospective payment system (IPPS) hospitals value-based incentive payments for meeting minimum performance
standards for certain quality measures with respect to a performance period designated for each fiscal year. Key metrics include:
39
Acute myocardial infarction Primary PCI received within 90 minutes of hospital arrival
Heart Failure Discharge Instructions
Pneumonia
Blood cultures performed in ED prior to initial antibiotic received in hospital
Healthcare-associated infections
Prophylactic antibiotic received within one hour prior to surgical invasion
Surgeries

40
Survey Measures
• Communication with Nurses
• Communication with Doctors
• Responsiveness of Hospital Staff
• Pain Management
• Communication About Medicines
• Cleanliness and Quietness of Hospital Environment
• Discharge Information
• Overall Rating of Hospital
40

41
Other Criteria for FY 2014
• Eight Hospital Acquired Condition Measures
₋ Foreign object returned after surgery
• AHRQ Patient Safety Indicators (PSIs), Inpatient Quality Indicators (IQIs), and Composite Measures
• Mortality measures
41

42
Greater Legal Flexibility
• Certified ACO presumed to be ‚clinically integrated‛ for antitrust purposes as so to permit single signature managed care contracting and will review under rule of reason standard
• Safety zone for market share in primary service area for each common service that is less than or equal to 30% in a geographic market defined as lowest number of postal zip codes where ACO participant draws at least 75% of its patients for that service
42

43
• Fraud and abuse waivers of Stark, Anti-Kickback and Civil Monetary Penalty laws
₋ Pre-Participation Waiver: Permits potential ACOs and ACO participants to share resources to start ACOs if the arrangement meets certain conditions
₋ Participation Waiver: Allows arrangements between the ACO, one or more ACO participants and/or ACO providers/suppliers if the arrangement meets certain conditions
₋ Shared Savings Waiver: Allows for distributions under the Shared Savings Program, subject to specified conditions, and for financial relationships among the ACO, ACO participants and ACO providers/suppliers directly related to participation in the Shared Savings Program
₋ Compliance with the Stark Law Waiver: Distribution of shared savings received by an ACO from CMS under the Shared Savings Program to or among ACO participants and ACO providers/suppliers, and activities necessary for and directly related to an ACO’s participation in the Shared Savings Program are waived from the Anti-Kickback Statue and the gainsharing portion of the CMP laws if such financial relationships fully comply with an applicable Stark Law exception
₋ Patient Incentives Waiver: Waives the application of the CMP provisions prohibiting inducement of beneficiaries and the Anti-Kickback Statute for items or services provided by an ACO, ACO participants or ACO providers/suppliers to beneficiaries for free or below fair market value if certain requirements are satisfied
Greater Legal Flexibility (cont’d)
43

Bundled / Episodic Payment

• Providers faces key strategic issues in its pursuit of payment bundles
₋ Aligning hospital and physician interests to achieve cost savings
₋ Creating an internal ‘funds flow’ model to share savings with physicians in a way that aligns with cost savings achieved
₋ Aligning other strategic growth initiatives and changes to clinical delivery models with changes to payment model initiatives
₋ Potentially integrating initiatives with commercial payers
₋ Extending bundling initiatives to new sites of care (post acute)
₋ Integrating financial outcomes with long range financial plan in a way that targets volume and unit reimbursement needs to maintain/grow margins
Bundling – Strategic Issues
45
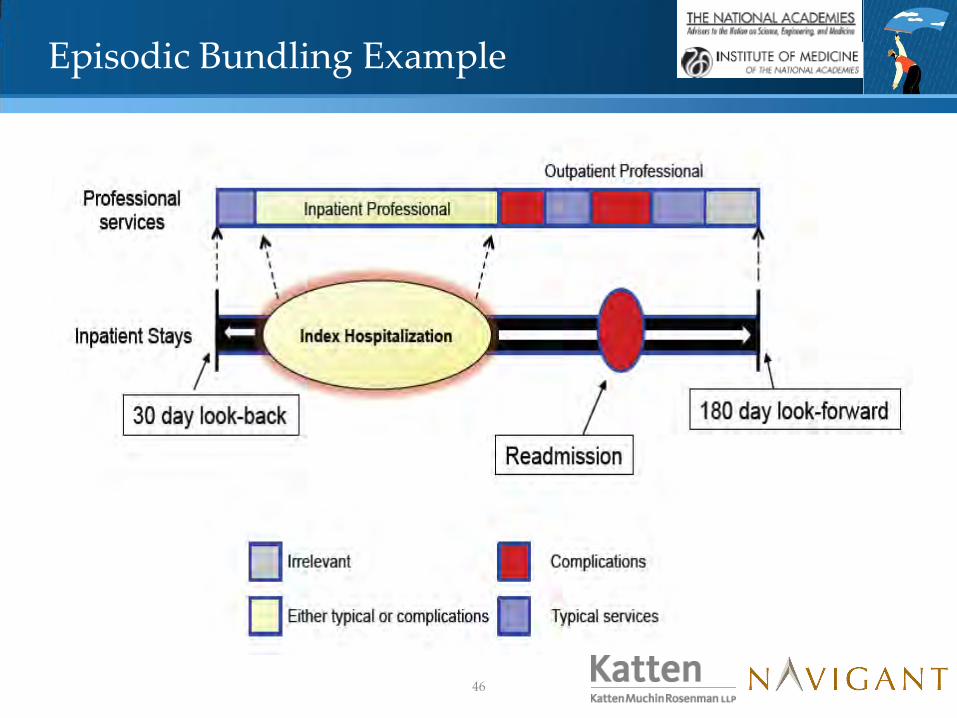
Episodic Bundling Example
46

Process Key Questions to Cover
Step 1 – Bundling Strategy: Scope the
opportunity, goals, rationale, etc.
Define the end goals (e.g., market share, margin, publicity, etc.?)
What are my options (patients, providers, etc.)?
Step 2 - Opportunity Assessment: Assess,
quantify and benchmark specific savings &
quality opportunities using several analytics
Where are the avoidable costs, complications?
What specific tactics exist in general to get the savings for each type of episode?
Step 3: Engage clinicians, operations,
finance to define the gaps and
requirements/mechanics to succeed
What operational gaps, clinical gaps, financial gaps exist?
What IT gaps exist? Coding and documentation gaps?
Step 4: Design specific, alternative bundle
prototypes which consist of payment levels,
payment methods, risk sharing, attribution,
clinical workflows, etc.
What factors will go into how you set payment levels for the bundle?
How/who will decide on a specific payment method (e.g., one fee schedule, multiple fee schedule,
metrics)?
How/when should upside/downside risk be incorporated into the model?
How could you risk adjust?
What patient attribution issues could arise, and how should they be handled?
How could bundled payments be adjudicated?
How could funds be distributed?
Step 5: Implement & Monitor What’s the checklist based on industry best practice?
What should the bundle performance dashboard contain (e.g., metrics), phase 1?
What other bundles (e.g., chronic) should be considered?
Who does what step, when?
Approach to Bundling
47

Step 1: Define Bundling Strategy
Consider the ‚Sweet Spots‛ on Your Reform Dash Board
Physicians (Employers. non)
Hospitals Other Providers
Ancillaries
Care Delivery Clinical Integration Investments
Medicare Patients
Health Insurance Products & Benefit Designs
Medicaid Patients
Information Technology & Other Infrastructure
Commercial
Organizational Design Investments Self Insured
New Payment Models, Contracts (P4P, episode vs. comprehensive bundles)
Data Analysis, Benchmarks
Year 1 Year 2 Year 3 Year 4
48

• Top Down, Bottom Up Assessment Approach
₋ Analysis #1: Classic top down PMPM trend driver analysis by product, population; includes analysis of utilization, unit cost, service mix & patient selection patterns to identify high level outliers; using payer data
₋ Analysis #2: Bottom up, provider-specific utilization, cost and service mix drill down by product, population using payer, MedPAR, cost report, NCI, Thomson Reuters data and groupers such as APR-DRG, APG for IP services
₋ Analysis #3: Cross-continuum IP/OP avoidable cost analysis using payer claims and groupers such as Prometheus
₋ Analysis #4: Physician Practice Variation Report, using claims data, registry data and clinical results
₋ Analysis #5: “Scenario Based” Margin Impact Analysis to directionally assess opportunities
Step 2: Assess the Opportunities
49

$1.4M
$1.2M
$0.9M
$0.7M
$0.0M $0.5M $1.0M $1.5M
DRG Department Opportunity Opportunity
per Case
246
DRG 246 Total $413,497 $4,923 02-ICU/CCU Accommodations
$231,450 $2,755
04-Pharmacy $84,890 $1,011 05-Supplies $36,370 $433 11-Cardiology $172,689 $2,056 Other ($111,901) ($1,332)
247
DRG 247 Total $2,431,347 $6,625 02-ICU/CCU Accommodations
$600,401 $1,636
04-Pharmacy $475,715 $1,296 05-Supplies $500,456 $1,364 11-Cardiology $1,009,188 $2,750 Other ($154,412) ($421)
248
DRG 248 Total $322,399 $6,860 02-ICU/CCU Accommodations
$172,495 $3,670
04-Pharmacy $44,356 $944 05-Supplies $102,259 $2,176 11-Cardiology $47,189 $1,004 Other ($43,901) ($934)
Sample: Savings Opportunity by Department
$2.4 M
$0.6 M $0.4 M $0.3 M
$0.0 M
$0.5 M
$1.0 M
$1.5 M
$2.0 M
$2.5 M
$3.0 M
247 249 246 248
Sample: Opportunity by DRG
11-Cardiology
02-ICU/CCU
05-Supplies
04-Pharmacy
Sample: IP Opportunity by DRG & Dept.
Step 2: Assess the Opportunities (cont.)
50

Discharge Planning
Utilization Review / Management
Quality Improvement
Disease Management
Case Management
Clinical Resource Mgmt (ancillary, pharmacy, supply)
Social Services
Clinical Reporting and Outcome Management
Car
e M
anag
emen
t S
ub
-P
roce
sses
Least
developed
Fully
developed
How Might You ‚Qualify‛/‛Quantify‛ Delivery Gaps to Justify Investment?
Step 3: Bundling Gap Analysis
51

Step 4: Design the Bundles
• Key Design Deliverables
₋ Program Description Document (PDD), including program goals, participation requirements, patient attribution, technology support, payment model approach, program metrics & scorecard
₋ Clinical Operations Manual with detailed clinical workflows, teams, roles/responsibilities, data flow/infrastructure, metrics – vetted through key physician practices
₋ Refined financial model used to price & contract the bundle with the payer
₋ Anticipated changes in resource utilization, input costs and service mix
₋ Risk adjustment/stratification
₋ Final PMPM (for comprehensive bundles) or episode-based prices with upside/ downside risk potential
52

Step 5: Implementation & Monitoring
• Develop the shared savings / gain sharing plan that distributes savings between the hospital and physician
Payer Hospital
Doctors
Savings
Pays
Sh
ared
Wit
h
• Based on agreed upon bundled price
•Quality metrics must be met to trigger payment
53

Four CMS Bundling Options to Consider
54

What’s the Response Been to Bundling?
• Reasons payers will adopt payment bundling ₋ Drives cost effectiveness and provides stronger outcomes (52%)
₋ Drives the ACO model to make providers more accountable for care quality (40%)
₋ Belief that payment bundle pricing would reduce medical cost (35%)
• Reasons providers will adopt payment bundling ₋ Government will mandate it (72%)
₋ Would increase quality and coordination of care (46%)
₋ Knowledge that it will be used selectively with predictable costs (38%)
• Payer concerns ₋ 40% Providers do not want to do payment bundling
₋ 40% Providers cannot distribute payment bundling
₋ 33% No ability to recognize & adjudicate payment bundles
• Provider concerns ₋ 52% Puts the provider at risk
₋ 49% Difficult to determine how to share gains/losses
₋ 36% Too difficult to accurately divide or unbundle each payment
*2010 Gantry Group quantitative study findings
55

56
Legal Issues for all Bundled Payment Initiatives
• Stark and state self-referral
₋ May be structured to satisfy risk-sharing, personal services or employment exceptions
₋ CMS may exercise waiver authority in connection with Medicare bundled payment initiatives
• Anti-kickback
₋ Legitimate bundled payment arrangements motivated by desire to improve quality and efficiency of care are unlikely to satisfy intent requirement
₋ CMS may exercise waiver authority in connection with Medicare bundled payment initiatives
• Gainsharing CMPs
₋ Will not apply to commercial-only arrangements
₋ CMS will allow gainsharing under Medicare bundled payment program announced last August if certain specific criteria are satisfied, including limits on amounts shared with physicians and lack of any reduction in medically necessary services
56

Legal Issues for all Bundled Payment Initiatives (continued)
• Antitrust
• Fee splitting
• Corporate practice
• Tax and tax exemption
57

58
Co-Management Models: A Vehicle to Facilitate Bundled Payment Initiatives
• Co-Management models vary in their structure, scope and compensation schemes, but share certain common characteristics:
₋ Physicians play major role in managing clinical service line operated by hospital
₋ Intended to drive more cost-effective care and improve clinical outcomes in a specific service line/specialty
₋ Hospital contracts with management entity (which may be existing physician group, physician-owned JV or physician-hospital JV)
₋ Hospital pays FMV service fee to management entity
₋ Typically include non-competition covenants
58

59
Scope of Services Under Co-Management Models
• There is tremendous variation in the scope of services provided under co-management models, which may include:
₋ Medical director services ₋ Clinical oversight and protocol development services (typically via committee
structure populated by physicians) ₋ Day-to-day management function, typically overseen by non-physician executive
director/administrator ₋ Non-physician staffing (clerical, nursing, PAs, techs) ₋ Disease state management programs ₋ Performance improvement activities (detailed on next page) ₋ Call/trauma coverage ₋ Input on strategic planning, facility planning, budgeting and marketing ₋ Leasing of expensive medical equipment ₋ Staff and community education/outreach
• In some cases, the management entity manages hospital, physician and
therapeutic services for a single disease state, regardless of site of service or provider (e.g., community cancer center management model)
59

60
Performance Improvement Activities Under Co-Management Models
• Co-management models often involve an array of performance improvement activities and a performance-based compensation component. Areas of focus typically include:
₋ Supply management
₋ Development of more rigorous vendor-selection criteria ₋ Product standardization ₋ Elimination of waste (using supplies only “as needed”)
₋ Quality improvement ₋ Clinical care guidelines and protocols ₋ Performance/quality metrics and targets based on benchmarks
₋ Cost containment initiatives ₋ Reduced ALOS ₋ OR efficiency ₋ Staffing efficiency
₋ Patient satisfaction
₋ Staff satisfaction
60

61
Regulatory Considerations
• Licensure, accreditation and Medicare standards limit authority that can be delegated to management entity
• Compensation must comport with FMV, fit risk sharing exception or qualify for waiver to avoid Stark and AKS problems ₋ If there is any variable compensation component, arrangement will not satisfy AKS
personal services safe harbor, which requires aggregate compensation during the contract term to be set in advance.
₋ As a result, variable compensation arrangements are subject to scrutiny to determine if “one purpose” is to incentivize or reward referrals.
₋ Per procedure fees may carry risk, unless there is a carve out for owner referrals or large component of manager costs are variable.
• Any gainsharing/quality improvement targets must be clearly defined, objectively verifiable and serve legitimate quality/efficiency goals to survive AKS ‚one purpose‛ scrutiny
61

62
Regulatory Considerations
• Waivers of gainsharing CMP will apply to CMS gainsharing initiatives.
• Otherwise, certain safeguards from CMP risk are necessary: ₋ Targets must be based on identifiable cost savings and quality improvement
opportunities that will not reduce the quality, level or amount of patient care. ₋ Safeguards against reductions in quality or withholding of medically appropriate
care are essential. ₋ Don’t compensate physicians for Medicare/Medicaid ALOS reductions. ₋ Patient disclosures and transparency reduce risk.
• IRS private inurement and private benefit proscriptions bar management
company from sharing in service line or department profits. ₋ In addition, if managed facility is financed with tax-exempt bond proceeds, Revenue
Procedure 97-13 limits agreement term and permissible compensation formula. ₋ Third party valuation of management services and board approval of contract terms
(including compensation) in accordance with rebuttable presumption of reasonableness standards will reduce risk.
62

63
Pros and Cons of Co-Management Models
PROS
• Drives close collaboration with physicians in key specialties.
• Can significantly improve clinical outcomes and patient satisfaction.
• May result in significant efficiencies and cost savings.
• May lay foundation for case rates and bundled pricing.
• Facilitates creation of “center of excellence” and may lift community standing of service line.
• Joint venture not required – can be purely contractual.
CONS
• Not an “across-the-board” strategy – must be replicated and customized to each service line.
• Requires significant physician time commitment and ongoing monitoring to ensure physicians devote requisite time/effort.
• Can be difficult – but not impossible – where a physician specialty is fragmented.
• Regulatory limits on “gainsharing.”
63

Patient Centered Medical Home

Primary Care Medical Home Model
• The PCMH model emphasizes strengthening and empowering primary care to coordinate care for patients across the continuum of care. The model promotes the utilization of enhanced resources—including electronic health records, patient registries, and increased patient education—to achieve the goal of improved .
• The PCMH does not offer explicit incentives for providers to work collaboratively to reduce costs and improve quality but calls specifically for primary care providers to take responsibility for coordinating care, requiring providers to have resources and established relationships with other providers to drive improvement.
65

PCMH Performance Measures
• Safety Outcomes
• Quality Outcomes
• Care Coordination
• Engaged Patients and Families
• Improved population health
• Decrease healthcare cost
• Reduce health disparities
• Ensure privacy and security
• Increase provider, staff and patient satisfaction
66

Potential Financial Implications
Program Implemented ER Visits Results Hospital Admission Results
Washington 1 -29% -11%
North Carolina 2 -16% -40%
Pennsylvania -14%
Minnesota -39% -24%
Michigan -50% -15%
Utah -10%
Maryland -15% -24%
1 Reduction in hospitalization was for ambulatory-care- sensitive conditions 2 40% decrease in hospitalizations for asthma only
While Payers and Providers are reporting significant cost savings, reports on the impact to the Providers margins are silent.
₋ Is the hospital able to reduce fixed and variable costs effectively and in conjunction with the loss in utilization.
67
Initial Reports of Cost Savings Reported
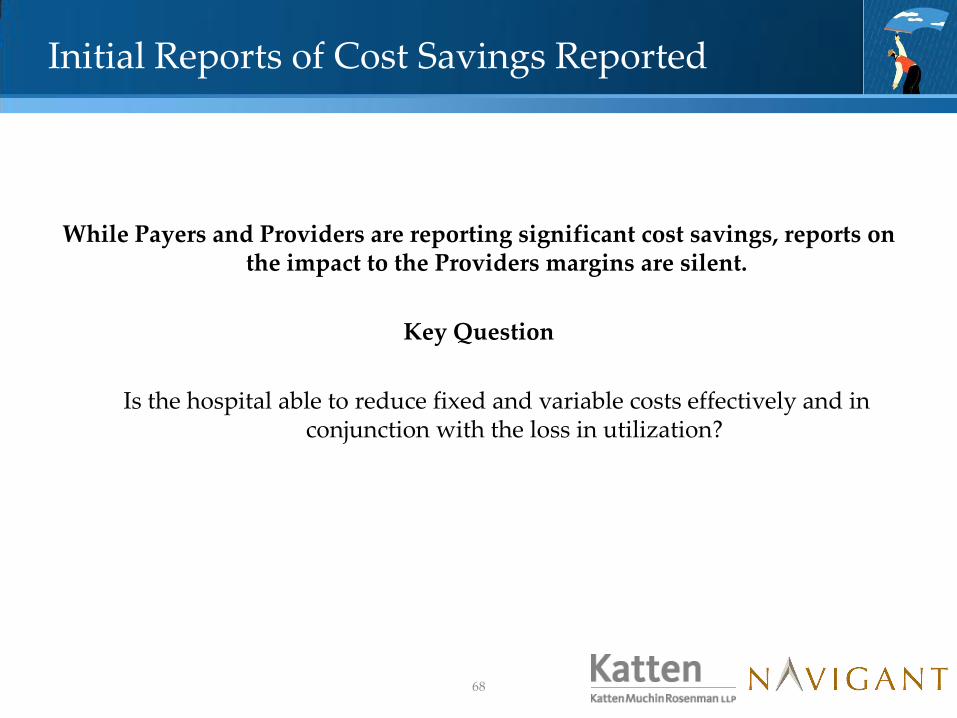
While Payers and Providers are reporting significant cost savings, reports on the impact to the Providers margins are silent.
Key Question
Is the hospital able to reduce fixed and variable costs effectively and in conjunction with the loss in utilization?
68

69
Legal Issues Associated with PCMHs
• State legislative initiatives addressing medical homes as of March, 2011, were introduced in 27 states. Approximately 10 states already have legislation on the books. Issues covered include: ₋ Eligibility requirements ₋ Certification ₋ Medicaid payments ₋ Provider requirements ₋ Quality and safety standards ₋ Patient participation ₋ Care coordination ₋ HIE/EHR requirements
69

70
Legal Issues Associated with PCMHs (cont’d)
• NCQA Patient Centered Medical Home Standards
₋ Must pass standards
Access during office hours
Use data for population management
Care management
Support self-care process
Track referrals and follow-up
Implement continuous quality improvement (see attached tables)
70

71
Legal Issues Associated with PCMHs (cont’d)
• Antitrust ₋ Tied to question of whether PCMH is part of a clinically integrated/financially
integrated network for managed care contracting purposes
₋ Which providers are included/excluded? Is this “economic credentialing?”
• HIPAA/HITECH ₋ Privacy protections, security protections, compliance plans, duty to disclose
breaches and use of business associate agreements
71

72
Legal Issues Associated with PCMHs (cont’d)
• Peer Review/Quality Confidentiality ₋ PCMHs and integrated networks are generating significant peer review, quality and
other data
₋ Most state confidentiality statutes only cover limited information; therefore, much of what is being generated may be discoverable
₋ Patient Safety and Quality Improvement Act of 2005 provides for creation of patient safety organizations (PSOs). Participation in a PSO allows for extremely broad protections at state and federal level for included peer review, quality and risk management information
72

73
Legal Issues Associated with PCMHs (cont’d)
• Professional Liability
₋ Professional negligence
₋ Apparent agency
₋ Corporate negligence
• Stark, Anti-Kickback, CMP
• Business of insurance
73

Final Comments

Shared Savings Lessons Learned to Date
₋
1. Don’t do Shared Savings in a vacuum
₋ Update your strategy to optimize margins, assuming lower unit
₋ reimbursement increases are in store
2. Frame key decisions, with the end in mind
₋ Identify potential patient populations
₋ Define your avoidable cost, mix, utilization, productivity, margin targets
₋ Which providers, affiliations create the critical mass?
₋ Define financial & incentive contract terms (e.g., funds flow, compensation, benefit design)?
₋ Delivery gaps, improvement & investment priorities?
3. Invest in the analytics to develop a rigorous ROI & “what’s in it for me?” messages
Requires identifying savings opportunities, then changing processes to deliver such savings
4. Make it real (e.g., selective shared savings, acute bundles, chronic bundles)
75

Panel Questions

Contact
77
Paul Butler, Associate Director
Navigant Healthcare
312.583.4176
Richard Bajner, Associate Director
Navigant Healthcare
312.583.3740
Michael R. Callahan, Partner
KattenMuchin Rosenman LLP
312.902.5634
kattenlaw.com/callahan/
Laura Keidan Martin, Partner
KattenMuchin Rosenman LLP
312.902.5487
kattenlaw.com/laura-keidan-martin/