volumetric arterial flow quantification using echo ...download.xuebalib.com/2jtjbj4cfxzw.pdf ·...
TRANSCRIPT

Uhamund m Med. & Bmi. Vol. 19, No. 6, pp. 447-460, 1993 Pnnted in the USA
0301-5629/93 $6.00 + .I0 0 1993 Pergamon Press Ltd.
@Original Contribution
VOLUMETRIC ARTERIAL FLOW QUANTIFICATION USING ECHO CONTRAST. AN IN VITRO COMPARISON OF THREE ULTRASONIC INTENSITY METHODS: RADIO FREQUENCY, VIDEO AND DOPPLER
KARL Q. SCHWARZ,+ GIAN PAOLO BEZANTE,~ XUCAI CHEN,+ JACK G. MOTTLEY+ and REINHARD SCHLIE~~
‘Department of Medicine, Cardiology Unit and the Center for Biomedical Ultrasound, University of Rochester, Rochester, NY, USA and $Clinical Research Division of Schering, AG, Berlin, Germany
(Received 4 January 1993; injinalform 16 March 1993)
Abstract-The two hypotheses presented in this paper are: (1) absolute and relative volumetric flow rates in vessels can be measured by echo contrast time-intensity curves; and (2) echo contrast time-intensity curves generated by different ultrasound backscatter intensity techniques have equivalent capability for flow measure- ments. A nonpulsatile flow system was built for quantitative ultrasound backscatter measurements from bolus echo contrast injections using two different volumes of mixing. A total of 49 echo contrast bolus injections were made at various flow rates (0.44-2.59 L/min). Ultrasound backscatter time-intensity curves were generated by ultrasound radio frequency, video and Doppler techniques. The rate of backscattered ultrasound intensity washout for each technique (WASHOUT RATE), and relative change in WASHOUT RATE (aWASHOUT RATE) were compared to the volumetric flow rate (FLOW) and changes in flow rate (aFLOW), respectively. The relationship between WASHOUT RATE, FLOW and the volume of contrast mixing was studied. A linear relationship was demonstrated between WASHOUT RATE and aWASHOUT RATE and the corresponding FLOW and aFLOW by all three methods (r > 0.90 for all comparisons). The WASHOUT RATE was found to depend on the FLOW and the volume of contrast mixing, but the aWASHOUT RATE was equal to the aFLOW and independent of the volume of mixing. Time-intensity curves can be generated from different ultrasound backscatter intensity tech- niques and the WASHOUT RATE correlates well with FLOW. aFLOW can be determined directly from the corresponding aWASHOUT RATE. Doppler ultrasound, because of its natural association with the assessment of flow in chambers and vessels, is uniquely suited to assessment of arterial volumetric blood flow in viva
Key Words: Volumetric arterial flow, Echo contrast, Ultrasound backscatter, Radio frequency, Video intensity, Doppler ultrasound.
INTRODUCTION
Normal arteries have little intrinsic resistance and the rate of blood flow is controlled by the blood pressure and the peripheral vascular resistance. When the pe- ripheral vascular resistance is reduced, normal arter- ies are capable of blood flow rates many times higher than those under basal metabolic flow conditions, even at the same blood pressure. As arterial atheroscle- rotic lesions develop, the intrinsic resistance of the artery increases, thus reducing the maximal flow re- serve of the vessel. Angiography is the most important diagnostic tool currently available for the detection,
Address correspondence to: Karl Q. Schwarz, M.D., BOX 679/Cardiology Unit, University of Rochester Medical Center, Rochester, NY 14642, USA.
447
localization and quantification of arterial lesions. Le- sions are usually characterized by their angiographic morphology and percent diameter stenosis. Simple ar- terial lesions greater than 75% diameter stenosis are typically considered “critical” or “significant,” as it is likely such lesions limit the flow reserve of the vessel (Gould et al. 1974, 1990; Levin et al. 1978). However, the hemodynamic significance of lesions producing subcritical or irregular stenoses cannot be determined by their angiographic appearance alone. Unfortu- nately, the angiographer is not able to easily assess the flow reserve of these borderline lesions to determine their hemodynamic significance and must rely on clinical criteria.
We present a contrast echo method for the quan- tification of arterial blood flow reserve easily adapt- able to current catheter-based ultrasound equipment

448 Ultrasound in Medicine and Biology
which is independent of the structural morphology of vascular lesions. Under certain conditions, the tech- niques described would apply equally well to the “noninvasive” assessment of arterial volumetric blood flow after intravenous administration of an echo contrast agent.
BACKGROUND
Echo contrast agents get their name from their ultrasound signal enhancing effects: echo images are brighter and Doppler signals are more intense. Micro- bubble contrast agents are contained entirely within the vascular space (Bommer et al. 198 l), travel at the same velocities as the blood flow (Shandas et al. 1990) and some formulations are of relatively stable compo- sition in the body at physiologic flow rates and pres- sures over a period of minutes (Lange et al. 1985; Rovai et al. 1987). These characteristics suggest that echo contrast agents would be useful in the assess- ment of blood flow using standard indicator-dilution techniques. In cardiology, much early work has fo- cused on the assessment of myocardial blood flow and specifically myocardial perfusion using video inten- sity measurements of sequential two-dimensional echo images of the myocardium. The process typi-
Echo Contrast Bobs l-l I I
Volume 19, Number 6, 1993
tally is based on video time-intensity curves from myocardial images after intracoronary (Berwing et al. 1986; DeMaria et al. 1980; Reisner et al. 1989) or intravenous (Berwing and Schlepper 1988; Dick et al. 1988b) bolus injections of echo contrast. Myocardial blood flow is estimated from various parameters of the myocardial video time-intensity curves. These ef- forts have had only marginal success in estimating myocardial blood flow due to limitations in all aspects of the technique: the contrast agent (Dick et al. 1988a; Feinstein et al. 1988; Monaghan et al. 1991; Schlief 199 1 ), microvascular hemodynamics (Christensen et al. 1988; Porter et al. 1991; tenCate et al. 1983) and the characteristics of the ultrasonic imaging and data analysis methods (Berwing et al. 1988; deJong et al. 1990; Monaghan et al. 1988; Ong et al. 1984; Wien- cek et al. 1990; Zwehl et al. 1984).
The use of indicator-dilution theory for the as- sessment of flow confined to tubes, such as arterial blood flow, is fundamentally different than that for organ perfusion. For flow confined to chambers and tubes, the concentration of an “indicator” substance will rapidly rise to a peak and then exponentially “wash out” of the system following a bolus injection (Fig. 1). The washout portion of the time-concentra-
Echo Contrast Concentration
- Mixing - 0 S
Chamber f log( INT) cr. - lx+ +log(A) 3 z
Fig. 1. Indicator-dilution washout curves. A bolus of indicator substance in a flow system confined to tubing (curve left) will have exponential washout characteristics from a chamber after mixing of the indicator into the diluent (upper curve right). The exponential washout curve is linearized when plotted on a semilogarithmic scale vs. time (lower curve right). The rate of indicator washout can be determined from the slope of the linearized portion of the semilogarithmic curve and is inversely proportional to the washout time constant. Symbols: INT = intensity of backscattered ultrasound (proportional to concentration of the echo contrast agent), A = scale factor, T = washout time constant (T is proportional to the flow rate and inversely proportional to the volume of mixing),
t = time.

Volumetric arterial flow quantification 0 K. Q. SCHWARZ et al. 449
tion or time-intensity curve is an exponential func- tion which can be linearized by plotting the indicator concentration (intensity) on a semilogarithmic scale vs. time. The slope or washout rate (WASHOUT RATE) of the linearized time-intensity curve is pro- portional to the inverse of the washout time constant (T) and is expressed by:
WASHOUT RATE a - 1 7’ (1)
The washout time constant is proportional to the mixing volume and inversely proportional to the volu- metric flow rate (FLOW):
T a mixing volume (mL) FLOW(mL/s) ’ (2)
Therefore, the WASHOUT RATE is proportional to FLOW, but also dependent on the inverse of the mix- ing volume
WASHOUT RATE a 1
- mixing volume
x FLOW. (3)
Unfortunately, without knowledge of the mixing volume (rarely known in in vivo settings) absolute vol- umetric flow rate cannot be calculated directly from the WASHOUT RATE. However, if the mixing vol- ume remains constant, such as between repeated in- jections of indicator into the same vessel, then relative changes in the rate of washout (dWASHOUT RATE) will equal the relative change in FLOW (aFLOW) be- tween injections:
WASHOUT RATE, FLOW,/mixing volume WASHOUT RATE, = FLOW,/mixing volume ’
GWASHOUT RATE = GFLOW. (4)
The most obvious clinical use of measuring relative changes in FLOW is in the assessment of arterial flow reserve.
METHOD
General To find out if FLOW and aFLOW within tubes
can be determined by measurement of contrast echo time-intensity curves, we measured the backscattered ultrasound intensity from a flow system after echo contrast bolus injections were made at various flow
rates. The backscattered ultrasound intensity was measured in four ways by three different ultrasound intensity techniques: (1) the scattered ultrasonic radio frequency intensity, (2) the brightness of the echo image (video intensity), and (3) the intensity of the audio pulsed wave Doppler signal as obtained by two different types of pulsed wave Doppler machines-a standard transcutaneous device and an intravascular Doppler probe. The WASHOUT RATE of each time- intensity curve, as determined by the different ultra- sound backscatter techniques, was then compared to the FLOW. Relative changes in WASHOUT RATE and FLOW were also compared to determine the abil- ity of contrast echo to measure flow rate changes (anal- ogous to the determination of vascular flow reserve in vivo).
Flow model All measurements were made in a flow system
consisting of plastic tubing 0.953 cm internal diame- ter ($ inch) and chambers fed by a large elevated reser- voir of room temperature Tyrode solution as a blood substitute (Fig. 2). Tyrode solution is a transparent crystalloid fluid of the following composition: 0.8% NaCl, 0.1% NaHCO,, 0.005% NaH,PO,, 0.02% KCl, 0.02% CaCl,, and 0.0 1% MgCl,. The reservoir was drained by gravity to produce nonpulsatile flow at rates from 0.44 to 2.59 L/min and the Tyrode solu- tion was not recirculated. This range of flow rates corresponds to mean flow velocities between 10.4 to 60.5 cm/s, well within clinically relevant flow veloci- ties (examples: mitral valve flow and flow within the carotid arteries) and out of the range of the low veloc- ity (“wall”) and high velocity (“anti-aliasing”) filter of the unit. The flow rate was measured with an ultra- sonic flow meter (Transonic Systems, Model TlO 1, Ithaca, NY, USA), which has +7% absolute and +2% relative flow accuracy in this range (these manufac- turer statistics were confirmed in our laboratory). All of the experimental chambers were located the same distance below the reservoir, fixing the pressure in the chambers to 100 mmHg. Bolus injections of echo contrast were made through a side port in the tubing just proximal to a custom designed ultrasound mix- ing/imaging chamber. Plastic vanes at the proximal end of the chamber fully mixed the echo contrast into the Tyrode solution before echo imaging through a thin plastic film window at the distal end of the chamber. Two different mixing/imaging chambers (A and B) were used; each was constructed from a plastic cylinder of 2.54 cm (1 inch) internal diameter. The volume of the mixing chamber was controlled by the length of the plastic cylinder; chamber A was 69 mL and chamber B was 30 mL. Doppler recordings were

450 Ultrasound in Medicine and Biology Volume 19, Number 6, 1993
Digitizer -
Waste
I
Pedoff Audio Doppler
lntrovosculor Audio Doppler
Fig. 2. Experimental setup. A 100 L static reservoir of a crystalloid solution was drained by gravity to produce a steady flow rate and pressure in a system of plastic tubing and chambers. The volumetric flow rate was controlled with a tubing clamp and measured with an ultrasonic flow meter. Bolus echo contrast injections (1 mL SH U 508A at 200 mg/mL concentration) were made by hand into the system just proximal to a combination mixing and ultrasonic imaging chamber. The contrast flowing through the chamber was imaged by conventional M- mode echocardiography. The M-mode video images were recorded on a high-fidelity video cassette recorder (HiFi VCR) and the radio frequency (RF) ultrasonic backscatter from the imager was digitized and stored to computer disk. A Pedoff-style Doppler probe (in pulsed wave Doppler mode) was positioned just after the mixing/imaging chamber in a specially designed plastic holder. This was followed by an intravascular pulsed wave Doppler probe positioned within the tubing. The audio output from both Doppler machines was recorded on separate audio
channels of the same HiFi VCR used for recording of the M-mode images.
made from the fluid flowing within the tubing just after the ultrasonic mixing/imaging chamber. The spe- cifics of ultrasound radio frequency, imaging video intensity and the Doppler measurements are de- scribed below.
Echo contrast protocol A stabilized galactose-based microbubble echo
contrast agent (SH U 508A, Schering, AG, Berlin, Germany) was used for all recordings. The agent was mixed and diluted with water to 200 mg/mL concen- tration according to the manufacturer’s instructions.+
+ The SH U 508A was supplied as dry coarse granules in a glass vial. Diluent fluid (distilled water) was added to a vial and shaken for 10 s. The vial was then allowed to stand for 2 min. The concentration of echo contrast was determined from the reconsti- tuted galactose concentration.
A total of 49 bolus injections, each 1 mL of the 200 mg/mL concentration SH U 508A, were made from 6 different freshly reconstituted vials of the agent, 26 using chamber A and 23 using chamber B. Each bolus injection was made according to the following proto- col: the overall volumetric flow rate in the system was chosen randomly and adjusted with a tubing clamp; an injection of echo contrast was then made by hand into the system and the contrast effect was monitored with imaging and Doppler ultrasound; once the con- trast effect dissipated, the flow rate was readjusted and the protocol repeated. The same vial of echo contrast was used until it was exhausted (about 8 injections) and then a fresh vial was reconstituted. The agent was not allowed to “stand” for a prolonged period after preparation and in all cases the final injection was completed within 15 min following reconstitution.

Volumetric arterial flow quantification ??K. Q. SCHWARZ et al. 451
Imaging acquisition Ultrasonic imaging was performed with a system
equipped with a 2.5 MHz transducer (Sonos 100, Hewlett-Packard, Andover, MA, USA). In addition to producing conventional echo images, the Sonos 100 was modified to allow access to the received “ra- dio frequency” ultrasound signal directly from the transducer and before extensive on-board signal pro- cessing (such as log compression). The acoustic trans- mit power and image processing adjustments were set for the optimal image before the first injection and kept constant throughout the study.
Two-dimensional echo was used to align the M- mode cursor line through the widest section of the mixing/imaging chamber in the transverse view (Fig. 2). A M-Mode image was then recorded at 100 mm/s chart speed on a high-fidelity video cassette recorder (HiFi VCR) (Sony Corp., Tokyo, Japan) for later video intensity analysis. The radio frequency signal, received by the ultrasound transducer and used by the Sonos 100 to create the M-mode image, was simulta- neously digitized in real-time at a rate of 20 MHz and 8 bit precision (LeCroy Model 9430, Chestnut Ridge, NY, USA). The digitized radio frequency M-mode scan lines were stored directly to magnetic computer disk at a rate of approximately 25 radio frequency (M-mode) scan lines per second.
Determination of echo video intensity The videotaped M-mode image was digitized and
analyzed for video intensity using commercial soft- ware (Java, Jandel Scientific, Corte Madera, CA, USA). The mean video intensity within the imaging chamber was calculated in a rectangular region of in- terest extending between the inside surfaces of the chamber and lasting approximately 0.333 s. Video in- tensity measurements from within the chamber were made for at least 3 s before the appearance of the echo contrast bolus and then throughout the duration of the contrast effect at a rate of 3 mean video intensity measurements per second. A precision phantom with 8 different cones of known scattering properties (ATS Instruments, Stanford, CT, USA) was imaged sepa- rately and used to convert the video intensity measure- ments to a calibrated ultrasound intensity scale in decibels.
Determination of ultrasonic radio frequency intensity The digitized ultrasonic radio frequency wave-
forms were analyzed using a computer-based system (Macintosh IICi, Apple Computer, Cupertino, CA, USA) with commercial and custom software (Lab- View II, National Instruments, Austin, TX, USA). Each radio frequency waveform, representing the ul-
trasound signal used to create one M-mode scan line, was analyzed for intensity within the same region of interest as the video intensity measurements dis- cussed above. The intensity of the radio frequency signal was calculated from the square of the root mean square (RMS) voltage for each scan line (units: mV2) and converted to decibels according to the fol- lowing formula: INTENSITY (in decibels) = 10 Log [INTENSITY (in mV2)]. There were approximately 25 radio frequency scan lines (complete M-mode traces) for analysis per second. Like the video inten- sity measurements, the radio frequency intensity mea- surements were made before and throughout the washout phase of each bolus injection of the echo contrast agent.
Doppler acquisition Pulsed wave Doppler measurements were made
in two locations in the plastic tubing just distal to the mixing/imaging chamber using commercially avail- able unmodified Doppler equipment. In one location, a 2.5 MHz nonimaging Pedoff-style Doppler probe was used in pulsed wave mode (VingMed SD 200, Hoi-ten, Norway) and held at a 30” angle to the flow in a custom plastic holder. The sample volume was set to the minimum size for the instrument (1 mm) and positioned at the center of the tubing. The acoustic transmit power of the VingMed instrument was not adjustable and therefore constant for all measure- ments. An acoustic attenuator (a plastic disk) was po- sitioned between the face of the ultrasound probe and the sample volume to bring the Doppler signal from the echo contrast (an intense scatterer of ultrasound) into the dynamic range of the instrument, which was designed to detect weak scatterers (blood) within a strong acoustic attenuator (the body). The same at- tenuator was used for all measurements. The Doppler gain and compression were set at their minimum level (only the former affects the Doppler audio signal). The second pulsed wave Doppler system was a 20 MHz nonimaging intravascular Doppler catheter/ probe just distal to the aforementioned Pedoff probe (catheter/probe manufacturer: NuMed, Inc., Hop- kinton, NY, USA: Doppler machine manufacturer: Triton Technology, San Diego, CA, USA). The Doppler catheter entered the tubing through a side arm using a standard clinical vascular-lock, which also served to anchor the catheter in position. The tip of the catheter was freely floating near the center of the tubing, held in place by the stiffness of the cath- eter. The intravascular Doppler sample volume was set to the minimum size (0.5 mm) and the Doppler gain was set to the minimum setting. The Doppler sample volume was adjusted to be as near to the

452 Ultrasound in Medicine and Biology Volume 19, Number 6, 1993
center of the tubing as possible and still maintain a high quality signal. The angle between the long axis of the intravascular probe and the Doppler beam was 45” (set by the manufacturer of the probe). The intra- vascular Doppler catheter was aligned as closely as possible to the center of the tube lumen. Like all intra- vascular devices, the exact angle between the Doppler beam and the flow velocity vector can only be esti- mated. Unlike the Doppler frequency shift (flow veloc- ity), the Doppler intensity from point scatterers (like echo contrast) is independent of the angle of interro- gation.
The audio output of both Doppler units, each representing a mixture of the forward and reverse Doppler flow signals, was recorded on the two sepa- rate audio channels of the same HiFi VCR used to record the M-mode video of the mixing/imaging chamber, as described above (Fig. 2). The automatic audio gain control was inactivated for all recordings and this HiFi VCR was shown in our laboratory to have a flat frequency response from 20 to 20,000 Hz and to have greater than 60 dB of dynamic range at 1000 Hz.
Determination of Doppler intensity A data acquisition system was used to analyze
the intensity of the audio Doppler signal. The system consisted of a computer (Macintosh II ci, Apple Com- puter Corp., Cupertino, CA, USA), with three special- ized boards (National Instruments, Austin, TX, USA): a 2-channel 16-bit audio bit frequency digitizer (NB A2 100) for acquisition of the Doppler audio sig- nals, a high speed data buffer (DMA 2800), and a digital signal processor (DSP 2300) for real-time analy- sis of audio intensity and frequency spectrum. Cus- tom and commercial software (LabView II, National Instruments, Austin, TX, USA) were used. This data acquisition system has been shown in our laboratory to have a flat frequency response from 20 to 20,000 Hz and to have greater than 65 dB of dynamic range at 1000 Hz.
The audio Doppler signal was digitized at a rate of 24 kHz (24,000 voltage measurements/second). Digitized data sets of 1024 samples in length ( 1024 consecutive individual voltage measurements) were analyzed for the RMS voltage. The audio Doppler intensity was then calculated from the square of the RMS voltage. There were approximately 12 audio in- tensity measurements per second, as the data acquisi- tion system was only capable of processing every other data set in real-time. The audio intensity (in mV’) was converted to decibels by the same method as noted above for the radio frequency intensity.
Determination of acousticjeld intensity The intensity of the acoustic field produced by
each of the three different transducers was measured using a needle-type hydrophone (NTR Systems, Inc., Seattle, WA, USA) calibrated to 12 MHz. The active element of the hydrophone was 0.5 mm in diameter and was submerged in a water tank. The acoustic field of each transducer was measured individually and the reported values are the mean of 10 measurements. The face of the needle probe was positioned parallel to the face of the transducer and in line with the peak acoustic pressure. The distance between needle hy- drophone and Doppler transducer was the same as between the Doppler transducer and echo contrast in the flow system. The same acoustic attenuator (plastic disk) from the contrast measurements was positioned between the transducer face and the needle hydro- phone. The VingMed SD200 produced a 1.95 MHz ultrasound tone burst with a spatial-peak temporal- peak intensity (Zsmp) of 1.11 + 0.005 W/cm’, spatial- peak pulse-average intensity (ZsPPA) of 0.747 + 0.000 1 W/cm’ and a pulse duration of 4.7 1 + 0.005 ps. The Hewlett-Packard Sonos 100 produced a 2.54 MHz ul- trasound chirp with a Z,,,, of 200.4 -t 3.134 W/cm’, Z sPPA of 39.2 + 0.103 W/cm2 and a pulse duration of 0.757 f 0.027 1s at the 99% power output setting used throughout this investigation. The NuMed intravascu- lar Doppler probe produced a 20.3 MHz tone burst lasting 0.426 of: 0.03 PLS, but the Zsmp and Z,,,, could not be directly measured due to the signal’s high fre- quency. It is likely the intensity of this signal is low given the small size of the transducer (approximately 1 mm). The pulse duration was defined as 1.25 times the time interval required for the acoustic pulse inten- sity integral to increase from 10% to 90% of its maxi- mum value. All the transducer parameters were cal- culated as defined by the American Institute of Ultra- sound in Medicine (AIUM) standard.
Data and statistical analysis Echo contrast video, radio frequency and
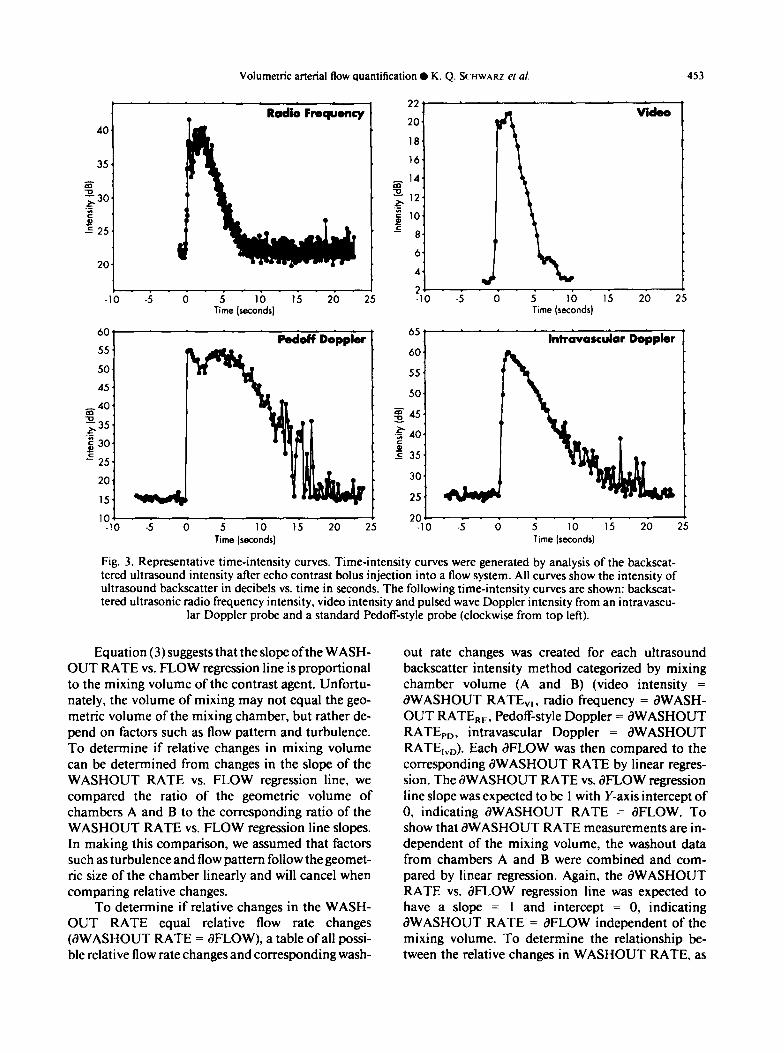
Doppler time-intensity curves were generated at each flow rate and plotted vs. time after conversion of the scattered ultrasound intensity to decibels (Fig. 3). The WASHOUT RATE for each echo contrast bolus (units: dB/s) was calculated for the different scat- tered ultrasound intensity techniques: WASHOUT RATE,,, WASHOUT RATE,, , WASHOUT RATE,, > and WASHOUT RATE,,, (radio fre- quency, video, Pedoff Doppler and intravascular Doppler WASHOUT RATE, respectively). Each WASHOUT RATE was then compared to the corre- sponding flow rate by linear regression after categori- zation by mixing volume (chambers A and B).
Volumetric arterial flow quantification 0 K. Q. QHWARZ ef al. 453
40.
Radio Frequency 22. .
VidOo
35.
L: ,
20
18
16
z z 14
$30
:
1
g
P E
l2 !..k..
10
= 25. L
I 4 8
6 20
4 L 2 _ :
-10 -5 0 5 10 15 20 25 -10 -5 0 5 10 15 20 25 Time (seconds) Time (seconds)
604
55.
50,
45.
_&_40. g35
E 30. p! =
25.
??
podoff Doppler 65’ Intravascular Doppler 60.
55.
50.
g 45.
240. c e 35,
20, 30.
15. 25.
101 I 201 1 -10 -5 0 5 10 15 20 25 -10 -5 0 5 10 15 20 25
Time (seconds) Time (seconds)
Fig. 3. Representative time-intensity curves. Time-intensity curves were generated by analysis of the backscat- tered ultrasound intensity after echo contrast bolus injection into a flow system. All curves show the intensity of ultrasound backscatter in decibels vs. time in seconds. The following time-intensity curves are shown: backscat- tered ultrasonic radio frequency intensity, video intensity and pulsed wave Doppler intensity from an intravascu-
lar Doppler probe. and a standard Pedoff-style probe (clockwise from top left).
Equation (3) suggests that the slope ofthe WASH- OUT RATE vs. FLOW regression line is proportional to the mixing volume of the contrast agent. Unfortu- nately, the volume of mixing may not equal the geo- metric volume of the mixing chamber, but rather de- pend on factors such as flow pattern and turbulence. To determine if relative changes in mixing volume can be determined from changes in the slope of the WASHOUT RATE vs. FLOW regression line, we compared the ratio of the geometric volume of chambers A and B to the corresponding ratio of the WASHOUT RATE vs. FLOW regression line slopes. In making this comparison, we assumed that factors such as turbulence and flow pattern follow the geomet- ric size of the chamber linearly and will cancel when comparing relative changes.
To determine if relative changes in the WASH- OUT RATE equal relative flow rate changes (aWASHOUT RATE = dFLOW), a table of all possi- ble relative flow rate changes and corresponding wash-
out rate changes was created for each ultrasound backscatter intensity method categorized by mixing chamber volume (A and B) (video intensity = aWASHOUT RATE,,, radio frequency = aWASH- OUT RATE,,, Pedoff-style Doppler = aWASHOUT RATE,,, intravascular Doppler = aWASHOUT RATE,,.,). Each JFLOW was then compared to the corresponding aWASHOUT RATE by linear regres- sion. The aWASHOUT RATE vs. aFLOW regression line slope was expected to be 1 with Y-axis intercept of 0, indicating aWASHOUT RATE = aFLOW. To show that aWASHOUT RATE measurements are in- dependent of the mixing volume, the washout data from chambers A and B were combined and com- pared by linear regression. Again, the aWASHOUT RATE vs. aFLOW regression line was expected to have a slope = 1 and intercept = 0, indicating aWASHOUT RATE = aFLOW independent of the mixing volume. To determine the relationship be- tween the relative changes in WASHOUT RATE, as
454 Ultrasound in Medicine and Biology Volume 19, Number 6, 1993
calculated by the different techniques, a correlation matrix was calculated for dWASHOUT RATE,,, dWASHOUT RATE,, , dWASHOUT RATE,,, aWASHOUT RATE,,, and aFLOW.
Classic indicator-dilution theory, as presented in the introduction, depends on three assumptions re- lated to the indicator agent: ( 1) the “indicator” is con- fined to the flow system, (2) additional indicator is not added after the initial bolus injection, and (3) the indi- cator is stable throughout the period of data acquisi- tion. All of these assumptions are easily satisfied by microbubble echo contrast agents, except for the last requirement. It is well known that echo contrast agents “decay” when exposed to pressure (Shapiro et al. 1990). According to eqn (3) the Y-axis intercept of the WASHOUT RATE vs. FLOW regression line should pass through zero, that is, at a zero flow rate, the concentration (or scattering intensity) of the indi- cator (the echo contrast) should be constant, resulting
. Radio Frequency
- 1. =s g-2.
Y >- 3. -0 al - 4. 5 z _ 2 5. o\o AZ a - 6. 3 ‘B\,
- 7. O9
-a* > -t 0 .5 1 1.5 2 2.5 3
Flow Rate (liters/minute)
o* - . . bJ Pedoff Doppbr
-1. % g-2. 0 s-3. yo_ Q)- 4. '0, A "-5. 5.
d Go0
\ \
\.
0 .5 1 1.5 2 2.5 3 Flow Rate (liters/minute)
in a zero washout slope. A nonzero Y-axis intercept indicates that the echo contrast agent’s scattering properties are fundamentally changing with time, most likely due to decay of the microbubbles. The decay rate of the echo contrast was determined from the Y-axis intercept of the WASHOUT RATE vs. FLOW regression line for each chamber and back- scatter intensity method. The WASHOUT RATE val- ues were then corrected for the rate of echo contrast decay and the relationship between dWASHOUT RATE and dFLOW was recalculated.
Statistical analyses (linear regression, calculation of r andp values and the creation of correlation tables) were performed by computer with commercial soft- ware (Statistics/Mac, Statsoft, Tulsa, OK, USA).
RESULTS
High quality time-intensity curves were gener- ated by each of the ultrasound backscatter intensity
f- 2 G- 3
5. 0%
\b 6. \",o
PO 7. \
f- 2 8- 3
V. .i 1’ 0 1.s i 2.5 i Flow Rate (liters/minute)
01 .\’ . - . . intravascular Doppler
c
1.
6. J
7. 0' \ 1
V.
0 .i i 1.5 i 2:s 3 Flow Rate (liters/minute)
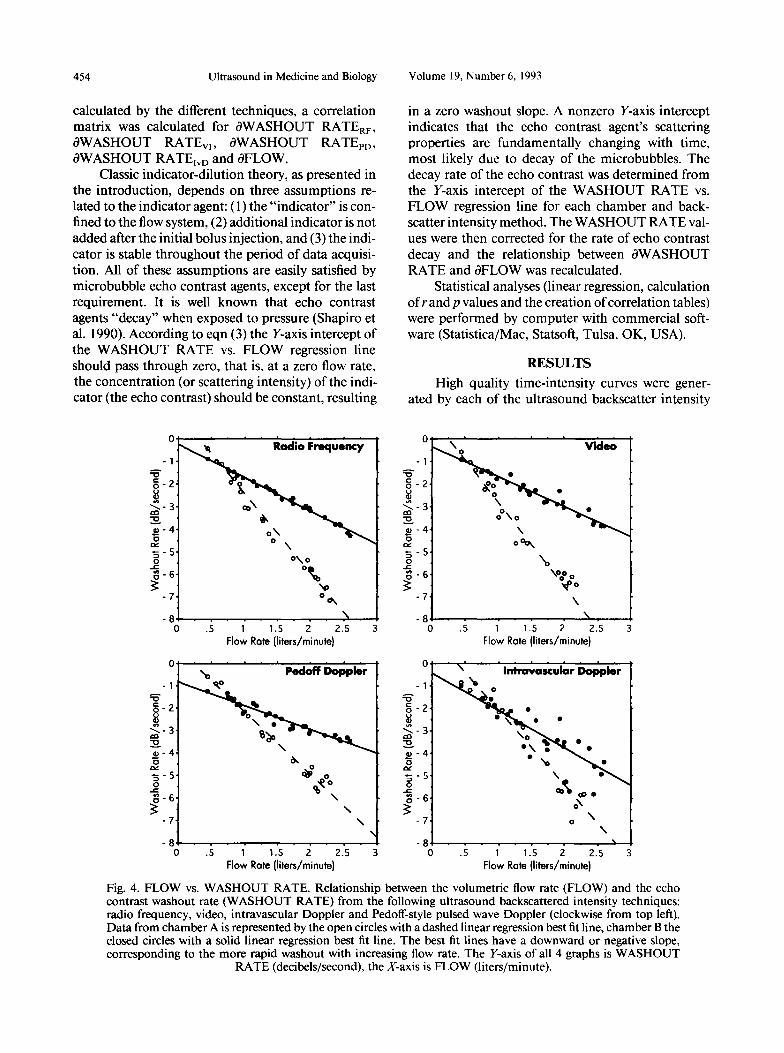
Fig. 4. FLOW vs. WASHOUT RATE. Relationship between the volumetric flow rate (FLOW) and the echo contrast washout rate (WASHOUT RATE) from the following ultrasound backscattered intensity techniques: radio frequency, video, intravascular Doppler and Pedoff-style pulsed wave Doppler (clockwise from top left). Data from chamber A is represented by the open circles with a dashed linear regression best fit line, chamber B the closed circles with a solid linear regression best fit line. The best fit lines have a downward or negative slope, corresponding to the more rapid washout with increasing flow rate. The Y-axis of all 4 graphs is WASHOUT
RATE (decibels/second), the X-axis is FLOW (liters/minute).

Volumetric arterial flow quantification 0 K. Q. SCHWARZ et al. 455
techniques (Fig. 3). The WASHOUT RATE of each time-intensity curve was calculated and compared to the corresponding FLOW. A linear relationship was found when comparing WASHOUT RATER,, WASHOUT RATE,,, WASHOUT RATE,, and WASHOUT RATE,,, to FLOW for both chambers A and B (Fig. 4). The correlation matrix between the WASHOUT RATE of each time-intensity curve and the FLOW is shown in Table 1. Excellent linear corre- lation between WASHOUT RATE and FLOW was found by all methods, as well as between the various WASHOUT RATES, as determined by the different methods.
The ratio of the geometric volume of chambers A and B was compared to the corresponding ratio of the slopes of the WASHOUT RATE vs. FLOW regres- sion lines for each backscattered ultrasound intensity technique. The ratio of geometric volumes of chambers A and B was 69 mL/30 mL or 2.30, which was within one standard deviation (SD) of the average inverse ratio of WASHOUT RATE vs. FLOW regres- sion line slopes for the different backscattered ultra- sound intensity techniques, 2.48 + 0.37 (mean of the four methods + 1 SD): 2.32 + 0.05 (radio frequency), 2.87 t 0.03 (video), 2.62 f 0.09 (Pedoff-style Doppler), and 1.99 +- 0.22 (intravascular Doppler).
The Y-axis intercept of the WASHOUT RATE vs. FLOW regression line was very small, but nonzero for all techniques (see Fig. 4). This indicated that the scattering properties of SH U 508A are relatively stable at 100 mmHg, but that there is a slow decay rate. Each individual WASHOUT RATE value was
corrected for this nonflow dependent decay factor and the dWASHOUT RATE and aFLOW table was recal- culated for each chamber. There were 338 dWASH- OUT RATE and aFLOW pairs for chamber A and 264 for chamber B.
A linear relationship was found by all ultrasound backscatter intensity techniques when comparing aWASHOUT RATE to dFLOW (Fig. 5). Further, the dWASHOUT RATE values, as calculated by the dif- ferent techniques all correlated well with one another (Table 2). The slope of the dWASHOUT RATE vs. aFLOW linear regression line was not significantly different than one (the line of identity) by all tech- niques, nor was the Y-axis intercept of the regression line significantly different than zero (Table 3). Unlike when comparing WASHOUT RATE to FLOW, the dWASHOUT RATE vs. dFLOW relationship was in- dependent of the mixing volume.
DISCUSSION
High quality (low noise) echo contrast time-in- tensity curves were generated by each of the three ul- trasound backscatter techniques investigated (see Fig. 3). The overall shape of the curves are similar, but the dynamic range and duration of contrast effect are dif- ferent. This is likely due in part to the character and frequency of the ultrasonic signal transmitted by the three different ultrasound machines investigated in this report, as well as differences in the processing of the received signals for the Doppler compared to the imaging machines.
Table 1. Correlation table (r value) between washout rate of the echo contrast time-intensity curve and the flow rate by the different ultrasound backscatter intensity methods using chambers A and B.
CHAMBER A
Variable: r value
FLOW WASHOUT RATE,. WASHOUT RATE,, WASHOUT RATE,,, WASHOUT RATE,,
WASHOUT WASHOUT WASHOUT WASHOUT FLOW RATE,, RATE,, RATE,, o RATE,,,
1.000 -0.996 -0.967 -0.873 -0.975 -0.996 1.000 0.954 0.865 0.97 I -0.967 0.954 1 .OOo 0.849 0.956 -0.873 0.865 0.849 1.000 0.910 -0.975 0.97 I 0.956 0.910 1.000
CHAMBER B
Variable: WASHOUT WASHOUT WASHOUT WASHOUT r value FLOW RATE,, RATE,, RATE,,, RATE,,,
FLOW 1 .ooo -0.992 -0.878 -0.976 -0.973 WASHOUT RATE,, -0.992 1.000 0.982 0.96 I 0.975 WASHOUT RATE,, -0.988 0.982 I .OOO 0.977 0.947 WASHOUT RATE,,, -0.976 0.96 I 0.977 1.000 0.921 WASHOUT RATE,, -0.973 0.975 0.946 0.922 1.000
FLOW = volumetric flow rate; WASHOUT RATE = washout rate of the time-intensity curve from the following ultrasound signal types: RF = radio frequency, PD = Pedoff-style Doppler probe, IvD = intravascular Doppler probe, and VI = video intensity.

456 Ultrasound in Medicine and Biology Volume 19, Number 6, 1993
6
0 0 12 3
mow R4ate 5 6 7
6 6
0 0 0 12 3 4 5 6 0 12 3 4 5 6 7
GFlow Rate GFlow Rate
Fig. 5. aFLOW vs. dWASHOUT RATE. Relationship between relative changes in volumetric flow rate (dFLOW) and the corresponding changes in the time-intensity washout rate (aWASHOUT RATE) by the following ultra- sound backscattered intensity techniques: radio frequency, video, intravascular Doppler and Pedoff-style Doppler (clockwise from top left). Data from chamber A is represented by the open circles with a dashed linear regression best fit line, chamber B the closed circles with a solid linear regression best fit line. The Y-axis of all 4 graphs is
aWASHOUT RATE. the X-axis is dFLOW. Both axes represent relative changes and are therefore unit-less.
6
0 12 3 4 5 6 7 Glow Rate
The Sonos 100, used for the radio frequency and video time-intensity curves, produced a shorter and higher amplitude chirp compared to the longer and lower amplitude tone burst of the VingMed’s Pedoff probe and the intravascular Doppler probe (Fig. 6). The intravascular Doppler probe also produced a rela- tively long tone burst, but at 20 MHz compared to 2.5 MHz for both the Sonos 100 and VingMed units. This difference in frequency likely accounts for the slight difference in shape of the intravascular Doppler-gen- erated echo contrast time-intensity curve compared to the other three curves due to differences in ultra- sound scattering from the microbubbles at the two frequencies. Despite this difference, the shape of the washout portion of the echo contrast time-intensity curves generated by the different techniques are nearly identical, only the dynamic range and duration of contrast effect for the Doppler machines are differ- ent from the imaging machine (Fig. 3). The greater dynamic range and duration of contrast effect of the
Doppler machines are likely due to fundamental dif- ferences in Doppler signal processing compared to ul- trasonic imagers and in technical differences in data acquisition and processing. For example, Doppler in- struments are much more sensitive than imaging sys- tems to low intensity moving scatterers such as blood cells flowing within cardiac chambers and vessels, but the same areas appear “black” (i.e., weak scattering) on two-dimensional images. This “background” sub- traction of nonmoving ultrasonic reflections by the Doppler machines may account for a large part of their greater dynamic range compared to imaging sys- tems. The digital data acquisition system used for the processing of the audio Doppler signals also had a greater dynamic range ( 16 bit vs. 8 bit for both the RF and video digitizers).
The smoothest time-intensity curves were gener- ally produced by the radio frequency and video meth- ods compared to the Doppler techniques (see Fig. 3). This was likely due to study methodology: the radio

Volumetric arterial flow quantification 0 K. Q. SCHWARZ ef al. 457
Table 2. Correlation table (r value) between relative changes in the echo contrast time-intensity curve washout rate and the corresponding changes in volume flow rate.
CHAMBER A
Variable: r value
aFLOW aWASHOUT RATE,, aWASHOUT RATEr, aWASHOUT RATE,,, aWASHOUT RATE,,
aFLOW
1 .ooo 0.996 0.953 0.92 I 0.980
aWASHOUT aWASHOUT aWASHOUT aWASHOUT RATE,, RATE,, RATE,,, RATE,,
0.996 0.953 0.92 1 0.980 1.000 0.944 0.918 0.979 0.944 1.000 0.882 0.927 0.918 0.882 1.000 0.941 0.979 0.927 0.94 I 1.000
CHAMBER B
Variable: r value
aFLOW aWASHOUT RATE,, aWASHOUT RATEr, G’WASHOUT RATE,,, aWASHOUT RATE,,
aFLOW
1.000 0.990 0.992 0.950 0.980
aWASHOUT aWASHOUT aWASHOUT aWASHOUT RATEar RATE,, RATE,,, RATE,,
0.990 0.992 0.950 0.980 1 .ooo 0.986 0.923 0.984 0.986 1 .ooo 0.948 0.97 I 0.923 0.948 1.000 0.904 0.984 0.97 1 0.904 1.000
aFLOW = relative changes in volumetric flow rate; aWASHOUT RATE = corresponding changes in the rate ofecho contrast washout from the following ultrasound signal types: RF = radio frequency, VI = video intensity, PD = Pedoff-style Doppler probe, and IvD = intravascular Doppler probe.
frequency and video intensity measurements were averages based on almost the entire cross-sectional di- ameter of the mixing/imaging chamber (2.54 cm), whereas the Doppler measurements were made in sample volumes of 0.5 mm to 1 .O mm in length (intra- vascular and Pedoff-style probes, respectively). Fur- ther, the video intensity measurements represent tem- poral averages of 0.333 s each, compared to less than 0.045 s for each of the Doppler and radio frequency measurements. Individual microbubbles (the “active ingredient” in SH U 508A), therefore would have a greater effect on Doppler intensity measurements compared to radio frequency and video intensity mea-
Table 3. Linear regression line slopes and Y-axis intercepts when comparing the combined relative change in time- intensity washout rate (aWASHOUT RATE) to volume
flow rate (ZLOW) data for chambers A and B.
CHAMBERS A AND B
Y-Axis Slope intercept r value 0 value
aWASHOUT RATE,, 1.034 -0.026 0.992 <o.oo I aWASHOUT RATErr, 1.041 -0.043 0.94 1 <o.oo 1 aWASHOUT RATE,,, 0.992 -0.005 0.922 <o.oo 1 aWASHOUT RATE,, 1.007 -0.043 0.980 <o.oo 1
The following ultrasound backscattered intensity techniques were investigated: RF = radio frequency, VI = video intensity, PD = Pedoff-style Doppler probe, and IvD = intravascular Doppler probe.
surements, creating somewhat more scatter in the data.
The WASHOUT RATE was shown to have a close linear relationship with FLOW, and all ultra- sound backscatter intensity techniques investigated showed equivalent utility for determining FLOW. Further, the relationship between WASHOUT RATE and FLOW (the slope of the WASHOUT RATE vs. FLOW regression line) was not significantly different for the various backscatter intensity techniques. As expected (from eqn 3) the relationship between WASHOUT RATE and FLOW was dependent on the mixing volume. If the mixing volume is known, then flow can be directly measured from the WASH- OUT RATE, as generated by radio frequency, video or Doppler intensity techniques. The ratio of the geo- metric volumes of chambers A and B correlated well with the corresponding inverse ratio of the WASH- OUT RATE vs. FLOW linear regression slopes, indi- cating that relative changes in mixing volume can be measured by analysis of contrast echo time-intensity curves.
Relative changes in FLOW (aFLOW) were found to be equal to the corresponding relative changes in WASHOUT RATE (dWASHOUT RATE), indepen- dent of the ultrasound backscattered intensity tech- nique used or the mixing volume. This indicates that echo contrast time-intensity curves can be used to measure relative flow rates directly, without further adjustment for the mixing volume, which is always unknown in in vivo settings. The most obvious clini-

458 Ultrasound in Medicine and Biology Volume 19, Number 6, 1993
Fig. 6. Ultrasonic transmission signals. Example ultrasonic waveforms transmitted from the VingMed Pedoff probe (upper panel), the Hewlett-Packard Sonos 100 (middle panel) and intravascular Doppler probe (lower panel). The Sonos 100 transmits a shorter more intense “chirp” waveform compared to the VingMed’s longer tone burst; both are in the 2 to 2.5 MHz range. The intravascular Doppler probe, operating at 20 MHz, also produced a long tone burst compared to the Sonos 100. The Y-axis is unconverted signal amplitude from the
hydrophone (m Volts), X-axis is time ( I 0m6 s).
cal application of this technique is in the determina- tion of arterial flow reserve and for measuring relative flow rates between different vessels in balanced sys- tems. Clinical examples include the determination of coronary flow reserve before and after angioplasty us- ing the intravascular Doppler probe or the determina- tion of relative blood flow between each carotid artery using transcutaneous ultrasonic imaging with either Doppler or video intensitometry.
Doppler ultrasound is uniquely suited to the as- sessment of volumetric flow using the echo contrast technique. To date, the use of Doppler ultrasound has primarily focused on Doppler frequency-based flow velocity measurements. The Doppler intensity, rather than the Doppler frequency, was used for the contrast echo flow measurements described in this paper. How- ever, the Doppler frequency (velocity of blood flow) can also be used to calculate volumetric flow rates in vessels using the continuity equation (velocity-time integral or stroke-length method), but only if the cross-sectional area of the vessel and heart rate are known (Huntsman et al. 1983). There are two impor- tant limitations to this approach: (1) the vessel cross- sectional area measurement may be difficult or impos- sible to obtain, and (2) the flow velocity measurement may be underestimated because of poor alignment of the ultrasound beam and the flow velocity vector. We have shown that contrast Doppler intensitometry can
be used to assess volumetric blood flow and like all the ultrasound backscatter intensity techniques, the con- trast Doppler intensitometry method is largely free of these limitations: (1) the contrast method depends on the volume of distribution (mixing volume) only for absolute flow measurements; relative changes in flow can be measured independent of the mixing volume, and (2) unlike the Doppler frequency, the intensity of ultrasonic backscatter from point sources (such as mi- crobubbles) is independent of the angle of ultrasound interrogation.
The Doppler time-intensity washout curve slope has equivalent utility in the determination of volumet- ric flow compared to the more standard radio fre- quency ultrasonic backscatter and video intensity techniques, but has several advantages related to data acquisition and processing. Almost all clinical Doppler ultrasound machines are equipped with most of the components necessary for Doppler inten- sitometry: (1) an audio output, (2) the ability to posi- tion a region of interest (the Doppler sample volume) and (3) an easy method of recording data (the audio channel of a video cassette recorder). The Doppler signal can also be processed more easily than either the ultrasonic radio frequency or video. In addition, Doppler can evaluate flow in vessels too small or too remote to image and the wall filter removes unwanted echo artifacts, such as structural echoes, side lobes
Volumetric arterial flow quantification 0 K. Q. SCHWARZ et al. 459
and reverberations. While video output is available on nearly all two-dimensional ultrasonic imagers, video time-intensity curves are difficult to generate and analyze due to cumbersome equipment (VCRs in stop-frame mode and video digitizers), and small structures (such as coronary arteries) are difficult to image with sufficient quality for intensity measure- ment. In addition, video images are typically more highly processed by clinical ultrasound machines than audio Doppler signals (e.g., log compression, time-gain compensation, image rasterization, etc.). In contrast to video and Doppler signals, the ultrasonic radio frequency signal is only available on specially modified ultrasound machines and requires highly so- phisticated equipment for analysis.
The advantage of intravascular Doppler over all other methods of ultrasound intensitometry consid- ered in this report is the ability to “image” vessels too small or too remote to image by any other technique. It is likely that one of the primary areas of use for this contrast Doppler technique will be in the catheteriza- tion laboratory, where direct arterial injections and Doppler sampling of echo contrast can be made.
CONCLUSIONS
High quality echo contrast time-intensity curves can be generated from radio frequency, video and Doppler intensity techniques. The washout rate of echo contrast after bolus injection into a system of tubes and chambers is linearly related to the volumet- ric flow rate, but also dependent on the volume of mixing. Relative changes in flow rate can be deter- mined directly from the changes in the washout rate, independent of the mixing volume. Radio frequency, video and Doppler intensitometry can be used to measure volumetric flow confined to tubes, but Doppler intensitometry is the easiest of the various techniques to perform. The coronary Doppler probe is uniquely suited to assessment of arterial volumetric blood flow in the catheterization laboratory.
REFERENCES
Berwing, K.; Schlepper, M.; Kremer, P.; Bahawar, H. Assessment of myocardial perfusion abnormalities in patients with coronary heart disease by intracoronary injection of a new echo contrast agent. Circulation 74475; 1986.
Berwing, K.; Schlepper, M. Echocardiographic imaging of the left ventricle by peripheral intravenous injection of echo contrast agent. Am. Heart. J. 115:399-408: 1988.
Berwmg, K.; Schlepper, M.; Kremer, P.; Bahawar, H. Comparison of three methods of evaluating coronary obstructive lesions: Quantitative contrast echocardiography, contrast coronary angi- ography and left ventricular regional wall motion. Circulation 78:567; 1988.
Bommer, W.; Miller, L.; Takeda, P.; Mason, D.; DeMaria, A. Con- trast echocardiography: Pulmonary transmission and myocar- dial perfusion imaging using surfactant stabilized microbubbles. Circulation 4:203; I98 1.
Christensen, C. W.; Reeves, W. C.; Holt, G. W. lntracoronary echo- contrast agents: Abnormalities in myocardial function in a nor- mal and reduced coronary perfusion model in dogs. Ultrasound Med. Biol. 14:199-211; 1988.
deJong, N.; Mittertreiner, W. H.; Ligtvoet, K. M.; tenCate, F. J. A computerized system that uses high frequency data for analysis of myocardial contrast echocardiograms. J. Am. Sot. Echocar- diogr. 3:99- 105; 1990.
DeMaria, A. N.; Bommer, W. J.; Riggs. K.; Fajee, A.; Keown, M.: Kwan, 0. L.; Mason, D. T. Echocardiographic visualization of myocardial perfusion by left heart and intracoronary injections of echo contrast agents. Circulation 62: 143; 1980.
Dick, C. D.: Feinstein, S. B.; Segil, L. J. In vitro quantitation of an echocardiographic contrast agent. Clin. Res. 36:272A: 1988a.
Dick, C. D.; Heidenreich, P.; Aronson, S.; Gluck, D.; Tamler, B.; Feinstein, S. B. Reproducible myocardial perfusion with intrave- nous contrast echocardiography. Circulation 78:565; 1988b.
Feinstein, S. B.; Heidenriech, P. A.; Dick, C. D.; Schneider, J. M.; Pastoret, A. F.; Rubenstein, W. A.; Applebaum, J.; Brehm, J. L.: Aronson, S.; Ellis, J.; Roizen, M. Albunex: A new intravascular ultrasound contrast agent; preliminary safety and efficacy re- sults. Circulation 78:565; 1988.
Gould, K. L.; Lipscomb, K.; Hamilton, G. W. Physiologic basis for assessing critical coronary stenosis. Instantaneous flow response and regional distribution during coronary hyperemia as mea- sures of coronary flow reserve. Am. J. Cardiol. 33:87-98: 1974.
Gould, K. L.; Kirkeeide, R. L.: Buchi, M. Coronary flow reserve as a physiologic measure of stenosis severity. J. Am. Coil. Cardiol. 15:459-466; 1990.
Huntsman, L.; Stewart, D.; Barnes, S.; Franklin, S.; Colocousis, J.; Hessel, E. Noninvasive Doppler determination of cardiac out- put in man. Circulation 67:593; 1983.
Lange, P.; Seiffert. P.; Pries, F.; Wessel, A.; Onnasch, D.; Hahne. H.; Heintzen. P. Value of image enhancement and injection of contrast medium for right ventricular volume determination by two-dimensional echocardiography in congenital heart disease. Am. J. Cardiol. 55:152-157: 1985.
Levitt, D. C.: Fellows, K. E.; Abrams, H. L. Hemodynamically sig- nificant primary anomalies of the coronary arteries. Angio- araohic asoects. Circulation 58:25-36; 1978.
Monaghan, M. J.; Quigley, P. J.; Metcalfe, J. M.; Thomas, S. D.; Jewitt, D. E. Digital subtraction contrast echocardioaranhv: A new method fo;the evaluation of regional myocardial‘perfu- sion. Br. Heart J. 59:12-19; 1988.
Monaghan. M. J.; Metcalfe, J. M.: Odunlami, S.; Thomas, S.; Waaler, A.; Jewitt, D. Can myocardial perfusion be detected using IV Albunex’ and digital radiofrequency echocardiogra- phy? Eur. Heart J. 12: 159: I99 I.
Ong, K.; Maurer, G.; Feinstein, S.: Zwehl, W.: Meerbaum, S.; Cor- day, E. Computer methods for myocardial contrast two-dimen- sional echocardiography. J. Am. Coil. Cardiol. 3: I2 12- I2 18; 1984.
Porter, T. R.; D’Sa, A.; Turner, C.: Marshall, J. J.; Mohanty, P. K.; Minisi, A. J.; Jones, L. A.; Vetrovec, G. W.; Nixon, J. V. The relationship of various parameters of the ultrasonic time videointensity curve to intracoronary Doppler flow reserve us- ing on line myocardial contrast echocardiography. J. Am. Sot. Echocardiogr. 4:285; 199 1.
Reisner, S. A.: Ong, L. S.; Lichtenberg, G. S.: Shapiro, J. R.: Allen. M. A.; Mehzer, R. S. Myocardial perfusion imaging using intra- coronary sonicated albumin in humans. J. Am. Coil. Cardiol. 14:660-665; 1989.
Rovai, D.; Nissen, S.; Elion, J.: Smith. M.: L’Abbate, A.; Kwan. 0. L.; DeMaria. A. Contrast echo washout curves from the left ventricle: Application of basic principles of indicator-dilution

460 Ultrasound in Medicine and Biology
theory and calculation of ejection fraction. J. Am. Coil. Cardiol. 10:125-134; 1987.
Schlief, R. Ultrasound contrast agents. Cur. Opin. Radiol. 3: 19% 207; 1991.
Shandas, R.; Sahn, D.; Bales, G.; Elkadi, T.; Yau, K.-K.; Gharib, M. Persistence of albunex (ALB) ultrasound contrast agent: In- vitro study of the effects of pressure and acoustic power on parti- cle size, and the duration of contrast and Doppler enhancement. Circulation 82:95; 1990.
Shapiro, J. R.; Reisner, S. A.; Lichtenberg, G. S.; Meltzer, R. S. Intravenous contrast echocardiography with use of sonicated albumin in humans: Systolic disappearance of left ventricular contrast after transpulmonary transmission. J. Am. Coll. Car- diol. 16:1603-1607; 1990.
Volume 19, Number 6, 1993
tenCate, F. J.; Zwehl, W.; Drury, J. K.; Feinstein, S.; Noordsji, J.; Whiting, J.; Meerbaum, S.; Corday, E. Analysis of contrast 2D echo time intensity curves at various coronary flow levels. Cir- culation 68:94; 1983.
Wiencek, J. G.; Zaroff, J. G.; Heidenreich, P. A.; Harper, P. V.; Powsner, S. M.; Aronson, S.; Feinstein, S. B. Contrastechocardi- ography: A comparison of videodensitometric technique. Cir- culation 82:27; 1990.
Zwehl, W.; Areeda, J.; Schwartz, G.; Feinstein, S.; Ong, K.; Meer- baum, S. Physical factors influencing quantitation of twodi- mensional contrast echo amplitudes. J. Am. COB. Cardiol. 4:157-164; 1984.
本文献由“学霸图书馆-文献云下载”收集自网络,仅供学习交流使用。
学霸图书馆(www.xuebalib.com)是一个“整合众多图书馆数据库资源,
提供一站式文献检索和下载服务”的24 小时在线不限IP
图书馆。
图书馆致力于便利、促进学习与科研,提供最强文献下载服务。
图书馆导航:
图书馆首页 文献云下载 图书馆入口 外文数据库大全 疑难文献辅助工具