volumetric, optical, acoustical and viscometric study of...
TRANSCRIPT
Vol. 111 (2007) ACTA PHYSICA POLONICA A No. 6
Volumetric, Optical, Acoustical
and Viscometric Study of Molecular
Association in Binary Mixtures
of Butylamine with 1-Butanol
and Tert-Butanol
S. Singh, S. Parveen, D. Shukla, M. Gupta∗
and J.P. Shukla
Department of Physics, University of Lucknow, Lucknow 2260007, India
(Received January 15, 2007; revised version April 20, 2007)
Density (ρ), refractive index (n), ultrasonic velocity (u), and viscos-
ity (η) were measured for the binary mixtures formed by butylamine with
1-butanol and tert-butanol at temperatures 293, 303, and 313 K over the
entire composition range. Excess molar volume V Em , molar refraction de-
viation ∆Rm, deviation in ultrasonic velocity ∆u, viscosity deviation ∆η,
and excess Gibb’s free energy of activation for viscous flow ∆G∗E were de-
rived from the experimental data and the computed results were fitted to the
Redlich–Kister polynomial equation. The values of V Em , ∆Rm, ∆u, ∆η, and
∆G∗E were plotted against the mole fraction of butylamine. The observed
positive and negative values of excess parameters for both the mixtures were
explained on the basis of intermolecular interactions present in these mix-
tures. The higher negative values of V Em and ∆Rm and positive values of
∆u, ∆η, and ∆G∗E for butylamine + 1-butanol mixture suggest that spe-
cific interactions are taking place in butylamine + 1-butanol mixture, while
weak dipole-dipole induced forces and dispersive forces seem to be responsi-
ble for butylamine + tert-butanol mixture. Furthermore, different empirical
relations were used to correlate the binary refractive indices. An excellent
agreement was found between experimental and theoretical values.
PACS numbers: 43.35.+d, 62.60.+v, 82.60.Lf
1. Introduction
The knowledge of the thermodynamic properties of organic liquid mixturesis very important for understanding the molecular interactions between the com-
∗corresponding author; e-mail: [email protected]
(847)
848 S. Singh et al.
ponents. This also helps to evolve theoretical models and is useful in industrialapplications [1–4]. Excess properties of liquid systems, such as excess molar vol-ume, deviation in molar refraction are needed for the design of separation equip-ment and to test the theories of the solution [5]. In addition, excess propertiesprovide information about the molecular interactions and macroscopic behaviourof fluid mixtures and can be used to test and to improve thermodynamical mod-els for calculating and predicting the fluid phase equilibria. The knowledge ofexcess Gibb’s free energy of activation for viscous flow helps in understandingthe molecular orientation and to study the extent of intermolecular interactionbetween component molecules of the liquid mixtures. In recent years, there hasbeen considerable upsurge in the theoretical and experimental investigation of theexcess thermodynamic properties of binary liquid mixtures [6, 7].
Butylamine is commonly used as an intermediate for the production of phar-maceuticals, dyestuffs, emulsifying agents, insecticides, synthetic tanning agents,and rubber chemicals. Also, butylamine is used as a raw material for herbicides,corrosion inhibitors, vulcanization accelerators, and flotation agents.
Alcohols are self associated organic liquids and are widely used as basic or-ganic compound for the synthesis of other organic compounds; n-butylalcoholshave been administered to patients for the control of postoperative pain in otola-ryngeal surgery and for an unexplained anti-haemorrhagic effect in those with faradvanced cancer.
In order to examine molecular interactions in the mixture of butylaminewith alcohols through excess properties viz. excess molar volume V E
m , molar re-fraction deviation ∆Rm, deviation in ultrasonic velocity ∆u, viscosity deviation∆η, and excess Gibb’s free energy of activation for viscous flow ∆G∗E, we reporthere density (ρ), refractive index (n), ultrasonic velocity (u), and viscosity (η)of binary mixtures of butylamine with 1-butanol and tert-butanol over the entirecomposition range at temperatures 293, 303, and 313 K. Further, seven mixingrules for the prediction of refractive index proposed by Lorentz–Lorentz (L–L),Gladstone–Dale (G–D), Weiner (W), Heller (H), Arago–Biot (A–B), Newton (N),and Eykmen (Eyk) have been theoretically applied to these binary mixtures. Acomparative study has been made between the experimental and theoretically cal-culated values of refractive indices at all the three temperatures. The results havebeen discussed in terms of average percentage deviation (APD).
2. Experimental section
The densities were measured using a pyknometer having a bulb volume of8 ml and an internal diameter of the capillary of about 0.1 cm with an accuracy±0.5%. The pyknometer was calibrated at 298 K with double distilled water andbenzene. The pyknometer with the test solution was equilibrated in a thermostat-ically controlled water bath maintained at ±0.1 K of the desired temperature. Anaverage of triplicate measurements was taken into account.
Volumetric, Optical, Acoustical and Viscometric Study . . . 849
Refractive index was measured using Abbe’s refractometer provided by Op-tics Technologies, Delhi. The refractometer was calibrated by measuring the re-fractive indices of triply distilled water and benzene at T = 293 K. The accuracyin the refractive index measurement was 0.001 units. Temperature was controlledby circulating adequately stirred water bath (accuracy ±0.1◦C). The sample mix-tures were directly injected into the prism assembly of the instrument by meansof an air-tight hypodermic syringe. An average of four to five measurements wastaken for each sample mixture.
The ultrasonic velocity of pure components and their mixtures were mea-sured by variable path fixed frequency interferometer provided by Mittal Enter-prises, New Delhi (Model-83). It consists of a high frequency generator and ameasuring cell. The calibration of ultrasonic interferometer was done by measur-ing the velocity in AR grade benzene and carbon tetrachloride. Standard value ofu for benzene and carbon tetrachloride were calculated from the literature value [8]of u at 298 K and −du/dt. Our measured values of u agree closely with the litera-ture values [8]. The maximum estimated error in ultrasonic velocity measurementshas been found to be ±0.08%. The measured values of standard deviations of ve-locities have been found to be smaller than 0.12 m/s for the mixtures studiedat various temperatures for fine measurements. The temperature was controlledby circulating water around the liquid cell from thermostatically controlled ade-quately stirred water bath (accuracy ±0.1◦C).
The viscosity was measured by Ostwald’s viscometer which was calibratedat 298 K with double distilled water and purified methanol using density andviscosity values from the literature [8]. The flow times were accurate to ±0.1 s,and the uncertainty in the viscosity measurements was within ±0.5%. An averageof 3–4 flow times were taken to estimate the viscosity.
Mixtures were prepared by weighing the liquids in specially designed groundglass stopped bottles, taking extreme precautions to minimize preferential evap-oration. A Sartorius (BP 121S) single pan balance having a stated precision of0.1 mg was used throughout. The maximum possible error in the mole fraction isestimated to be ±0.0001. The chemicals used were obtained from Ranbaxy FineChemicals Limited. All the chemicals used were purified by standard procedure,discussed by Perrin and Armarego [9]. All the samples were kept in tightly sealedbottles to minimize the absorption of atmospheric moisture.
3. Results and discussion
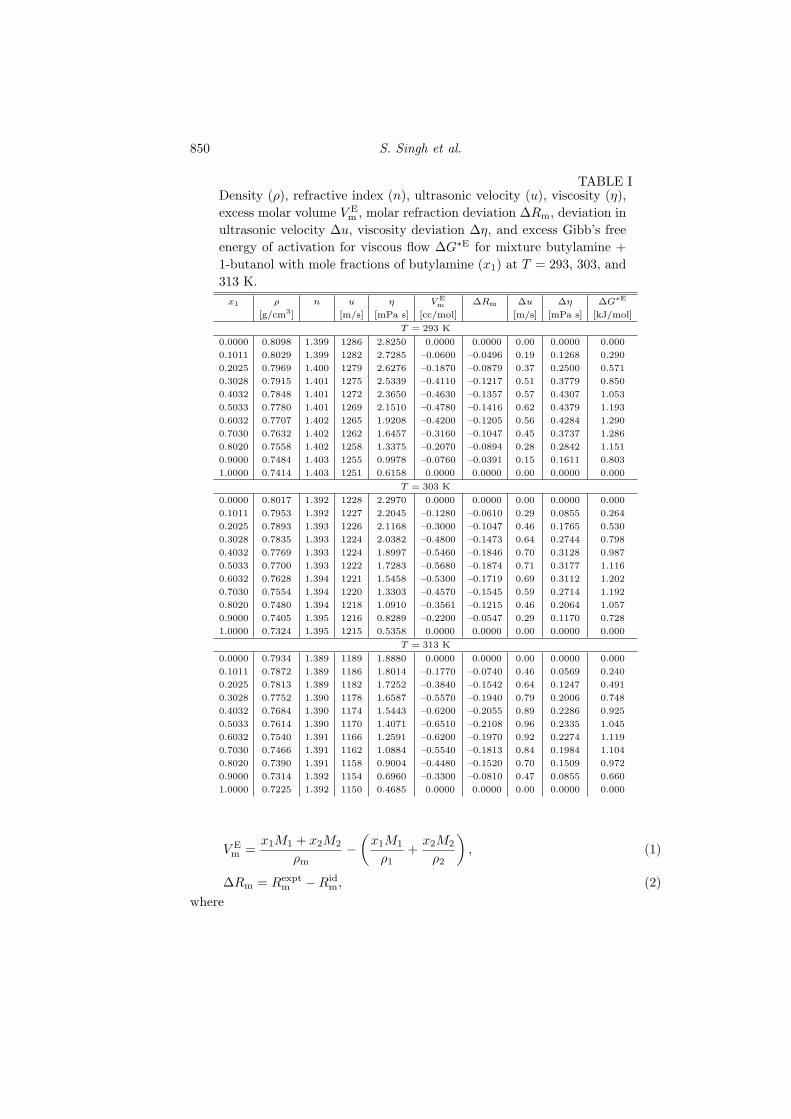
The experimental values of ρ, n, u, and η at three temperatures viz. 293, 303,and 313 K are given in Tables I and II for butylamine + 1-butanol and butylamine+ tert-butanol mixtures.
The experimental values of ρ, n, u, and η were used to calculate the valuesof V E
m , ∆Rm, ∆u, ∆η, and ∆G∗E using the standard relations
850 S. Singh et al.
TABLE IDensity (ρ), refractive index (n), ultrasonic velocity (u), viscosity (η),excess molar volume V E
m , molar refraction deviation ∆Rm, deviation inultrasonic velocity ∆u, viscosity deviation ∆η, and excess Gibb’s freeenergy of activation for viscous flow ∆G∗E for mixture butylamine +1-butanol with mole fractions of butylamine (x1) at T = 293, 303, and313 K.
x1 ρ n u η V Em ∆Rm ∆u ∆η ∆G∗E
[g/cm3] [m/s] [mPa s] [cc/mol] [m/s] [mPa s] [kJ/mol]
T = 293 K
0.0000 0.8098 1.399 1286 2.8250 0.0000 0.0000 0.00 0.0000 0.000
0.1011 0.8029 1.399 1282 2.7285 –0.0600 –0.0496 0.19 0.1268 0.290
0.2025 0.7969 1.400 1279 2.6276 –0.1870 –0.0879 0.37 0.2500 0.571
0.3028 0.7915 1.401 1275 2.5339 –0.4110 –0.1217 0.51 0.3779 0.850
0.4032 0.7848 1.401 1272 2.3650 –0.4630 –0.1357 0.57 0.4307 1.053
0.5033 0.7780 1.401 1269 2.1510 –0.4780 –0.1416 0.62 0.4379 1.193
0.6032 0.7707 1.402 1265 1.9208 –0.4200 –0.1205 0.56 0.4284 1.290
0.7030 0.7632 1.402 1262 1.6457 –0.3160 –0.1047 0.45 0.3737 1.286
0.8020 0.7558 1.402 1258 1.3375 –0.2070 –0.0894 0.28 0.2842 1.151
0.9000 0.7484 1.403 1255 0.9978 –0.0760 –0.0391 0.15 0.1611 0.803
1.0000 0.7414 1.403 1251 0.6158 0.0000 0.0000 0.00 0.0000 0.000
T = 303 K
0.0000 0.8017 1.392 1228 2.2970 0.0000 0.0000 0.00 0.0000 0.000
0.1011 0.7953 1.392 1227 2.2045 –0.1280 –0.0610 0.29 0.0855 0.264
0.2025 0.7893 1.393 1226 2.1168 –0.3000 –0.1047 0.46 0.1765 0.530
0.3028 0.7835 1.393 1224 2.0382 –0.4800 –0.1473 0.64 0.2744 0.798
0.4032 0.7769 1.393 1224 1.8997 –0.5460 –0.1846 0.70 0.3128 0.987
0.5033 0.7700 1.393 1222 1.7283 –0.5680 –0.1874 0.71 0.3177 1.116
0.6032 0.7628 1.394 1221 1.5458 –0.5300 –0.1719 0.69 0.3112 1.202
0.7030 0.7554 1.394 1220 1.3303 –0.4570 –0.1545 0.59 0.2714 1.192
0.8020 0.7480 1.394 1218 1.0910 –0.3561 –0.1215 0.46 0.2064 1.057
0.9000 0.7405 1.395 1216 0.8289 –0.2200 –0.0547 0.29 0.1170 0.728
1.0000 0.7324 1.395 1215 0.5358 0.0000 0.0000 0.00 0.0000 0.000
T = 313 K
0.0000 0.7934 1.389 1189 1.8880 0.0000 0.0000 0.00 0.0000 0.000
0.1011 0.7872 1.389 1186 1.8014 –0.1770 –0.0740 0.46 0.0569 0.240
0.2025 0.7813 1.389 1182 1.7252 –0.3840 –0.1542 0.64 0.1247 0.491
0.3028 0.7752 1.390 1178 1.6587 –0.5570 –0.1940 0.79 0.2006 0.748
0.4032 0.7684 1.390 1174 1.5443 –0.6200 –0.2055 0.89 0.2286 0.925
0.5033 0.7614 1.390 1170 1.4071 –0.6510 –0.2108 0.96 0.2335 1.045
0.6032 0.7540 1.391 1166 1.2591 –0.6200 –0.1970 0.92 0.2274 1.119
0.7030 0.7466 1.391 1162 1.0884 –0.5540 –0.1813 0.84 0.1984 1.104
0.8020 0.7390 1.391 1158 0.9004 –0.4480 –0.1520 0.70 0.1509 0.972
0.9000 0.7314 1.392 1154 0.6960 –0.3300 –0.0810 0.47 0.0855 0.660
1.0000 0.7225 1.392 1150 0.4685 0.0000 0.0000 0.00 0.0000 0.000
V Em =
x1M1 + x2M2
ρm−
(x1M1
ρ1+
x2M2
ρ2
), (1)
∆Rm = Rexptm −Rid
m, (2)where
Volumetric, Optical, Acoustical and Viscometric Study . . . 851
TABLE IIDensity (ρ), refractive index (n), ultrasonic velocity (u), viscosity (η),excess molar volume V E
m , molar refraction deviation ∆Rm, deviation inultrasonic velocity ∆u, viscosity deviation ∆η, and excess Gibb’s freeenergy of activation for viscous flow ∆G∗E for mixture butylamine +tert-butanol with mole fractions of butylamine (x1) at T = 293, 303,and 313 K.
x1 ρ n u η V Em ∆Rm ∆u ∆η ∆G∗E
[g/cm3] [m/s] [mPa s] [cc/mol] [m/s] [mPa s] [kJ/mol]
T = 293 K
0.0000 0.8018 1.396 1208 6.6250 0.0000 0.0000 0.00 0.0000 0.000
0.1012 0.7953 1.397 1213 3.3710 –0.0003 –0.0058 0.11 –2.6459 –1.060
0.2015 0.7890 1.398 1217 2.4141 –0.0006 –0.0138 0.21 –3.0000 –1.292
0.3026 0.7827 1.398 1221 1.8566 –0.0008 –0.0192 0.28 –2.9500 –1.347
0.4031 0.7765 1.399 1226 1.4827 –0.0009 –0.0221 0.34 –2.7200 –1.313
0.5032 0.7704 1.400 1230 1.2412 –0.0009 –0.0225 0.36 –2.3600 –1.166
0.6029 0.7645 1.400 1234 1.0820 –0.0009 –0.0205 0.36 –1.9200 –0.924
0.7026 0.7586 1.401 1239 0.9192 –0.0008 –0.0161 0.30 –1.4837 –0.744
0.7980 0.7586 1.402 1243 0.8050 –0.0006 –0.0097 0.23 –1.0246 –0.515
0.9012 0.7470 1.403 1247 0.7173 –0.0003 –0.0021 0.11 –0.4922 –0.200
1.0000 0.7414 1.403 1251 0.6158 0.0000 0.0000 0.00 0.0000 0.000
T = 303 K
0.0000 0.7944 1.389 1180 5.5260 0.0000 0.0000 0.00 0.0000 0.000
0.1012 0.7877 1.390 1184 3.0631 –0.0003 –0.0068 0.14 –1.9639 –0.891
0.2015 0.7812 1.390 1187 2.2105 –0.0005 –0.0157 0.28 –2.3206 –1.123
0.3026 0.7748 1.391 1191 1.6560 –0.0006 –0.0220 0.36 –2.3740 –1.256
0.4031 0.7684 1.392 1195 1.4045 –0.0007 –0.0256 0.41 –2.1260 –1.080
0.5032 0.7622 1.392 1198 1.2752 –0.0007 –0.0265 0.43 –1.7563 –0.735
0.6029 0.7561 1.393 1202 1.1065 –0.0007 –0.0249 0.43 –1.4268 –0.506
0.7026 0.7500 1.393 1205 0.9783 –0.0006 –0.0209 0.36 –1.0555 –0.230
0.7980 0.7443 1.394 1208 0.8325 –0.0005 –0.0147 0.27 –0.7221 –0.077
0.9012 0.7383 1.395 1212 0.6678 –0.0003 –0.0057 0.15 –0.3670 –0.025
1.0000 0.7325 1.395 1215 0.5358 0.0000 0.0000 0.00 0.0000 0.000
T = 313 K
0.0000 0.7871 1.385 1141 4.7960 0.0000 0.0000 0.00 0.0000 0.000
0.1012 0.7802 1.386 1142 2.9805 –0.0004 –0.0086 0.18 –1.3513 –0.625
0.2015 0.7734 1.387 1143 2.2640 –0.0007 –0.0189 0.30 –1.6139 –0.733
0.3026 0.7666 1.387 1144 1.6765 –0.0009 –0.0261 0.39 –1.7499 –0.902
0.4031 0.7600 1.388 1145 1.5416 –0.0010 –0.0302 0.46 –1.4419 –0.512
0.5032 0.7535 1.389 1146 1.3784 –0.0011 –0.0313 0.49 –1.1697 –0.197
0.6029 0.7472 1.389 1147 1.2170 –0.0010 –0.0295 0.50 –0.9031 0.082
0.7026 0.7409 1.390 1148 0.9894 –0.0009 –0.0248 0.41 –0.7080 0.147
0.7980 0.7350 1.391 1149 0.8258 –0.0007 –0.0177 0.30 –0.4724 0.253
0.9012 0.7287 1.391 1149 0.6088 –0.0004 –0.0073 0.17 –0.2629 0.084
1.0000 0.7227 1.392 1150 0.4685 0.0000 0.0000 0.00 0.0000 0.000
Rexptm =
n2m − 1
n2m + 2
x1M1 + x2M2
ρm, (2a)
and
Ridm =
n21 − 1
n21 + 2
M1
ρ1φ1 +
n22 − 1
n22 + 2
M2
ρ2φ2, (2b)
852 S. Singh et al.
∆u = u− (x1u1 + x2u2), (3)
∆η = η − (x1η1 + x2η2), (4)
∆G∗E = RT
[ln
(ηVm
η2Vm2
)− x1 ln
(η1Vm1
η2Vm2
)]. (5)
Mixing rules for refractive index [10, 11] are listed below.The Lorentz–Lorentz relation for refractive index is based on the change in
the molecular polarizability with volume fractionn2
m − 1n2
m + 21
ρm=
n21 − 1
n21 + 2
w1
ρ1+
n22 − 1
n22 + 2
w2
ρ2. (6)
Gladstone–Dale equation for predicting the refractive index of a binary mixture isas follows:
nm − 1 = ϕ1(n1 − 1) + ϕ2(n2 − 1). (7)Wiener’s relation may be represented as
n2m − n2
1
n2m + 2n2
1
=n2
2 − n21
n22 + 2n2
1
ϕ2. (8)
Heller’s relation is given bynm − n1
n1=
32
m2 − 1m2 + 2
ϕ2. (9)
Arago–Biot, assuming volume additivity, proposed the following relation for re-fractive index of binary mixtures:
nm = ϕ1n1 + ϕ2n2. (10)Newton gave the following equation:
n2m − 1 = ϕ(n2
1 − 1) + ϕ2(n22 − 1). (11)
Eykman’s relation may be represented asn2
m − 1nm + 0.4
V m =n2
1 − 1n1 + 0.4
M1x1
ρ1+
n22 − 1
n2 + 0.4M2x2
ρ2. (12)
In Eqs. (1)–(12) Mi, ρi, ni, ui, ηi, φi, Vmi, Wi, and xi, respectively,represent molecular weight, density, refractive index, ultrasonic velocity, viscosity,volume fraction, molar volume, weight fraction, and mole fraction of the i-th com-ponent (i = 1, 2 for binary mixtures), ρm, nm, u, η, and Vm are density, refractiveindex, ultrasonic velocity, viscosity, and molar volume of the mixtures. R is theuniversal gas constant and T is the absolute temperature. All the excess parame-ters are summarized in Tables I and II for butylamine + 1-butanol, butylamine +tert-butanol mixtures and are shown graphically in Figs. 1 to 5.
The values of V Em , ∆Rm, ∆u, ∆η, and ∆G∗E for each mixture have been
fitted to Redlich–Kister polynomial equation
Y E = x(1− x)5∑
i=1
ai(1− 2x)i−1, (13)
Volumetric, Optical, Acoustical and Viscometric Study . . . 853
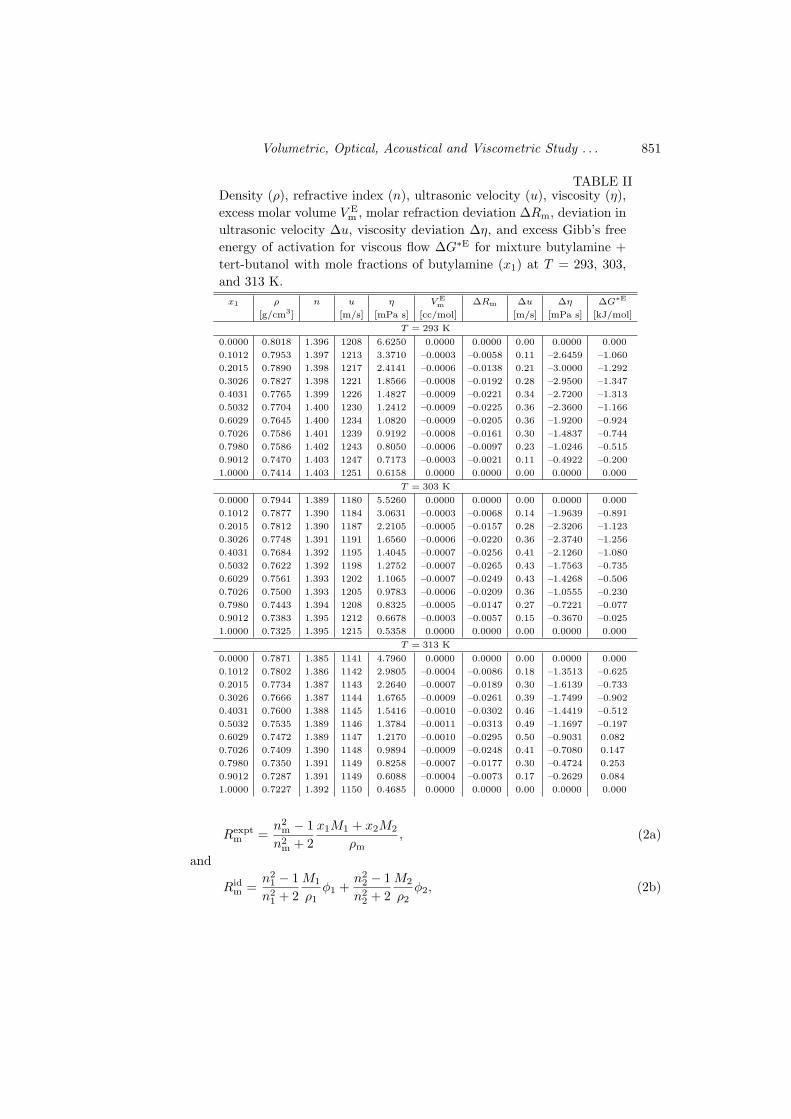
Fig. 1. (a) Excess molar volume V Em as a function of butylamine (x1) for butylamine
+ 1-butanol mixture at all the three temperatures. (b) As in (a), but for butylamine +
tert-butanol mixture.
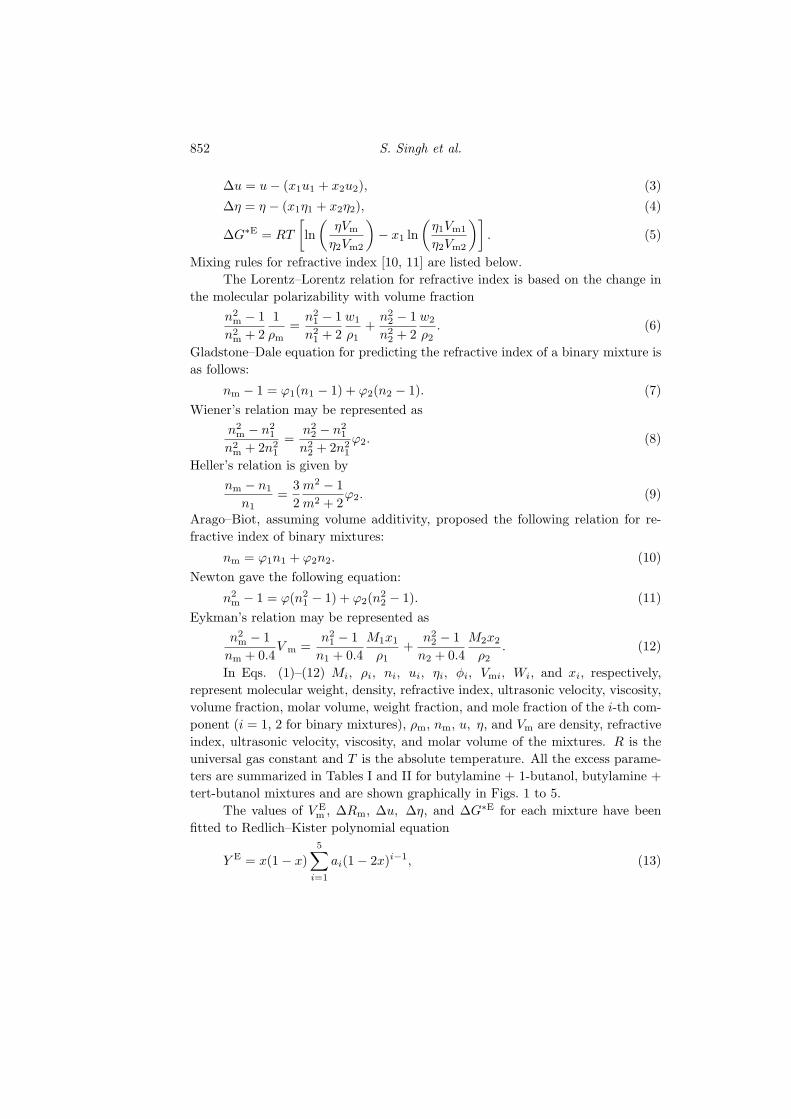
Fig. 2. (a) Molar refraction deviation ∆Rm as a function of butylamine (x1) for buty-
lamine + 1-butanol mixture at all the three temperatures. (b) As in (a), but for buty-
lamine + tert-butanol mixture.
Fig. 3. (a) Deviation in ultrasonic velocity ∆u as a function of butylamine (x1) for
butylamine + 1-butanol mixture at all the three temperatures. (b) As in (a), but for
butylamine + tert-butanol mixture.
854 S. Singh et al.
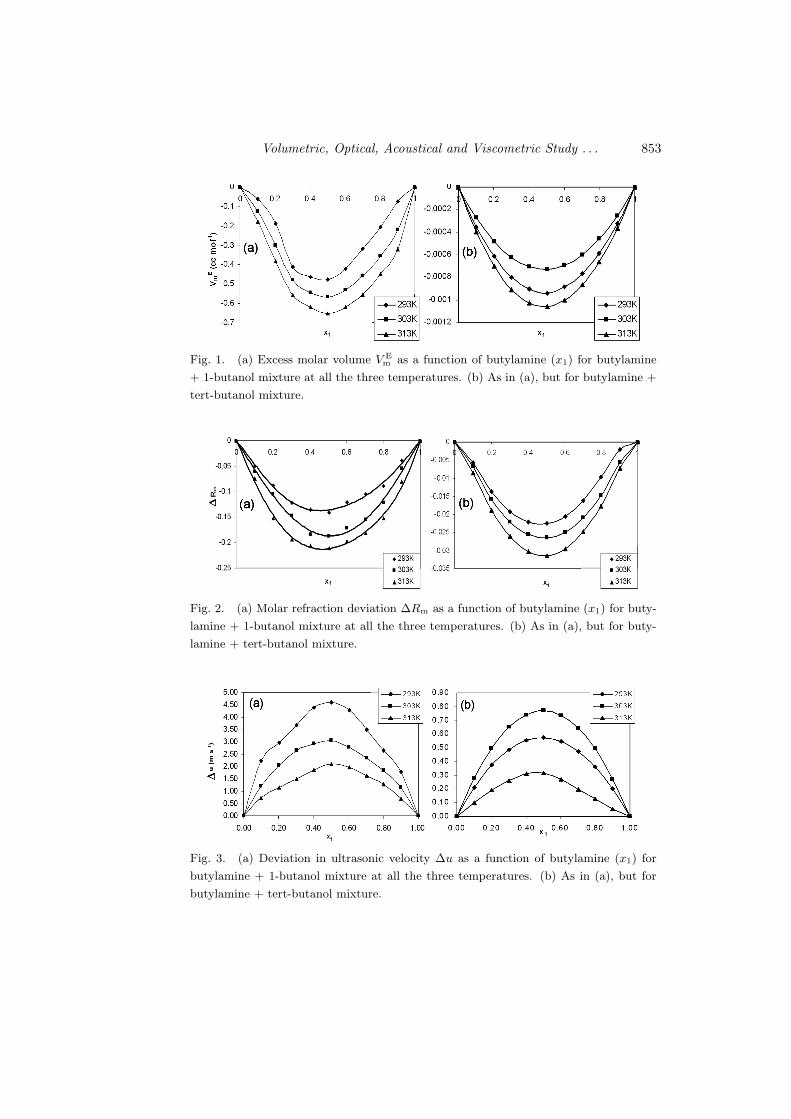
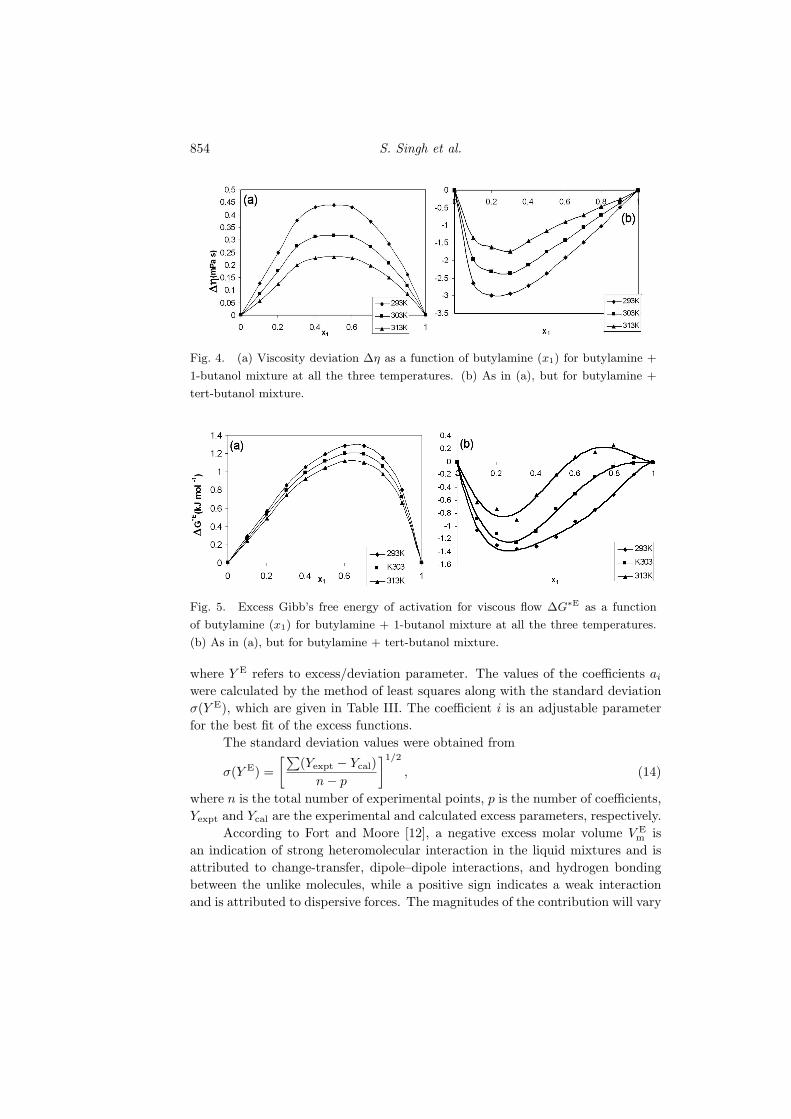
Fig. 4. (a) Viscosity deviation ∆η as a function of butylamine (x1) for butylamine +
1-butanol mixture at all the three temperatures. (b) As in (a), but for butylamine +
tert-butanol mixture.
Fig. 5. Excess Gibb’s free energy of activation for viscous flow ∆G∗E as a function
of butylamine (x1) for butylamine + 1-butanol mixture at all the three temperatures.
(b) As in (a), but for butylamine + tert-butanol mixture.
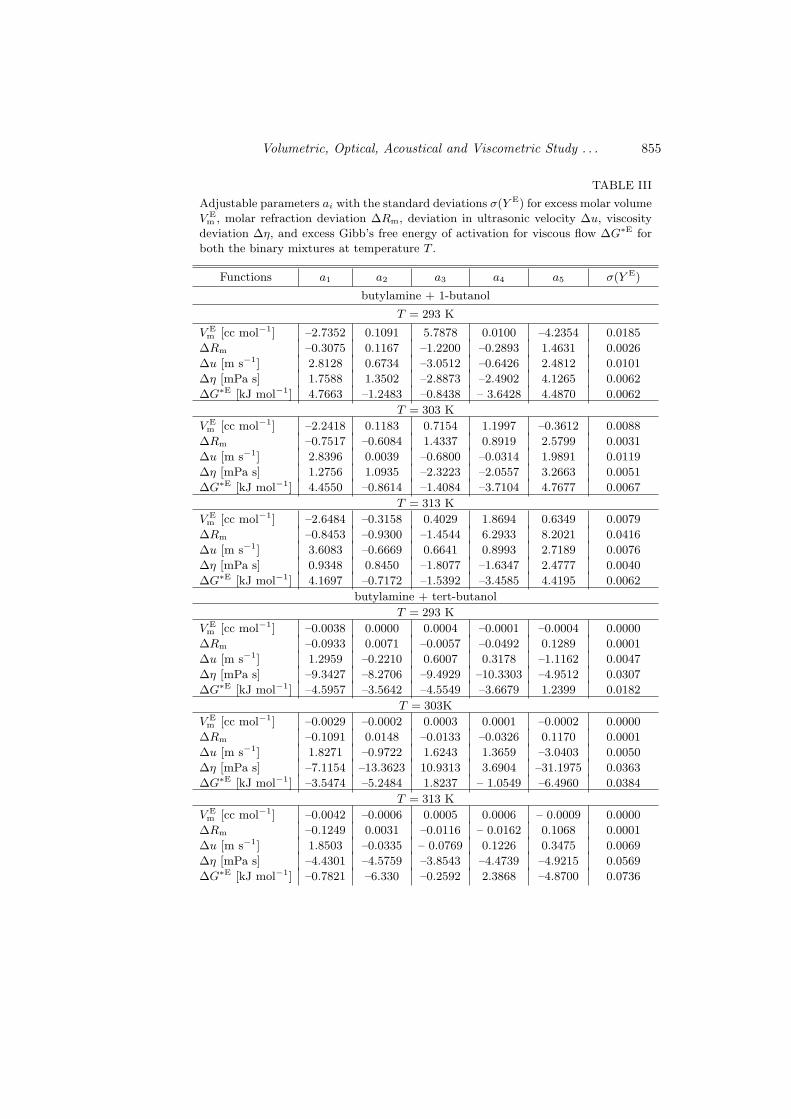
where Y E refers to excess/deviation parameter. The values of the coefficients ai
were calculated by the method of least squares along with the standard deviationσ(Y E), which are given in Table III. The coefficient i is an adjustable parameterfor the best fit of the excess functions.
The standard deviation values were obtained from
σ(Y E) =[∑
(Yexpt − Ycal)n− p
]1/2
, (14)
where n is the total number of experimental points, p is the number of coefficients,Yexpt and Ycal are the experimental and calculated excess parameters, respectively.
According to Fort and Moore [12], a negative excess molar volume V Em is
an indication of strong heteromolecular interaction in the liquid mixtures and isattributed to change-transfer, dipole–dipole interactions, and hydrogen bondingbetween the unlike molecules, while a positive sign indicates a weak interactionand is attributed to dispersive forces. The magnitudes of the contribution will vary
Volumetric, Optical, Acoustical and Viscometric Study . . . 855
TABLE III
Adjustable parameters ai with the standard deviations σ(Y E) for excess molar volume
V Em , molar refraction deviation ∆Rm, deviation in ultrasonic velocity ∆u, viscosity
deviation ∆η, and excess Gibb’s free energy of activation for viscous flow ∆G∗E for
both the binary mixtures at temperature T .
Functions a1 a2 a3 a4 a5 σ(Y E)
butylamine + 1-butanol
T = 293 K
V Em [cc mol−1] –2.7352 0.1091 5.7878 0.0100 –4.2354 0.0185
∆Rm –0.3075 0.1167 –1.2200 –0.2893 1.4631 0.0026
∆u [m s−1] 2.8128 0.6734 –3.0512 –0.6426 2.4812 0.0101
∆η [mPa s] 1.7588 1.3502 –2.8873 –2.4902 4.1265 0.0062
∆G∗E [kJ mol−1] 4.7663 –1.2483 –0.8438 – 3.6428 4.4870 0.0062
T = 303 K
V Em [cc mol−1] –2.2418 0.1183 0.7154 1.1997 –0.3612 0.0088
∆Rm –0.7517 –0.6084 1.4337 0.8919 2.5799 0.0031
∆u [m s−1] 2.8396 0.0039 –0.6800 –0.0314 1.9891 0.0119
∆η [mPa s] 1.2756 1.0935 –2.3223 –2.0557 3.2663 0.0051
∆G∗E [kJ mol−1] 4.4550 –0.8614 –1.4084 –3.7104 4.7677 0.0067
T = 313 K
V Em [cc mol−1] –2.6484 –0.3158 0.4029 1.8694 0.6349 0.0079
∆Rm –0.8453 –0.9300 –1.4544 6.2933 8.2021 0.0416
∆u [m s−1] 3.6083 –0.6669 0.6641 0.8993 2.7189 0.0076
∆η [mPa s] 0.9348 0.8450 –1.8077 –1.6347 2.4777 0.0040
∆G∗E [kJ mol−1] 4.1697 –0.7172 –1.5392 –3.4585 4.4195 0.0062
butylamine + tert-butanol
T = 293 K
V Em [cc mol−1] –0.0038 0.0000 0.0004 –0.0001 –0.0004 0.0000
∆Rm –0.0933 0.0071 –0.0057 –0.0492 0.1289 0.0001
∆u [m s−1] 1.2959 –0.2210 0.6007 0.3178 –1.1162 0.0047
∆η [mPa s] –9.3427 –8.2706 –9.4929 –10.3303 –4.9512 0.0307
∆G∗E [kJ mol−1] –4.5957 –3.5642 –4.5549 –3.6679 1.2399 0.0182
T = 303K
V Em [cc mol−1] –0.0029 –0.0002 0.0003 0.0001 –0.0002 0.0000
∆Rm –0.1091 0.0148 –0.0133 –0.0326 0.1170 0.0001
∆u [m s−1] 1.8271 –0.9722 1.6243 1.3659 –3.0403 0.0050
∆η [mPa s] –7.1154 –13.3623 10.9313 3.6904 –31.1975 0.0363
∆G∗E [kJ mol−1] –3.5474 –5.2484 1.8237 – 1.0549 –6.4960 0.0384
T = 313 K
V Em [cc mol−1] –0.0042 –0.0006 0.0005 0.0006 – 0.0009 0.0000
∆Rm –0.1249 0.0031 –0.0116 – 0.0162 0.1068 0.0001
∆u [m s−1] 1.8503 –0.0335 – 0.0769 0.1226 0.3475 0.0069
∆η [mPa s] –4.4301 –4.5759 –3.8543 –4.4739 –4.9215 0.0569
∆G∗E [kJ mol−1] –0.7821 –6.330 –0.2592 2.3868 –4.8700 0.0736
856 S. Singh et al.
with the components and composition of the mixtures. In the present investigation,both the mixtures gave a negative magnitude of V E
m , and they depict the presenceof heteromolecular interaction, which support the Fort and Moore [12] observation.Wen-Lu Weng [13] and Papaioannou et al. [14] have also observed negative valuesof V E
m in the case of butylamine + 1-butanol mixture. The negative V Em values of
butylamine + 1-butanol observed in the present investigation have been found tobe in good agreement with the values of V E
m reported earlier by Wen-Lu Weng [13]and Papaioannou et al. [14]. The negative values of V E
m indicate that volumecontraction takes place upon mixing butylamine with 1-butanol/tert-butanol dueto cross association between these dissimilar molecules [15]. The magnitude ofthe volume contraction follows the sequence of 1-butanol > tert-butanol. This isin agreement with the results reported by Ali and Nain [15] on binary mixturesof tetrahydrofuran (THF) with 1-butanol and tert-butanol which suggest that theexcess values follow the same sequence, due to the steric hindrance produced by thepresence of three methyl groups at 30 carbon atom in tert-butanol, as comparedto one butyl group in 1-butanol. Molar refraction deviation ∆Rm as calculatedfrom Eq. (2b) represents the electronic perturbation due to orbital mixing of twocomponents [16]. Rm gives the strength of the interaction in mixture and is asensitive function of wavelength, temperature, and mixture composition. Figure 2shows that ∆Rm values are negative for both the mixtures at all the temperatures.The values of V E
m and ∆Rm support each other. The V Em and ∆Rm values become
more negative at higher temperature for both the mixtures, suggesting an increasein interaction between unlike molecules.
Deviation in ultrasonic velocity ∆u, viscosity deviation ∆η, and excessGibb’s free energy of activation for viscous flow ∆G∗E can be used to detect themolecular interactions present in the binary mixture. ∆u has been found to bepositive for both the mixtures over the entire mole fraction range (Fig. 3). It isevident from Fig. 3 that in both the mixtures containing butylamine, ∆u increasesas a function of mole fraction of butylamine, attains maxima and then decreases.The values of ∆u systematically become more positive with the rise in temperaturesuggesting that specific interaction increases due to enhanced thermal energy.
Figure 4 shows that viscosity deviation ∆η values are positive for butylamine+ 1-butanol and negative for butylamine + tert-butanol mixtures. The positivevalues of ∆n in butylamine + 1-butanol mixture can be explained on the basisof complex formation between unlike molecules through hydrogen bonding. Thenegative values of ∆n for butylamine + tert-butanol may be attributed to thepresence of weak dipole–dipole interaction due to predominance rupture of dipolarassociation of tert-butanol and steric hindrance produced by three methyl groupsover the hydrogen bond formed between unlike molecules. Our positive values of∆η in the case of butylamine + 1-butanol do not corroborate with the values of∆η on the same mixtures reported earlier by Wen-Lu Weng [13] and Dominguezet al. [17]. However, all the excess parameters V E
m , ∆Rm, and ∆η reported
Volumetric, Optical, Acoustical and Viscometric Study . . . 857
here by us are in conformity with each other. ∆η values are found to decreasewith increasing temperature in the positive and negative directions in the cases ofbutylamine + 1-butanol and butylamine + tert-butanol mixtures, respectively.
Figure 5 shows that ∆G∗E values are positive for butylamine + 1-butanol andnegative for butylamine + tert-butanol mixtures, respectively. However, a smallerpositive trend has been observed at a temperature of 313 K in butylamine richregion. The positive values of ∆G∗E indicates the presence of strong interactionin butylamine + 1-butanol mixture, whereas negative ∆G∗E values for butylamine+ tert-butanol mixture may be assigned to the predominance of dispersive forcesand also due to less acidic nature of tertiary alcohols than primary alcohols [18].Gupta et al. [19] and Mialkowski et al. [20] have also reported similar variationsin the ∆G∗E values for binary mixtures of ether + alcohols and γ-butyrolactone+ dimethylcarbonate.
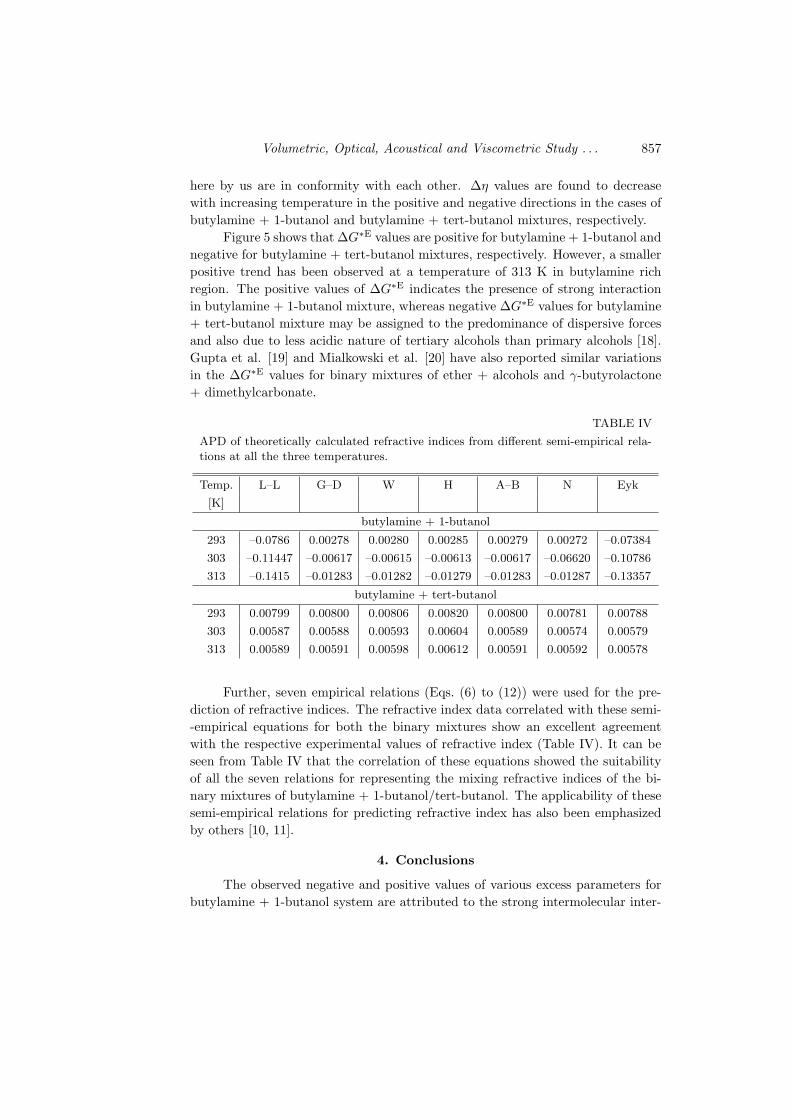
TABLE IV
APD of theoretically calculated refractive indices from different semi-empirical rela-
tions at all the three temperatures.
Temp. L–L G–D W H A–B N Eyk
[K]
butylamine + 1-butanol
293 –0.0786 0.00278 0.00280 0.00285 0.00279 0.00272 –0.07384
303 –0.11447 –0.00617 –0.00615 –0.00613 –0.00617 –0.06620 –0.10786
313 –0.1415 –0.01283 –0.01282 –0.01279 –0.01283 –0.01287 –0.13357
butylamine + tert-butanol
293 0.00799 0.00800 0.00806 0.00820 0.00800 0.00781 0.00788
303 0.00587 0.00588 0.00593 0.00604 0.00589 0.00574 0.00579
313 0.00589 0.00591 0.00598 0.00612 0.00591 0.00592 0.00578
Further, seven empirical relations (Eqs. (6) to (12)) were used for the pre-diction of refractive indices. The refractive index data correlated with these semi--empirical equations for both the binary mixtures show an excellent agreementwith the respective experimental values of refractive index (Table IV). It can beseen from Table IV that the correlation of these equations showed the suitabilityof all the seven relations for representing the mixing refractive indices of the bi-nary mixtures of butylamine + 1-butanol/tert-butanol. The applicability of thesesemi-empirical relations for predicting refractive index has also been emphasizedby others [10, 11].
4. Conclusions
The observed negative and positive values of various excess parameters forbutylamine + 1-butanol system are attributed to the strong intermolecular inter-
858 S. Singh et al.
action through H-bonding. The less negative values of V Em and ∆Rm at all the
three temperatures and small positive values of ∆G∗E at 313 K for binary mixtureof butylamine + tert-butanol are due to the weak specific interactions arising frominduced dipole–dipole forces. However, dispersive forces may be responsible fornegative values of ∆η.
References
[1] A. Ali, A.K. Nain, V.K. Sharma, S. Ahmad, Ind. J. Phys. 75B, 519 (2001).
[2] A. Pal, H. Kumar, Ind. J. Phys. 75B, 419 (2001).
[3] A. Ali, H. Soghra, Ind. J. Phys. 76B, 23 (2002).
[4] A. Pal, H. Kumar, Fluid Phase Equilib. 181, 17 (2001).
[5] T.M. Letcher, G.G. Redhi, Fluid Phase Equilib. 198, 257 (2002).
[6] H. Iloukhani, K. Khanlarzadeh, J. Chem. Eng. Data 51, 1226 (2006).
[7] J.M. Resa, S. Gonzalez, O.D. Zandaluce, J. Lanz, J. Chem. Eng. Data 24, 995
(2002).
[8] CRC Handbook of Chemistry and Physics, Ed. D.R. Lide, 76th ed., CRC Press,
India 1995-1996, p. 32.
[9] D.D. Perrin, W.L.F. Armarego, Purification of Laboratory Chemicals, Pergamon
Press, Oxford 1980.
[10] J.D. Pandey, A.K. Shukla, R.K. Shukla, R.D. Rai, Ind. J. Chem. 27A, 336 (1988).
[11] T.M. Aminabhavi, J. Chem. Eng. Data 29, 54 (1984).
[12] R.J. Fort, W.R. Moore, Trans. Faradays Soc. 61, 2102 (1965).
[13] Wen-Lu Weng, J. Chem. Eng. Data 45, 606 (2000).
[14] D. Papaioannou, M. Bridakis, C.G. Panayiotou, J. Chem. Eng. Data 38, 370
(1993).
[15] A. Ali, A.K. Nain, Pramana J. Phys. 58, 695 (2002).
[16] M. Gupta, I. Vibhu, J.P. Shukla, J. Phys. Chem. Liq. 41, 575 (2003).
[17] M. Dominguez, J. Pardo, M.C. Lopez, F.M. Royo, J.S. Urieta, Fluid Phase Equilib.
124, 147 (1996).
[18] R.J. Morrison, R.N. Boyd, Organic Chemistry, 6th ed., Prentice Hall of India,
Pvt. India 1999.
[19] M. Gupta, I. Vibhu, J.P. Shukla, Fluid Phase Equilib. 244, 26 (2006).
[20] C. Mialkowski, A. Chagnes, B. Carre, D. Willmann, D. Lemordant, J. Chem.
Thermodyn. 34, 1847 (2002).