volunteer lake assessment program individual lake reports ... · thorndike pond - camp wanocksett...
TRANSCRIPT
MORPHOMETRIC DATA
Flushing Rate (yr¹)
3,513,500
1998
2009 OLIGOTROPHIC
OLIGOTROPHIC
7
3.4
6,000
1.7Max. Depth (m):
Mean Depth (m):
Volume (m³):
Watershed Area (Ac.):
Shore Length (m):
THORNDIKE POND, JAFFREY, NH
TROPHIC CLASSIFICATION KNOWN EXOTIC SPECIES
Year Trophic class
Surface Area (Ac.): 265
Elevation (ft): 1159
P Retention Coef: 0.64
The Waterbody Report Card tables are generated from the 2012 305(b) report on the status of N.H. waters, and are based on data collected from 2001-2011.
Volunteer Lake Assessment Program Individual Lake Reports
2,560
Designated Use Parameter Category Comments
Phosphorus (Total) Slightly BadAquatic Life >/=5 samples and median is >threshold.
pH Slightly Bad >10% of samples exceed criteria by a small margin (minimum of 2 exceedances).
D.O. (mg/L) Encouraging < 10 samples and no exceedance of criteria. More data needed.
D.O. (% sat) Encouraging < 10 samples and no exceedance of criteria. More data needed.
Chlorophyll-a Slightly Bad >5 samples and median is > threshold.
E. coli Very GoodPrimary Contact Recreation All bacteria samples <75% of geometric mean criteria, but not enough to calculate geometric mean. Or, all bacteria
samples are < single sample criteria and calculated Geometric means are less than geometric mean criteria.
Chlorophyll-a Very Good At least 10 samples with 0 exceedances of criteria.
BEACH PRIMARY CONTACT ASSESSMENT STATUS
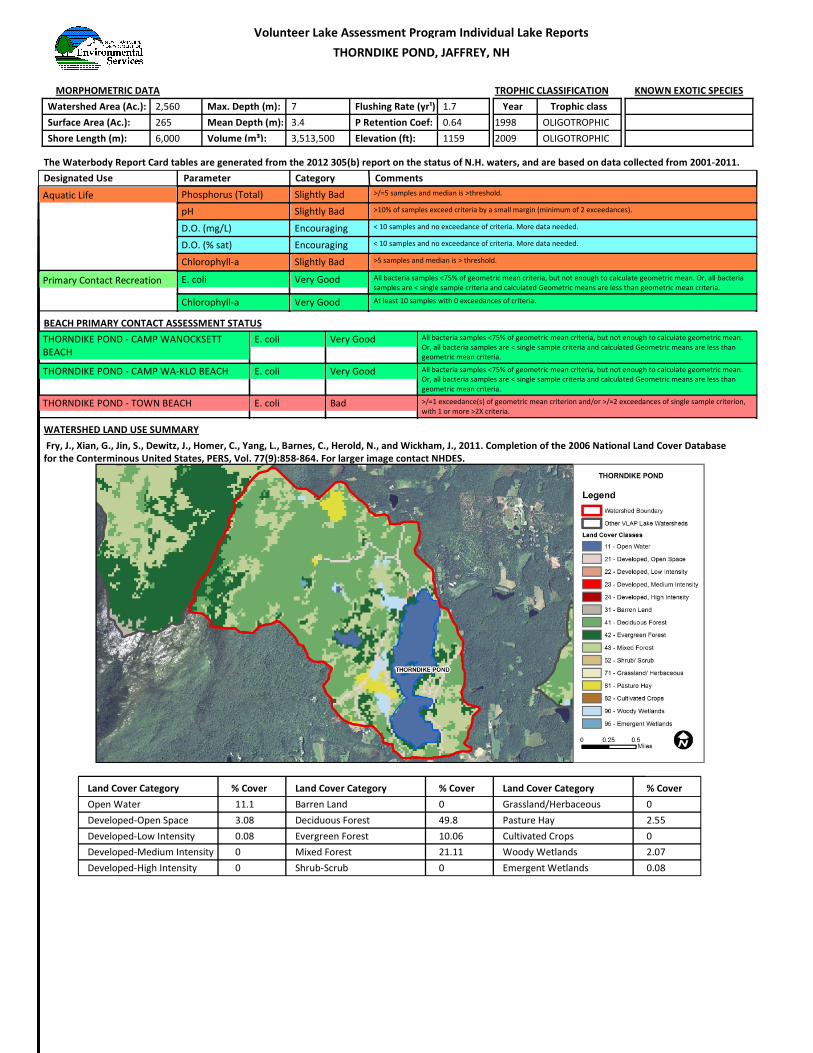
WATERSHED LAND USE SUMMARY
Fry, J., Xian, G., Jin, S., Dewitz, J., Homer, C., Yang, L., Barnes, C., Herold, N., and Wickham, J., 2011. Completion of the 2006 National Land Cover Database
for the Conterminous United States, PERS, Vol. 77(9):858-864. For larger image contact NHDES.
E. coli Very Good All bacteria samples <75% of geometric mean criteria, but not enough to calculate geometric mean.
Or, all bacteria samples are < single sample criteria and calculated Geometric means are less than
geometric mean criteria.
THORNDIKE POND - CAMP WANOCKSETT
BEACH
E. coli Very Good All bacteria samples <75% of geometric mean criteria, but not enough to calculate geometric mean.
Or, all bacteria samples are < single sample criteria and calculated Geometric means are less than
geometric mean criteria.
THORNDIKE POND - CAMP WA-KLO BEACH
E. coli Bad >/=1 exceedance(s) of geometric mean criterion and/or >/=2 exceedances of single sample criterion,
with 1 or more >2X criteria.THORNDIKE POND - TOWN BEACH
Land Cover Category % Cover Land Cover Category % Cover Land Cover Category % Cover
Open Water 11.1
Developed-Open Space 3.08
Developed-Low Intensity 0.08
Developed-Medium Intensity 0
Developed-High Intensity 0
Barren Land 0
Deciduous Forest 49.8
Evergreen Forest 10.06
Mixed Forest 21.11
Shrub-Scrub 0
Grassland/Herbaceous 0
Pasture Hay 2.55
Cultivated Crops 0
Woody Wetlands 2.07
Emergent Wetlands 0.08

VOLUNTEER LAKE ASSESSMENT PROGRAM INDIVIDUAL LAKE REPORTS
THORNDIKE POND, JAFFREY, NH
2012 DATA SUMMARY
HISTORICAL WATER QUALITY TREND ANALYSIS
Parameter Trend Explanation
Chlorophyll‐a Variable Data fluctuate annually, but are not
significantly increasing or decreasing.
Transparency Variable Data fluctuate annually, but are not
significantly increasing or decreasing.
Phosphorus (epilimnion) Variable Data fluctuate annually, but are not
significantly increasing or decreasing.
OBSERVATIONS AND RECOMMENDATIONS (Refer to Table 1 and Historical Deep Spot Data Graphic)
9 CHLOROPHYLL‐A: Chlorophyll levels were low throughout the summer, decreased from 2011
and were below the NH lake median. Historical trend analysis indicates chlorophyll levels tend
to fluctuate from year to year.
9 CONDUCTIVITY/CHLORIDE: Conductivity and chloride were low at all stations.
9 TOTAL PHOSPHORUS: Deep spot phosphorus levels were low throughout the summer and less
than the NH lake median. Historical trend analysis indicates the epilimnetic (upper water
layer) phosphorus tends to fluctuate from year to year. South West Inlet phosphorus was
slightly elevated in July potentially due to agricultural activities upstream and flushing from a
recent rain event.
9 TRANSPARENCY: Transparency improved as the summer progressed, was greater than 2011 and
the NH lake median. Historical trend analysis indicates transparency fluctuates from year to
year.
9 TURBIDITY: Turbidity levels were relatively low at all stations throughout the summer.
9 PH: pH levels tend to be lower than desirable.
9 RECOMMENDED ACTIONS: Bracket South West Inlet upstream to determine potential impacts of
agricultural activities. Keep up the great work!
NH Median Values: Median values for specific
parameters generated from historic lake monitoring
data.
Alkalinity: 4.9 mg/L
Chlorophyll‐a: 4.58 mg/m3
Conductivity: 40.0 uS/cm
Chloride: 4 mg/L
Total Phosphorus: 12 ug/L
Transparency: 3.2 m
pH: 6.6
This report was generated by the NH DES Volunteer Lake
Assessment Program (VLAP). For more information contact:
Sara Steiner
PO Box 95
Concord, NH 03302‐0095
(603) 271‐2658
Table 1. 2012 Average Water Quality Data for THORNDIKE POND
Alk. Chlor‐a Chloride Cond. Total P Trans. Turb. pH
Station Name mg/l ug/l mg/l uS/cm ug/l m ntu
NVS VS
Deep Epilimnion 2.13 3.19 4 34 8 4.23 4.32 1.06 6.5
Deep Hypolimnion 34 7 1.22 6.46
North West Inlet 29 9 1.31 6.13
Outlet 32 10 0.87 6.28
South West Inlet 38 15 1.31 6.13
NH Water Quality Standards: Numeric criteria for specific
parameters. Results exceeding criteria are considered a
water quality violation.
Chloride: < 230 mg/L (chronic)
E. coli: > 88 cts/100 mL – public beach
E. coli: > 406 cts/100 mL – surface waters
Turbidity: > 10 NTU above natural level
pH: 6.5‐8.0 (unless naturally occurring)
0
1
2
3
4
5
6
0 5 10 15 20 25
Temperature (C) and Dissolved Oxygen (mg/L)
Dep
th i
n m
ete
rs
Temp
DO
Dissolved Oxygen & Temperature Profile