volunteers mentoring youth · black and male mentors is to invite and engage them in volunteering...
TRANSCRIPT

VOLUNTEERS MENTORING YOUTH:Implications for Closing the Mentoring Gap

Authors
John Foster-Bey, Senior Advisor to the Director, Office of Research and Policy Development, Corporation forNational and Community Service
Nathan Dietz, Research Associate and Statistician, Office of Research and Policy Development, Corporation forNational and Community Service
Robert Grimm, Jr., Director, Office of Research and Policy Development, Corporation for National andCommunity Service
Acknowledgements
There were several individuals who generously provided their time and input on this project. Their comments andthoughts contributed mightily to improving the quality of the final report. Dr. Jean Rhodes, professor ofpsychology at University of Massachusetts-Boston and one of the nation's leading experts on youth mentoring,reviewed and provided comments on our research design and approach and early findings. Dr. Rhodes also readand commented on the final draft. Her comments were crucial in helping us shape the final direction of theresearch. Dr. Jay A. Winsten, Associate Dean of the Harvard School of Public Health, and Tonya Wiley and CindySturdivant of MENTOR also read the final draft and provided very helpful comments and insights.
The Corporation for National and Community Service provides opportunities forAmericans of all ages and backgrounds to serve their communities and country throughthree programs: Senior Corps, AmeriCorps, and Learn and Serve America. Together withUSA Freedom Corps, the Corporation is working to foster a culture of citizenship,service, and responsibility in America.
Upon request this material will be made available in alternative formats for people with disabilities. Copyright May, 2006. The Corporation for National and CommunityService. All rights reserved.

Executive Summary . . . . . . . . . . . . . . . . . . . . . . . . . . . . . . . . . . . . . . . . . . . . . . . . . . . . . . . . . . .2
How Many Adults Actually Volunteer as Mentors? . . . . . . . . . . . . . . . . . . . . . . . . . . . . . . . . . . . . . .7
What Differences Exist Between Volunteers That Engage in
Mentoring Youth and Volunteers Who Do Not Mentor? . . . . . . . . . . . . . . . . . . . . . . . . . . . . . . . . . .7
Age and Mentoring . . . . . . . . . . . . . . . . . . . . . . . . . . . . . . . . . . . . . . . . . . . . . . . . . . . . . . . . . . . .8
The Influence of Gender, Race, and
Ethnicity on Mentoring . . . . . . . . . . . . . . . . . . . . . . . . . . . . . . . . . . . . . . . . . . . . . . . . . . . . . . . . .8
Socio-economic Characteristics and Mentoring . . . . . . . . . . . . . . . . . . . . . . . . . . . . . . . . . . . . . . . .11
Volunteering Characteristics and Mentoring . . . . . . . . . . . . . . . . . . . . . . . . . . . . . . . . . . . . . . . . . .11
Who Is Most Likely to Become a Mentor? . . . . . . . . . . . . . . . . . . . . . . . . . . . . . . . . . . . . . . . . . . .13
Characteristics That Only Influence Volunteering . . . . . . . . . . . . . . . . . . . . . . . . . . . . . . . . . . . . . .18
Characteristics That Only Influence Volunteers to Engage in Mentoring . . . . . . . . . . . . . . . . . . . . . . . . . . . . . . . . . . . . . . . . . . . . . . . . . . . . . . . . .19
Conclusion and Policy Implications . . . . . . . . . . . . . . . . . . . . . . . . . . . . . . . . . . . . . . . . . . . . . . . .20
Endnotes . . . . . . . . . . . . . . . . . . . . . . . . . . . . . . . . . . . . . . . . . . . . . . . . . . . . . . . . . . . . . . . . . .22
Appendix 1 . . . . . . . . . . . . . . . . . . . . . . . . . . . . . . . . . . . . . . . . . . . . . . . . . . . . . . . . . . . . . . . .23
Appendix 2 . . . . . . . . . . . . . . . . . . . . . . . . . . . . . . . . . . . . . . . . . . . . . . . . . . . . . . . . . . . . . . . .25
TABLE OF CONTENTS
2
BACKGROUND
To develop a greater understanding of the characteristicsand traits that distinguish individuals whosevolunteering includes mentoring youth from volunteerswho do not mentor, the Corporation for National andCommunity Service conducted a close analysis of the2005 Volunteer Supplement of the Current PopulationSurvey (CPS).1 Corporation researchers examinedwhether demographic, socioeconomic, or otherobservable factors could be used to distinguish betweenvolunteers who mentor and the general population ofvolunteers who do not mentor, as well as to determinewhich of the above factors are most influential inpredicting who is most likely to be engaged in mentoringactivities. The expectation is that the informationgleaned will help mentoring programs better identifyand recruit the types of individuals who are most likelyto be favorably disposed toward mentoring, and therebyhelp to reduce the “mentoring gap.” 2
KEY FINDINGS: Mentoring Is a Common Part of AmericanVolunteering
n18% of all volunteers—or 11.5 million of America’s 65.4million volunteers—engage in some youth mentoringactivities each year through an organization.
The Propensity to Be a Mentor Declines with Age
nVolunteers 16 to 24 years old are the most likelygroup to be mentors.
nVolunteers 65 years and older are the least likelygroup to mentor.
nStill, 41% of volunteers who engage in mentoring youthare baby boomers—i.e., between the ages of 41 and 59.3
Black Volunteers Are More Likely Than WhiteVolunteers to Be Mentors
n25% of black volunteers are engaged in mentoring,compared to 17% of white volunteers.
nHowever, minorities do volunteer at lower rates—22%for blacks versus 30% for whites.
nHispanic volunteers are slightly less likely to beengaged in mentoring compared to non-Hispanics.However, when all other factors are considered, thereare no real differences between Hispanic and non-Hispanic volunteers in their probability of beingengaged in mentoring.
Male and Female Volunteers Engage in Mentoringat Similar Rates
n18% of male volunteers and 18% of femalevolunteers are engaged in mentoring.
nHowever, males do volunteer at lower rates—25% formen versus 32% for women.
Substantial Mentoring Takes Place ThroughReligious Organizations
nAlmost 43% of all volunteers engaged in mentoringvolunteer in or through religious organizations (thenext most prevalent site for mentoring is educationalorganizations, at 31%).
Mentors Are Often Drawn from the Ranks ofCurrent Volunteers
n87% of volunteers involved in mentoring perform atleast one other volunteer activity for their mainorganization in addition to mentoring, while only40% of volunteers not involved in mentoring performtwo or more volunteer activities.
nVolunteers who are engaged in mentoring serve amedian of 80 hours annually, while volunteers whodo not mentor serve a median of 40 hours annually.
Mentors Regularly Work Full-Time
n59% of all volunteers who engage in mentoring workfull-time—a higher percentage than volunteers whodo not engage in mentoring (53%).
nDespite having less discretionary time, these adultvolunteers are as inclined to mentor youth asvolunteers working part-time, and more likely thannon-working volunteers.
EXE CUT I VE SUMMARY

3
CONCLUSION AND POLICY IMPLICATIONS
The analysis shows that one of the most importantdeterminants of which volunteers are also involved inmentoring activities is age. The probability of being amentor declines dramatically after age 24; indeed,volunteers 65 years and older are the least likely to beengaged in mentoring activities compared to youngercohorts. This suggests that college-age adults and evenhigh schoolers are prime candidates to be recruited asmentors. While the data also suggest that enlisting morebaby boomers and other older adults as youth mentors ismore challenging, it is important to note that a largenumber of baby boomers and other older adult volunteerscurrently are involved in mentoring.
Another promising mentor recruitment strategy isfocusing on encouraging more current volunteers tobecome mentors, particularly those volunteers who havealready made a substantial commitment to their mainvolunteer organization. Moreover, the finding thatmentoring takes place predominantly through religiousorganizations suggests that religious institutions are anexcellent area to focus recruitment efforts.
This type of strategy may pose real opportunities forexisting community-based mentoring programs. Oneapproach is for traditional mentoring programs to domore partnering with other types of volunteerorganizations, such as religious institutions. Thisapproach is already being tried in several places. Anotherapproach may be for mentoring programs to recruitvolunteers to do other needed tasks. Once they’veformed some attachment to the organization and itsmission, these volunteers may be more amenable tobecoming mentors.
The importance of providing mentoring opportunities atworkplaces is another important strategy to reach moreyouth with mentors. Our research found that volunteersemployed full-time—despite having less discretionarytime—are actually as likely to mentor as people working
part-time, and a new poll by the nonprofit groupMENTOR4 revealed that mentoring at or near theworkplace, as well as release time during work hours,substantially increased people’s willingness to seriouslyconsider becoming a mentor. Together, these reportssuggest that providing convenient mentor opportunitiesat work are important for recruiting more mentors.
Race and sex also have an effect on who becomes amentor. Although males and blacks volunteer in generalat lower rates than do females and whites, it turns outthat blacks are more likely—and males are as likely—astheir counterparts to engage in mentoring as one of theirvolunteer activities. This is an interesting finding sincethe general consensus in the field is that there is ashortage of male and minority mentors. It appears thatone constraint may be the lower overall volunteer ratesof men and minorities. Assuming that the relationshipbetween volunteering and volunteering as a mentorremains constant, the number of male and minoritymentors would increase if their overall volunteer raterose. Thus, a promising approach to developing moreblack and male mentors is to invite and engage them involunteering in general. If, for example, the AfricanAmerican volunteer rate increased by 2 percentage points(22.1% to 24.1%), there would be another 533,000 blackvolunteers, and an additional 125,000 black mentors.
Without more knowledge about the demographics ofmentor waitlists, we do not know for certain the genderand racial characteristics of youths waiting for a mentor,though anecdotal evidence suggests that adisproportionate number are minorities and males. If thisis the case, it is possible that doubling or even triplingthe numbers of male and minority mentors may not beenough to meet the effective demand for such mentors.Instead it may require that mentoring programs not onlyincrease the overall supply of mentors but employ morementoring models that reach more kids with one adultmentor and other innovative mentoring approaches inorder to close the mentoring gap.
EXECUT IV E S UMMARY
4
VOL UN T EERS MENTOR ING YOUT H
1 The CPS is a comprehensive and scientifically rigorous survey of 60,000 American households that is conducted each month by the U.S.Census Bureau for the Bureau of Labor Statistics. With the Corporation’s support, the Census Bureau has administered a volunteersupplement each September since 2002. The September 2005 survey is the first time respondents to the CPS were asked whether one oftheir volunteer activities is mentoring youth. Unfortunately, the 2005 CPS volunteer supplement does not identify whether mentoring isthe primary volunteer activity for those volunteers who say they mentor—a limitation that should be corrected in the next CPS survey.
2 Other studies, including the National Mentoring Poll conducted by MENTOR, show that 14.6 million youth currently are in need of a mentor. 3 Baby boomers are defined as those born between the years 1946 and 1964.4 For more information on the report Mentoring in America 2005, go to www.mentoring.org.

VOLUNTEERS MENTORING YOUTH:Implications for Closing the Mentoring Gap
6
VOL UN T EERS MENTOR ING YOUT H
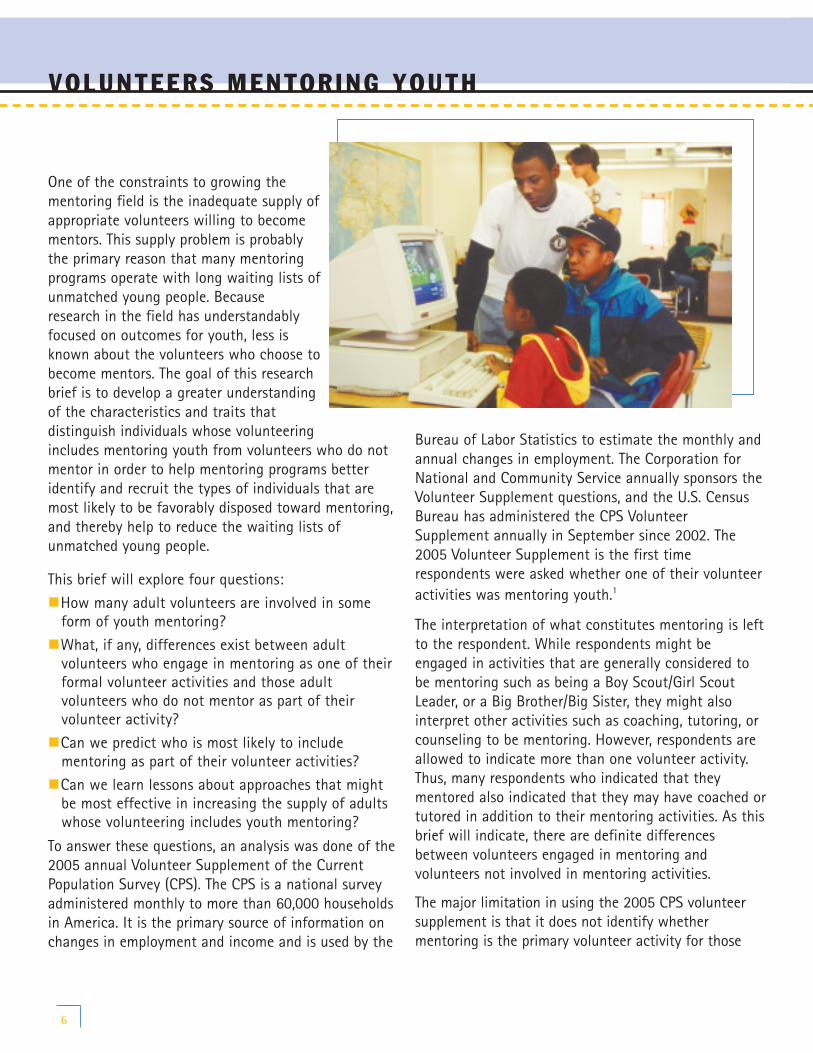
One of the constraints to growing thementoring field is the inadequate supply ofappropriate volunteers willing to becomementors. This supply problem is probablythe primary reason that many mentoringprograms operate with long waiting lists ofunmatched young people. Becauseresearch in the field has understandablyfocused on outcomes for youth, less isknown about the volunteers who choose tobecome mentors. The goal of this researchbrief is to develop a greater understandingof the characteristics and traits thatdistinguish individuals whose volunteeringincludes mentoring youth from volunteers who do notmentor in order to help mentoring programs betteridentify and recruit the types of individuals that aremost likely to be favorably disposed toward mentoring,and thereby help to reduce the waiting lists ofunmatched young people.
This brief will explore four questions:
nHow many adult volunteers are involved in someform of youth mentoring?
nWhat, if any, differences exist between adultvolunteers who engage in mentoring as one of theirformal volunteer activities and those adultvolunteers who do not mentor as part of theirvolunteer activity?
nCan we predict who is most likely to includementoring as part of their volunteer activities?
nCan we learn lessons about approaches that mightbe most effective in increasing the supply of adultswhose volunteering includes youth mentoring?
To answer these questions, an analysis was done of the2005 annual Volunteer Supplement of the CurrentPopulation Survey (CPS). The CPS is a national surveyadministered monthly to more than 60,000 householdsin America. It is the primary source of information onchanges in employment and income and is used by the
Bureau of Labor Statistics to estimate the monthly andannual changes in employment. The Corporation forNational and Community Service annually sponsors theVolunteer Supplement questions, and the U.S. CensusBureau has administered the CPS VolunteerSupplement annually in September since 2002. The2005 Volunteer Supplement is the first timerespondents were asked whether one of their volunteeractivities was mentoring youth.1
The interpretation of what constitutes mentoring is leftto the respondent. While respondents might beengaged in activities that are generally considered tobe mentoring such as being a Boy Scout/Girl ScoutLeader, or a Big Brother/Big Sister, they might alsointerpret other activities such as coaching, tutoring, orcounseling to be mentoring. However, respondents areallowed to indicate more than one volunteer activity.Thus, many respondents who indicated that theymentored also indicated that they may have coached ortutored in addition to their mentoring activities. As thisbrief will indicate, there are definite differencesbetween volunteers engaged in mentoring andvolunteers not involved in mentoring activities.
The major limitation in using the 2005 CPS volunteersupplement is that it does not identify whethermentoring is the primary volunteer activity for those

7
VOLUNT EERS M ENT OR ING YOUTH
volunteers who say theymentor.2 This meansthat for volunteers thatperform more than onevolunteer activity thereis no conclusive way ofascertaining how muchof their volunteer timeis committed solely tomentoring. It also doesnot differentiatebetween volunteers who mentor one-on-one from thosewho mentor groups. Nonetheless, it provides anextremely robust picture of adults whose volunteeractivities include mentoring youth.
HOW MANY ADULTS ACTUALLY VOLUNTEER AS MENTORS?nFinding: 11.5 million adults engage in volunteering
activities that include mentoring youth.
nFinding: 1/6 of all adult volunteers engage in somementoring of youth.
In September 2005, there were about 65.4 millionadults aged 16 and older who performed some type ofvolunteer activity for a nonprofit organization. Thesevolunteers represented approximately 29% of the USadult population.3 Among these 65.4 millionvolunteers, 11.5 million said that at least one of theirformal volunteer activities was mentoring a youngperson.4 These 11.5 million mentors constituted 17.6%of all formal volunteers (see Table 1 in Appendix 1and Figure 1, above).
As the data indicate, volunteers who mentor are asmall but significant minority of all volunteers. Arethere distinct characteristics that tend to increasethe odds that certain adult volunteers will bementors? The remainder of this brief will comparevolunteers who mentor to volunteers who do not
mentor. The goal is to determine if there are realdifferences between the two types of volunteers thatcan be used to predict who is most likely to engagein mentoring.
WHAT DIFFERENCES EXIST BETWEEN VOLUNTEERSTHAT ENGAGE IN MENTORING YOUTH ANDVOLUNTEERS WHO DO NOT MENTOR?
In order to better understand why some volunteerschoose to mentor and some do not, it is useful toknow more about how the members of each volunteergroup differ from each other. In this section, weattempt to discover if differences exist in certain keydemographic, socioeconomic, and volunteeringcharacteristics between volunteers who mentor andthose who do not. We look at this in two ways: 1) forselected characteristics, we examine the percentageof volunteers who are either mentors or non-mentors.For example, for age we examine what percentage of20-24 year old volunteers are either mentors or non-mentors; 2) we examine the differences in the overallpopulation distributions for mentors and non-mentors for the same selected characteristics. Forinstance, we explore what percentage or share of allmentors are 20-24 years old. In general, we usegraphs to illustrate the first approach; and the datain Table 1, which can be found in Appendix 1, as thesource of our findings for the second approach.
53.8
11.5
0
10
20
30
40
50
60
Non-mentors Total Mentors
Volunteers
InM
illio
ns
Figure 1. Number of Volunteers by Mentors vs. Non-Mentors

8
VOL UN T EERS MENTOR ING YOUT H
AGE AND MENTORING nFinding: Volunteers ages 20-
24 are the most likely toengage in mentoring youth.
nFinding: The propensity to bea mentor declines with age.However, a substantialnumber of mentors are babyboomers and other oldervolunteers.
As Figure 2 shows, compared toother age groups, 20-24 year oldvolunteers are the most likely toengage in mentoring youth. Infact, 24% of the volunteers inthis age group engage in mentoring. After age 24 thepercentage of volunteers in each age cohort whovolunteered as mentors consistently declined. Forvolunteers 65 and over, only 7% engage in mentoringas a volunteer activity.
Despite the fact that the likelihood of a volunteerbeing a mentor appears to decline with age, oldervolunteers make a substantial contribution to theoverall number of mentors. For example, as Table 1shows, baby boomers5 represent 41% of all volunteersthat mentor. Moreover, 38% of all volunteers whomentor are over 45 years old. In short, despite the factthat most volunteer mentors are under age 45, babyboomers and other older volunteers are an importantsource of mentors for youth (see Table 1).
THE INFLUENCE OF GENDER, RACE, AND ETHNICITYON MENTORINGnFindings: Overall, males and female volunteers
appear to mentor at roughly the same rateswhen they volunteer. However, more mentors arefemale because females volunteer at a higherrate than males.
nFindings: Blacks are more likely than whites orother racial or ethnic minorities to be mentorswhen they volunteer. Hispanics are slightly lesslikely than non-Hispanics to be mentors whenthey volunteer.
Mentoring is a programmatic approach to help connectyoung people to positive adult relationships. The needfor this type of connection is thought to be particularlyacute for disadvantaged young men and for minorities.Many mentoring programs prefer to make same gender,same race matches where possible. Anecdotal evidence6
suggests that many programs experience a shortage ofmale and minority mentors relative to the demand forsuch male-to-male and minority-to-minority mentoringmatches. This gap in the supply and demand formentors is exemplified in the size of an organization’swaiting list of unmatched young people.
Despite the fact that females are much more likely tovolunteer than males – for example, in 2005, 32.4% offemales and 25% of males volunteered – male andfemale volunteers had roughly the same propensity toengage in mentoring. In 2005, as Figure 3 shows,
Figure 2. Among Volunteers Percentage of Mentors by Age Cohort
79%75%
79% 79%82%
86%
93%
21% 25% 21% 21%18%
14%7%
0.%
10%
20%
30%
40%
50%
60%
70%
80%
90%
100%
16 -19 20-24 25-34 35-44 45-54 55-64 65 andover
Age Cohort
Non-mentors Mentors

9
V OLUNT EERS M ENT OR ING YOUTH
approximately 18% of all male volunteers and 18% offemale volunteers engaged in mentoring. However, justas with volunteering in general, more mentors arefemales than males because of the gender gap involunteering. Thus, as seen in Table 1, 57% of all youthmentors were females in 2005.
Because blacks and to a lesser extent Hispanics aremore likely than whites and Asians to grow-up in
households with only one parent present7, they mayhave a higher demand for developing structured one-to-one positive relationships with adult role models.Compared to other racial and ethnic groups, blacksactually had the highest percentage of volunteers whowere also engaging in mentoring. In 2005, as Figure 4demonstrates, 25% of black volunteers were engaged inmentoring compared to only 17% of whites and 17% of
Figure 3. Among Volunteers Percentage of Mentors by Gender
82% 82%
18% 18%
0%
10%
20%
30%
40%
50%
60%
70%
80%
90%
MALE FEMALE
Gender
Non-mentors Mentors
Per
cen
t
Figure 4. Among Volunteers Percentage of Mentors by Race and Ethnicity
83%
75%
83%85%
82%
17%
25%
17%15%
18%
0%
10%
20%
30%
40%
50%
60%
70%
80%
90%
White Black Other Hispanic Non-Hispanic
Race and Ethnicity
Non-mentors Mentors

10
VOL UN T EERS MENTOR ING YOUT H
Asians and other racial minorities.8 While blacksmade up slightly less than 9% of all volunteers, theywere almost 12% of all mentors, as Table 1 shows.This suggests that black volunteers are heavilyinvolved in mentoring. If there is a gap between thenumber of African American youngsters in formalmentoring programs requesting a mentor and thesupply of black volunteers who are willing to beyouth mentors, the problem may be a demand ratherthan a supply issue.
While black volunteers have the highest probabilityof being a mentor, Hispanic volunteers are somewhatless likely to be mentors than non-Hispanicvolunteers (see Figure 4). Hispanics were 6.9% of allvolunteers, but, as Table 1 shows, they were only5.7% of all mentors. This tends to support theconcern that there may be a potential shortage ofHispanic mentors.
While our findings do indicate that Hispanicvolunteers may be less inclined to be mentorscompared to non-Hispanics, there appears to be no
evidence that male and African American volunteersare reticent to serve as mentors. Indeed, AfricanAmerican volunteers are more likely than whites orother racial/ethnic groups to be mentors, and malevolunteers appear to be as likely as female volunteersto be mentors.
If there is a perceived shortage of male, black andHispanic mentors, it may be more a function of lowvolunteer rates rather than their propensity to bementors. For example, if the African Americanvolunteer rate increased by two percentage points(22.1% to 24.1%), holding the mentoring ratesconstant, there would be another 533,000 blackvolunteers, and an additional 125,000 black mentors.Similarly, if the Hispanic volunteer rate increased 2percentage points, there would be another 617,000Hispanic volunteers, and another almost 254,000Hispanic mentors. Finally, if the male volunteer ratewent up 2 percentage points, holding the mentoringrates constant, there would be an additional 1.8 millionmale volunteers, and another 400,000 male mentors.
Figure 5. Among Volunteers Percentage of Mentors by Education Attainment
92%86%
19%
81%82%
9%14% 18%
0%
10%
20%
30%
40%
50%
60%
70%
80%
90%
100%
< High school High school only Some college College graduates
Education Attainment
Non-mentors Mentors

11
SOCIO-ECONOMIC CHARACTERISTICS AND MENTORING
nFinding: The chance of a volunteer being involvedin mentoring increases as a volunteer’s educationlevel rises.
nFinding: Most volunteers that engage in mentoringare employed full-time.
In general volunteers as a class appear to be bettereducated and more likely to be employed than non-volunteers. The question we asked is whethermentors have even higher education and greateremployment levels than the average volunteer.
Indeed, mentors appear to have higher educationlevels than volunteers that do not mentor. Thechance that a volunteer will also be a mentorappears to rise with educational attainment. Figure 5illustrates that compared to volunteers with a highschool education or less, volunteers with a collegeeducation are much more likely to be mentors. AsTable 1 shows, there are similar results whendifferences in educational attainment are examinedwithin each group. Relative to non-mentors, morementors are college-educated and fewer have only ahigh school education or less.
While education is a key indicator of socioeconomicstatus, employment status is also an importantmeasure. Table 1 shows that a larger percentage ofvolunteer mentors are employed full-time comparedto non-mentor volunteers. While on average allvolunteers are more highly connected to the labormarket than non-volunteers, mentors appear to havehigher labor market attachment than other types of volunteers.9
Together the education and employment findingsindicate that mentors are well-educated,economically successful individuals. This seemsconsistent with the goal of exposing at-risk young
people to successful adult role models. However, itraises real challenges for recruitment, since effortsaimed at trying to encourage even more of thesehighly successful individuals to be youth mentorsmay require new approaches.
VOLUNTEERING CHARACTERISTICS AND MENTORINGnFinding: Almost 43% of volunteers who engaged
in mentoring did so through religiousorganizations, and another 31% engaged inmentoring through or in educational institutions.
nFinding: 67% of volunteers who engage in somementoring volunteer 12 or more weeks per yearcompared to only 49% of volunteers who are notinvolved in mentoring.
nFinding: Volunteers engaged in mentoring serve amedian of 80 hours per year, while the medianhours for volunteers not involved in mentoring is40 hours per year.
While there appear to be differences betweenvolunteers who engage in mentoring versus othervolunteers that do not mentor on certain demographicand socioeconomic indicators, mentors also may bedifferent in volunteer characteristics. For example, domentors come to volunteering in different ways thannon-mentors? Do they volunteer in different types oforganizations? Are they more active as volunteers? Arethey more likely to volunteer on a regular basis?
Mentors and non-mentors appear to have very similarexperiences in how they became volunteers. Table 1shows that the percentage of both groups thatapproached the organization on their own is almostidentical. Similarly, there is only a slight difference in thepercentage of mentors and non-mentors who becamevolunteers because someone asked them to volunteer.
Compared to the overall volunteer population, there aremore marked differences in where these mentors dotheir volunteer work. While American volunteers aremost commonly found in religious or educational
VOLUNT EERS M ENT OR ING YOUTH

12
VOL UN T EERS MENTOR ING YOUT H
organizations, volunteers who mentor are even morelikely to be found in religious organizations oreducational institutions (see Table 1 and Figure 6a).We found that 43% of volunteers who engaged inmentoring did that activity through religiousorganizations, and another 31% engaged inmentoring through or in educational institutions(see Table 1 and Figures 6a, 6b).
Mentors and non-mentors also seemed to havedifferent levels of engagement with their mainvolunteer organization. Two factors illustrate thispoint. First, Table 1 shows that mentors are muchmore likely than non-mentors to perform multiplevolunteer activities for their main volunteerorganization. Eighty-seven percent of allvolunteers engaged in mentoring perform two ormore volunteer activities for their main volunteerorganization, compared to only 40% of volunteersnot involved in mentoring. In many ways, this issurprising because the mentoring relationship isoften very demanding of volunteer time andinvolvement. One might expect that volunteerswho mentor would be engaged in fewer ratherthan more activities than non-mentors. This mayimply that volunteers become mentors becausethey are already highly engaged volunteers withtheir main organization. If this is the case, itsuggests that a prime source of new mentors foran organization is among the cadre of individualswho are already actively volunteering.
Second, while volunteering is generally seen as anet social good, there may be important differencesbetween volunteering once or twice a year for asingle event and volunteering on a regular monthlyor even weekly basis. This may be particularlyimportant for mentors. There is evidence that theeffectiveness of mentoring is a function of howmuch time mentors spend with their young charges.Short-term mentoring matches have been shown to
do more harm than no mentoring at all.10 Given this,it is important to examine whether there are anydifferences in the amount of time mentors and non-mentors devote to their volunteer activities.
An individual volunteering 12 or more weeks is onaverage volunteering at least once per month. In ourYouth Helping America series report on volunteeringtrends among teenagers, this 12-week minimum wasused to determine if an individual is a regular
Figure 6a. Percent of Volunteers Who Mentor by Type of Volunteer Organization
43%
31%
6%
2%
10%
1%5%2%
Religious org.
Educational
Youth Services
Sports or hobby
Social and communityservice/ Civic
Political, advocacy, Union,Business
Health-oriented
Other
Figure 6b. Percent of Volunteers Who Do Not Mentor by Type of Volunteer Organization
34%
23%1%
19%
2%
10%
2%
9%
Religious org.
Educational
Youth Services
Sports or hobby
Social and communityservice/ civic
Political, advocacy, union,business
Health-oriented
Other

13
volunteer, providing volunteerservice throughout the year.11
Based on this 12-week minimumindicator, the likelihood of avolunteer engaging in mentoringincreases as volunteers movefrom being what we calledepisodic volunteers (serving acouple weeks a year) to beingregular volunteers. To put itanother way, 67% of volunteersengaged in mentoring are alsoregular volunteers—i.e., theyvolunteer 12 or more weeks peryear—compared to only 49% ofvolunteers not involved in mentoring (see Table 1 and Figure 7). These findings indicate that mentorsare much more likely than non-mentors to beproviding volunteer services on a regular basisthroughout the year.
Finally, the differences between volunteers engaged inmentoring and volunteers not involved in mentoring inthe number of weeks volunteered annually is alsomirrored in the number of hours each group volunteers.Table 1 illustrates that the median hours volunteeredannually for volunteers engaged in mentoring andvolunteers not involved in mentoring are 80 hours and40 hours respectively.
SUMMARYIt appears that there are some distinct differencesbetween volunteers whose activities include mentoringyouth and volunteers who do not do such activities.The chances that a volunteer will be involved inmentoring are greatest for younger volunteers and forAfrican American volunteers. The probability that avolunteer will be involved in mentoring rises aseducational attainment increases and is also higher foremployed volunteers.
Finally, mentors demonstrate some differences in theirvolunteer characteristics. Mentors are more likely thannon-mentors to perform multiple volunteer activitiesfor their main volunteer organization. They are foundprimarily in religious and educational institutions, andthey are much more likely than non-mentors tovolunteer 12 or more weeks per year.
WHO IS MOST LIKELY TO BECOME A MENTOR?
The previous section explored differences in a varietyof demographic, socioeconomic, and volunteeringcharacteristics between volunteers that engage insome mentoring activities and volunteers that are notinvolved in mentoring. The strong tendency ofvolunteers involved in mentoring to engage inmultiple volunteer activities and the large percentageof such volunteers that volunteer 12 or more weeksper year suggests that many volunteers engaged inmentoring activities are being recruited from existingvolunteers rather than from non-volunteers. Giventhis, this section will discuss which characteristicsmake the most contributions to predicting whichadults will be volunteers; and which characteristicsare most useful in predicting which volunteers willbecome engaged in mentoring.
Figure 7. Percent Distribution of Mentors and Non-Mentors by Number of Weeks Volunteered Annually
26% 25%
49%
12%
21%
67%
0 %
10%
20%
30%
40%
50%
60%
70%
80%
Episodic volunteers (0-2 weeks per year) Occasional volunteers (3-11 weeks per
year)
Regular volunteers (12 or more weeks
per year)
Number of Weeks Volunteered Annually
Non-mentors Mentors
V OLUNT EERS M ENT OR ING YOUTH
14
VOL UN T EERS MENTOR ING YOUT H
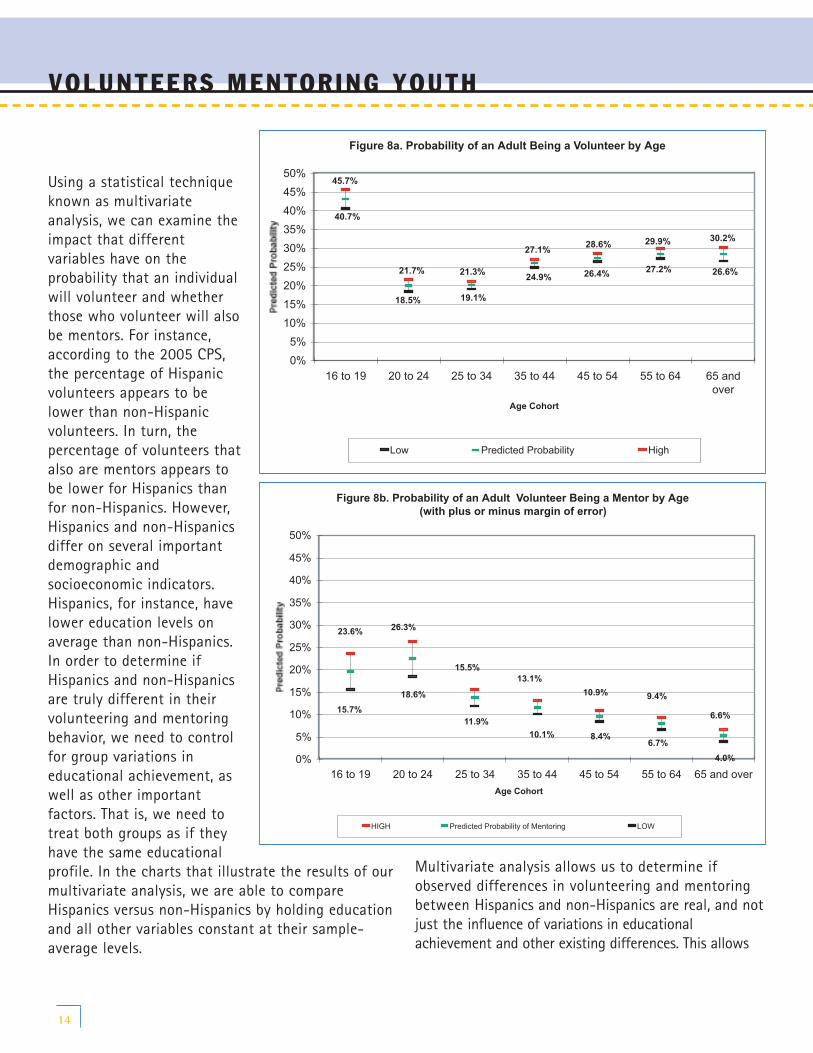
Using a statistical techniqueknown as multivariateanalysis, we can examine theimpact that differentvariables have on theprobability that an individualwill volunteer and whetherthose who volunteer will alsobe mentors. For instance,according to the 2005 CPS,the percentage of Hispanicvolunteers appears to belower than non-Hispanicvolunteers. In turn, thepercentage of volunteers thatalso are mentors appears tobe lower for Hispanics thanfor non-Hispanics. However,Hispanics and non-Hispanicsdiffer on several importantdemographic andsocioeconomic indicators.Hispanics, for instance, havelower education levels onaverage than non-Hispanics.In order to determine ifHispanics and non-Hispanicsare truly different in theirvolunteering and mentoringbehavior, we need to controlfor group variations ineducational achievement, aswell as other importantfactors. That is, we need totreat both groups as if theyhave the same educationalprofile. In the charts that illustrate the results of ourmultivariate analysis, we are able to compareHispanics versus non-Hispanics by holding educationand all other variables constant at their sample-average levels.
Multivariate analysis allows us to determine ifobserved differences in volunteering and mentoringbetween Hispanics and non-Hispanics are real, and notjust the influence of variations in educationalachievement and other existing differences. This allows
Figure 8a. Probability of an Adult Being a Volunteer by Age
40.7%
18.5% 19.1%
24.9% 26.4% 27.2% 26.6%
27.1%28.6% 29.9% 30.2%
21.3%21.7%
45.7%
0%
5%
10%
15%
20%
25%
30%
35%
40%
45%
50%
16 to 19 20 to 24 25 to 34 35 to 44 45 to 54 55 to 64 65 andover
Age Cohort
Low Predicted Probability High
Figure 8b. Probability of an Adult Volunteer Being a Mentor by Age (with plus or minus margin of error)
23.6% 26.3%
15.5%13.1%
10.9% 9.4%
6.6%15.7%
18.6%
11.9%
10.1% 8.4%6.7%
4.0%0%
5%
10%
15%
20%
25%
30%
35%
40%
45%
50%
16 to 19 20 to 24 25 to 34 35 to 44 45 to 54 55 to 64 65 and over
Age Cohort
HIGH Predicted Probability of Mentoring LOW
15
VOLUNT EERS M ENT OR ING YOUTH
us to mitigate the potential confounding effects ofeducation, as well as a variety of other factors, such asage, race, gender, employment status, and familystructure. This type of analysis often results in findingout that many differences between groups disappear,or become stronger, once confounding factors havebeen taken into account. Thus, it allows a researcheror analyst to discover which factors provide a realimpact on a particular outcome of interest.
The capacity to predict who is likely to be avolunteer and in turn who will be a mentor canprovide useful policy and program planning insights.In particular, knowing who is most likely to be amentor can help shape and refine volunteerrecruitment strategies. It can help target efforts tothose individuals that are most likely to respondpositively. On the other hand, it might also allow youto identify unlikely, but promising prospects.
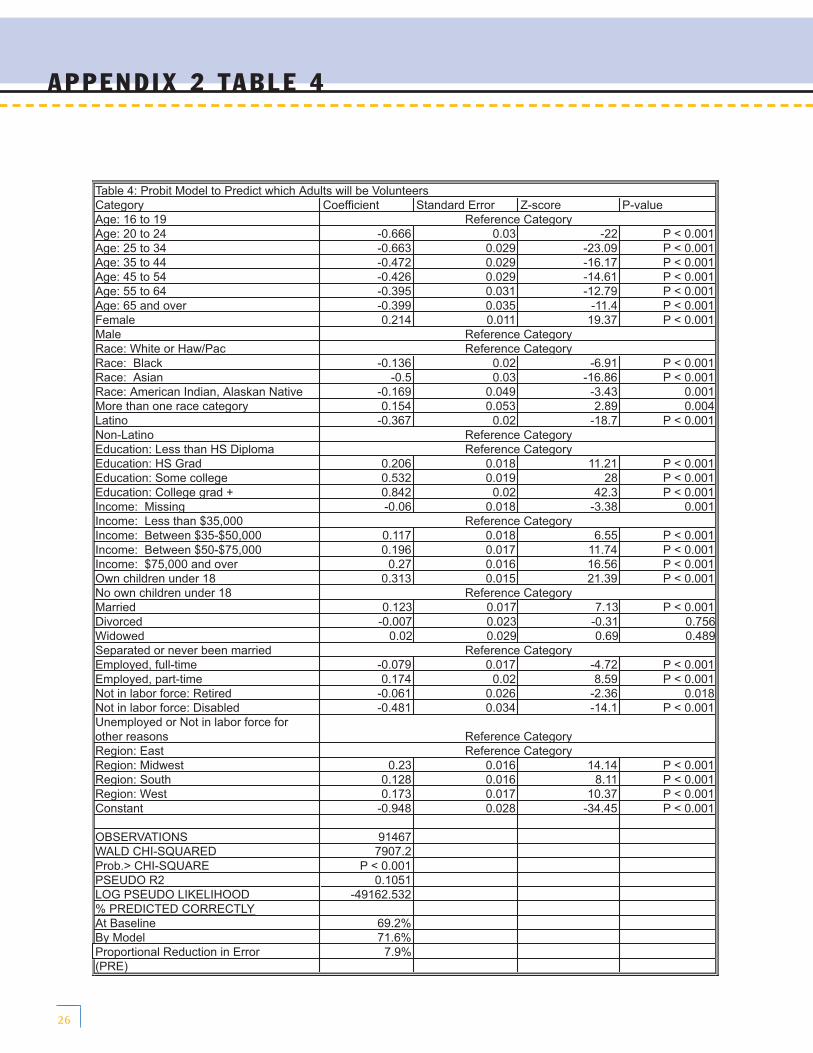
The type of multivariate analysis used to undertakethis assessment is called probit analysis. Simplyspeaking, probit analysis estimates the probabilitythat a certain event will–or won’t–occur,conditioned on the impact of differentcharacteristics. In this case, there are two events:The probability that an adult will be a volunteerand the probability that a volunteer will theninclude mentoring youth as part of theiractivities.12 The remainder of this section discussesthe impact of different characteristics or predictorson the probability of each of these events. Thefindings are presented in Table 2 and in a series ofgraphs for each characteristic that present theprobabilities with their margins of error13 for twoprobabilities: that an adult will be a volunteer, andthat a volunteer will engage in mentoringactivities. In these charts, when the margins oferror overlap for two groups, the probabilities areroughly the same on average; when they do notoverlap, the average group differences seen in
Table 2 (Appendix I) are statistically real,14
controlling for all other factors.
The characteristics or predictors are classified into oneof three groups:
nCommon characteristics that predict both being avolunteer and a volunteer engaging in mentoring;
nCharacteristics that only predict volunteering; and,
nCharacteristics that only predict which volunteers willbecome mentors.
COMMON CHARACTERISTICS
There are three general categories of predictors thatprovide useful information in predicting who will be avolunteer and which volunteers will be mentors:demographic predictors; socioeconomic predictors; andregional or place predictors. The common demographicpredicators are age, gender and race/ethnicity. Thecommon socioeconomic predictors are education andemployment status.
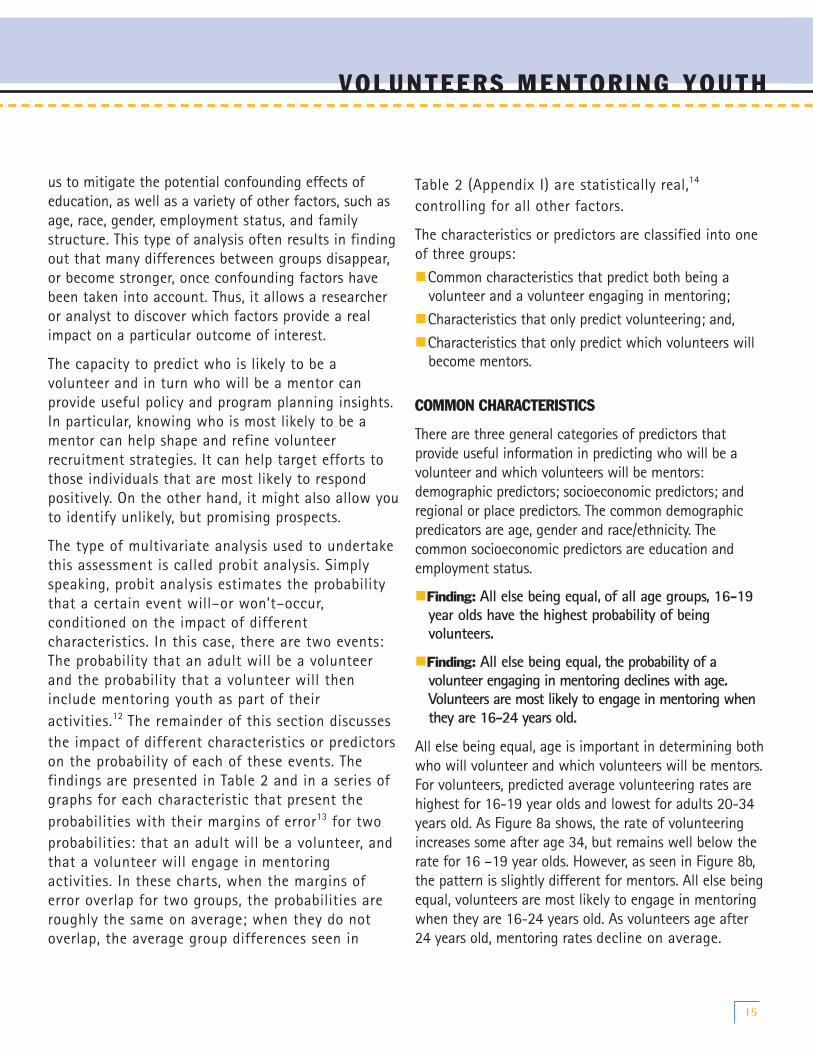
nFinding: All else being equal, of all age groups, 16-19year olds have the highest probability of beingvolunteers.
nFinding: All else being equal, the probability of avolunteer engaging in mentoring declines with age.Volunteers are most likely to engage in mentoring whenthey are 16-24 years old.
All else being equal, age is important in determining bothwho will volunteer and which volunteers will be mentors.For volunteers, predicted average volunteering rates arehighest for 16-19 year olds and lowest for adults 20-34years old. As Figure 8a shows, the rate of volunteeringincreases some after age 34, but remains well below therate for 16 –19 year olds. However, as seen in Figure 8b,the pattern is slightly different for mentors. All else beingequal, volunteers are most likely to engage in mentoringwhen they are 16-24 years old. As volunteers age after24 years old, mentoring rates decline on average.
16
VOL UN T EERS MENTOR ING YOUT H
It is not entirely clear why oldervolunteers are less likely than youngervolunteers to serve as mentors.However, it does appear that asindividuals age, mentoring a youngperson becomes less appealing, possiblyas a result of changes in health, familystatus, or general interest. Thesefindings tend to suggest thatmentoring recruitment efforts need totarget younger volunteers, particularlythose younger than 35 years old.However, while these findings suggestthat policymakers and programplanners should be a little cautiouswhen they look toward baby boomersand other older adults as a potentialsource of new adult mentors, theresults indicate that baby boomersand other older adult volunteerscurrently provide a substantial supplyof volunteer mentors.
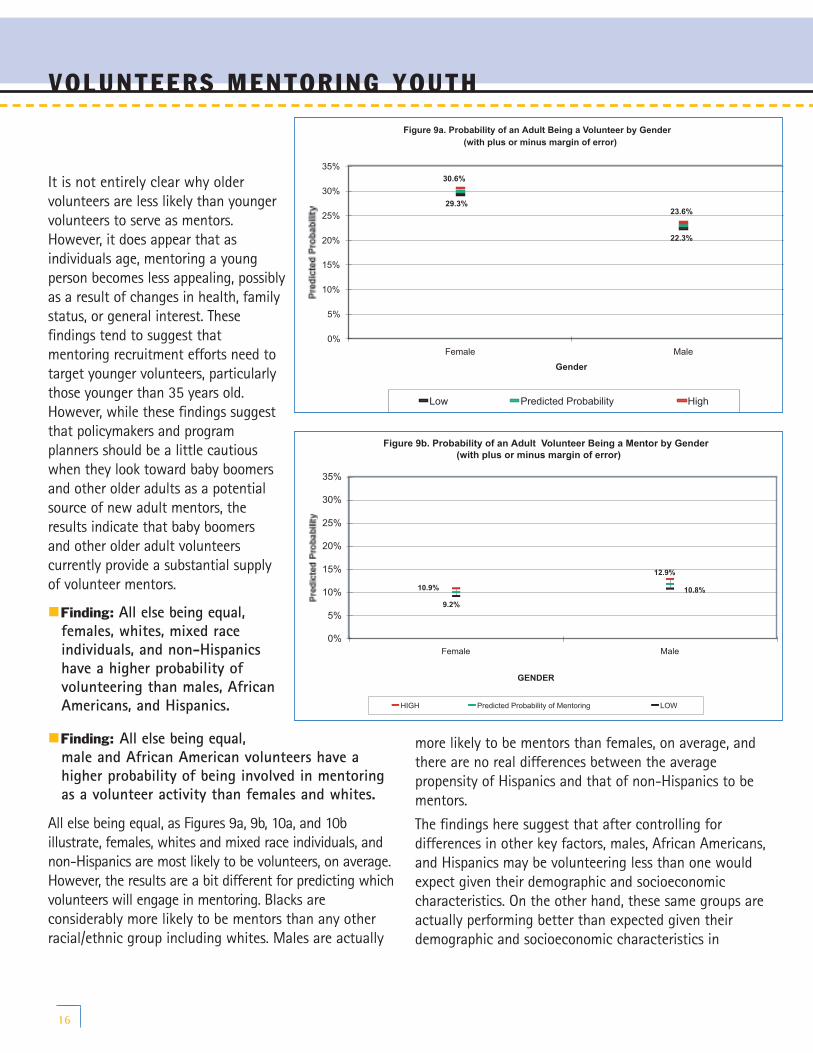
nFinding: All else being equal,females, whites, mixed raceindividuals, and non-Hispanicshave a higher probability ofvolunteering than males, AfricanAmericans, and Hispanics.
nFinding: All else being equal,male and African American volunteers have ahigher probability of being involved in mentoringas a volunteer activity than females and whites.
All else being equal, as Figures 9a, 9b, 10a, and 10billustrate, females, whites and mixed race individuals, andnon-Hispanics are most likely to be volunteers, on average.However, the results are a bit different for predicting whichvolunteers will engage in mentoring. Blacks areconsiderably more likely to be mentors than any otherracial/ethnic group including whites. Males are actually
more likely to be mentors than females, on average, andthere are no real differences between the averagepropensity of Hispanics and that of non-Hispanics to bementors.
The findings here suggest that after controlling fordifferences in other key factors, males, African Americans,and Hispanics may be volunteering less than one wouldexpect given their demographic and socioeconomiccharacteristics. On the other hand, these same groups areactually performing better than expected given theirdemographic and socioeconomic characteristics in
Figure 9a. Probability of an Adult Being a Volunteer by Gender (with plus or minus margin of error)
29.3%
22.3%
23.6%
30.6%
0%
5%
10%
15%
20%
25%
30%
35%
Female Male
Gender
Low Predicted Probability High
Figure 9b. Probability of an Adult Volunteer Being a Mentor by Gender(with plus or minus margin of error)
12.9%
10.9% 10.8%
9.2%
0%
5%
10%
15%
20%
25%
30%
35%
Female Male
GENDER
HIGH Predicted Probability of Mentoring LOW

17
choosing to be mentors. Given this, if males’ and AfricanAmericans’ overall volunteer rates could be increased, theresult would be a rise in the number of mentors.
nFinding: All else being equal, part-time workershave a higher probability of being a volunteer thanfull-time workers or adults who are not working.
nFinding: All else being equal, volunteers who areemployed have a higher probability of beinginvolved in mentoring activities than nonworkingvolunteers.
Employment and volunteering appearto be associated. After controlling forother relevant factors, adults who areemployed part-time and those not inthe labor force, except those that aredisabled, have higher averagevolunteer rates than adults who areemployed full-time. These findings,depicted in Figures 11a and 11b, aresomewhat different for volunteerswho choose to engage in mentoring.Volunteers who are employed full-time are more likely than volunteerswho are not in the labor market toinclude mentoring in their volunteeractivities. The higher predictedvolunteer rates for part-timeemployees and those adults not inthe labor force suggest thatvolunteering seems to be associatedwith having more discretionary timeavailable. However, this does notappear to be the case for mentors.Compared to volunteers who areeither non-working, or employedpart-time, being employed full-time,and presumably having lessdiscretionary time, is associated withhigher predicted rates of beinginvolved in mentoring.
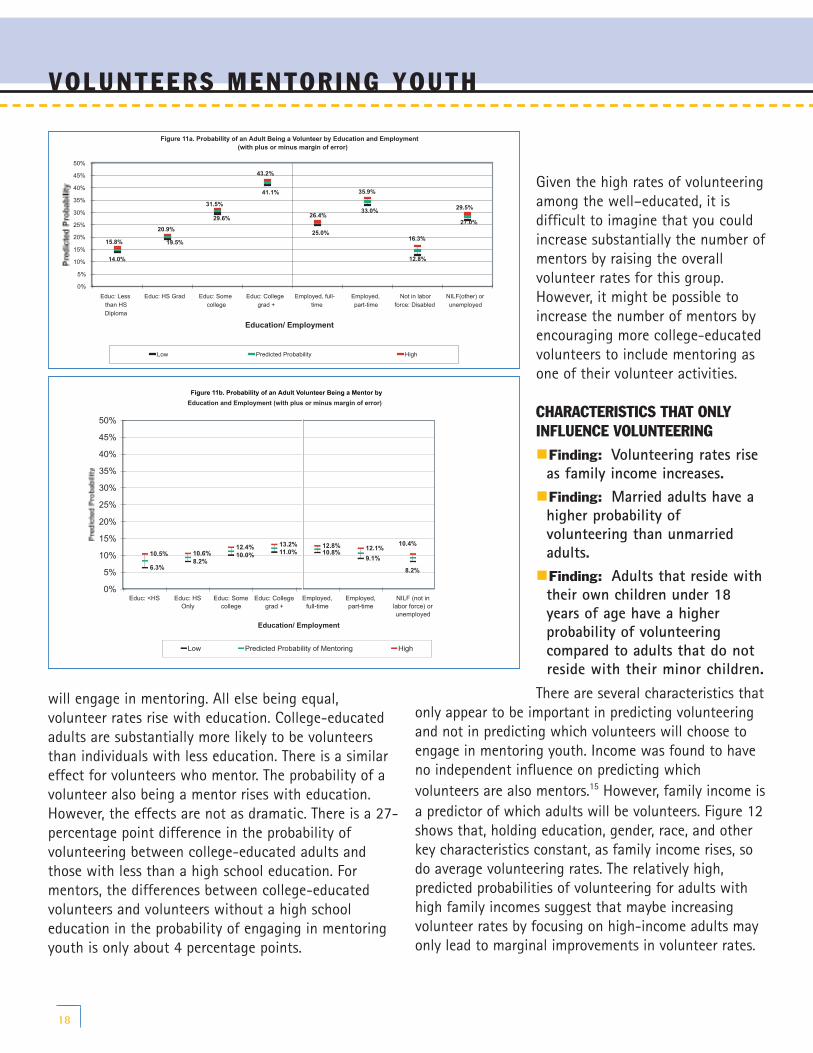
nFinding: All else being equal, the probability ofbeing a volunteer rises with educationalattainment.
nFinding: All else being equal, the probability of avolunteer being involved with mentoring activitiesalso rises with educational attainment.
Education also appears, from Figures 11a and 11b, to bean important independent predictor of whether anadult becomes a volunteer, and whether a volunteer
VOLUNT EERS M ENT OR ING YOUTH
Figure 10a. Probability of an Adult Being a Volunteer by Race and Ethnicity
27.3%
21.9%
12.1%
18.6%
28.1%
15.9%
27.5%
28.3%24.9%
15.5%
26.2%
38.2%
18.4%
28.5%
0%
5%
10%
15%
20%
25%
30%
35%
40%
45%
Race: White or
Haw/Pac
Race: Black Race: Asian Race:
American
Indian, Alaskan
Native
More than one
race category
Latino Non-Latino
Race/Ethnicity
Low Predicted Probability High
Figure 10b. Probability of an Adult Volunteer Being a Mentor by Race and Ethnicity (with plus of minus margin of error)
13.3%
5.1%2.8%
7.3% 7.1%
10.8% 10.6%
22.6%
11.6%
10.2%9.8%
11.2%
18.9%
11.6%
0%
5%
10%
15%
20%
25%
30%
35%
40%
45%
White Black Asian American
Indian, Alaskan
Native
More than one
race category
Latino Non-Latino
Race/Ethnicity
Low Predicted Probability of Mentoring High
18
VOL UN T EERS MENTOR ING YOUT H
will engage in mentoring. All else being equal,volunteer rates rise with education. College-educatedadults are substantially more likely to be volunteersthan individuals with less education. There is a similareffect for volunteers who mentor. The probability of avolunteer also being a mentor rises with education.However, the effects are not as dramatic. There is a 27-percentage point difference in the probability ofvolunteering between college-educated adults andthose with less than a high school education. Formentors, the differences between college-educatedvolunteers and volunteers without a high schooleducation in the probability of engaging in mentoringyouth is only about 4 percentage points.
Given the high rates of volunteeringamong the well–educated, it isdifficult to imagine that you couldincrease substantially the number ofmentors by raising the overallvolunteer rates for this group.However, it might be possible toincrease the number of mentors byencouraging more college-educatedvolunteers to include mentoring asone of their volunteer activities.
CHARACTERISTICS THAT ONLYINFLUENCE VOLUNTEERINGnFinding: Volunteering rates rise
as family income increases.nFinding: Married adults have a
higher probability of volunteering than unmarried adults. nFinding: Adults that reside with
their own children under 18 years of age have a higher probability of volunteering compared to adults that do not reside with their minor children.
There are several characteristics thatonly appear to be important in predicting volunteeringand not in predicting which volunteers will choose toengage in mentoring youth. Income was found to haveno independent influence on predicting whichvolunteers are also mentors.15 However, family income isa predictor of which adults will be volunteers. Figure 12shows that, holding education, gender, race, and otherkey characteristics constant, as family income rises, sodo average volunteering rates. The relatively high,predicted probabilities of volunteering for adults withhigh family incomes suggest that maybe increasingvolunteer rates by focusing on high-income adults mayonly lead to marginal improvements in volunteer rates.
Figure 11a. Probability of an Adult Being a Volunteer by Education and Employment(with plus or minus margin of error)
19.5%
14.0%
29.6%
41.1%
25.0%
33.0%
27.0%
12.8%
20.9%
15.8%
31.5%
43.2%
26.4%
35.9%
16.3%
29.5%
0%
5%
10%
15%
20%
25%
30%
35%
40%
45%
50%
Educ: Less
than HS
Diploma
Educ: HS Grad Educ: Some
college
Educ: College
grad +
Employed, full-
time
Employed,
part-time
Not in labor
force: Disabled
NILF(other) or
unemployed
Education/ Employment
Low Predicted Probability High
Figure 11b. Probability of an Adult Volunteer Being a Mentor by
Education and Employment (with plus or minus margin of error)
6.3%8.2%
10.0% 11.0% 10.8%9.1%
10.5% 10.6%12.4% 13.2% 12.8% 12.1%
8.2%
10.4%
0%
5%
10%
15%
20%
25%
30%
35%
40%
45%
50%
Educ: <HS Educ: HSOnly
Educ: Somecollege
Educ: Collegegrad +
Employed,full-time
Employed,part-time
NILF (not inlabor force) orunemployed
Education/ Employment
Low Predicted Probability of Mentoring High

19
VOLUNT EERS M ENT OR ING YOUTH
The presence of minor children is a factor that doesnot appear to predict which volunteer will bementors, but that does appear to contribute to theability to predict who will volunteer. As Table 2 andFigure 12 show, adults residing with their own minorchildren under 18 years old have a higher predictedprobability of volunteering than adults that do notreside with their own minor children. For volunteerswho mentor, there appear to be no differences in theprobability of being a mentor between volunteers thatreside with their own minor children and volunteers
that do not reside with their ownminor children.
Finally, the results in Table 2 and Figure12 also illustrate that married adultshave a higher predicted probability ofbeing a volunteer than unmarriedadults. Marital status appears to haveno influence in predicting whichvolunteers will be mentors.
CHARACTERISTICS THAT ONLYINFLUENCE VOLUNTEERS TO ENGAGEIN MENTORINGnFinding: Mentors are primarily
drawn from the ranks of already committed and engaged volunteers. Holding all other factors constant, volunteers engaged in four or more volunteer activities with their main volunteer organization have a higher probability of being engaged in mentoring activities than volunteers who engage in 1 to 3 volunteer activities.nFinding: All else being equal,
volunteers who volunteer in or through a religious or educational/youth service organization have a higher
probability of being engaged in mentoring thanvolunteers who volunteer in other types oforganizations. There are a number of characteristics in Table 2 thatcan only be used to predict the probability of volunteersincorporating mentoring into their service activities. Itappears, as seen in Figure 13, that volunteers whoperform more than one volunteer activity for their mainorganization are more likely to be mentors thanvolunteers who perform only one activity. In fact, allelse being equal, the more volunteer activities a
Figure 12. Probability of an Adult Being a Volunteer by Family Income, Presence of Children, Marital Status (with plus or minus margin of error)
22.4%
25.7%
28.5%
31.1%
33.1%
23.0%
27.6%
23.2%
24.0%
28.2%
30.7%
33.2%35.3%
24.1%
29.0%
25.4%
0%
5%
10%
15%
20%
25%
30%
35%
40%
Income: Less
than $35,000
Income:
Between $35-
$50,000
Income:
Between $50-
$75,000
Income:
$75,000 and
over
Own children
under 18
No own children
under 18
Married Not Married
Socioeconomic Categories
Low Predicted Probability High
Figure 13. Probability of an Adult Volunteer Being a Mentor by Number of Volunteer Activities (with plus or
minus margin of error)
11.7%
20.9%
47.4%
3.0%
3.9%
14.5%
25.6%
51.8%
-5%
5%
15%
25%
35%
45%
55%
One activity Two activities Three activities Four or more activities
Volunteering Attributes
Low Predicted Probability of Mentoring High

20
VOL UN T EERS MENTOR ING YOUT H
volunteer performs the more likely the volunteer is toengage in mentoring youth.
Interpreting this finding is somewhat challenging.However, one likely explanation is that it reflects thefact that mentors are primarily drawn from the ranksof already highly committed and engaged volunteers.That is, these are men and women who have alreadymade a substantial commitment to volunteering fortheir main volunteer organization and who areencouraged to devote some of their volunteer time to mentoring.
The probability that a volunteer will be a mentor alsoseems to be highly related to the types of organizationswhere a volunteer does his or her volunteer work.Mentors are primarily found in youth-focusededucational or youth-serving organizations and inreligious organizations. Figure 14 shows that theaverage probability of a volunteer engaging inmentoring is considerably higher for volunteers foundin these types of organizations than volunteers incivic, professional, labor, or other types oforganizations. The findings indicate that targetingvolunteers in religious institutions and in schools andyouth service organizations may be an effectivestrategy for bringing more volunteers to mentoring.
However, it should be noted thatmentoring programs that recruitthrough the workplace oftenalready target schools and youthorganizations. As such, at leastsome percentage of volunteersin school and youthorganizations may actually havecome to their volunteer workthrough employee volunteerprograms.16
CONCLUSION AND POLICYIMPLICATIONSThe analysis shows that one of
the most important determinants of which volunteersare also involved in mentoring activities is age. Theprobability of being a mentor declines dramaticallyafter age 24; indeed, volunteers 65 years and olderare the least likely to be engaged in mentoringactivities compared to younger cohorts. This suggeststhat college age adults and even high schoolstudents are prime candidates to be recruited asmentors. While the data also suggest that enlistingmore baby boomers and other older adults as youthmentors is more challenging, it is important to notethat a large number of baby boomers and other olderadult volunteers currently are involved in mentoring.
Another promising mentor recruitment strategy isfocusing on encouraging more current volunteers tobecome mentors, particularly those volunteers whohave already made a substantial commitment to theirmain volunteer organization. Moreover, the finding thatmentoring takes place predominantly through religiousorganizations suggests that religious institutions are anexcellent area in which to focus recruitment efforts.
This type of strategy may pose real challenges forexisting community-based mentoring programs. Oneapproach is for traditional mentoring programs to domore partnering with other types of volunteer
Figure 14. Probability of an Adult Volunteer Being a Mentor by Type of Volunteer Organization (with plus or
minus margin of error)
16.0%
11.6%
6.0%4.4%
19.2%
13.8%
8.8% 6.5%
-5%
5%
15%
25%
35%
45%
55%
Main org: Educ, youth service Main org: Religious Main org: Social / comm
service
Main org: All other types
Volunteering Attributes
Low Predicted Probability of Mentoring High

21
organizations, such as religious institutions. Thisapproach is already being tried in several places.Another approach may be for mentoring programs torecruit volunteers to do other needed tasks. Oncethey’ve formed some attachment to the organizationand its mission, these volunteers may be moreamenable to becoming mentors.
The importance of providing mentoring opportunitiesat workplaces is another important strategy to reachmore youth with mentors. Our research found thatvolunteers employed full-time—despite having lessdiscretionary time—are actually as likely to mentor aspeople working part-time, and a new poll by thenonprofit group MENTOR17 revealed that mentoring ator near the workplace, as well as release time duringwork hours, substantially increased people’swillingness to seriously consider becoming a mentor.Together, these reports suggest that providingconvenient mentor opportunities at work areimportant for recruiting more mentors.
Race and sex also have an effect on who becomes amentor. Although males and blacks volunteer in generalat lower rates than do females and whites, it turns outthat blacks are more likely—and males are as likely—astheir counterparts to engage in mentoring as one oftheir volunteer activities. This is an interesting findingsince the general consensus in the field is that there is
a shortage of male and minority mentors. It appearsthat one constraint may be the lower overall volunteerrates of men and minorities. Assuming that therelationship between volunteering, and volunteering asa mentor, remains constant, the number of male andminority mentors would increase if their overallvolunteer rate rose. Thus, a promising approach todeveloping more black and male mentors is to inviteand engage them in volunteering in general. If, forexample, the African American volunteer rate increasedby 2 percentage points (22.1% to 24.1%), there wouldbe another 533,000 black volunteers, and an additional125,000 black mentors.
Without more knowledge about the demographics ofmentor waitlists, we do not know for certain the genderand racial characteristics of youths waiting for a mentor,though anecdotal evidence suggests that adisproportionate number are minorities and males. If thisis the case, it is possible that doubling or even triplingthe numbers of male and minority mentors may not beenough to meet the effective demand for such mentors.Instead it may require that mentoring programs not onlyincrease the overall supply of mentors but employ morementoring models that reach more kids with one adultmentor and other innovative mentoring approaches inorder to close the mentoring gap.
VOLUNT EERS M ENT OR ING YOUTH

22
1 “Mentoring in America in 2005” based on a National MentoringPoll of 2000 respondents conducted for MENTOR in 2002 andagain in 2005 also asks questions about who mentors. However,because the CPS uses a very large sample, with a very highresponse rate it is possible to do a much more extensive set ofanalyses. Moreover, the CPS allows for an analysis of all types ofvolunteers, not just those who mentor.
2 This problem should be resolved in the 2006 CPS volunteersuppement. In the 2006 supplement, respondents will be asked toidentify whether mentoring is their primary volunteer activity.
3 The CPS considers individuals 16 and older adults.4 There are also individuals that mentor young people informally—i.e.
not in the context of a formal organization. The CPS does not askquestions on informal volunteer activities and so cannot providean estimate about the size of the informal mentor group. The“Mentoring in America in 2005” did ask about informal mentoringand therefore can provide some insights into the size andcharacteristics of the informal mentor group.
5 Baby boomers are the generation born from 1946-1964. In 2005,baby boomers would have been between 41 and 59 years old.
6 In 2005 MENTOR conducted several focus groups across thecountry of mentoring program operators. One consistent themewas the perceived shortage of males and minority mentors. Duringthese focus group sessions practitioners also indicated thatwaiting lists of unmatched youth were a general problem.
7 The 2000 US Census indicates that 57% of non-Hispanic black and29% of Hispanic children grow-up in single parent familiescompared to 21% of non-Hispanic whites. Females head the vastmajority of these families.
8 Because their numbers in the sample were relatively small, Asians,Mixed-race, American Indians, and Pacific Islanders were combinedand reported as one category.
9 See “Volunteering in the United States, 2005,” released by theBureau of Labor Statistics, December 9, 2005 (www.bls.gov/cps).
10 See “Promoting Successful Youth Mentoring Relationships: APreliminary Screening Questionnaire” by Jean Rhodes, RanjinniReddy, Jennifer Roffman, and Jean B. Grossman.
11 See Corporation for National and Community Service. BuildingActive Citizens: The Role of Social Institutions in TeenVolunteering. Brief 1 in the Youth Helping America series.Washington, DC. November 2005(http://www.cns.gov/pdf/05_1130_LSA_YHA_study.pdf). In thisbrief, we divided individuals into episodic volunteers (1-2 weeks ofvolunteering a year), occasional volunteers (3-11 weeks ofvolunteering a year), and regular volunteers (12+ weeks ofvolunteering a year)
12 The complete results for both the volunteer model and thementoring model can be found in Appendix 2.
13 The graphs show the predicted probabilities and the plus or minusmargin of error. For example, for age, holding all other factorsconstant, Figure 8b shows that 16-19 year olds have a 43%probability, on average, of being a volunteer. However, there is aplus or minus error that means the real volunteering rate for thisgroup is between 41% and 45%. Where bars overlap on a graph itmeans that there is no difference in the probability betweendifferent characteristics. Again, looking at age, in figure 8a, themargins of error for volunteering probabilities overlap for adults20-24 years old and 25-34 years old.
14 The margins of error are based on the estimates of the standarderrors in Tables 3 and 4 of Appendix 2. These standard errors aretoo small; due to privacy limitations, the Census Bureau does notrelease information about the detailed sampling design of the CPS.To counteract this limitation, we calculate margins of error using99 percent confidence intervals, rather than the traditional 95percent confidence intervals. Approximations used in otherpublished work suggest that these 99% confidence intervalsshould rarely underestimate, and often overestimate, the true sizeof the margins of error.
15 As with the other variables discussed in this section — presence ofown children and marital status — family income was originallyincluded as a predictor in the mentoring model. These variableswere dropped because they were not statistically significant, withno loss of overall explanatory power and no change in themagnitude of the other results.
16 It is useful to note, however, that the 2005 CPS indicates that fewvolunteers that were engaged in mentoring appeared to haveresponded to appeals at work or by an employer. When volunteerswere asked who asked them to volunteer, 3.4% of non-mentorssaid it was their boss or employer. However, for volunteers thatmentored only 1.7% said they responded to an appeal from theirboss or employer. We did not report this number in the studybecause the sample size was very small (only 53 observations).
17 For more information on the report Mentoring in America 2005,go to www.mentoring.org.
ENDN OT ES

23
APPEND IX 1 TABLE 1
Non-Mentors
Volunteers who Mentor
Number of Volunteers 65,357 53,854 11,503 17.6%AGE
16 -19 4,848 3,841 1,007 9%20-24 3,828 2,855 973 8%25-34 9,761 7,739 2,022 18%35-44 14,610 11,511 3,099 27%45-54 13,600 11,109 2,492 22%55-64 8,999 7,725 1,274 11%65 and over 8,583 7,948 635 6%
Non-Boomers 38,867 32,100 6,767 59%Boomers 25,363 20,627 4,736 41%
TOTAL 64,230 52,727 11,503 100%GENDER
MALE 26,894 21,982 4,912 43%FEMALE 37,337 30,746 6,591 57%
TOTAL 64,230 52,727 11,503 100%RACE/ ETHNICITYWhite 55,297 45,751 9,547 83%Black 5,705 4,282 1,423 12%Asian 1,992 1,714 278 2%Other 433 349 84 1%Multi-racial 802 632 170 1%
TOTAL 64,230 52,727 11,503 100%
Hispanic 4,406 3,745 660 6%Non-Hispanic 59,824 48,982 10,842 94%
TOTAL 64,230 52,727 11,503 100%EDUCATION LEVELS (25 YEARS AND OVER)Less than a high-school diploma 2,797 2,549 247 3%High school graduates, no college 12,413 10,614 1,799 19%Less than a bachelor's degree 16,234 13,262 2,973 31%College graduates 24,110 19,606 4,504 47%
TOTAL 55,554 46,032 9,522 100%PRESENCE OF CHILDRENWithout own children <18 40,193 34,086 6,107 53%With own children <18 24,037 18,641 5,396 47%
TOTAL 64,230 52,727 11,503 100%EMPLOYMENT
Full-time 34,623 27,848 6,775 59%Part-time 9,517 7,598 1,919 17%Not Working 20,090 17,281 2,809 24%
TOTAL 64,230 52,727 11,503 100%VOLUNTEER ACTIVITIES
One activity 32,980 31,458 1,522 13%Two or more activities 31,250 21,269 9,981 87%
TOTAL 64,230 52,727 11,503 100%ORGANIZATION TYPEReligious org. 22,548 17,696 4,851 42%Educational 15,686 12,086 3,600 31%Youth Services 1,376 639 737 6%Sports or hobby 1,120 941 179 2%Social and community service/ Civic 11,272 10,083 1,189 10%Political, advocacy, Union, Business 1,229 1,168 61 1%Health-oriented 4,951 4,703 248 2%Other 5,600 5,032 569 5%
TOTAL 63,781 52,347 11,434 100%ROUTE TO VOLUNTEERINGApproached the organization 26,152 21,478 4,674 41%Was asked 27,907 23,217 4,690 41%Other 9,392 7,373 2,018 18%
TOTAL 63,451 52,068 11,383 100%VOLUNTEER FREQUENCY
Episodic volunteers (0-2 weeks per year) 14,201 12,917 1,283 12%
Occasional volunteers (3-11 weeks per year) 14,434 12,143 2,291 21%
Regular volunteers (12 or more weeks per year) 31,634 24,270 7,364 67%TOTAL 60,269 49,330 10,939 100%
Annual Median Volunteer Hours 52 40 80 N/A
Note: Because of non-responses totals for each category will differ.
Table 1. Volunteers (in 1000s) who mentor and who don't mentor, by selected characteristics, for 2005
VOLUNTEER CHARACTERISTICSTotal Volunteers
Percent distribution of mentors by selected characteristics

24
Variables and Categories Predicted Prob. Low High Predicted Prob. Low HighAGE
Age: 16 to 19 43.2% 40.7% 45.7% 19.6% 15.7% 23.6%Age: 20 to 24 20.1% 18.5% 21.7% 22.4% 18.6% 26.3%Age: 25 to 34 20.2% 19.1% 21.3% 13.7% 11.9% 15.5%Age: 35 to 44 26.0% 24.9% 27.1% 11.6% 10.1% 13.1%Age: 45 to 54 27.5% 26.4% 28.6% 9.7% 8.4% 10.9%Age: 55 to 64 28.5% 27.2% 29.9% 8.0% 6.7% 9.4%Age: 65 and over 28.4% 26.6% 30.2% 5.3% 4.0% 6.6%
GENDER
Female 29.9% 29.3% 30.6% 10.1% 9.2% 10.9%Male 23.0% 22.3% 23.6% 11.9% 10.8% 12.9%
RACE/ ETHNICITY
White or Haw/Pac 27.8% 27.3% 28.3% 10.5% 9.8% 11.2%Black 23.4% 21.9% 24.9% 16.1% 13.3% 18.9%Asian 13.8% 12.1% 15.5% 8.0% 5.1% 10.8%American Indian, Alaskan Native 22.4% 18.6% 26.2% 6.7% 2.8% 10.6%
More than one race category 33.1% 28.1% 38.2% 14.9% 7.3% 22.6%Latino 17.1% 15.9% 18.4% 9.3% 7.1% 11.6%Non-Latino 28.0% 27.5% 28.5% 10.9% 10.2% 11.6%
EDUCATION
Less than HS Diploma 14.9% 14.0% 15.8% 8.4% 6.3% 10.5%HS Grad 20.2% 19.5% 20.9% 9.4% 8.2% 10.6%Some college 30.5% 29.6% 31.5% 11.2% 10.0% 12.4%College grad + 42.1% 41.1% 43.2% 12.1% 11.0% 13.2%
INCOME
Income: Missing 21.4% 20.3% 22.5% N/A N/A N/AIncome: Less than $35,000 23.2% 22.4% 24.0% N/A N/A N/AIncome: Between $35-$50,000 26.9% 25.7% 28.2% N/A N/A N/AIncome: Between $50-$75,000 29.6% 28.5% 30.7% N/A N/A N/AIncome: $75,000 and over 32.2% 31.1% 33.2% N/A N/A N/A
PRESENCE OF CHILDREN
Own children under 18 34.2% 33.1% 35.3% 11.7% 10.5% 13.0%No own children under 18 23.6% 23.0% 24.1% 10.3% 9.4% 11.2%
MARITAL STATUS
Married 28.3% 27.6% 29.0% N/A N/A N/ADivorced 24.1% 22.7% 25.5% N/A N/A N/AWidowed 24.9% 23.0% 26.9% N/A N/A N/ASeparated or never been married 24.3% 23.2% 25.4% N/A N/A N/A
EMPLOYMENT STATUS
Employed, full-time 25.7% 25.0% 26.4% 11.8% 10.8% 12.8%Employed, part-time 34.4% 33.0% 35.9% 10.6% 9.1% 12.1%Not in labor force: Retired 26.2% 24.6% 27.9% N/A N/A N/ANot in labor force: Disabled 14.5% 12.8% 16.3% N/A N/A N/ANot in labor force (other or unemployed)
28.3% 27.0% 29.5% N/A N/A N/A
Not in labor force for any reason N/A N/A N/A 9.3% 8.2% 10.4 %REGION
East 22.2% 21.2% 23.1% 10.0% 8.5% 11.5%Midwest 29.6% 28.6% 30.5% 10.2% 9.1% 11.3%South 26.1% 25.4% 26.9% 10.4% 9.3% 11.5%West 27.7% 26.7% 28.6% 12.8% 11.4% 14.1%
NUMBER OF VOLUNTEER ACTIVITIES
One activity N/A N/A N/A 3.5% 3.0% 3.9%Two activities N/A N/A N/A 13.1% 11.7% 14.5%Three activities N/A N/A N/A 23.2% 20.9% 25.6%Four or more activities N/A N/A N/A 49.6% 47.4% 51.8%
TYPE OF ORGANIZATION
Main org: Civic, pol, prof, int'l N/A N/A N/A 6.3% 4.5% 8.1%Main org: Education, youth service N/A N/A N/A 17.6% 16.0% 19.2%Main org: Religious N/A N/A N/A 12.7% 11.6% 13.8%Main org: Social / community service N/A N/A N/A 7.4% 6.0% 8.8%
Main org: All other types N/A N/A N/A 5.4% 4.4% 6.5%HOW RESPONDENT BECAME INVOLVED WITH MAIN ORGANIZATIONHow R got inv: Approached org N/A N/A N/A 11.3% 10.3% 12.3%How R got inv: Other way N/A N/A N/A 12.2% 10.5% 13.8%
TABLE 2. PREDICTED PROBABILITIES FOR VOLUNTEERS AND MENTORS BY SELECTED CHARACTERISTICSFROM PROBIT MODELS
volunteer MODEL mentor MODEL
How R got inv: Someone asked R 9.9% 9.0% 10.8%
“Not included” indicates that the variable was dropped from the final version of the mentoring model because of statistical insignificance. “N/A” indicates the variable was not included in the volunteering model, because non-volunteers were not asked to respond to the question. "Low" and "high" entries are based on 99% confidence intervals constructed using thedelta method. See notes 13 and 14.
APPEN D I X 1 TABLE 2

25
APPEND IX 2 TABLE 3
Category Coefficient Standard Error Z-score P-value
16 to 1920 to 24 0.097 0.07 1.33 0.18225 to 34 -0.239 0.07 -3.57 P < 0.00135 to 44 -0.342 0.07 -5.13 P < 0.00145 to 54 -0.447 0.06 -6.9 P < 0.00155 to 64 -0.547 0.07 -8.41 P < 0.00165 and over -0.766 0.07 -11.31 P < 0.001Female -0.095 0.03 -3.69 P < 0.001MaleRace: White or Haw/PacRace: Black 0.264 0.05 5.75 P < 0.001Race: Asian -0.151 0.08 -2 0.045Race: American Indian, Alaskan Native -0.243 0.12 -2.08 0.037More than one race category 0.215 0.13 1.69 0.09Latino -0.09 0.05 -1.68 0.094Non-LatinoEducation: Less than HS DiplomaEducation: HS Grad 0.059 0.06 1.04 0.3Education: Some college 0.163 0.06 2.84 0.005Education: College grad + 0.208 0.06 3.58 P < 0.001Own children under 18 0.076 0.03 2.35 0.019No own children under 18Employed, full-time 0.14 0.03 4.19 P < 0.001Employed, part-time 0.075 0.04 1.93 0.054Not in labor force or unemployedOne activity -1.808 0.03 -56.48 P < 0.001Two activities -1.111 0.03 -33.52 P < 0.001Three activities -0.722 0.04 -19.83 P < 0.001Four or more activitiesMain org: Civic, pol, prof, int'l 0.073 0.07 1.11 0.266Main org: Education, youth service 0.674 0.04 15.88 P < 0.001Main org: Religious 0.463 0.04 11.48 P < 0.001
Main org: Social / community service 0.157 0.05 3.05 0.002Main org: All other typesHow R got inv: Approached org 0.074 0.03 2.81 0.005How R got inv: Other way 0.118 0.04 3.36 0.001How R got inv: Someone asked RRegion: EastRegion: Midwest 0.012 0.04 0.32 0.749Region: South 0.022 0.04 0.56 0.578Region: West 0.143 0.04 3.58 P < 0.001Constant -0.299 0.07 -4.18 P < 0.001
OBSERVATIONS 27564WALD CHI-SQUARED 4009.64Prob.> CHI-SQUARE p < 0.001PSEUDO R2 0.2698LOG PSEUDO LIKELIHOOD -9299.3753% PREDICTED CORRECTLYAt Baseline 82.3%By Model 85.0%Proportional Reduction in Error 15.0%(PRE)
Reference Category
Reference Category
Reference CategoryReference Category
Reference CategoryReference Category
Reference Category
Reference Category
Table 3: Probit Model to Predict which Volunteers will be Mentors
Reference Category
Reference CategoryReference Category
26
APPEN D I X 2 TABLE 4
Category Coefficient Standard Error Z-score P-valueAge: 16 to 19Age: 20 to 24 -0.666 0.03 -22 P < 0.001Age: 25 to 34 -0.663 0.029 -23.09 P < 0.001Age: 35 to 44 -0.472 0.029 -16.17 P < 0.001Age: 45 to 54 -0.426 0.029 -14.61 P < 0.001Age: 55 to 64 -0.395 0.031 -12.79 P < 0.001Age: 65 and over -0.399 0.035 -11.4 P < 0.001Female 0.214 0.011 19.37 P < 0.001MaleRace: White or Haw/PacRace: Black -0.136 0.02 -6.91 P < 0.001Race: Asian -0.5 0.03 -16.86 P < 0.001Race: American Indian, Alaskan Native -0.169 0.049 -3.43 0.001More than one race category 0.154 0.053 2.89 0.004Latino -0.367 0.02 -18.7 P < 0.001Non-LatinoEducation: Less than HS DiplomaEducation: HS Grad 0.206 0.018 11.21 P < 0.001Education: Some college 0.532 0.019 28 P < 0.001Education: College grad + 0.842 0.02 42.3 P < 0.001Income: Missing -0.06 0.018 -3.38 0.001Income: Less than $35,000Income: Between $35-$50,000 0.117 0.018 6.55 P < 0.001Income: Between $50-$75,000 0.196 0.017 11.74 P < 0.001Income: $75,000 and over 0.27 0.016 16.56 P < 0.001Own children under 18 0.313 0.015 21.39 P < 0.001No own children under 18Married 0.123 0.017 7.13 P < 0.001Divorced -0.007 0.023 -0.31 0.756Widowed 0.02 0.029 0.69 0.489Separated or never been marriedEmployed, full-time -0.079 0.017 -4.72 P < 0.001Employed, part-time 0.174 0.02 8.59 P < 0.001Not in labor force: Retired -0.061 0.026 -2.36 0.018Not in labor force: Disabled -0.481 0.034 -14.1 P < 0.001Unemployed or Not in labor force for other reasonsRegion: EastRegion: Midwest 0.23 0.016 14.14 P < 0.001Region: South 0.128 0.016 8.11 P < 0.001Region: West 0.173 0.017 10.37 P < 0.001Constant -0.948 0.028 -34.45 P < 0.001
OBSERVATIONS 91467WALD CHI-SQUARED 7907.2Prob.> CHI-SQUARE P < 0.001PSEUDO R2 0.1051LOG PSEUDO LIKELIHOOD -49162.532% PREDICTED CORRECTLYAt Baseline 69.2%By Model 71.6%Proportional Reduction in Error 7.9%(PRE)
Reference Category
Reference CategoryReference Category
Reference CategoryReference Category
Reference Category
Reference Category
Table 4: Probit Model to Predict which Adults will be Volunteers
Reference Category
Reference CategoryReference Category


CORPORATION FOR NATIONAL AND COMMUNITY SERVIICE1201 NEW YORK AVENUE, NWWASHINGTON, DC 20525
Tel.: (202) 606-5000TTY: (202) 606-3472e-mail: [email protected]