voronoi-based region approximation for geographical...
TRANSCRIPT

int j geographical information science 2001 vol 15 no 4 287plusmn 306
Research Article
Voronoi-based region approximation for geographical informationretrieval with gazetteers
HARITH ALANI
IAM Department of ECS University of Southampton High eldSouthampton SO17 1BJ England UK e-mail haecssotonacuk
CHRISTOPHER B JONES
Department of Computer Science CardiŒUniversity CardiŒCF24 3XF WalesUK e-mail cbjonescscfacuk
and DOUGLAS TUDHOPE
School of Computing University of Glamorgan Glamorgan CF37 1DLWales UK e-mail dstudhopeglamacuk
(Received 14 March 2000 accepted 10 September 2000)
Abstract Gazeteers and geographical thesauri can be regarded as parsimoniousspatial models that associate geographical location with place names and encodesome semantic relations between the names They are of particular value in pro-cessing information retrieval requests in which the user employs place names tospecify geographical context Typically the geometric locational data in a gazetteerare con ned to a simple footprint in the form of a centroid or a minimum boundingrectangle both of which can be used to link to a map but are of limited value indetermining spatial relationships Here we describe a Voronoi diagram method forgenerating approximate regional extents from sets of centroids that are respectivelyinside and external to a region The resulting approximations provide measures ofareal extent and can be used to assist in answering geographical queries by evaluat-ing spatial relationships such as distance direction and common boundary lengthPreliminary experimental evaluations of the method have been performed in thecontext of a semantic modelling system that combines the centroid data withhierarchical and adjacency relations between the associated place names
1 IntroductionThere are many contexts in which geographical location may be an important
dimension for purposes of information retrieval It is not always the case howeverthat the conventional facilities of geographical information systems are required ornecessary in order to meet the usersrsquo needs (Larson 1996 Jones et al 1996 Mosset al 1998) In particular it may not be necessary to produce a digital map or toemploy detailed spatial data Examples of types of enquiry where this may be thecase (though is not necessarily so) include those that require lists of retail outletshotel accommodation archaeological sites tourist attractions or industrial sites that
Internationa l Journal of Geographica l Information ScienceISSN 1365-8816 printISSN 1362-3087 online copy 2001 Taylor amp Francis Ltd
httpwwwtandfcoukjournalsDOI 10108013658810110038942
H Alani et al288
lie inside or in the vicinity of some named place In such enquiries the user maywant to see data or documents that relate to the speci ed places while from a spatialviewpoint the needs may be con ned to that of having found a reasonable perhapsapproximate match with the speci ed place
To service these enquiries it may be su cient to employ a sparse or parsimoniousrepresentation of geographic space that combines a rich set of place name data withonly limited locational data that provides an approximation of the spatial extent orfootprint Data of this sort are typically referred to as gazetteers or geographicalthesauri (Hill et al 1999 Harpring 1997b) while the combination of the data andsome associated functionality may be referred to as a geographical name server(GNS) GNS of this kind may lend themselves to limited bandwidth situations suchas in many WWW applications When used in the context of query processing suchdata enable a user-speci ed name to be matched with place names attached to thestored data As with conventional information retrieval applications the underlyinginformation may have been indexed using terms diŒerent from those employed in auserrsquos query For example a user may refer to a more speci c place name employan archaic alternative or simply a nearby place name The matching process couldbe precise or it could be imprecise whereby the geographical name server wasemployed to nd place names that were similar in the sense of being alternativeversions for the same place or of being spatially related Determination of spatialcloseness could be performed for example by traversing a geographical nameshierarchy to nd containing places or by using the limited locational data to ndplaces that were within some threshold distance of the speci ed place Followingstandard procedures for information retrieval it may be appropriate to rank theresults of approximate matches in terms of their estimated closeness to the targetplace
The use of gazetteers and GNS to process geographical enquiries in this way isat present in its infancy but it can be expected to grow considerably as users ofsearch engines raise their expectations of the level of geographical intelligence withregard to place name terminology Research challenges in this area include those ofdetermining the most appropriate data that should be stored in a gazetteer theprovision of support for user speci cation of spatial relationships in their query andthe development of semantic and spatial closeness measures that accurately re ecta userrsquos perception of the similarity of a found place to one that they specify Arecent initiative in gazetteer design is the proposal of a content standard in associationwith the Alexandria Digital Library (Hill 1996 Hill et al 1999) It may be regardedas pointing the way forward for future gazetteer design as well as helping to raisethe pro le of the potential of gazetteers in geographical information retrieval Theproposed gazetteer which adopts a metadata approach is very exible with regardto the types of data that may be stored Notably it leaves open the possibility ofvarious types of relationship between place names which could be spatial as well asadministrative An important issue highlighted by Hill and one which aŒects thepotential of the gazetteer to assist in geographical query processing is that of theform of the spatial footprint that should be stored with a place name
A spatial footprint may be used to determine or at least estimate spatialrelationships between places These could include distance direction and sometopological relationships such as containment and overlap Some existing gazetteersand geographical thesauri such as Geographic Names Information System (GNIS)(US Geological Survey 1998) and the Thesaurus of Geographic Names (TGN)
Voronoi-based region approximation 289
(Harpring 1997a 1997b) only store single points for footprints and hence arerestricted in their potential for estimating spatial relationships The AlexandriaDigital Library (ADL) proposals allow for other forms of footprint ranging from aminimum bounding rectangle at the least accurate to what might be a relativelyprecise polygonal boundary The determination of a footprint is in any event notalways simple as some place names refer to inherently imprecise regions for whichthere may be no lsquoo cialrsquo discrete boundary In such cases examples of which wouldbe the lsquoRockiesrsquo in America and the lsquoMidlandsrsquo in the UK it may be desirable toprovide a footprint based on a common understanding of the extent of the regionand the places within it
Here we present a method for estimating spatial footprints from the locations ofpoint sites that are known to lie inside a region and of point sites that are knownto be outside It is called the Dynamic Spatial Approximation Method (DSAM) andis based on the Voronoi diagram of the point sites DSAM is intended to be used incombination with gazetteers and geographical thesauri that contain the co-ordinatesof a centroid associated with each settlement or other named site It is assumed thatthe place name data are structured hierarchically and that the spatial relationshipof meets is encoded between the referenced regions Thus settlements and otherpoint-referenced sites should refer to their parent regions of which there could beseveral while regional place names refer both to their parents and to their connectedneighbours Regions for which DSAM estimates a spatial footprint may be preciseadministrative areas or imprecise topographic or cultural areas and they may becurrent or historical Support of historical regions necessitates the presence of tem-poral data associated with the place names but this is now widely regarded as animportant element of gazetteers (Copp 1997 Moss et al 1998 Chappell 1999 Hillet al 1999 Beard et al 1997a) as indeed it is of any metadata
In the remainder of the paper we describe in sect2 the OASIS system that we havedeveloped for modelling place names and associated semantic data This system isused to provide the data needed to implement DSAM The DSAM method isdescribed in detail in sect3 Sections 41 and 42 present results of evaluating the qualityof region approximation with regard to area and to visual appearance respectivelyIn sect43 we present the results of some preliminary experiments to evaluate thereliability of the method for determining selected topological directional and proxim-ity relations DSAM evaluation and future work are covered in sect5 Conclusions arepresented in sect6
2 The OASIS system21 OASIS overview
The DSAM method was developed as an approximate spatial region represen-tation and inference method for the OASIS (Ontologically Augmented SpatialInformation System) research project OASIS is a prototype hypermedia informationsystem developed to explore the potential of knowledge organisation systems insearching cultural heritage data collections An important consideration is the provi-sion of functionality to support queries in space and time and to do so in a waythat would be global in spatial coverage To this end OASIS combines thematicdata with a geographical thesaurus which while containing only sparse geometricdata is relatively rich in encoding qualitative relationships between named placesSeveral spatial and thematic similarity measures are employed in the OASIS systemto nd similar items and places by imprecisely matching query terms
H Alani et al290
22 OASIS data
The two main types of data used in this project are thematic and spatial Thematic
data includes data on museum objects and artefacts where and when they werefound or made the material they are made of etc This data was taken mainly from
the Royal Commission on the Ancient and Historical Monuments of Scotland
(RCAHMS) which contains a large amount of information on archaeological sites
and historical buildings and monuments in Scotland (Murray 1997) This was
combined with the Art and Architecture T hesaurus (AAT) which is a vocabulary
resource developed by the J Paul Getty Trust It contains over 120 000 structured
terms for the description of art architecture and material culture (Petersen and
Barnett 1994) The classi cation schema of the OASIS system was linked to theFORTH (Foundation for Research and TechnologymdashHellas) implementation of
the AAT which provides the necessary thematic descriptors for the RCAHMS data
such as lsquobronzersquo lsquodiskrsquo lsquobuildingrsquo lsquocastlersquo etc
The spatial data in the OASIS system includes information on hierarchical and
adjacency relations between named places place types and co-ordinates Much of
this information was derived from the Bartholomewrsquos (Harper Collins 2000) digital
map data for Scotland which includes place names and co-ordinates of several typesof objects such as towns villages airports hills golf courses etc Some data such
as place types and alternative names was also taken from the Getty T hesaurus
for Geographic Names database which is a structured vocabulary of place names
(Harpring 1997a) The TGN places are represented hierarchically according to the
current political and physical world A place name can be vernacular English or a
historical name
23 OASIS classi cation schema
OASIS has a rich classi cation schema that enables the storage of diŒerent
versions of place names (eg current and historical names names in diŒerent lan-
guages) place types (eg City Building Port Hill ) latitude and longitude co-
ordinates and topological relationships (eg overlaps meets part of ) ( gure 1) The
schema is implemented using the Semantic Index System (SIS) an objected-oriented
Figure 1 The classi cation schema of lsquoPlacersquo in the OASIS system
Voronoi-based region approximation 291
database system (Constantopolous and Doerr 1993 Doerr 1997) which is also usedto store the data The SIS has a meta modelling capability and an applicationinterface for querying the schema
The meta level classi cation of Place is shown in gure 1 Classes are representedby rectangular boxes linked to other classes via relationships represented by arrowlines Relationships can also be instantiated or subclassed from other relationshipsFor example the relationships meets overlaps and partOf are subclasses of therelationship T opological Relationships Standard Name and Alternative Name areinstances of the relationships Preferred T erm and Non Preferred T erm respectively(shown between brackets in gure 1) Place inherits all other relationships such aslongitude latitude area etc from its superclass Geographical Concept
Figure 2 shows the classi cation diagram of the City of Edinburgh The City ofEdinburgh is an instance of Geopolitical Place The places that are part of the Cityof Edinburgh are represented in gure 2 by a dummy class called MANYpartOfwhich can be opened in a separate window listing all the places that are administrat-ively part of the region of the City of Edinburgh The City of Edinburgh is also linkedby meets relationships to the regions that it shares a boundary with Although themeets relationships are symmetric they were entered in both directions to increasethe speed of search and retrieval The information stored in the OASIS databasecan be accessed using a set of functions through which it is possible to nd all theinformation related to a given place or nd all the places with speci c relationshipsFor example to nd all the places that are part of Edinburgh the system wouldreturn a set of all the places that are linked with a partOf relationship pointing toEdinburgh All relationships can be associated with dates For example a partOfrelationship can be linked to a certain date to indicate when the place became partof the other This makes it possible for example to nd all places that used to bepart of Edinburgh during a certain period of time This type of information isnecessary in generating fuzzy and historical boundaries as will be explained in sect3
Figure 2 The classi cation of the City of Edinburgh
H Alani et al292
3 The DSAM methodThe Dynamic Spatial Approximation Method (DSAM) generates approximations
of spatial regions based on Voronoi diagrams ( gure 3) These diagrams are builtfrom the co-ordinates of places within these regions and of places in regions thatare known to surround them DSAM cannot be applied in its current form to mainlyempty regions or to a region that is connected to an empty region An empty regionis one that has no places to be part of it either due to lack of data or due to itstopographical type (eg lake sea etc) Several approaches are proposed later in thispaper to widen the scope of the methodrsquos implementation
As explained in sect23 the places that are part of a speci c spatial region can easilybe found from the OASIS system via partOf relationships and their co-ordinates canbe retrieved Each region is linked with meets relationships to its surrounding regionsHence the co-ordinates of the places within the surrounding regions can also beretrieved These co-ordinates are then used to construct the Voronoi diagrams thatrepresent the boundary approximation
Boundary approximations generated by DSAM are used to infer spatial relationsbetween regions in the absence of digitised boundaries Tests presented in this papershow that the inconsistency between DSAM approximations and the original bound-aries can be quite low ( gure 4) From the approximations it is possible to calculatearea measures directional relationships (eg 10 north 90 north-east) topologicalrelationships of overlap lengths of shared boundaries and point-to-region andregion-to-region Euclidean distances
DSAM has the capability of handling change and generating fuzzy and historicalboundaries from the co-ordinates of the places that are known to be or have beenwithin these boundaries For example to get the administrative boundaries of aregion at a certain date all that is required are the places known to be part of thatregion at that time The OASIS system can store and retrieve this type of informatione cienctly as demonstrated in sect23 To take a hypothetical example assume that auser is interested in the area of South Lanarkshire that was aŒected by a oodingat a speci c date The DSAM approximation for South Lanarkshire can be generatedas usual then the set of Voronoi polygons of the places that were aŒected by the ooding can be retrieved The area and boundary length of the selected zone can bemeasured from the area and boundaries of the Voronoi polygons in the retrieved set( gure 5)
Figure 3 Midlothian region (a) Actual boundaries and points (b) DSAM approximation
Voronoi-based region approximation 293
Figure 4 Three regions in Scotland (a) The original administrative boundaries (b) the DSAMapproximation
Having a large number of accurate place co-ordinates is important as the qualityof DSAM approximations increases with the number of place co-ordinates available
31 Voronoi diagramsVoronoi diagrams are fundamental types of data structures in computational
geometry (Aurenhammer 1991) They have important value in many elds such ascomputer science mathematics physics natural science etc The Voronoi diagramof a set of points is the partition of space around them into cells where each cellrepresents the area of space that is closer to the associated point than to any otherpoint ( gure 6) The Voronoi polygon of a point is created from the perpendicularbisectors of the segments linking that point to those points closest to it
Several versions of Voronoi algorithms have been developed for various typesof spatial query (Okabe et al 1992) Voronoi diagrams are valuable in de ningsolutions to spatial adjacency and nearest-neighbour problems (Sedgewick 1988Aurenhammer 1991 Gold 1989 Gold 1991) Points are considered to be adjacentto each other if they share a Voronoi polygonal boundary Having constructed aVoronoi diagram the nearest data point to an arbitrary location may be found bydetermining the Voronoi polygon that contains the location
Insertion and deletion of points to Voronoi diagrams can be implemented at runtime without the need to reconstruct the whole diagram This assures that updateddata can be available at all times and opens new possibilities for users to experimentwith the data and formulate lsquowhat-if rsquo type of queries (Gold 1992)
H Alani et al294
Figure 5 DSAM approximation of fuzzy boundaries
Figure 6 Voronoi diagrams for a set of points
The Voronoi diagrams used in this paper were generated using ArcInforsquos Thiessenalgorithm The research also made use of a program called Qhull (1997) whichcomputes Voronoi diagrams convex hulls Delaunay triangulations and other geo-metric algorithms Areas of Voronoi polygons and their edge lengths can be calculatedfrom the co-ordinates of the Voronoi nodes produced by Qhull It is also possibleto nd the two place-points that a speci c polygonal edge falls between and viceversa This information is used by DSAM to identify the boundary between tworegions from the polygonal edges that lie between pairs of points one from eachregion Areas of regions can be approximated from the total area of Voronoi polygons
Voronoi-based region approximation 295
of the points that are part of that region Other spatial information can be derivedfrom Voronoi diagrams as will be seen later in this paper
32 QueriesDSAM can be used to answer a variety of spatial queries and to rank results
1 Shape representation lsquoShow me the region of Falkirkrsquo2 Shared boundary lengths between regions known to meet lsquoHow long is the
boundary between Midlothian and West L othianrsquo DSAM can calculate thelengths of shared boundaries and rank the regions accordingly
3 Area of overlap between overlapping regions lsquoW hich hills overlap the L othianarearsquo DSAM can rank the answer set according to the degree of overlap
4 Directional relationships lsquoW hat administrative regions surround Aberdeenshirefrom the southrsquo lsquoAre there any Roman sites to the west of Midlothianrsquo DSAMcan calculate and rank directional relationships with regard to areal extent
5 Generating current historical and imprecise boundaries lsquoShow me the bound-ary of the L othian region as it used to be in 1992rsquo lsquoGive me information onbronze lamps found within the 17th century borders of Edinburghrsquo lsquoShow me theboundary of the Middle Eastrsquo
6 Euclidean distance calculation between point and area referenced objectslsquoHow far is Edinburgh Castle from the Scottish Bordersrsquo
7 Nearest neighbour queries lsquoW hich is the nearest museumrsquo DSAM is based onVoronoi diagrams which in turn can be used to answer nearest neighbourqueries
4 Error of approximationAs mentioned earlier to assure good quality DSAM approximations it is neces-
sary to have a uniformly distributed large amount of point-location co-ordinatesIn the experiments that follow the point-locational data were taken from theBartholomewrsquos digital map data sets for the UK and include various point-referencedsites in addition to settlements Quality of approximation can be measured in diŒerentways that can be categorized as follows
1 T otal areal error This is the common way to measure approximation qualitywhich is based on comparing the area of approximation with the area of theoriginal region
2 V isual error This is related to how diŒerent the approximated shape is fromthe original regionrsquos shape This is important when representing objectsgraphically
3 Quality of spatial relationships This concerns the extent to which the spatialrelationships between the approximated regions are consistent with the spatialrelationships between the original regions
41 T otal areal errorThe areal approximation error can be calculated from the diŒerence in area
measure between the approximation and its original region As explained in thefollowing section the DSAM method as does any boundary generalization methodproduces negative and positive false areas However for areal change calculationsonly total areas will be compared disregarding whether the area is a positive ornegative false area ( gure 7) Accuracy of total area is important for queries of thesort lsquowhich is the largest region in Scotland rsquo or simply lsquowhat is the size of
H Alani et al296
Aberdeenshire rsquo To process such queries it is important that the total area ofapproximation is as close as possible to the area of the original region The arealerror can be calculated as follows
Areal Error 5|A
pOtilde A0 |
A0100 (1)
where Ap
is the total area of approximation and A0 is the area of the original objectAreal error of 0 means that the area of approximation equals the original area Ifareal error is more than 100 this means that the approximated area is more thandouble the original one
411 Experiment with areal error calculationsTable 1 shows the areal error calculations for ve regions in Scotland using
equation (1) It can be seen that the average areal error was around 2 with almostan exact match in some cases
42 V isual errorThe visual error of approximations becomes an important issue when providing
graphical displays of spatial regions The user might like to see the location of acertain place with respect to its region For some applications it might be su cientand acceptable to use these approximations to represent some of the query resultsgraphically
The DSAM method for approximation of the boundaries of spatial regions
Figure 7 Midlothian region in Scotland (a) Actual administrative boundary (b) DSAMapproximated boundary
Table 1 Areal change calculations
Region Actual area (m2 ) Approximate area (m2 ) Areal error ()
Midlothian 357 933 800 369 804 965 332City of Edinburgh 262 121 500 263 735 365 062West Lothian 425 225 700 438 630 988 320North Lanarkshire 469 075 300 469 353 531 006South Lanarkshire 1 772 854 808 1 812 363 430 223
Average 189
Voronoi-based region approximation 297
normally results in negative and positive false areas Negative false areas are theoriginal areas that were left out in the approximation while positive false areas arethe ones that were added to the approximation and did not belong to the originalregion ( gure 8) Here we use the sum of these false areas (symmetric diVerence) as asimple measure of the extent to which the method retains the visual form of theoriginal region
The following function is used to calculate visual error
V isual Error 5A
pp1 A
npA0
100 (2)
where App
is the positive approximated false area Anp
is the negative approximatedfalse area and A0 is the original area Visual error of 0 is an exact match in shapebetween the approximation and the original object If visual error exceeds 100this means that the area of symmetric diŒerence exceeds the original area
421 Experiment with visual error calculationsThe visual error was calculated for ve regions in Scotland using equation (2)
and the results are presented in table 2 below The average visual error was foundto be around 13
43 Quality of spatial relationshipsFor purposes of information retrieval it may be desirable to combine qualitative
relations with a quantitative value that re ects the extent or degree of the relationshipThis type of information is important when measuring similarities between spatialobjects and ranking query results (Bruns and Egenhofer 1996 Beard and Sharma1997b) For example the answer to a query of the form lsquoGive me information onwoodland overlapping region Arsquo could be ranked according to the amount of over-lapping area so that woodland with most overlapping area would be placed at thetop of the list Traditional gazetteers cannot usually be used to obtain the necessarydata They are also weak in calculating Euclidean distances adjacency and nearest
Figure 8 Midlothian The grey region is the actual boundary and the black line representsthe DSAM approximation
H Alani et al298
Table 2 Calculating the visual change
Area ofActual symmetric Negative Visual
Region area (m2 ) diŒerence (m2 ) false area (m2 ) error ()
Midlothian 357 933 800 33 184 245 21 313 198 1523City of Edinburgh 262 121 500 25 004 927 23 493 275 1850West Lothian 425 225 700 31 154 227 17 748 877 1150North Lanarkshire 469 075 300 30 033 283 29 755 049 1275South Lanarkshire 1 772 854 808 87 229 767 47 720 807 761
Average 1312
neighbour relationships for regions as point co-ordinate information maintained bygazetteers is not su cient to compute such relationships For example measuringEuclidean distances between regions from their centroid co-ordinates would produceinaccurate results if the user were interested in Euclidean distances between theirboundaries
The three main categories of spatial relationships are topological directionaland proximity relationships (Pullar and Egenhofer 1988 Egenhofer 1991 Clementiniet al 1993) The following sections describe how the DSAM method can be used toderive spatial relationships using simple mathematical procedures and present somepreliminary experiments to test the quality of result
431 T opological relationshipsTopological relationships are related to how objects interconnect and form an
important component of spatial information systemsThe six main topological relationships are inside cover equal meet overlap and
disjoint (Egenhofer 1991) DSAM approximation s can be used to evaluate all of thesetypes of relationship but the results can be expected to be more error-prone than whenusing full boundary representations Examples of speci c types of error are providedin sect5 Figure 9 illustrates an example of the result of using DSAM approximationextents to determine overlap and adjacency respectively between pairs of regions In
Figure 9 (a) Calculating overlapping area between two regions (b) Measuring a sharedboundary length
Voronoi-based region approximation 299
gure 9(a) the overlap is represented by the shared Voronoi polygons which arebounded by white lines In the case of adjacency in gure 9(b) the boundary is estimatedfrom the Voronoi polygon edges that are common to the two regions
4311 Experiments to estimate boundaries between regions Table 3 shows theresults of measuring lengths of shared boundaries between selected regions Thetable compares actual boundary lengths with those calculated from DSAMapproximations The shared boundary error can be calculated as follows
Boundary Error 5|B
pOtilde B0 |
B0100 (3)
where Bp
is the boundary calculated from DSAM approximations and B0 is theoriginal boundary length Boundary error of 0 is an exact match between theapproximated boundary and the original boundary A boundary error of morethan 100 indicates an approximated boundary of more than double the originalboundary length
Table 3 Measuring lengths of shared boundaries
Actual Approximateshared shared
boundary boundary BoundaryRegion 1 Region 2 length (m) length (m) error ()
West Lothian North Lanarkshire 23 95862 19 84347 1718West Lothian South Lanarkshire 20 84275 22 91600 995West Lothian Scottish Borders 836662 869254 385North Lanarkshire South Lanarkshire 32 40317 33 69614 399South Lanarkshire Scottish Borders 55 20104 57 37511 394Falkirk North Lanarkshire 32 57432 29 40623 973Midlothian City of Edinburgh 29 73245 34 63331 1648
Average 930
The results presented above show that the average error of shared boundarymeasures is 93
432 Directional relationshipsDirectional relationships (Frank 1992 1996) are widely used in spatial queries
and complement topological relationships in measuring spatial objectsrsquo similarity(Goyal and Egenhofer in press) Most systems use centroid co-ordinates MinimumBounding Rectangles (MBRs) or some representative points as models to derivedirectional relationships (Goyal and Egenhofer in press) Due to the roughness ofthese approximations several alternative approaches have previously been investi-gated These approaches focus on partitioning space around the MBR of the mainobject into 9 tiles (N NW NE S SW SE E W and 0) as shown in gure 10(Papadias and Egenhofer 1997 Goyal and Egenhofer in press Papadias andTheodoridis 1997 Theodoridis et al 1998) and measuring how much area of thetarget object falls into each tile
A typical example of query results on directional relationships would be of theform region A is 30 north-east of B and 70 east of B Figure 11 shows theDSAM approximations of two such regions Midlothian and South Lanarkshire
H Alani et al300
Figure 10 The nine spatial tiles for deriving directional relationships
Figure 11 Deriving directional relationships from DSAM approximations
The actual area of the original object in each tile can be approximated from the sumof the area of the Voronoi polygons in these tiles
The following section presents an experiment on calculating directional relation-ships from DSAM approximations
4221 Experiment with directional relationship calculations Directional relation-ships were calculated between three pairs of regions using their DSAM approximationsThe amounts of Voronoi-polygonal areas from these approximations were calculated ineach tile and compared to the actual area measures The error of results is calculatedusing equation 1 and presented in table 4 Results showed that the average error ofdirectional relationships driven from DSAM approximatio ns was around 2
Voronoi-based region approximation 301
Table 4 Calculating directional relationships
Query Target Actual DSAM Directionalobject object Direction area area error ()
Midlothian South North-east 96 022 632 94 523 244 156Lanarkshire East 261 911 168 275 281 721 510
North West North-west 31 864 180 31 057 230 253Lanarkshire Lothian West 424 699 900 425 625 738 022
South-west 12 511 233 12 670 561 127South West West 95 025 296 92 830 618 231Lanarkshire Lothian South-west 700 201 400 715 834 415 223
South 977 543 200 1 003 688 874 267Average 224
433 Proximity relationshipsProximity relationships represent qualitative and quantitative distances between
objects An example of a quantitative query is lsquo nd all forests within 10 miles fromthe riverrsquo A qualitative query could include near or far relationships lsquowhich castlesare near to the river rsquo
As mentioned earlier Voronoi diagrams can be used to answer nearest neighboursand spatial adjacency queries The Voronoi polygon for each point represents thearea closest to that point Therefore nearest neighbour queries can easily be answeredby identifying the polygon that the query place falls in For example to nd thenearest castle to a speci c location all that is needed is to identify which castle-Voronoi-polygon the location falls in
Distance calculations form an important part of spatial information systems(Laurini and Thompson 1994) Euclidean distances between point-referenced objectscan easily be calculated from their co-ordinates However Euclidean distancesbetween area-referenced objects or between point and area-referenced objects aremore di cult to calculate An area-referenced object such as a region has a boundaryas well as a centroid-point Measuring Euclidean distances to the centre of the regionis not always desired Consider the query lsquoHow far is this place f rom the boundaryof region Arsquo or lsquoShow me all castles within 20 miles of region Brsquo To process suchqueries accurately it is important to measure the distance to the boundaries ratherthan to the regionsrsquo centres Euclidean distances between boundaries can be calcu-lated from DSAM approximations Shortest Euclidean distances between point andarea objects can be measured between the pointrsquos co-ordinates and the closestpolygonal boundary point of the DSAM approximation for the area object In thesame way it is possible to measure the shortest Euclidean distance between two areaobjects from the distance between their closest pair of polygonal boundary points
The following section presents an experiment with Euclidean distance calculationsbetween point and area referenced places
4331 Experiment with Euclidean distance calculation The shortest Euclideandistances were measured from six randomly selected towns to the boundary of NorthLanarkshire The distances were rst measured to the actual boundary of NorthLanarkshire then compared to the distance values measured to the DSAM approxi-mated boundary ( gure 12) The measurement using the DSAM approximated
H Alani et al302
Figure 12 Calculating Euclidean distances to DSAM approximations
boundary was subject to the simpli cation of measuring distances from the givenpoints to the nearest node of the DSAM boundary
Euclidean distance error is calculated using an equation of the same form asequation (3) From the table below it can be seen that Euclidean distances measuredto the DSAM approximated boundary are of good quality with an average error ofaround 4 DSAM quality in measuring Euclidean distances is expected to increasewith the increase in distance This is because the further the point location is fromthe target region the less is the eŒect of the boundary approximation error on theEuclidean distance measure
5 EvaluationDSAM approximation quality depends on the amount and quality of data
available in the form of places and co-ordinates In general DSAM approximationscould produce three types of error
1 Qualitative errors when inferring topological relationships2 Measurement errors when calculating area and boundary lengths3 Statistical errors when ranking query results
Table 5 Calculating Euclidean distances
Town Actual distance (m) DSAM distance Distance error ()
Lorn 27 327 26 751 211Camelon 5347 4715 1182Torphichen 7008 7307 427Neilston 20 253 20 332 039Hareshaw 18 513 18 168 186
Average 409
Voronoi-based region approximation 303
Qualitative errors might occur when inferring topological relationships fromDSAM approximations Some topological relationships such as partOf and meetswere retrieved from the Bartholomewrsquos data and stored explicitly in the OASISdatabase DSAM relies on partOf relationships in constructing Voronoi diagramsfor region approximation and on meets relationships to decide whether two regionsare connected or disjoint
If little data is available or it is of low quality then inconsistencies may arisebetween the spatial relationships inferred from DSAM and those existing betweenthe original regions Figure 13 gives an example of such incompatibility where theDSAM approximations for Midlothian and West Lothian share a boundary whilethe actual regions are disjoint This is due to the lack of points in our dataset in theparts of the City of Edinburgh and the Scottish Borders that separate Midlothianfrom West Lothian The result of this error falls in two parts First the approxi-mations of two very close but separate regions (West Lothian and Midlothian)became connected and shared a boundary Secondly the approximations of twoslightly connected regions (Scottish Borders and the City of Edinburgh) becameseparate The rst part of the problem may be solved by making use of the meetsrelationship to decide whether two regions are connected or not rather than tryingto infer this information from their approximations which will be a more error-prone and computationally intensive process The second part of the problem israther more di cult to solve due to the loss of information involved A zero lengthof shared boundary between two regions linked with a meets relationship is a signof inconsistency which an integrity checking procedure could detect and request amanual intervention to insert notional points for purposes of DSAM processing
Calculating area and boundary lengths from DSAM region approximations issubject to measurement errors Such calculations are aŒected by the amount of falsearea involved in the approximations
Ranking can introduce statistical error where the ranks of query results maydiŒer slightly from the ranks of the original values For example in the experimentresults presented in table 3 although the approximation quality was good theranking was not totally accurate Consider the rst two records The actual sharedboundary length in the rst record is longer than in the second record Howeverthe approximated shared boundary in the second record turned out to be longerthan the rst one This occurs where the actual boundary lengths to be approximatedare similar For example in the rst two records the diŒerence between the actual
Figure 13 Change in shared boundaries (a) actual boundaries (b) approximated boundaries
H Alani et al304
shared boundary lengths was less than 15 In such cases a slight negative orpositive change in their approximated lengths could change the ranking Howeveran overall comparison between the ranks of the approximated and original valuesin table 3 yields a Spearman coe cient of 0822 (where 10 means an exact matchbetween the two ranks) This indicates that ranking is of good quality overallRanking quality should improve even more when dealing with larger sets of results
At present DSAM is suitable for approximating inland regions surrounded byother regions This is because the approximation is built from the Voronoi diagramsof the co-ordinates of the places within these regions Therefore if the region to beapproximated is connected to a sea on the one side for example then the obviouslack of place co-ordinates in the sea region results in a high degree of inaccuracy inthe boundary approximation of that particular side Incomplete Voronoi polygonsand dangling segments normally occur when co-ordinates are available from oneor more sides of a region to be approximate Such cases can be agged by mostVoronoi programs
6 Conclusions and future workGazetteers use sparse spatial databases in which geographical place names are
associated with a spatial footprint Usually the footprint is con ned to a centroid orminimum bounding rectangle and does not include boundary data As a consequencegazetteers have conventionally been of limited use in answering queries on spatialrelationships and boundaries DSAM provides an eŒective way to approximate theextent of spatial regions and derive their spatial relationships using sets of co-ordinates in association with place name hierarchies and region adjacency dataTraditional spatial information systems often face di culties in storing and repres-enting historical and imprecise boundaries DSAM is capable of approximatingboundaries of precise and imprecise regions with respect to time
The DSAM method uses a set of functions based on Voronoi diagrams to estimatespatial relationships between named places represented by their centroid co-ordinatesTests presented in this paper showed that the DSAM method gives good results formeasures of area shared boundary lengths between regions that are known to meetarea of overlap between overlapping regions Euclidean distances and directionalrelationships In doing so they provide good approximations of current historicaland imprecise boundaries and help in answering nearest neighbour queries
As regards limitations the DSAM method presented cannot be used reliably fordetermining topological relationships due to its sensitivity to the con guration ofthe source points While the method is intended to be used in combination withsupplied topological relationships problems can occur when attempting to makemeasurements of associated boundaries However there is clearly scope for extendingthe method to ensure consistency between DSAM-determined relationships and thesupplied topological relationships This could be done by inserting appropriatelylocated dummy points There is also the problem of unbounded DSAM regions dueto the presence of real-world regions that are not represented by centroid data aprime example being the sea Possible solutions include the insertion of dummypoints in the unrepresented region or boundary approximation based on the convexhull of the centroids of the represented region It is important to note that theaccuracy of a DSAM region approximation depends upon the density and distribu-tion of the centroid data Future work will investigate the multiresolution nature ofDSAM and its relationship to depth of descent within place name hierarchies
Voronoi-based region approximation 305
AcknowledgementsWe would like to acknowledge assistance provided to this project by the J Paul
Getty Trust the FORTH Institute of Computer Science and the Royal Commissionon the Ancient and Historical Monuments of Scotland
References
Aurenhammer F 1991 Voronoi diagramsmdasha survey of a fundamental geometric datastructure ACM Computing Surveys 23 345ndash405
Beard K Smith T and Hill L 1997a Meta-information models for georeferenced digitallibrary collections In Proceedings of the 2nd IEEE International Metadata Conference(Silver Spring MD)httpcomputerorgproceedingsmeta97paperskbeardkbeardhtml
Beard K and Sharma V 1997b Multidimensional ranking for data in digital spatiallibraries International Journal on Digital L ibraries 1 153ndash160
Bruns T H and Egenhofer M J 1996 Similarity of Spatial Scenes In Proceedings of the7th International Symposium on Spatial Data Handling Delft The Netherlands(London Taylor and Francis) pp 31ndash42
Chappell C 1999 Changing boundaries gazetteers information retrieval and data browsingASSIST Quarterly 23 19ndash21
Clementini E Di Felice P and van Oosterom P 1993 A small set of formal topologicalrelationships suitable for end-user interaction In Advances in Spatial DatabasesProceedings of the 3rd International Symposium SSDrsquo93 (Singapore) Lecture Notes inComputer Science 692 pp 277ndash295
Constantopolous P and Doerr M 1993 The Semantic Index Systemmdasha brief pres-entation Institute of Computer Science Technical Report FORTH-Hellas Gr-71110Heraklion Crete
Copp C J T 1997 The JNCC Electronic Dictionary of Administrative Areas MDA informa-tion 2 13ndash19
Doerr M 1997 Reference information acquisition and co-ordination In Proceedings of the60th Annual Meeting of the American Society for Information Science 34 (C ShwartzM Rorvig eds) Medford NJ Information Today pp 295ndash312
Egenhofer M J 1991 Point-set topological relations International Journal of GeographicalInformation Science 5 161ndash174
Frank A U 1992 Qualitative spatial reasoning about distances and directions in geographicspace Journal of V isual L anguages and Computing 3 343ndash371
Frank A U 1996 Qualitative spatial reasoning cardinal directions as an exampleInternational Journal of Geographical Science 10 269ndash290
Gold C M 1989 Spatial interpolation spatial adjacency and GIS In T hree DimensionalApplications in Geographic Information Systems edited by J Raper (London Taylorand Francis) pp 21ndash35
Gold C M 1991 Problems with Handling Spatial Datamdashthe Voronoi Approach CISMJournal 45 65ndash80
Gold C M 1992 Dynamic Spatial Data Structuresmdashthe Voronoi Approach In Proceedingsof the Canadian Conference on GIS (Ottawa CIG and ISPRS) pp 245ndash255
Goyal R K and Egenhofer M J in press Cardinal directions between extended spatialobjects IEEE T ransactions on Knowledge and Data Engineering
Harper Collins 2000 Bartholomew httpwwwbartholomewmapscomHarpring P 1997a The limits of the world theoretical and practical issues in the construction
of the Getty Thesaurus of Geographic Names In Proceedings of the 4th InternationalConference on Hypermedia and Interactivity in Museums ICHIM rsquo97 Archives andMuseum Informatics (Paris Le Louvre) pp 237ndash251
Harpring P 1997b Proper words in proper places the thesaurus of geographic namesMDA Information 2 5ndash12
Hill L L 1996 Proposal for developing an Internet-accessible gazetteer based on a newcontent standard and open contribution of gazetteer datahttpwwwalexandriaucsbedu~ lhillalex-impgazprop6htm
Voronoi-based region approximation306
Hill L L Frew J and Zheng Q 1999 Geographic names The implementation of agazetteer in a georeferenced digital library Digital L ibrary 5 (1)wwwdliborgdlibjanuary99hill01hillhtml
Jones C B Taylor C Tudhope D and Beynon-Davies P 1996 Conceptual spatialand temporal referencing of multimedia objects In Advances in GIS Research IIProceedings 7th International Symposium on Spatial Data Handling (London Taylorand Francis) 2 pp 13ndash26
Larson R R 1996 Geographic information retrieval and spatial browsing GIS and L ibraries32nd Annual Clinic on L ibrary Applications of Data Processing Conference (Urban-Champaign University of Illinois) pp 81ndash124
Laurini R and Thompson D 1994 Fundamentals of Spatial Information Systems (LondonAcademic Press Limited)
Moss A Junbg E and Petch J 1998 The construction of WWW-based gazetteers usingthesaurus techniques In Proceedings of the 8th International Symposium on SpatialData Handling (SDHrsquo98) (Vancouver Canada International Geographical Union)pp 65ndash75
Murray D 1997 GIS in RCAHMS MDA information 2 35ndash38Okabe A Boots B and Sugihara K 1992 Spatial T essellationsmdashConcepts and
Applications of Voronoi Diagrams (Chichester Wiley)Papadias D and Egenhofer M J 1997 Algorithms for hierarchical spatial reasoning
Geoinformatica 1 251ndash273Papadias D and Theodoridis Y 1997 Spatial relations minimum bounding rectangles
and spatial data structures International Journal of Geographic Information Science11 111ndash138
Petersen T and Barnett P J 1994 Guide to Index and Cataloging with the Art andArchitecture T hesaurus (Oxford Oxford University Press)
Pullar D V and Egenhofer M J 1988 Towards formal de nitions of topologicalrelations among spatial objects In Proceedings of the 3rd International Symposium onSpatial Data Handling (Sydney IGU) pp 225ndash243
Qhull 1997 httpwwwgeomumnedusoftwareqhullSedgewick R 1988 Algorithms (New York Addison-Wesley)Theodoridis Y Papadias D Stefanakis E and Sellis T 1998 Direction relations and
two-dimensional range queries optimization techniques Data and KnowledgeEngineering 27 313ndash336
US Geological Survey 1998 Geographic Names Information System (GNIS)httpmappingusgsgovwwwgnis
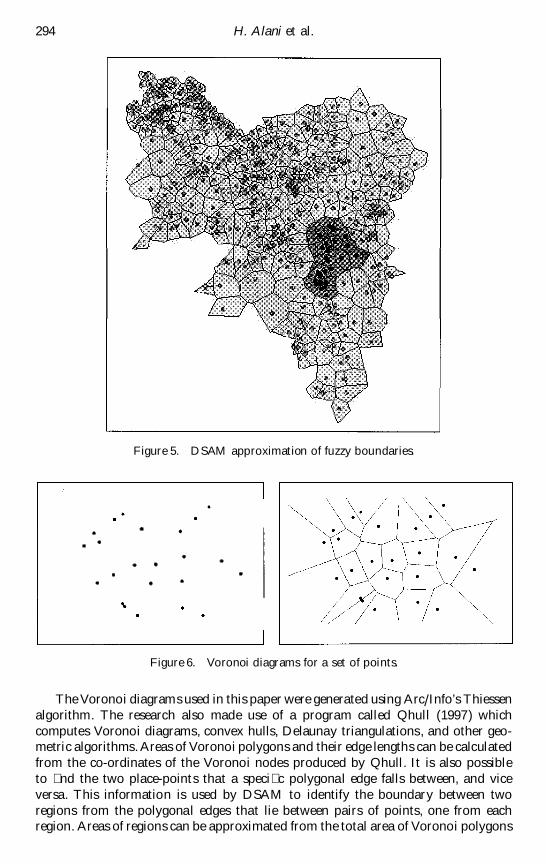
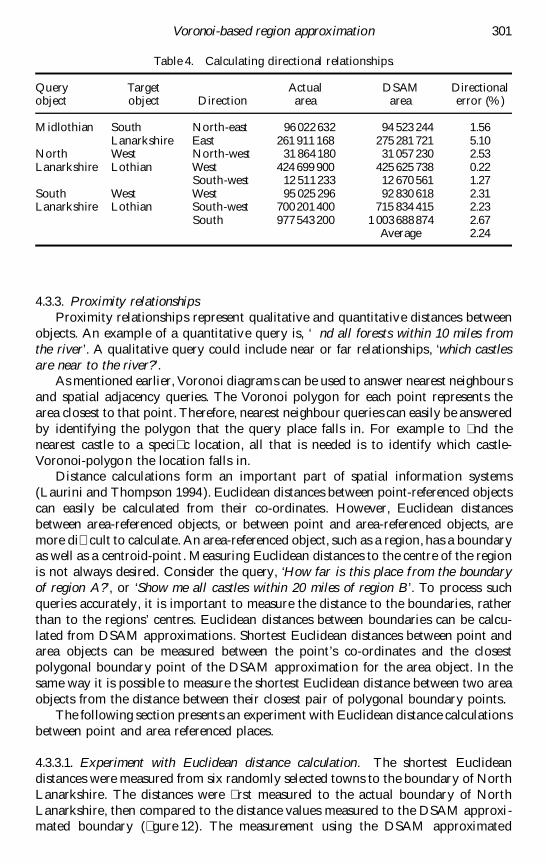
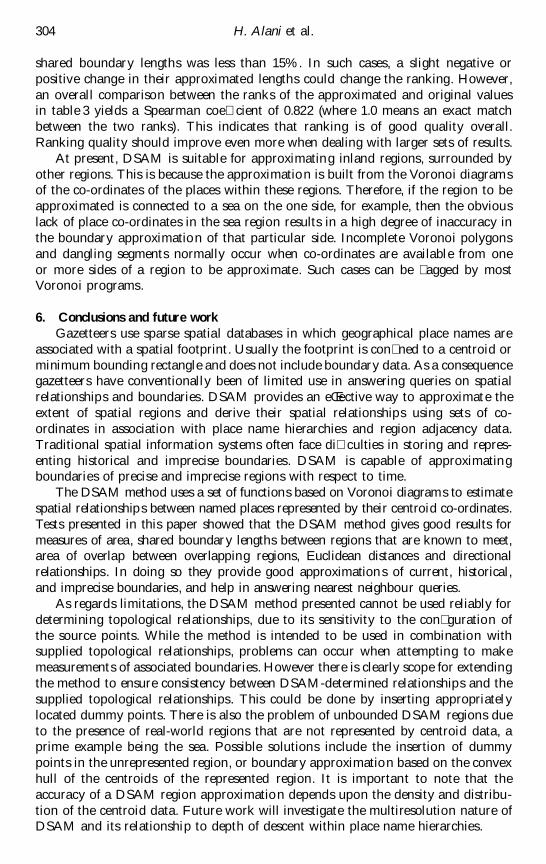