vortex structure in the wake of a wind turbine rotor
TRANSCRIPT

19ème Congrès Français de Mécanique Marseille, 24-28 août 2009
1
Vortex structure in the wake of a wind turbine rotor
B. MAALOUFa, I. DOBREV
a, F. MASSOUH
a
a. Ecole Nationale Supérieure d’Arts et Métiers (ENSAM), 151 bd de l’hôpital, 75013 PARIS
Résumé :
Ce travail décrit l’exploration, en soufflerie, du sillage d’un rotor éolien à trois pales et à axe horizontal.
Les mesures sont prises par la technique PIV, à plusieurs angles d’azimut. Afin d’élargir la zone
d’exploration, le champ de vitesse exploré est divisé en plusieurs fenêtres qui se chevauchent. Un algorithme
basé sur le calcul de la circulation permet de localiser la position des centres des tourbillons, d’extraire la
vitesse tangentielle, la vorticité et la circulation par rapport aux centres de ces tourbillons. La vitesse induite
est calculée et les caractéristiques des tourbillons marginaux issus des différentes pales sont évaluées. Les
vitesses tangentielles des tourbillons sont analysées et les coefficients du model de tourbillon de Vatistas sont
évalués. Ces coefficients sont différents de ceux obtenus pour les hélicoptères. Enfin, l’analyse du champ de
vitesse montre comment la circulation des tourbillons marginaux, le diamètre des cœurs tourbillonnaires et la vitesse tangentielle maximale varient en fonction de l’âge des tourbillons.
Abstract :
This paper describes the wind tunnel investigation of vortex wake flow downstream of a three blades rotor of
a horizontal-axis wind turbine (HAWT). The phase-locked measurements are carried out by means of
particle image velocimetry in several azimuth planes. In order to widen the explored area, the investigated
velocity field is divided into several windows with some overlapping. An algorithm based on circulation calculation permits to find the vortex core centers and to extract velocity, vorticity and circulation with
respect to these vortex centers. After the conditionally averaging, the net vortex induced velocity is extracted
and the characteristics of the tip vortices trailing from consecutive blades are evaluated. The obtained
results for the tangential velocity are analyzed and coefficients of Vatistas vortex model are evaluated. These
coefficients are found to be different from the case of helicopter tip vortices. Finally, velocity field analysis
shows how trailing vortex circulation, vortex core diameter and peak tangential velocity vary as a function
of the vortex age.
Mots clefs: sillage éolien, tourbillon marginal, PIV
1 Introduction
The investigation of the wake development downstream wind turbines is required for the design of wind
farms. The tip vortices present in the wake play an important role in wind turbine aerodynamics. Trailed
from blade tips, they stay close to the rotor and produce a very complex velocity field with strong gradients.
These vortices are also a major source of unsteadiness, aerodynamic noise and aerodynamic interaction. The
free wake method is often used to analyze unsteady flow around the wind turbine. To improve this method,
the potential vortex line needs to be replaced with a real vortex tube, Leishman et al. (2002). Therefore it is important to investigate the vortex trailed from blade tip in order to gather comprehensive information about
vortex intensity, swirl velocity distribution and vortex diffusion depending on vortex age.
A number of experiments have been performed in wind tunnels in order to reveal the wake development
behind a wind turbine. Because particle image velocimetry (PIV) is capable of measuring instantaneous
velocity field in a non-intrusive manner, PIV technique is used for the analysis of wind turbine wakes and
yielded qualitative results, published by Smith et al. (1991), Whale et al. (1996), Grant et al. (1997, 2000),
Maeda et al. (2005), Snel et al. and Massouh et al. (2007). The aim of this study is to present quantitative
information, acquired by PIV, about the wake downstream of a wind turbine model.
2 Test bench and experimental results
19ème Congrès Français de Mécanique Marseille, 24-28 août 2009
2
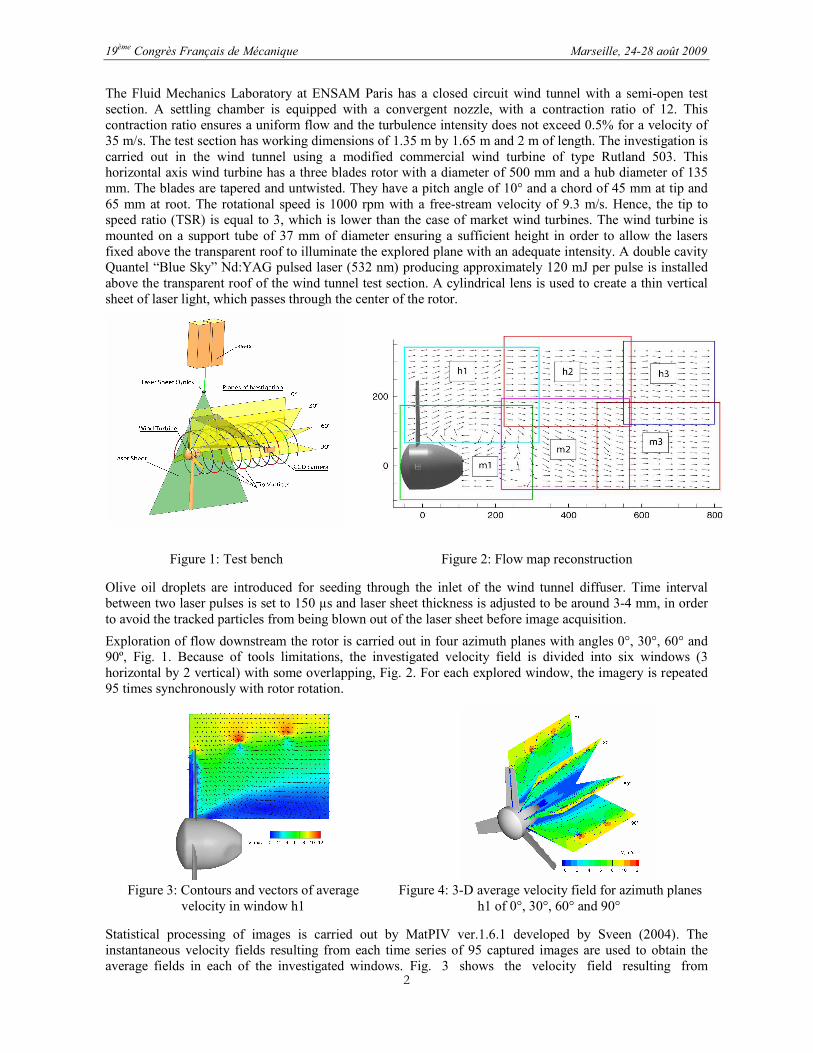
The Fluid Mechanics Laboratory at ENSAM Paris has a closed circuit wind tunnel with a semi-open test
section. A settling chamber is equipped with a convergent nozzle, with a contraction ratio of 12. This
contraction ratio ensures a uniform flow and the turbulence intensity does not exceed 0.5% for a velocity of
35 m/s. The test section has working dimensions of 1.35 m by 1.65 m and 2 m of length. The investigation is
carried out in the wind tunnel using a modified commercial wind turbine of type Rutland 503. This horizontal axis wind turbine has a three blades rotor with a diameter of 500 mm and a hub diameter of 135
mm. The blades are tapered and untwisted. They have a pitch angle of 10° and a chord of 45 mm at tip and
65 mm at root. The rotational speed is 1000 rpm with a free-stream velocity of 9.3 m/s. Hence, the tip to speed ratio (TSR) is equal to 3, which is lower than the case of market wind turbines. The wind turbine is
mounted on a support tube of 37 mm of diameter ensuring a sufficient height in order to allow the lasers
fixed above the transparent roof to illuminate the explored plane with an adequate intensity. A double cavity Quantel “Blue Sky” Nd:YAG pulsed laser (532 nm) producing approximately 120 mJ per pulse is installed
above the transparent roof of the wind tunnel test section. A cylindrical lens is used to create a thin vertical
sheet of laser light, which passes through the center of the rotor.
Figure 1: Test bench Figure 2: Flow map reconstruction
Olive oil droplets are introduced for seeding through the inlet of the wind tunnel diffuser. Time interval
between two laser pulses is set to 150 µs and laser sheet thickness is adjusted to be around 3-4 mm, in order
to avoid the tracked particles from being blown out of the laser sheet before image acquisition.
Exploration of flow downstream the rotor is carried out in four azimuth planes with angles 0°, 30°, 60° and 90º, Fig. 1. Because of tools limitations, the investigated velocity field is divided into six windows (3
horizontal by 2 vertical) with some overlapping, Fig. 2. For each explored window, the imagery is repeated
95 times synchronously with rotor rotation.
Figure 3: Contours and vectors of average
velocity in window h1 Figure 4: 3-D average velocity field for azimuth planes
h1 of 0°, 30°, 60° and 90°
Statistical processing of images is carried out by MatPIV ver.1.6.1 developed by Sveen (2004). The
instantaneous velocity fields resulting from each time series of 95 captured images are used to obtain the
average fields in each of the investigated windows. Fig. 3 shows the velocity field resulting from

19ème Congrès Français de Mécanique Marseille, 24-28 août 2009
3
averaged velocity fields for window h1. Here, we can observe the intersection between the plane of
exploration defined by the laser sheet and the helical vortex tubes trailed from blade tips.
The 3-D velocity field is reconstructed by aggregating the results of azimuth planes measurements close to
the rotor. Thanks to the synchronization of measurements, it is possible to observe the intersection of
azimuth planes with the tip vortices trailed from blade tips. The obtained data makes it possible to track the
helical tip vortices in the rotor wake, Fig. 4. The instantaneous vorticity field in window h1 is shown on Fig. 5, where we can clearly observe the localization of tip vortices. The investigation of the time series of this
instantaneous vorticity field shows that there is a fluctuation in the position of tip vortices cores. These
fluctuations, known as vortex jittering, produce an artificial reduction of vortex intensity when the average values are calculated from the instantaneous fields. The amplitude of these fluctuations increases
downstream the rotor, as shown in Fig. 6. In reality, in spite of vortex position instability, the vortex intensity
does not decrease as rapidly as the averaged velocity field predicts. Consequently, the average velocity field
is not reliable for comparison with CFD simulations.
Figure 5: Instantaneous vorticity in window h1 Figure 6: Vortex jittering in h1 window
3 Analysis of vortex characteristics
The most important vortex characteristics are intensity, swirl velocity distribution, maximum tangential
velocity and core radius as a function of vortex age. The vortex is usually divided in two parts: inner and
outer. The inner part, where viscous forces are predominant, is rotated as a rigid body, and at the vortex
center, the tangential velocity tends to zero. In the outer part, the velocity distribution decreases
hyperbolically with radial position and thus is similar to the flow induced by the potential vortex. The radius
where the tangential velocity reaches a maximum Vθmax and where the velocity distribution is changed is
known as vortex core radius rc. The laminar vortices are studied extensively and there are different vortex
models based on the simplified solutions of Navier-Stokes equations for laminar flow, like the solutions
proposed by Rankine, Lamb, Oseen or Burgers. Compared with real tip vortices encountered in wind turbine
aerodynamics, where flows are very turbulent, there are some discrepancies. In case of turbulent flow, for the same vortex core radius and for the same peak tangential velocity, the decrease of velocity is smaller
compared with laminar flow. To get a better approximation, Vatistas (2006) recently proposed the following
velocity distribution as a function of radial coordinate r:
m
rVrV
+
+=
4max
1)(
α
αθθ , where m = (α+1)/4 and crrr /=
In this formula, the parameter α represents the level of turbulence. The case of α = 1 represents laminar
velocity profile and α decreases with increasing turbulence intensity.
19ème Congrès Français de Mécanique Marseille, 24-28 août 2009
4
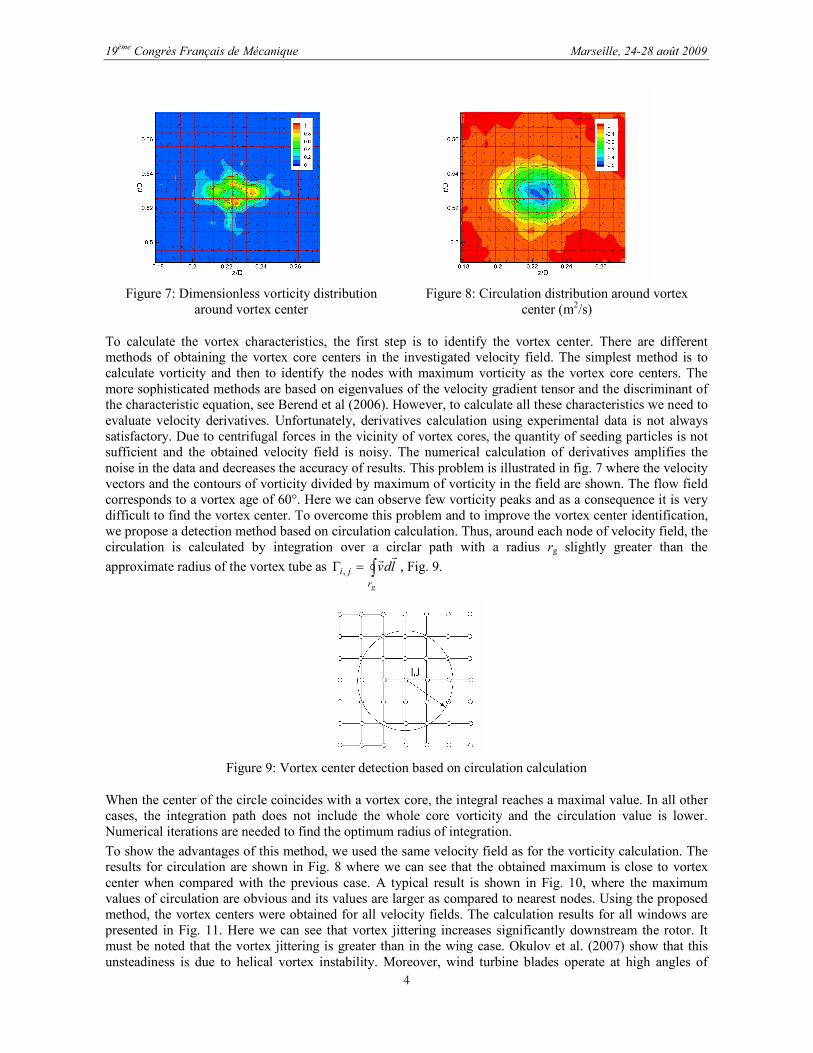
Figure 7: Dimensionless vorticity distribution
around vortex center
Figure 8: Circulation distribution around vortex
center (m2/s)
To calculate the vortex characteristics, the first step is to identify the vortex center. There are different methods of obtaining the vortex core centers in the investigated velocity field. The simplest method is to
calculate vorticity and then to identify the nodes with maximum vorticity as the vortex core centers. The
more sophisticated methods are based on eigenvalues of the velocity gradient tensor and the discriminant of the characteristic equation, see Berend et al (2006). However, to calculate all these characteristics we need to
evaluate velocity derivatives. Unfortunately, derivatives calculation using experimental data is not always
satisfactory. Due to centrifugal forces in the vicinity of vortex cores, the quantity of seeding particles is not sufficient and the obtained velocity field is noisy. The numerical calculation of derivatives amplifies the
noise in the data and decreases the accuracy of results. This problem is illustrated in fig. 7 where the velocity
vectors and the contours of vorticity divided by maximum of vorticity in the field are shown. The flow field
corresponds to a vortex age of 60°. Here we can observe few vorticity peaks and as a consequence it is very difficult to find the vortex center. To overcome this problem and to improve the vortex center identification,
we propose a detection method based on circulation calculation. Thus, around each node of velocity field, the
circulation is calculated by integration over a circlar path with a radius rg slightly greater than the
approximate radius of the vortex tube as ∫=Γ
gr
ji ldvrr
, , Fig. 9.
Figure 9: Vortex center detection based on circulation calculation
When the center of the circle coincides with a vortex core, the integral reaches a maximal value. In all other
cases, the integration path does not include the whole core vorticity and the circulation value is lower.
Numerical iterations are needed to find the optimum radius of integration.
To show the advantages of this method, we used the same velocity field as for the vorticity calculation. The results for circulation are shown in Fig. 8 where we can see that the obtained maximum is close to vortex
center when compared with the previous case. A typical result is shown in Fig. 10, where the maximum
values of circulation are obvious and its values are larger as compared to nearest nodes. Using the proposed
method, the vortex centers were obtained for all velocity fields. The calculation results for all windows are
presented in Fig. 11. Here we can see that vortex jittering increases significantly downstream the rotor. It
must be noted that the vortex jittering is greater than in the wing case. Okulov et al. (2007) show that this
unsteadiness is due to helical vortex instability. Moreover, wind turbine blades operate at high angles of

19ème Congrès Français de Mécanique Marseille, 24-28 août 2009
5
attack. Therefore the flow is close to stall or completely stalled. In this case, the blade section lift varies
constantly and therefore circulation varies permanently along the blades. As a result of bounded vorticity
variation, the free vorticity trailed from blades varies too. Hence tip vortices intensity and vortex cores
positions change permanently. The vortex jittering was already observed in the case of helicopter and wind
turbine rotor, see Bhagwat et al (2000) and Grant et al. (2000).
Figure 10: Absolute value of circulation distribution Figure 11: Wake 3-D reconstruction
In this study, the smearing effects on averaged velocity field caused by vortex jittering is eliminated by
means of conditional averaging method. Thus all vortex parameters are averaged according to vortex center and the variation of circulation as a function of radius for each vortex center is calculated by:
θπ Vrr 2)( =Γ
It is not easy to compare the blade trailing vortex directly with Vatistas model. The circulatory part of
velocity is not symmetric around the vortex center, because blade vortices have helical-like shape whereas
wing trailing vortices are 2-D. For this reason the tangential velocity in Vatistas formula is presented by
related averaged tangential velocity, expressed by the following equation:
r
rV avg πθ
2
)(Γ=
To generalize the velocity profile, the averaged tangential velocity is presented in dimensionless form. The
tangential velocity is divided by the corresponding peak tangential velocity maxθV and the presented results
vary as a function of dimensionless radius crrr /= . The obtained velocity profiles are presented in Fig. 12
and show a good similitude.
Figure 12: Normalized tangential velocity induced
by the tip vortex Figure 13: Coefficient α in Vatistas vortex model as
a function of vortex age
The value of the coefficient α for tangential velocity equation is found by means of least square method, see
Vatistas (2006), and results are shown in Fig. 13, where we can see the variations of α as a function of vortex
age. Overall, the value of α is lower than 0.75, obtained by Vatistas. Thus, in the case of wind turbine rotor, the turbulence intensity is larger and the tangential velocity decreases slowly when compared to helicopter.
19ème Congrès Français de Mécanique Marseille, 24-28 août 2009
6
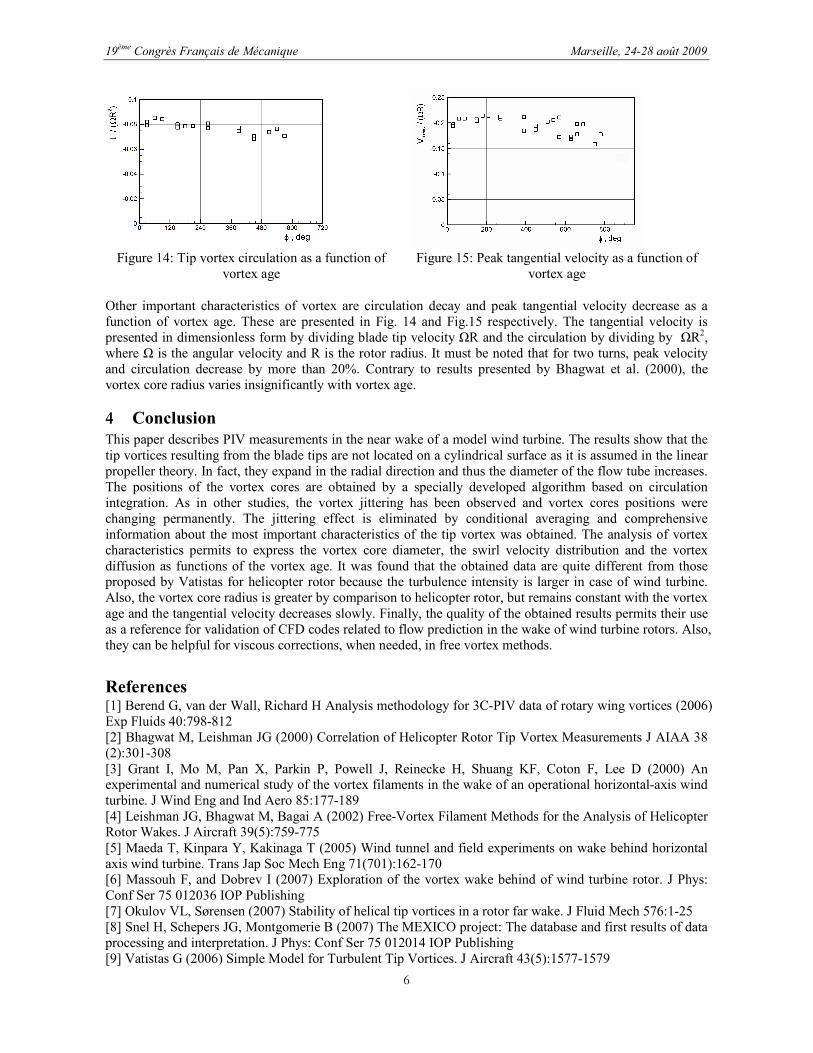
Figure 14: Tip vortex circulation as a function of
vortex age
Figure 15: Peak tangential velocity as a function of
vortex age
Other important characteristics of vortex are circulation decay and peak tangential velocity decrease as a
function of vortex age. These are presented in Fig. 14 and Fig.15 respectively. The tangential velocity is
presented in dimensionless form by dividing blade tip velocity ΩR and the circulation by dividing by ΩR2,
where Ω is the angular velocity and R is the rotor radius. It must be noted that for two turns, peak velocity
and circulation decrease by more than 20%. Contrary to results presented by Bhagwat et al. (2000), the
vortex core radius varies insignificantly with vortex age.
4 Conclusion
This paper describes PIV measurements in the near wake of a model wind turbine. The results show that the
tip vortices resulting from the blade tips are not located on a cylindrical surface as it is assumed in the linear
propeller theory. In fact, they expand in the radial direction and thus the diameter of the flow tube increases.
The positions of the vortex cores are obtained by a specially developed algorithm based on circulation
integration. As in other studies, the vortex jittering has been observed and vortex cores positions were
changing permanently. The jittering effect is eliminated by conditional averaging and comprehensive
information about the most important characteristics of the tip vortex was obtained. The analysis of vortex
characteristics permits to express the vortex core diameter, the swirl velocity distribution and the vortex
diffusion as functions of the vortex age. It was found that the obtained data are quite different from those proposed by Vatistas for helicopter rotor because the turbulence intensity is larger in case of wind turbine.
Also, the vortex core radius is greater by comparison to helicopter rotor, but remains constant with the vortex
age and the tangential velocity decreases slowly. Finally, the quality of the obtained results permits their use
as a reference for validation of CFD codes related to flow prediction in the wake of wind turbine rotors. Also,
they can be helpful for viscous corrections, when needed, in free vortex methods.
References [1] Berend G, van der Wall, Richard H Analysis methodology for 3C-PIV data of rotary wing vortices (2006)
Exp Fluids 40:798-812
[2] Bhagwat M, Leishman JG (2000) Correlation of Helicopter Rotor Tip Vortex Measurements J AIAA 38
(2):301-308
[3] Grant I, Mo M, Pan X, Parkin P, Powell J, Reinecke H, Shuang KF, Coton F, Lee D (2000) An experimental and numerical study of the vortex filaments in the wake of an operational horizontal-axis wind
turbine. J Wind Eng and Ind Aero 85:177-189
[4] Leishman JG, Bhagwat M, Bagai A (2002) Free-Vortex Filament Methods for the Analysis of Helicopter Rotor Wakes. J Aircraft 39(5):759-775
[5] Maeda T, Kinpara Y, Kakinaga T (2005) Wind tunnel and field experiments on wake behind horizontal
axis wind turbine. Trans Jap Soc Mech Eng 71(701):162-170 [6] Massouh F, and Dobrev I (2007) Exploration of the vortex wake behind of wind turbine rotor. J Phys:
Conf Ser 75 012036 IOP Publishing
[7] Okulov VL, Sørensen (2007) Stability of helical tip vortices in a rotor far wake. J Fluid Mech 576:1-25
[8] Snel H, Schepers JG, Montgomerie B (2007) The MEXICO project: The database and first results of data
processing and interpretation. J Phys: Conf Ser 75 012014 IOP Publishing
[9] Vatistas G (2006) Simple Model for Turbulent Tip Vortices. J Aircraft 43(5):1577-1579