voter id requirements and the …...voter id requirements since hava was passed, voter identi cation...
TRANSCRIPT

VOTER ID REQUIREMENTS AND THE DISENFRANCHISEMENTS OFLATINO, BLACK AND ASIAN VOTERS1
September 1, 2007
Matt A. BarretoUniversity of Washington, Seattle
Stephen A. NunoUniversity of California, Irvine
Gabriel R. SanchezUniversity of New Mexico, Albuquerque
Prepared for presentation at:2007 American Political Science Association Annual Conference
1This manuscript is a working draft. Please direct all questions to Matt Barreto at mbarreto–at–washington–dot–edu

Voter ID Requirements1 Introduction
In 2004 Arizona voters approved Proposition 200, which among other things, strictly enforcednew requirements that identification be shown at the polling place before a citizen could vote.Similar laws have since been proposed and passed in many other states, typically related to chargesof vote fraud, and often times tied into the divisive debate regarding undocumented immigrants.Changes like these to electoral laws are central to many long-standing theories in the politicalparticipation literature. However, very little is known about the effects of voter identification (ID)laws. Our manuscript analyzes the impact that new voter identification laws may have on both theparticipation rates of particular segments of the electorate, as well as on election outcomes in theUnited States.
Specifically, through the use of a unique dataset from the 2006 elections, we analyze the impactthat voter identification laws have on immigrant and minority voters in California, New Mexicoand Washington. Exit polls in each state asked voters to check which forms of identification theywould be able to provide if voter ID laws were passed in their state. Controlling for age, income,and education, we find that immigrant and minority voters are significantly less likely to be ableto provide multiple forms of identification, such as a copy of their original birth certificate, or arecent bank statement. In full, we asked respondents about their ability to provide approximatelysix unique forms of identification, and immigrant and minority voters were consistently less likelyto have each form of identification. Because our data reflects the identification trends of actualvoters, not just adult citizens, the findings go far to suggest that voter identification laws couldimmediately disenfranchise many Latino, Asian and African American citizens.
2 Background and Utility of Voter ID Laws
Manufacturing barriers to specific segments of voters is not a new phenomenon in U.S. history.Race, gender and property requirements were part of our nations history with democracy, and bar-riers to voting were slow to change. In 1965, after two centuries of discriminatory voting practices,the Voting Rights Act brought an end to literacy tests, poll taxes, and unreasonable identifica-tion policies. In this paper, we take up the contemporary debate over voter ID laws and examinethe current legislation which is being passed in the name of electoral integrity and deemed non-discriminatory on its face. Before we examine the implications of voter ID requirements on theelectorate, it is necessary to first review the rationale behind such laws, and to assess their currentstatus. If electoral institutions lack public confidence due to widespread voter fraud, implementingnew and strict identification requirements may be warranted to return integrity to the ballot box.However, it is equally important to examine the impact that more rigorous and demanding iden-tification requirements may have on the ordinary voting public that is not engaging in fraud, andhow such requirements may prevent some from voting simply because of the more strict guidelines.
Federal concern over electoral integrity reemerged after the disputed Presidential election in 2000and produced the Help America Vote Act (HAVA) of 2002. HAVA sought to replace punch card
Barreto, Nuno and Sanchez, APSA 2007 1
Voter ID Requirementsvoting systems, assist in the administration of federal elections and to establish minimum electionadministration standards for States and units of local government... in the administration of federalelections (Pub.L.107-252 §208.b.2). Although HAVA requires that identification be used by firsttime voters, identification does not need to contain a photograph.
In the same year that HAVA passed, the U.S. Department of Justice implemented a new programcalled the Ballot Access and Voting Integrity Initiative (BAVII), intended to track cases of voterfraud. With the 2000 election coming down to a handful of votes in Florida and New Mexico, eachand every vote is now taken much more seriously by the candidates, political parties and their teamsof lawyers. Despite new interest in vote fraud, BAVII investigations have been difficult to follow andhave published very little information on their results. From 2002-2005, only 24 cases of fraud weresuccessfully prosecuted. Surprisingly, with so much attention paid to voter fraud by both politi-cal parties, there is no state which compiles or publishes data on voter fraud (Minnite, 2007, pg. 9).
Following HAVA and BAVII, twenty-four states expanded the voter identification laws. Amongthe earliest, voter ID laws were passed by Alabama, Colorado, Montana, North Dakota, SouthDakota in 2003 as HAVA regulations were becoming more clear (See Table 1).
The different types of identification that are acceptable are broad. However, the identification-laws in HAVA are designed for the purpose of establishing that the voter at the polling boothisthe person on the roll. The more stringent laws, such as in Arizona, are meant to establish proofof citizenship at the voting booth regardless of whether or not that person is on the roll. For ex-ample, even though U.S. passports contain a photo of the individual they are not an acceptableform of identification in Arizona by themselves because passports do not include current addresses.Passports are acceptable in most other states, including Georgia because they provide proof ofcitizenship.
Several significant court cases have resulted from the new voter identification laws. The Perdueet al. v. Lake et al., case was based on a woman who was a first time voter who moved to Georgiafrom Florida and was a legal resident who was registered to vote. She claimed that the new lawsviolated Article II §1.2 of the Georgia constitution, guaranteeing every registered voter the rightto vote. Prior to the more stringent laws, voters who could not present one of the seventeen formsof identification were allowed to swear by written oath that they were the person identified on therolls. The suit resulted in a preliminary injunction enjoining the State of Georgia from enforcingthe identification laws prior to the 2006 Congressional election. However, the court has since ruledthat the plaintiff lacked standing because she possessed a state identification card for public trans-portation offered to her pursuant to the American with Disabilities Act. With similar results inArizona, injunctive relief at the federal level was denied by the 9th Circuit Court in Gonzalez v.Yes on Proposition 200, with the district court stating that the appellants failed to prove that therewould be an undue hardship on voters caused by Proposition 200.
Barreto, Nuno and Sanchez, APSA 2007 2

Voter ID RequirementsSince HAVA was passed, voter identification laws have been a source of rancorous political debate
with a prescient understanding by both parties as to who would be affected by these stringent laws.A sponsor of the new Georgia voter identification law, Representative Sue Burmeister, stated that“if there are fewer black voters because of this bill, it will only be because there is less opportunityfor fraud” (Perdue et al. v. Lake et al). When injunctive relief was denied in Gonzalez v. Yes onProposition 200 the headline from the Arizona Secretary of States press release read, “Sec. of StateBrewer Gets ID at Polls Reinstated: Voters Prevail in Having ID at Polls and Proof of CitizenshipUpheld”.
Yet concern over fraud for the Republican Party in Georgia, and by the Republican Party ingeneral, fails to extend to absentee voters. Georgia Republicans intentionally left out the morestringent identification requirements for absentee voters, residents who are more likely to be estab-lished voters. The elections code states that the application for absentee voters “shall be in writingand shall contain sufficient information for proper identification of the elector” (O.C.G.A §21-2-381), whereas an in-person voter needs to provide photo-identification (O.C.G.A. §21-2-417(c)). Inthe U.S. Senate Republican Policy Committee executive summary, Republicans recommend thatthe “plague” of election fraud be addressed with a policy of requiring photo identification for voterswho show up at the polling booth, but extending these policies to absentee voters should awaitfurther examination.2 While there are a broad number of acceptable IDs, either alone or in con-junction with another form of identification, the difference in barriers between established andnon-established voters is quite striking.
We argue that barriers to voting affect voters disproportionately across various demographic andpartisan characteristics. Further, increased barriers to voting could have an important impact onelections in states with a high number of new voters, such as those with a high number of immigrantvoters, or states with demographics that are disproportionately affected by more stringent votinglaws. The elusiveness of hard evidence that voter fraud is rampant, however, has not prevented itfrom developing into an important political issue, and as both parties examine the effects of variousvoter laws, battle lines are being drawn in a highly charged battlefield of unsubstantiated rhetoric.
The strongest argument among proponents of these changes to election laws is that more strin-gent voting procedures will strengthen voting officials ability to prevent voter fraud. Over the pastfew years there has been a growing concern among government officials and political pundits thatvoter fraud is rampant and is threatening the integrity of U.S. elections. For example, a 2005 U.S.Senate policy committee report claimed that voter fraud continues to plague our nations federalelections, diluting and canceling out the lawful votes of the vast majority of Americans.3 Those infavor of tighter regulation of the electoral process contend that this effort will decrease voter fraudand improve the electorates trust and confidence in the system. Although very salient recently, thisargument is nothing new. In the late 1890s as the demographics of the electorate rapidly changed,
2U.S. Senate Republican Policy Committee, “Putting an end to Voter Fraud,”(February 15, 2005)3U.S. Senate Republican Policy Committee, Putting an end to Voter Fraud, (February 15, 2005)
Barreto, Nuno and Sanchez, APSA 2007 3

Voter ID Requirementsseeing an increase in immigrant and working class voters, elites pushed for personal voter registra-tion systems based on the argument that these changes would prevent voter fraud and protect thesystem (Piven and Cloward, 2000). However, attempts to quantify voter fraud in U.S. electionswith objective evidence and scientific methods has indicated that voter fraud and corruption arenot rampant, but instead rare and isolated.
Assessing the prevalence of voter fraud is daunting due to the lack of official federal or even statelevel statistics on voter fraud.4 A recent Project Vote report however provides a comprehensivereview of extant data and concludes that all available evidence suggests voters rarely commit voterfraud in the United States (Minnite, 2007). In 2002 the U.S. Department of Justice began BAVIIto investigate voter fraud and prosecute offenders. However, government records show that only 24people have been convicted or have pleaded guilty to illegal voting between 2002 and 2005 nationally(Minnite, 2007). At the state level, reviews of newspaper coverage, court proceedings, and inter-views indicate that voter fraud in state elections is also negligible (Minnite and Callahan, 2003).This is exasperated by evidence uncovered by reviewing hundreds of media reports on voter fraudthat many voting fraud allegations are false claims made by losers of close elections (Minnite, 2007).At the end of the day, scholars have had a hard time finding examples of verified voting fraud cases.
Despite the clear lack of convincing evidence to support the claim that voting fraud is occurringat rates high enough to dilute “the lawful votes of the vast majority of Americans”, it appearsas though voter fraud exemplifies the notion of perception being reality. Recent public opinionpolls have indicated that a large segment of the American population believes that voting fraud isprevalent, and lacks confidence in our election systems. Specifically, a Rasmussen Report poll foundthat 58 percent of Americans believed that there was a lot or some fraud in American elections,while 67 percent of respondents to a 2000 Gallup poll had only some or very little confidence inthe way votes are cast and counted in our county (Wang, 2006). Therefore, regardless of concreteevidence, it appears as though public opinion will continue to support efforts to tighten electionlaws, including the implementation of photo or multiple forms of identification at the polls. How-ever, strategies to implement greater regulation of the voting process may negatively impact theparticipation levels of large segments of the American electorate. Although very little researchexists on voter ID laws, there is a preponderance of scholarship on electoral rules, institutionalregulations, and voter participation from which we draw.
3 The Impact of Electoral Rules on the Electorate (Theory andHypotheses)
The notion of voter registration developed in the nineteenth century with the objective of con-trolling election fraud by preventing people from voting more than once or voting outside of theirjurisdiction of residence (King 1994). Although the ability of registration to prevent fraud is debat-able, scholars have found evidence that registration requirements limit citizen participation in the
4U.S. Senate Republican Policy Committee, Putting an end to Voter Fraud, (February 15, 2005
Barreto, Nuno and Sanchez, APSA 2007 4

Voter ID Requirementselectoral process (Harris 1929; Merriam and Gosnell 1924; Piven and Cloward 2000; King 1994). Forexample, the move to personal voter registration systems in the late 1890s effectively de-mobilizedthe poor and working classes (Piven and Cloward 2000). While many legal requirements for reg-istration such as poll taxes, literacy tests, and grandfather clauses have been removed by case law- Smith vs. Allright (which eliminated white primaries) - or constitutional amendments, severalrestrictive registration regulations remain in place in many states, including early closing dates forregistration, purging of registration rolls, and the limiting of voter registration to specific times andplaces (King 1994).
There have been several studies interested in the relationship between voter registration laws andvoter turnout. The rational choice model of Anthony Downs has provided a theoretical frameworkto evaluate the effect of registration laws on voter turnout. Derived from economics, Downs theoryis based upon the ideal that every rational man decides whether to vote just as he makes all otherdecisions: if the returns outweigh the costs, he votes; if not, he abstains (Downs 1957: 60). Theregistration process is one of the largest sources of cost to rational minded voters. Therefore, themore permissive registration laws are, the lower the time, energy, and informational costs of voting(Wolfinger and Rosenstone 1980). Attempts to analyze the impact of restrictive laws on voterregistration have consistently concluded that turnout rates are higher when costs associated withregistration are low (Campbell et al. 1960; Wolfinger and Rosenstone 1980; Katosh and Traugott1982; Jackson 1993; Blank 1974; Kim, Perocik and Enokson 1975; Bauer 1990).
The relationship between voting requirements and turnout becomes more complex with the recog-nition that political resources play a major role in determining political participation rates. Ac-cording to the Civic Volunteerism model of participation (Verba, Schlozman and Brady 1995),individuals with greater resources, skills, and political orientations are more likely to participate inpolitical activities like voting. This perspective suggests that voting may be less costly for thosewith greater levels of political resources such as money, time, English language abilities and educa-tion. Therefore, any increases in costs associated with voting should have the greatest impact onthose with the fewest political resources racial and ethnic minorities, the less educated, immigrants,and the less affluent to name a few.
Research in this area has supported the notion that changes to election rules and procedureshave a disproportionate impact on the electorate. For example, some have argued that registra-tion laws are the primary source of socioeconomic differences in voting rates among Americans(Powell 1986; Piven and Cloward 1988; Cunningham 1991). According to Cunningham (1991),race and class disparities in rates of voter registration in this country are not inevitable. Rather,they are the product of historical and continuing racial and socioeconomic bias in the operation ofour registration laws (1991: 372). The implementation of the poll tax and literacy tests are themost direct examples of how voting procedures can disproportionately impact the electorate. Bycomparing turnout rates with and without these obstacles, it is clear that literacy tests and polltaxes decreased turnout overall in the South (Rusk 1974). However, these factors disproportion-ately impacted Black voters. Similarly, state registration laws (early registration deadlines, limited
Barreto, Nuno and Sanchez, APSA 2007 5

Voter ID Requirementsregistration office hours) decreased turnout in the 1972 election by about nine percentage points.The impact of these laws was heaviest in the South among the less educated and among AfricanAmericans (Rosenstone and Wolfinger 1978).
Scholars have also found that minority participation increases when revisions are made that re-duce the costs associated with voting. The most prominent example of this trend was the removalof discriminatory voter registration laws directed toward African Americans with the implementa-tion of the Voting Rights Act of 1965. Rosenstone and Hansen (1993) estimate that the AfricanAmerican turnout increased by nearly 16% as a result of the combined impact of the elimination oflegal barriers that had been used to exclude Blacks from the political process (poll taxes, literacytests, move to permanent registration systems). More recently, the National Voter RegistrationAct (NVRA) of 1993 was designed to reduce the cost of voting by incorporating registration witha public agency that potential voters would utilize for other purposes. As part of the NVRA,citizens were offered the opportunity to become registered while at any state office that providedpublic assistance. This program seemed to have effectively increased registration for minorities byreducing the cost of voting, as 7% of Blacks and 6% of Latinos registered in public assistance officesprior to the 1996 election, compared to only 3% of Whites (Wolfinger 2001).
The extant literature clearly indicates that when changes are made to electoral rules, includingregistration requirements, turnout is affected significantly. In short, when costs associated withvoting are reduced turnout increases, when costs are increased turnout decreases. Further, due tovarying levels of political resources (time, money, political sophistication etc.) the impact of thesechanges is typically most pronounced on specific segments of the electorate, including; racial andethnic minorities, immigrants, and those with less educational attainment and lower incomes. Thistrend motivates the following hypothesis;
Disproportionate Impact Hypothesis:
H1: Racial and ethnic minorities (Latinos, African Americans, Asians, foreign-born)are significantly less likely to have various forms of voter identification.
H2: Those with lower socioeconomic levels (education, income) are significantly lesslikely to have various forms of voter identification.
4 Voter ID Laws on Election Outcomes
It is well established that partisanship is a valuable psychological tool that helps people under-stand a complex political system and to make political decisions. Parties help reduce informationcosts by providing cues to voters regarding candidates and policy issues, and partisanship hasbeen identified as the dominant factor impacting vote choice (Campbell et. al. 1960). Therefore,identifying the party identification among segments of the electorate can tremendously aid in theprediction of how these communities will vote in future elections. This information can then be
Barreto, Nuno and Sanchez, APSA 2007 6

Voter ID Requirementsused to help predict if voter photographic identifications impact on the electorate can have elec-toral consequences.
Generally speaking, racial and ethnic minorities in the U.S. tend to identify with the Demo-cratic Party in large numbers. This attachment to the Democratic Party is most prevalent amongAfrican Americans, who consistently exhibit near monolithic support for the Party and its candi-dates (Dawson 1994; Tate 1993). Similarly, Latinos - particularly Mexican Americans and PuertoRicans have also consistently identified with the Democratic Party (de la Garza and Brischetto1983; Uhlaner and Garcia 1998; Hero et. al 2000).5 Other minority populations, including Asianand Native Americans also tend to be more Democratic in their political behavior (Cain, Kiewietand Uhlaner 1991; Lien et. al. 2001; MacPherson 2004). Finally, socioeconomic factors such asincome and education impact party identification and voting behavior, with those with lower edu-cational attainment and incomes being more likely to be Democrat (Stonecash et al. 2000; Siegeland Hodge 1968; Cassel 1982).
In short, Democratic Party attachment is greatest among those segments of the electorate whoare most likely to be negatively impacted by increased standards in voter identification laws. As aresult, it is likely that changes to voter identification laws will impact political outcomes, especiallyin the most competitive districts and states. The Democratic Party is likely to lose votes in stateswhere strict identification laws are enacted. A story in the Washington Post noted the partisanimplications during the 2006 election: Republicans and their allies assert that the identificationrequirements and other rules will lessen voting fraud. Democrats and their supporters contend thechanges are ploys to suppress voting among poor, elderly, minority and disabled citizens, who areprone to support Democratic candidates (Goldstein 2006). Rather than asserting or contending,this research is one of the first to empirically test the relationship;
Election Outcome Hypothesis:
H3: Voters with less access to multiple forms of identification are significantly morelikely to vote Democrat.
5 Data and Methods
To assess the impact that strict voter identification regulations would have on participation ratesby race and class, and the resulting influence on electoral outcomes we rely on a unique exit poll ofelection day voters during the November 2006 election. The exit poll was implemented in Califor-nia, New Mexico and Washington state and contained questions about which form of identificationvoters could readily provide, or had access to. Because the survey was an exit poll among actualvoters, we should anticipate that resources and access to identification would be relatively high,especially as compared to the eligible non-voting population. All participants in the survey havealready gone through the process in their respective state to register to vote, and now, interviewing
5We note however that scholars have consistently found that Cuban Americans identify and vote as Republican.
Barreto, Nuno and Sanchez, APSA 2007 7
Voter ID Requirementsthem on election day, by definition they are among the small minority that votes in a midtermelection. This is all to say, that the deck is stacked against us. If we find statistically significantdifferences in access to forms of voter identification, we can be certain that those differences are real.
Further, the three states in which the exit poll was conducted have somewhat lax voter identifi-cation regulations, or do not strictly enforce those standards1. This is an ideal environment to testthe possible disenfranchising effects of voter identification laws, because in most cases, the voter (orpotential voter) experiences a change from few requirements to significant ID requirements. Hadwe conducted the exit poll in Arizona or Indiana, states that already have quite strict requirements,our entire sample would be biased in favor of having the appropriate identification, or else theywould not have been allowed to vote (and therefore not in our sample). Thus, the best way toapproximate the impact of stricter voter identification laws is to examine states with relatively fewrequirements such as California, New Mexico and Washington.
The exit poll surveys were administered throughout the day from the time the polls opened untilthey closed, so that all voters had an equal chance to be interviewed. Voters were randomly selectedto participate, using a traditional exit poll skip pattern, and filled out a self-administered surveythat was available in multiple languages. In full, 4,346 interviews were collected across the threestates.
In addition to questions about their vote preference, most important issue, and other standardpolitical questions, voters were asked to select which forms of identification they would be able toprovide the next time they voted, if their state were to ask for identification before they could vote.Respondents could check a box yes or no for whether they had each of the following types ofidentification: state drivers license, U.S. passport, bank statement, original birth certificate, utilitybill, state ID card, naturalization card, or property tax statement. This list was selected basedon the valid forms of voter identification under current regulations in states such as Arizona andGeorgia.
To examine access to each form of identification, we model six dichotomous probit regressions forsix of the eight forms of identification in which all voters may have access (naturalization card andstate ID card were not considered in this first set of models). Next, we created a variable calledlicense plus 1 which closely resembles many of the proposed voter identification requirements beingconsidered in the fifty states. This variable takes on a value of 1 only if the respondent has accessto a drivers license (or state ID card), and at least one additional form of identification. If the voteronly had a license, or only a passport, the value is a zero. Finally, we create a six-item index of theitems above (substituting state ID card if the voter has no drivers license, and including natural-ization card only for immigrants). The index has a Cronbach alpha reliability coefficient of .7937,and ranges from 0 to 6. Because the index is a count of the total pieces of identification the voterhas access to, we rely on poisson regression to estimate the relationship (Cameron and Trivedi 1998).
Barreto, Nuno and Sanchez, APSA 2007 8

Voter ID RequirementsAfter presenting the results for access to voter identification, and the potential for voter dis-
enfranchisement, we want to know whether electoral outcomes might change under more strictregulations. In the final set of models, the dependent variable is vote choice in the recent 2006midterm election. While the candidates differed in three states, the choices are relatively similarand we create a variable called Vote GOP which is set to 1 if the respondent voted for the Re-publican candidate for US Senate or House, and 0 if they voted for the Democratic candidate.During the vote choice analysis 378 voters who declined to state their preference, or who supporteda third-party candidate were dropped from this analysis, leaving us with a sample of 3,800 for thevote choice models.
Our main independent variables are individual level demographics, that may correlate with bothaccess to voter identification, and also vote choice. These variables are coded in a traditional man-ner and an appendix provides full detail for each independent variable.
6 The Findings
Depending on how voter identification laws are implemented, a substantial amount of currentvoters could be disenfranchised. While 88% of the sample stated they did have a valid state driverslicense, only 56% stated that they had a drivers license and at least one additional form of identi-fication. Further, access to identification varied considerably by race, class and immigrant status.Table 2 presents bivariate correlation statistics for several demographic variable of interest andaccess to a valid form of identification. Table 3 presents the regression results predicting accessto each of the six types of identification a voter may be asked for. In addition, we present resultsfor the two combined ID measures, license plus 1 and the 6-item index. To estimate the degree towhich a voter of a certain demographic group was more or less likely to have the form of ID, wetransformed the coefficients into predicted probabilities, which can be found in Table 4.
[ Tables 2, 3 and 4 about here ]
6.1 Bivariate Results
The first state in our analysis is a brief bivariate investigation of the relationships between someof our key independent variables and access to a drivers license. As Table 2 indicates, race impactsaccess to a drivers license, as white voters are approximately 10% more likely to have this primaryform of valid identification than non-whites. In addition to racial and ethnic minorities, foreign-born voters are also less likely to have a drivers license. There also appears to be a socioeconomicbias associated with having a drivers license, as those with higher educations and incomes are morelikely to have this specific form of valid identification. Finally, older voters are less likely to have adrivers license. So overall, our bivariate results indicate that individuals who are racial and ethnicminorities, foreign-born, of a lower socioeconomic status, and are older all are less likely to have adrivers license. This is critical to our discussion, as a drivers license is the primary valid form ofidentification accepted for voting purposes. The next stage of our analysis will determine if these
Barreto, Nuno and Sanchez, APSA 2007 9

Voter ID Requirementsfactors continue to be relevant when accounted for in a multivariate context.
6.2 Race and Immigrat Status
For five out of six types of voter identification, Latinos, Asians, Blacks and immigrants werestatistically less likely to have access to ID, as compared to Whites and the native born (see Table3). In the two combined measures, minorities and immigrants were again significantly less likely tohave multiple forms of the acceptable identification. While Latinos and Blacks were not less likelyto have a state drivers license, Latinos, Blacks, Asians and immigrants were all significantly lesslikely to have at least a drivers license and one additional form of identification. The changes inpredicted probability reported in Table 4 suggest that these differences were profound. Asians andBlacks were over 20% less likely to have a driver’s license plus another form of identification, ascompared to Whites, while Latinos were 13% less likely. Immigrants were about 6.5% less likely tobe able to provide two forms of ID compared to native born.
Further, considerable group differences exist even for forms of identification that might be con-sidered very basic or accessible. With regard to a recent bank statement, Asians were almost 24%less likely to have access, Blacks about 17% less likely, Latinos 15% less likely, and immigrants 7%less likely. Similarly, Blacks were 20% less likely to have access to a recent utility bill that wouldcontain their name and current address, while Asians were 18% less likely, Latinos 14% less likelyand immigrants 10% less likely to be able to present a utility bill. Although these two forms ofidentification are often cited as easily accessible, our findings demonstrate clearly that racial andethnic minorities do not have access to the same types of identification as Whites. Our findings aresupported by extant research in the fields of economics and sociology, where scholars have foundthat minorities and immigrants have much lower rates of access to bank checking and credit ac-counts (Hogarth et. al. 2003; Rhine and Toussaint 1999). Further, minorities are less likely to owntheir home, and therefore may not have a full range of utility bills in their name (Flippen 2001).Or in the case of multiple family households, the bills may be in the sole name of the male headof household, leaving three other adults in the household without proof of their residency in thathousehold, at least by way of utility bill (Angel and Tienda 1982; Glick et. al. 1997). It is clearthat imposing stricter voter identification requirements would disproportionately impact Latino,Black, Asian and immigrant voters.
6.3 Socioeconomic status and Age
In addition to race, the main social cleavage in the United States continues to be social class, andour results suggest that class is a major factor related to voter identification laws. Having higherlevels of education and income make a voter statistically more likely to have valid forms identifi-cation (see Table 2 and Table 3). More educated voters were significantly more likely to have fiveof the six types of identification (no effect for birth certificate). Likewise, higher income voterswere significantly more likely to have five of the six types of identification (no effect for utility bill).In the two combined dependent variable models, income and education demonstrate an importantrole with low-income voters about 8% less likely to have two forms of identification, and the least
Barreto, Nuno and Sanchez, APSA 2007 10

Voter ID Requirementseducated voters 18% less likely (see Table 3).
It is important to note that the results for race and class are consistent even as both sets ofindependent variables are introduced to the model. Because of the well documented correlationbetween race and class, this is often not the case. While race may show significant effects in amodel by itself, those effects may evaporate once class is controlled for, or vice versa. Here, wedemonstrate that minorities, across income groups, are less likely to have access to identification.Similarly, it can be stated that low-income, low-education voters, minority and White alike, arestatistically less likely to have multiple forms of voter identification.
The final demographic group we are interested in examining is the elderly. During the debateon voter identification laws, advocacy groups such as the AARP stated that elderly voters wouldface undue discrimination if voter identification laws were put in place. Our results only partiallysupport this claim. Voters over the age of 65 were less likely to have access to a drivers license (thesource of contention in Georgia see Goodman 2006), and also less likely to be able to provide autility bill. Specifically, elderly voters were 8% less likely to have a drivers license and 6% less likelyto have a utility bill, both of which could lead to lower rates of participation among voters over65. However, there was no statistical difference with respect to birth certificate, bank statement,passport, or property tax for elderly voters. Further, we find no statistically significant differencesby age in our two combined measures.
7 Voter ID Requirements and Electoral Outcomes
To this point, the findings provide strong evidence that a large number of voters could be disen-franchised with the passage and enforcement of stricter voter identification laws. From a democraticstandpoint, new barriers to voting raise many concerns. However, it is unclear whether or not vot-ers with access to identification vote differently than those without. Given the results above withrespect to race, income, and education we suspect partisan differences exist as well. To test thepremise that voters with less access to multiple forms of ID are more likely to vote Democrat, wemodeled vote choice in the November 2006 election. While a very strong bivariate relationshipexists between having access to ID and voting Republican, it is important to ensure that this isnot an artifact of race or income, thus we present a multivariate analysis, controlling for the bestknown predictors of vote choice: partisanship, race, income and a host of other factors.
[ Table 5 about here ]
As indicated in Table 5, after controlling for partisanship, race, and income, we find that voterswith more access to identification are more likely to vote Republican. This suggests, at least inour sample, that strict voter ID regulations would eliminate more Democratic than Republicanvotes from the final tally. The changes in predicted probability, reported along with the probitcoefficients, suggest that voters with access to multiple forms of ID who would remain largely unaf-fected by strict ID laws are between 3% – 5% more likely to vote Republican. In jurisdictions with
Barreto, Nuno and Sanchez, APSA 2007 11

Voter ID Requirementscompetitive elections and close outcomes, this could easily change the final vote results in favor ofRepublican candidates.
For example, among the 32 House seats that changed hands from Republican to Democrat con-trol in 2006, our data suggest that 12 of these outcomes would have been reversed under strictvoter ID regimes, with an additional 6 elections being too close to call and headed for recounts.In addition, Democratic victories in the U.S. Senate in Montana, Virginia and Missouri wouldhave been reversed. The political context therefore becomes extremely important to note whendiscussing our findings here. Table 6 lists the most competitive races in the House of Representa-tives going into the 2006 Congressional Elections, including the thirty seats that were picked upby House Democrats. The electoral results show that forty elections were won within a 7% marginof victory. More than a third, or fifteen, of these contests ultimately switched from a Republicanto a Democrat seat. In total more than half of these closely contested districts, twenty-three inall, were in states with election laws that were extended beyond HAVA requirements in 2003 and2005, and fifteen of those twenty-three seats switched from Republican to Democrat in the 2006election. It is also important to note that each of the states requiring photo identification are inheavily competitive presidential elections with a substantial number of minority and immigrantvoters, such as Ohio, Florida, Arizona, Georgia and Louisiana.
[Table 6 about here]
8 Discussion and Conclusions
We began with a discussion on the utility of voter identification laws and the lack of empiricalevidence to justify the social cost to our democratic system that would result from creating higherbarriers to voter participation. Several states have recently enacted new laws that require citizensto provide photo identification, or multiple forms of identification to be shown at the polling placebefore being able to vote. Despite the growing discussion of whether or not these laws decreasevoter fraud, surprisingly little is known about the effects of voter identification ID laws. We in-tended to shed some light on this issue by analyzing the impact that new voter identification lawsmay have on both the participation rates of particular segments of the electorate, as well as onelection outcomes in the United States. Our results clearly suggest that voting laws which requirespecific or multiple forms of identification will disproportionately impact racial and ethnic minori-ties, immigrant populations, and those with lower incomes. These results are compelling due tothe nature of our data and the established literature on the impact increased costs has on voterturnout. Because we analyze the impact of these laws on voters from the 2006 Election, our resultsprovide a clear diagnosis of how voter ID laws will impact voter turnout even among the mostactive participants in our political system.
With the inability of scholars or political pundits to provide clear evidence that these laws de-crease vote fraud, we should be very concerned with the potential negative impact these laws willhave on the electorate. Further, our results suggest that the implementation of voter ID laws could
Barreto, Nuno and Sanchez, APSA 2007 12

Voter ID Requirementshave major implications to party politics. We find compelling evidence that those less likely tohave access to multiple forms of identification are disproportionately Democrat. To determine thepossible electoral consequences of this trend, we isolate the congressional districts that moved fromRepublican to Democratic control in addition to the tightest races in 2006. Our results suggestthat seats that were picked up by Democrats, as well as other tight races, could have been sub-stantially impacted by more stringent voter ID laws. The use of common sense mechanisms tosecure the democratic process is necessary, but without an established record of widespread voterfraud to justify the suppressive impact we know to exist as a result of increased voting barriers, weencourage a greater examination into secure but non-discriminatory voting procedures.
Barreto, Nuno and Sanchez, APSA 2007 13

Voter ID RequirementsReferences
Angel, Ronald and Marta Tienda. 1982. “Determinants of Extended Household Structure:Cultural Pattern or Economic Need?” American Journal of Sociology. 87(6): 1360–83.
Bauer, John R.. 1990. “Patterns of Voter Turnout in the American States.” Social ScienceQuarterly, 71: 824–834.
Blank, Robert H. 1974. “Socio-Economic Determinism of Voting Tumout: A Challenge.” Jour-nal of Politics, 36: 731–752;
Cain, Bruce E., D. Roderick Kiewiet, and Carole J. Uhlaner. 1991. “The Acquisition of Parti-sanship by Latinos and Asian Americans. American Journal of Political Science 35(2):390-422.
Campbell, Angus, Converse, Philip E., Miller, Warren E., and Stokes, Donald E. (1960). TheAmerican Voter. Chicago: University of Chicago Press.
Cameron, A. Colin and Pravin Trivedi. 1998. Regression Analysis of Count Data. EconometricSociety Monograph No. 30. Cambridge: Cambridge University Press.
Cassel, Carol A. 1982. “Predicting Party Identification, 1956–80: Who Are the Republicansand Who are the Democrats?” Political Behavior 4: 265–81.
Cunningham, Dayna L. 1991. “Who Are to be the Electors? A Reflection on the History ofVoter Registration in the United States.” Yale Law and Policy Review 9:370–404.
Dawson, Michael C. 1994. Behind the Mule: Race and Class in African-American Politics.Princeton, NJ: Princeton University Press.
de la Garza and Brischetto 1983
Downs, Anthony, 1957: An Economic Theory of Democracy. New York: Harper & Row.
Flippen, C.A. 2001. “Residential Segregation and Minority Home Ownership.” Social ScienceResearch. 30 (Sept): 337-362.
Glick, Jennifer, Frank Bean, Jennifer Van Hook. 1997. “Immigration and Changing Patternsof Extended Family Household Structure in the United States: 1970-1990.” Journal of Marriageand the Family. 59(Feb): 177–191.
Goldstein, Amy. 2006. “Democrats Predict Voter ID Problems.” Washington Post. Nov 3.
Goodman, Brenda. 2006. “Judge Blocks Requirement in Georgia for Voter ID.” New YorkTimes. July 8.
Barreto, Nuno and Sanchez, APSA 2007 14

Voter ID RequirementsHarris, Joseph. 1929. The Registration of voters in the U.S. Baltimore: The lord Baltimore
Press.
Hero, Rodney, F. Chris Garcia, John Garcia, and Harry Pachon. 2000. “Latino Participation,Partisanship, and Office Holding.” PS: Political Science & Politics 33(3):529-34.
Hogarth, Jeanne, Christoslav Anguelov, and Jinhook Lee. 2003. “Who Has a Bank Account?Exploring Changes Over Time, 1989-2001.” Journal of Family and Economic Issues. 26(Spring):7–31.
Jackson, Robert A. 1993. “Voter Mobilization in the 1986 Midterm Election.” Journal of Pol-itics, 55 :1081–1099.
Katosh, John P., and Traugott, Michael W. (1982). “Costs and values in the calculus of voting.”American Journal of Political Science 26: 361.
Kim, Jae-On, Petrocik, John R., and Enokson, Stephen N. (1975). “Voter turnout among theAmerican states: Systemic and indibidual components.” American Political Science Review 69:107–131.
King, James. 1994. “Political Culture, Registration Laws, and Voter Turnout among the Amer-ican States.” Publius, 24 (4): 115–127.
Lien, P. T., Collet, C.,Wong, J., Ramakrishnan, K. (2001). “Asian Pacific American politicssymposium: Public opinion and political participation.” PS:Political Science & Politics, 34, 625–630.
MacPherson, Karen. 2004. American Indians flex political muscle. Pittsburgh Post–Gazette.Feb 1.
Merriam, C., and H. Gosnell (1924). Non-Voting: Causes and Methods of Control. Chicago:Chicago University Press.
Minnite, Lorraine. 2007. “The Politics of Voter Fraud.” A Project Vote Report, March 5, 2007.Report available at; http://projectvote.org/publications/reports-guides.html
Minnite, Lori and David Callahan. 2003. Securing the vote: an analysis of Election Fraud.New York: de–mos: network for ideas and Action.
Piven, Frances Fox, and Cloward, Richard A. (1988). Why Americans Don’t Vote. New York:Pantheon Books. CALLED 1989 in text check on this.
Piven, Frances Fox, and Richard A. Cloward. 2000. Why Americans still don’t vote : and whypoliticians want it that way. Boston, MA: Beacon Press.
Powell, 6. Bingham, Jr. (1986). “American voter turnout in comparative perspective.” Amer-ican Political Science Review 80: 17–43.
Barreto, Nuno and Sanchez, APSA 2007 15

Voter ID Requirements
Rhine, S. and M. Toussaint. 1999. “The use of formal and informal financial markets amongblack households.” Consumer Interest Annual, 45: 146–151.
Rosenstone, Steven J., and Hansen, John Mark. (1993). Mobilization, Participation, and Der-rrocrucy in America. New York: Macmillan Publishing.
Rosenstone, Steven and Raymond Wolfinger. 1978. “The Effect of Registration on VoterTurnot.” The American Political Science Review, 72 (1), 22–45.
Rusk, Jerrold. 1974. “Comment: The American Electoral Universe: Speculation and Evi-dence.” American Political Science Review 68: 102849.
Siegel, Paul M., and Robert W. Hodge (1968). “A Causal Approach to the Study of Measure-ment Error.” In Hubert M. Blalock, Jr., and Ann B. Blalock (eds.),Methodology in Social Research.New York: McGraw-Hill.
Stonecash, Jeffrey M., Brewer, Mark D., McGuire, Mary P., Petersen, R. Eric, and Way, LoriBeth (2000). “The survival of Democrats: secular realignment outside the South.” Political Re-search Quarterly 53: 731–752.
Tate, Katherin.1993. From Protest to Politics: The New Black Voters in American Elections.New York: Russell Sage Foundation.
Uhlaner, Carole Jean, and F. Chris Garcia. 1998. “Foundations of Latino Party Identification:Learning, Ethnicity, and Demographic Factors among Mexicans, Puerto Ricans, Cubans, and An-glos in the United States.” Irvine, CA: Center for the Study of Democracy, Research MonographSeries.
Verba, Sidney, Kay Schlozman, and Henry Brady. 1995. Voice and Equality: Civic Voluntarismin American Politics. Cambridge, MA: Harvard University Press.
Wang, Tova Andrea. 2006. “Voter Fraud: A Deafening Silence.” An Ascribe Report, December5, 2006.
Wolfinger, Raymond, and Jonathan Hoffman. 2001. “Registering and Voting with MotorVoter.” PS Political Science and Politics, 34 (1), 85–92.
Wolfinger, Raymond E., and Rosenstone, Steven J. (1980). Who Votes? New Haven, CT: YaleUniversity Press.
Barreto, Nuno and Sanchez, APSA 2007 16

Tables
Table 1: Photo ID Laws Among States with Voter ID LawsStates That Request Photo ID at Polls
ArizonaFloridaHawaiiIndiana
LouisianaOhioSouth DakotaGeorgia1
States that Require ID (photo not required)
AlabamaAlaskaArkansasColoradoConnecticutDelawareKentuckyMissouri
MontanaNew MexicoNorth DakotaSouth CarolinaTennesseeTexasVirginiaWashington
Source: National Conference of State Legislatures, 2007
Table 2: Bivariate Relationship Between Demographic Factors and Access to LicenseVariable Coefficient % Change in Predicted ProbabiltyRace – White .510*** .098Nativity -.392*** -.081Income .194*** .035Education .194*** .035Age -.083*** -.015
1 Georgia’s law requiring photo identification has been upheld, but is still meeting heavy legal resistence.
Barreto, Nuño, Sanchez APSA 2007 17
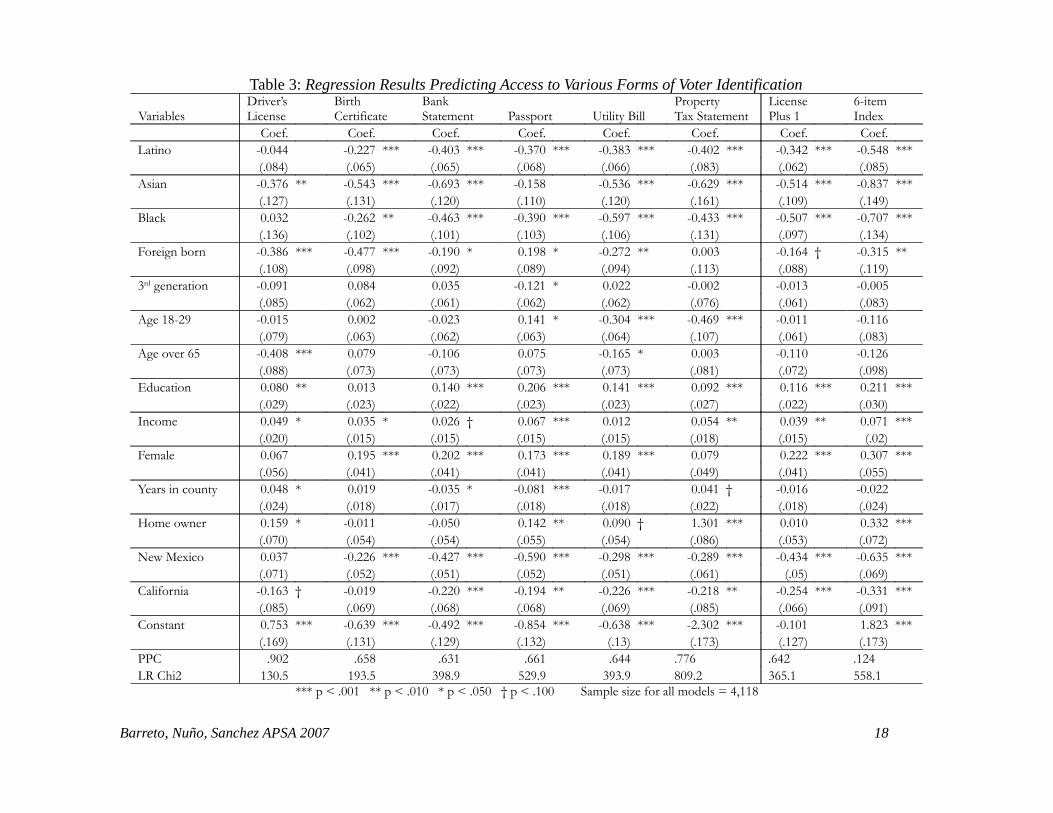
Table 3: Regression Results Predicting Access to Various Forms of Voter Identification
VariablesDriver’sLicense
BirthCertificate
BankStatement Passport Utility Bill
Property Tax Statement
License Plus 1
6-item Index
Coef. Coef. Coef. Coef. Coef. Coef. Coef. Coef.Latino -0.044 -0.227 *** -0.403 *** -0.370 *** -0.383 *** -0.402 *** -0.342 *** -0.548 ***
(.084) (.065) (.065) (.068) (.066) (.083) (.062) (.085)Asian -0.376 ** -0.543 *** -0.693 *** -0.158 -0.536 *** -0.629 *** -0.514 *** -0.837 ***
(.127) (.131) (.120) (.110) (.120) (.161) (.109) (.149)Black 0.032 -0.262 ** -0.463 *** -0.390 *** -0.597 *** -0.433 *** -0.507 *** -0.707 ***
(.136) (.102) (.101) (.103) (.106) (.131) (.097) (.134)Foreign born -0.386 *** -0.477 *** -0.190 * 0.198 * -0.272 ** 0.003 -0.164 † -0.315 **
(.108) (.098) (.092) (.089) (.094) (.113) (.088) (.119)3rd generation -0.091 0.084 0.035 -0.121 * 0.022 -0.002 -0.013 -0.005
(.085) (.062) (.061) (.062) (.062) (.076) (.061) (.083)Age 18-29 -0.015 0.002 -0.023 0.141 * -0.304 *** -0.469 *** -0.011 -0.116
(.079) (.063) (.062) (.063) (.064) (.107) (.061) (.083)Age over 65 -0.408 *** 0.079 -0.106 0.075 -0.165 * 0.003 -0.110 -0.126
(.088) (.073) (.073) (.073) (.073) (.081) (.072) (.098)Education 0.080 ** 0.013 0.140 *** 0.206 *** 0.141 *** 0.092 *** 0.116 *** 0.211 ***
(.029) (.023) (.022) (.023) (.023) (.027) (.022) (.030)Income 0.049 * 0.035 * 0.026 † 0.067 *** 0.012 0.054 ** 0.039 ** 0.071 ***
(.020) (.015) (.015) (.015) (.015) (.018) (.015) (.02)Female 0.067 0.195 *** 0.202 *** 0.173 *** 0.189 *** 0.079 0.222 *** 0.307 ***
(.056) (.041) (.041) (.041) (.041) (.049) (.041) (.055)Years in county 0.048 * 0.019 -0.035 * -0.081 *** -0.017 0.041 † -0.016 -0.022
(.024) (.018) (.017) (.018) (.018) (.022) (.018) (.024)Home owner 0.159 * -0.011 -0.050 0.142 ** 0.090 † 1.301 *** 0.010 0.332 ***
(.070) (.054) (.054) (.055) (.054) (.086) (.053) (.072)New Mexico 0.037 -0.226 *** -0.427 *** -0.590 *** -0.298 *** -0.289 *** -0.434 *** -0.635 ***
(.071) (.052) (.051) (.052) (.051) (.061) (.05) (.069)California -0.163 † -0.019 -0.220 *** -0.194 ** -0.226 *** -0.218 ** -0.254 *** -0.331 ***
(.085) (.069) (.068) (.068) (.069) (.085) (.066) (.091)Constant 0.753 *** -0.639 *** -0.492 *** -0.854 *** -0.638 *** -2.302 *** -0.101 1.823 ***
(.169) (.131) (.129) (.132) (.13) (.173) (.127) (.173)PPC .902 .658 .631 .661 .644 .776 .642 .124LR Chi2 130.5 193.5 398.9 529.9 393.9 809.2 365.1 558.1
*** p < .001 ** p < .010 * p < .050 † p < .100 Sample size for all models = 4,118
Barreto, Nuño, Sanchez APSA 2007 18

Table 4: Changes in Predicted Probability of Having Voter Identification
Given change in independent variable from its minimum to maximum
Variables Driver’sLicense
BirthCertificat
e
BankStatement Passport Utility
BillProperty
TaxLicensePlus 1
6-itemIndex
Latino ns -0.0799 -0.1507 -0.1365 -0.1391 -0.0814 -0.1348 -0.5480
Asian -0.0756 -0.1712 -0.2365 ns -0.1829 -0.1054 -0.2029 -0.8367
Black ns -0.0900 -0.1674 -0.1401 -0.2004 -0.0808 -0.2001 -0.7067
Foreign born -0.0762 -0.1560 -0.0727 0.0775 -0.0998 ns -0.0645 -0.3147
3rd generation ns ns ns -0.0468 ns ns ns Ns
Age 18-29 ns ns ns 0.0547 -0.1117 -0.0924 ns Ns
Age over 65 -0.0813 ns ns ns -0.0615 ns ns Ns
Education 0.0560 ns 0.2099 0.2964 0.2061 0.0801 0.1812 0.8428
Income 0.0400 0.0642 0.0513 0.1274 ns 0.0622 0.0765 0.3534
Female ns 0.0710 0.0786 0.0665 0.0722 ns 0.0861 0.3069
Years in county 0.0319 ns -0.0545 -0.1249 ns 0.0378 ns Ns
Home owner 0.0266 ns ns 0.0542 0.0341 0.2441 ns 0.3320
New Mexico ns -0.0804 -0.1614 -0.2152 -0.1109 -0.0629 -0.1702 -0.6345
California -0.0285 ns -0.0838 -0.0729 -0.0839 -0.0466 -0.1001 -0.3309
* ns denotes that the independent variable was not significant in the given model (see table 2)
Barreto, Nuño, Sanchez APSA 2007 19
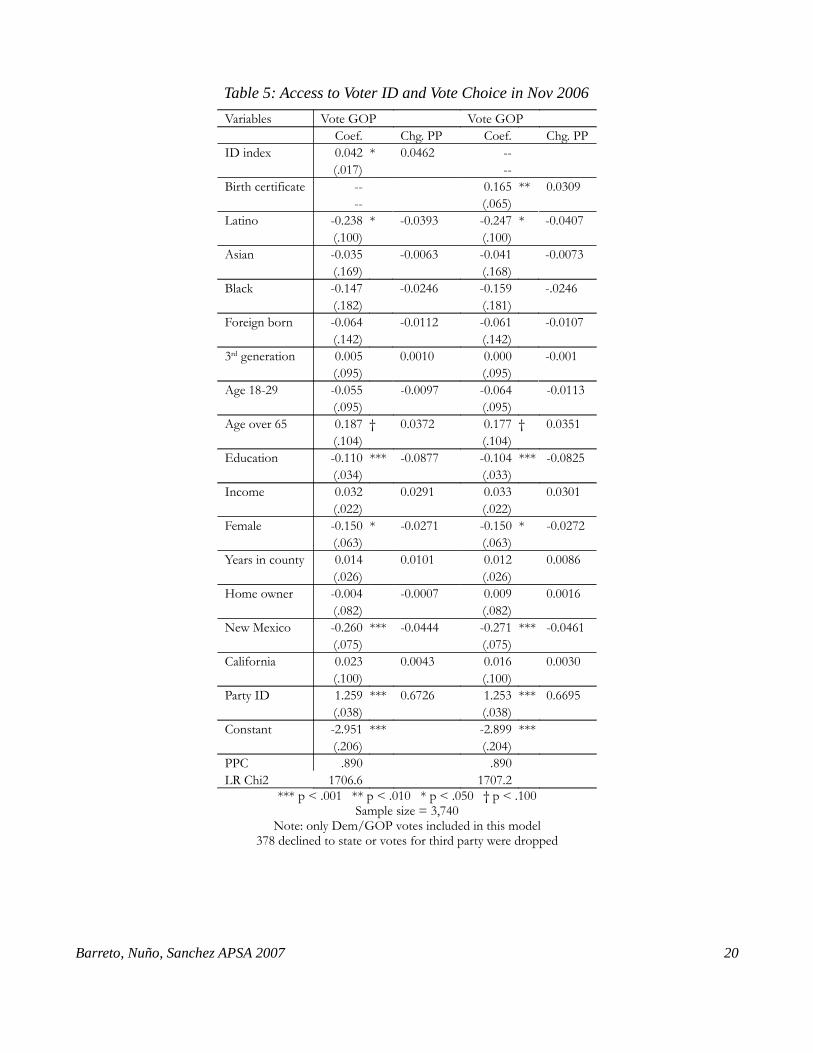
Table 5: Access to Voter ID and Vote Choice in Nov 2006Variables Vote GOP Vote GOP
Coef. Chg. PP Coef. Chg. PPID index 0.042 * 0.0462 --
(.017) --Birth certificate -- 0.165 ** 0.0309
-- (.065)Latino -0.238 * -0.0393 -0.247 * -0.0407
(.100) (.100)Asian -0.035 -0.0063 -0.041 -0.0073
(.169) (.168)Black -0.147 -0.0246 -0.159 -.0246
(.182) (.181)Foreign born -0.064 -0.0112 -0.061 -0.0107
(.142) (.142)3rd generation 0.005 0.0010 0.000 -0.001
(.095) (.095)Age 18-29 -0.055 -0.0097 -0.064 -0.0113
(.095) (.095)Age over 65 0.187 † 0.0372 0.177 † 0.0351
(.104) (.104)Education -0.110 *** -0.0877 -0.104 *** -0.0825
(.034) (.033)Income 0.032 0.0291 0.033 0.0301
(.022) (.022)Female -0.150 * -0.0271 -0.150 * -0.0272
(.063) (.063)Years in county 0.014 0.0101 0.012 0.0086
(.026) (.026)Home owner -0.004 -0.0007 0.009 0.0016
(.082) (.082)New Mexico -0.260 *** -0.0444 -0.271 *** -0.0461
(.075) (.075)California 0.023 0.0043 0.016 0.0030
(.100) (.100)Party ID 1.259 *** 0.6726 1.253 *** 0.6695
(.038) (.038)Constant -2.951 *** -2.899 ***
(.206) (.204)PPC .890 .890LR Chi2 1706.6 1707.2
*** p < .001 ** p < .010 * p < .050 † p < .100Sample size = 3,740
Note: only Dem/GOP votes included in this model378 declined to state or votes for third party were dropped
Barreto, Nuño, Sanchez APSA 2007 20

Table 6: Closest Districts In Nov 2006 Congressional ElectionState District Dem Margin Dem Pickup New ID LawsIL 10 -6.75% OH 1 -5.64% Photo requiredNV 2 -5.46% ID 1 -5.13% CT 4 -3.38% ID w/o photoCA 4 -3.18% NY 29 -3.07% VA 2 -2.84% IL 6 -2.70% CO 4 -2.49% ID w/o photoWA 8 -2.19% ID w/o photo
NY 25 -1.89%
NV 3 -1.88%
NJ 7 -1.67%
PA 6 -1.28% OH 2 -1.06% Photo requiredWY 1 -0.52% OH 15 -0.48% Photo requiredNM 1 -0.42% ID w/o photoFL 13 0.00% Photo requiredCT 2 0.03% Pickup ID w/o photo GA 12 0.61% Photo requiredPA 8 0.61% Pickup GA 8 1.10% Photo requiredFL 16 1.89% Pickup Photo requiredWI 8 2.14% Pickup KY 3 2.44% ID w/o photoNH 1 2.63% Pickup IA 2 2.85% Pickup KS 2 3.46% Pickup FL 22 3.76% Pickup Photo requiredPA 4 3.86% Pickup AZ 5 3.97% Pickup Photo requiredIN 9 4.39% Pickup IA 3 5.20% MN 1 5.61% Pickup PA 10 5.89% Pickup NY 24 5.98% Pickup CA 11 6.53% Pickup IL 8 6.89% NH 2 7.10% Pickup NC 11 7.52% Pickup IN 2 7.89% Pickup Photo requiredTX 23 8.57% Pickup ID w/o photoVT 1 8.71% Pickup NY 20 8.92% Pickup NY 19 9.82% Pickup TX 22 10.01% Pickup ID w/o photoCT 5 10.27% Pickup ID w/o photoIA 1 11.85% Pickup AZ 8 12.16% Pickup Photo requiredPA 7 12.76% Pickup CO 7 12.87% Pickup ID w/o photo
IN 8 22.03% PickupPhoto requiredPhoto required
OH 18 24.12% Pickup Photo required
Barreto, Nuño, Sanchez APSA 2007 21

Appendix – Coding of Variables
Dependent variables Coding
Driver’s license 0,1 whether or not respondent has state driver’s license
Birth Certificate 0,1 whether or not respondent has original birth certificate
Bank statement 0,1 whether or not respondent has bank statement
Passport 0,1 whether or not respondent has U.S. passport
Utility bill 0,1 whether or not respondent has utility bill
Property tax statement 0,1 whether or not respondent has property tax statement
License Plus 1 0,1 respondent has state driver’s license plus one additional form of ID2
6-item index 0 – 6 index of the six forms of identification
Vote GOP 0,1 vote choice in 2006 Senate or House, 0=Dem, 1=GOP
Independent variables Coding
Age 18-29 0,1 where 1 = 18-29 age group
Age over 65 0,1 where 1 = over 65 age group
Education 1=less than HS; 2=HS grad; 3=Some college; 4=College; 5=Grad school
Income 1=less $20K; 2=20 to 39K; 3=40 to 59K; 4=60 to 79K; 5=80 to 100K 6= over 100K
Female 0,1 where 1 = female
Latino 0,1 where 1 = Latino
Asian 0,1 where 1 = Asian
Black 0,1 where 1 = Black
Foreign born 0,1 where 1 = foreign born
3rd generation 0,1 where 1 = third generation (i.e. U.S. born with U.S. born parents)
Years in county 1=less 5 years; 2=5 to 10 yrs; 3=11 to 20 yrs; 4=20 to 40 yrs; 5= more 40 yrs
Home owner 0,1 where 1 = home owner
New Mexico 0,1 where 1 = New Mexico (Bernalillo County)
California 0,1 where 1 = California (Orange County)
Party ID 1=Democrat; 2=Independent/Other; 3=Republican
2 If the respondent does not have a driver’s license, but does have a state ID card, in addition to a second form ofidentification, they were similarly coded as 1. This was most common among some elderly respondents, and in most states astate ID card can be substituted for a driver’s license as a valid form of identification.
Barreto, Nuño, Sanchez APSA 2007 22