voting power efrat dressler - hebrew university of...
TRANSCRIPT
Voting Power at Shareholder Meetings: Evidence from the Voting Behavior of
Institutional Investors
Efrat Dressler*
The Hebrew University of Jerusalem
April, 2017
Abstract
I investigate the role of voting power (ability to influence outcomes) in the behavior of
institutional investors. Calculating two power indices commonly used in political science
but rarely in the corporate governance literature, I examine the power distribution among
institutional investors and their voting patterns. Using data from Israel, I obtain three main
results: (1) Empowering minority shareholders by raising the required majority in a
concentrated ownership environment is likely to make the distribution of voting power
more unequal; (2) Institutional investors’ voting power is positively related to their
tendency to support management-sponsored proposals: the stronger the investor is, the
higher is the probability s/he would vote in favor of the proposal; (3) The strongest group
of institutional shareholders is insurance companies. This group supports management-
sponsored proposals in highest percentages of all institutional investors. Those insurance
companies suffer from potential conflicts of interest; and (4) institutional investors have
two voting patterns: the first is "management friendliness": Institution's historical voting
is significant in predicting its next vote, and the second is "peer voting": an institution is
likely to vote like other institutional shareholders, especially like “similar” institutions
that are present at the vote. The results have implications for policy makers in the design
of voting rules as a tool in empowering minority shareholders.
* I gratefully acknowledge financial support from the European Research Council
(ERC) grant number 263305 and the support by the I-CORE program of the Planning
and Budgeting Committee and the Israel Science Foundation.
I thank Yishay Yafeh for endless hours of listening, reading and commenting as my
advisor.
1. Introduction
How do institutional investors vote at shareholder meetings? How are their voting
patterns affected by their ability to influence outcomes? To what extent do they tend to
vote like their peers? Even though shareholder voting has become a popular mechanism
of corporate governance throughout the world, these questions are relatively unexplored.
In this paper, I address these issues using a novel, hand collected data set from Israel.
Institutional shareholders' role in corporate governance and their effect on firm
value has been explored theoretically and empirically mainly in the context of dispersed
ownership environments like the United States or the United Kingdom. In these common
law countries institutional investors play an active role, initiating proposals of their own
regarding compensation (see detailed review in Yermak, 2010), or the appointment of
board members (Cai, Garner, and Walkling, 2010). In other countries, however, where
corporate ownership is more concentrated and controlling shareholders are common, the
role of institutional investors is different: they are expected to protect minority
shareholders in their conflict with the controlling shareholders, for example by voting
against unfair related party transactions. While some research suggests that certain voting
processes could be an efficient form of activism in U.S firms (Cai, Garner, and Walkling,
2009, Fischer et al., 2009, and papers surveyed in Yermack 2010) as well as in non-
American firms (Iliev et al., 2015), the ability of shareholders to oppose and prevent such
unfair transactions in controlling shareholder environments is conditioned on the
existence of regulation that gives the minority shareholders special power beyond their
weight in the voting rights.
Measures of voting power essentially gauge the ability of a voter to influence
outcomes by forming a coalition with other voters, or withdrawing from it. The a-priori
voting power of a specific shareholder, at a specific vote, indicating the shareholders'
ability to affect the final result, is measured here by two widely used measures: The
Shapley-Shubik power index (1954) and the Banzhaf power index (1965). These
measures are a function of the number of players in a voting game, each player's weight
in the total voting rights, and the majority rule for a winning coalition. This a-priori voting
power of a shareholder under a given decision rule is regarded as the capacity of potential
influence attributed to the shareholder by virtue of the rule1. The Shapley-Shubik and the
Banzhaf power indices are commonly used in the political science literature, but are less
common in the corporate governance literature. In the financial context, there are few
papers that use these indices mainly for identifying control blocs in dispersed ownership
environment (Leech 2001, 2003) or for identifying control relations at the corporate level
in concentrated ownership environment (Kosenko et al. 2012) and in family firms (Massa
and Zaldokas, 2016). Zingales (1995) evaluates voting rights using power indices.
The study is based on a new, hand-collected data set of voting records from Israel,
starting in 2012. These data became available after Amendment 16 to the corporate law,
which required majority of the minority approval on a variety of corporate decisions,
including self-dealing transactions with the controlling shareholders. Institutional
investors are required by law to vote on these issues and to publish their voting records.
The study attempts to address three main questions: what is the effect of an
increase in the required majority on the distribution of voting power; what is the effect of
voting power on voting patterns; and whether “management friendliness” and “peer
pressure” affect the voting behavior of institutional investors.
Using the Shapley-Shubik and the Banzhaf relative power indices, I examine the
distribution of voting power among shareholders under two regimes: one where the
support of 33% of the minority shareholders is sufficient to approve self-related
transactions proposed by management, and another where majority of the minority is
required (50%). These percentages are based on a legal experiment that happened in Israel
1 Felsenthal & Machover, 2004
in 2011, where the regulator changed the majority rule in an effort to empower minority
shareholders. The expectations were that small shareholders would become more
influential, since coalitions would have to include more shareholders.
The results are surprising. First, under the actual distribution of voting rights
among minority shareholders, an increase in the required majority to 50% results in an
increase in the concentration of voting power - a more unequal distribution of voting
power relative to the initial conditions (where the support of 33% of minority shareholders
was required). That is, in most cases, raising the required majority appears to have
allocated more voting power to larger shareholders. The reason is that, when voting rights
are initially highly concentrated, relatively large minority shareholders become pivotal in
more possible coalitions following the change in the required majority.
Second finding concerns the voting patterns of institutional investors, and the
effect of voting power on their voting behavior. My hypothesis, following Hamdani and
Yafeh (2013), is that the largest (and strongest) institutions tend to be management-
friendly. I find that higher voting power is positively correlated with management
friendliness: The strongest minority shareholders tend to vote with management-
sponsored proposals.
This finding raises the question: why do large shareholders vote with
management? One possibility is that they are motivated by conflicts of interest, for
example, because they have some other business with the firm management, or because
management "buys" their vote directly. I will refer to this possibility as "the bad story".
It is also possible that large shareholders vote with management because these strong
institutional investors negotiate the conditions of the transaction with management before
the vote and use their power to achieve better conditions, in line with the minority
shareholders' interest – the latter will be referred to as "the good story". Looking for a
way to empirically distinguish between the two explanations, I examine a proxy for
negotiation between management and shareholders over the conditions of the transaction
before the vote takes place. This proxy exists in a sub-sample of votes that were delayed
suggesting the possibility of disagreements. For these votes, I examine whether smaller
shareholders with no conflicts of interest vote in favor of those proposed transactions after
the negotiation has ended. I find that, in these votes, small institutional shareholders are
more likely to dissent, in comparison with the full sample of votes (over the same issues),
whereas the largest shareholders vote with the management in higher percentages than in
the full sample. This finding is consistent with the "bad story", whereby large minority
shareholders vote with management even though the proposal is not necessarily value
enhancing.
Third, I identify institutional shareholders with voting power, finding that the
strongest group is insurance companies. Those companies conduct several business
activities with companies, thus they have potential conflicts of interest. I also find that
insurance companies are the most management friendly shareholders among institutions.
An insurance company has on average a 17.6% lower probability of voting against a
proposal comparing with employee owned fund.
Fourth, I find two different voting patterns: "management friendliness" and a
"peer effect". In the first, an institutional shareholder’s voting history is significant in
predicting her next vote. A fund manager that tends to vote with management, is most
likely to continue supporting management in her next proposal. In the second, a higher
probability of other, similar shareholders to dissent in the vote, raises the probability of a
shareholder to vote AGAINST and vice versa. Controlling for sample selection, I still
find that a peer's expected vote, calculated as the average of the "management friendliness
measure" of all other institutional shareholders, and of the most similar institutional
shareholders to every fund manager, is significant in predicting that fund manager's next
vote.
Overall, I conclude that raising the required majority, trying to empower minority
shareholders in concentrated ownership environment, is likely to create an unequal
distribution of voting power: it bestows even more power on shareholders which were
powerful to begin with. The effectiveness of this change on improving corporate
governance (for example by preventing minority shareholder expropriation by controlling
shareholders) is not clear, since these empowered large institutions are found to be
“management friendly” and vote mostly “for” management-sponsored proposals.
The voting power is probably a good way of recognizing the institution with whom
management negotiate the terms of transactions. Therefore, an efficient regulation should
make sure these institutions are free from potential conflicts of interest.
2. Related Literature
The present study is related to the line of research on institutional investors’ voting
behavior. Recognizing the importance of institutional investors' vote in corporate
governance2, this literature addresses the question: what motivates shareholders' votes, as
well as which voting patterns can be recognized in institutional shareholders' votes? The
present study adds to this literature the perspective of voting power as a factor in the
voting behavior of shareholders, and the heterogeneity of institutional investors (not only
mutual funds, but also insurance companies, pension and provident fund managers) and
issues voted on. In a theoretical paper Maug and Rydqvist (2009) suggest that investors
vote strategically, taking into account whether they are pivotal. Therefore, raising the
required majority rule will affect some votes, but will not affect the outcomes, as
shareholders understand that a proposal which is value creating, should be approved. The
authors conclude that the investors' strategic voting behavior is creating value to the firm.
Empirical papers on voting motivation and voting behavior include for example Davis
2 For example, in solving the collective action problem, see Edelman and Thomas (2015) in "The
Research Handbook of Shareholder Power".
and Kim (2007), Ashraf et at. (2009), Hamdani & Yafeh (2013) and Cvijanovic, Dasgupta
and Zachariadis (2016) who find that conflicts of interest - other business connections
with portfolio firms - affect voting decisions, and Aggarwal, Erel and Starks (2014) who
find that media coverage affect the voting behavior of institutional investors. Hamdani
and Yafeh (2013) is very close to this project, as it deals with empowering the minority
shareholders in a controlling shareholders' environment, the same institutional context as
in the present study. Matvos and Ostrovsky (2010) look for voting patterns in elections
for corporate boards and find that some shareholders vote in a more management friendly
way than others and that these voting patterns are persistent. They also recognize a “peer
effect” defined as the tendency of a shareholder to vote like her peers. Within the huge
literature on "Say-On-Pay" votes, some papers3 investigate voting patterns of
shareholders.
Second line of research, under the line of investor's protection in concentrated
ownership, initiated by La Porta et al (1998), is the literature on blockholders activism
(see detailed survey in Edmans and Holderness 2016) , and more specifically, behind-the-
scene activism, which studies the effect of large shareholders on corporate governance
changes (Carleton, Nelson and Weisbach 1998) or some other objectives such as
replacing the CEO or increasing cash payout to investors, creating abnormal returns to
the firm's share once published (Becht, Franks, Mayer and Rossi 2010). These
achievements were all carried out by engagements with executives occurring behind the
scenes. I add to this literature by providing evidence on negotiation between management
and large shareholders over self-dealing transactions occurring before voting at
shareholders meeting, and indications for the use of voting power in such a negotiation.
This literature also recently evolved to addresses the implications (and find significant
3 For example, Iliev, Lins, Miller and Roth (2015), and Schwartz-Ziv and Wermers (2016).
effect) of voting requirement on firm key variables like value4, compensation level5,
board accountability6 or acquisitions7. I add to this literature first examination of the
implications of changing the voting rule on the concentration of voting power among
minority shareholders.
3. Data description and Methodology
3.1 Database construction
Israeli law requires institutional investors to cast a vote on several issues8, and
also requires public companies to report the results of every proposal approval or denial
on these issues, including the identity of the institutional shareholders present at the vote,
the number of shares they hold, and the actual vote cast by each shareholder on each
proposal. This information is reported9 to the Israeli Securities Authority (ISA) and the
Tel Aviv Stock Exchange (TASE). This requirement, implemented at the beginning of
2012, allows me to manually collect data on every vote on management-sponsored
proposals10 on one of the issues that require approval by a majority of the minority. I
collect all reported votes between January 2012 and August 2013 from the Maya reports
system11. As the power indices I use to measure voting power can only be meaningfully
evaluated by including all the participants in a voting game12, I exclude the proposals
4 Chen et al. (2013) use a regulatory change that empowered minority shareholders in China in order to
find out the effect of such a reform on the firm value. 5 Fried, Kamar and Yafeh (2016) use an amendment in Israel's corporate law in order to find the effect of
empowering minority shareholders on the compensation to controlling shareholders. Many more SOP
papers on U.S. data were written after the Dodd-Frank regulation of 2010. 6 Choi et al. (2016). 7 Becht, Polo and Rossi (2015) study the effect of mandatory voting on quantity and price of acquisitions. 8 For exact details on the different obligations concerning different types of fund managers see Hamdani
and Yafeh (2013). 9 Filings no. 48ת and 49ת. 10 All the votes in the sample are management-sponsored proposals, since other kind of proposals are very
rare to non-exist in Israel 11 Available for free at maya.tase.co.il. The ending date has no particular importance apart from the fact
that it is the time when I started collecting the data. 12 The power indices are a relative score for each participant, see details on the measures in part 3.2.
when the sum of stocks reported in the vote summary is bigger than the total number of
stocks in the hands of all reported participants.
The raw database includes 83,381 shareholders' votes on 1,253 proposals in 267 firms.
This indicates a large average number of shareholders per vote. The reason for that is the
detailed reports by companies that include the vote of each fund under the same
institutional investor separately (e.g. provident funds, pension funds, mutual funds, or life
insurance accounts). A close examination of votes finds out that (not surprisingly) all
funds under the same manager, including different kinds of funds, cast the same vote. I
therefore sum up all stocks held by the same institutional investor into one observation.
In order to do that, I use the information in the Ministry of Finance website13. Table 1
summarizes the final numbers of proposals and votes in the data.
[Table 1]
3.2 Variables description
Power Indices
Table 2 shows the average Shapley-Shubik index and the average normalized
Banzhaf index for every shareholder category. Both indices are relative scores for each
player in the voting game, and the scores are similar. The Shapley-Shubik index depends
on the order in which the players join the coalition. A pivotal shareholder is a player
whose vote turns a possible group of players to a winning coalition. The derivation of this
index is based on the ratio of the number of coalitions in which the particular player is
pivotal, out of n! possible (ordered) coalitions, where n is the number of players in the
voting game. The sum of all the indices for all players in a vote is always 1, since the
Shapley-Shubik index is actually the probability of a specific player being the pivotal one.
13 "gemel-net", "pensia-net" and "bituach-net".
The Shapley-Shubik index is appropriate when communication between players takes
place before the vote and before coalitions are formed.
[Table 2]
The Banzhaf index can be interpreted as the probability of a player to change the
result of the vote by changing her/his own vote from "for" to "against" ("a swing"). This
index does not depend on the order of joining coalitions. This index is calculated by
counting all the possible swings for a given player (that is, the number of winning
coalitions that include the specific player whose change of vote will turn the coalition to
a losing coalition) and to divide it by the number of possible coalitions that exclude the
player14. Since the Banzhaf indices of all players in a specific vote do not necessarily add
up to one15, it is also common to use a normalized Banzhaf index16 which can be
interpreted as a relative measure of players' voting power (Leech 2003).
The power index of each shareholder in every vote is calculated using the Shapley-
Shubik (1954) and the Banzhaf (1965) direct (exact) formulas, only for proposals with no
more than 25 shareholder's votes. The calculations become extremely complex as the
number of players in the voting game rise because computation time grows super-
polynomially with that number17. When a voting game includes more than 25
shareholders, I use an approximation by Denis Leech, which is based on the direct method
and on Owen's approximation18. This method allows the user to tradeoff between accuracy
and computational efforts19. It divides the players into two groups: "major" players with
14�� = ∑ 1�� 2�⁄ Ti is a swing of player i. 15Since the order of entering the coalition isn't relevant, in any voting there could be either few or no
players with a swing. 16A player's normalized Banzhaf index equals her Banzhaf index divided by the sum of all players'
indices. 17 Koesenko (2012) 18 Leech (2003), implemented in http://homepages.warwick.ac.uk/~ecaae/index.html. 19Professor Denis Leech has kindly given me his code for computing his approximations for the Shapley
Shubik index and the Banzhaf index.
the largest weights and "minor" players – all other players in the voting game. The method
computes the index for the major players as if they were the only players in the voting
game. Under this assumption, the index computed is the direct, "real" index. For the minor
players, the method uses all the coalitions already formed with major players. The larger
the number of major players, the more accurate the index is, but the longer it takes to
compute all players' indices. In my calculation I consider a player to be major if
accumulated voting rights of all bigger players (not including himself) does not reach a
total of 90% of voting rights in every voting game.
For each player in the voting game20 I compute the Shapley-Shubik power index
and the Banzhaf power index twice: using first the 33.3% majority rule and again, using
the 50% majority rule. Since I only observe voting records from the period when majority
of the minority support was required21, I derive each player’s hypothetical voting power
had the required majority been 33.3%, assuming that holdings (voting rights) are
unchanged.
Shareholder's category
I categorize the institutional shareholders into four groups according to the
financial services they supply: Insurance companies (which also manage retirement
savings schemes), investment houses (managing mutual funds as well as retirement
savings schemes), employee- or employer-owned funds, and foreign investors22. Overall,
these four groups are different in their average size (assets under management) and the
services they provide. Therefore, I expect differences in the potential conflicts of interest
in their activity as institutional investors.
20 In the majority of minority requirement issues only, that is excluding the supermajority issues. 21Proposals from 2011 and earlier are not reported by the firms, making it impossible to collect data of all
participants and their voting rights in every proposal at this period.
22 a complete list of funds under each fund manager and the list of fund managers in every category is
available on request.
Category 1: Insurance Companies
These companies are the largest players in terms of assets under management
since the reform of 2006 (Bachar reform), which forced banks to divest their money
management activity. Insurance companies provide insurance products (including life
insurance policies as well as other insurance devices), pension funds, mutual funds and
provident funds. There are eight big insurance companies in Israel and few small ones.
These companies suffer from possible conflicts of interest in their activities: On one hand,
they manage money on behalf of savers, and should be looking out for their best interest.
On the other hand, they sell insurance policies to corporations. Hamdani & Yafeh (2013)23
found conflicts of interest affect voting behavior of institutional shareholders24. I would
expect to see this effect in the data.
Category 2: Investment Houses
This group includes companies that manage all kinds of funds, but without selling
insurance. There are seven or eight big investment houses that manage pension and
provident funds in addition to mutual funds, and approximately twelve more small
managers that only manage mutual funds. This group partially has a potential for conflicts
of interest, since some of the investment houses provide also underwriting services for
companies that might be part of their portfolio.
Category 3: Employee-owned and Employer-owned Funds
All savers in these funds are employees of the same organization and their
families. These funds' sole interest is their members. In most of the cases these funds are
23 As well as others, see related literature. 24 All kinds of institutional investors, not only for insurance companies. My categorization is not
following their's.
not large enough to retain experts who will invest the money or analysts who will decide
how to vote on every management proposal. Therefore, these funds usually buy the proxy
advisor's recommendations on proposals and vote exactly as recommended, or use money
management services of an investment house, which also advise them on how to vote.
Therefore, these small privately owned funds are considered conflict-free.
Category 4: Foreign Investors
This group of investors is not necessarily a homogeneous group in many respects,
but their voting behavior is similar: Israel is a small market for them, their share of
investments in Israeli companies is apparently too small to analyze every vote. They do
not suffer from any obvious conflicts of interest.25
Opposition Index
A fund “opposition index”, the tendency to vote “against”, is calculated for every
institutional shareholder using the methodology of Matvos and Ostrovsky (2010)26: An
opposition index is the average of all historical votes cast by fund manager over all
previous proposals to every shareholder meeting the fund participated in. a high (close to
one) index indicates history of many AGAINST votes, and a low (close to zero) index
indicates history of management friendliness by the fund.
Proposal Issue
The categorization of issues of the proposals is done using the categories in
Hamdani and Yafeh (2013) with some additional categories arising from amendments 16
and 20 to the Israeli companies' law. Details appear in Table 3 and Table 4. All issues that
25 The foreign investors vote "against" in only 16% of their votes, less than the average (22%). 26Matvos and Ostrovsky calculate a "management friendliness index", since they use the probability to
vote "for" as the dependent variable, while I use the code 1 for voting "against" so I call it "an opposition
index". The higher the index is, the more “against” votes a fund manager has cast in his voting history.
concern self-dealing with the controlling shareholders require majority of the minority
rule. Some issues are voted on with management almost automatically (for example,
external directors elections) whereas mergers and acquisitions or compensation issues
usually arise a disagreement. I will refer to this point below, in the results section.
[Table 3]
[Table 4]
3.3 Methodology
I calculate the concentration of voting power for every shareholder meeting, using
the "Herfindahl-Hirschman Index" (HHI). Comparing the concentration under the two
different majority rules sheds light on the reallocation of voting power caused by the
increase in the required majority.
For the purpose of examining the presence of “peer effects” (influence by other
voters) in institutional investors' votes, I calculate for each shareholder i the average
opposition index of all present shareholders in every meeting excluding itself. There are
few challenges in identifying the impact of peer voting (Manski 1993, Mugerman et al,
2014): first, a reflection problem: the realized effect might represent not only the effect
of shareholder i on shareholder j, but also the possible effect of j on i. Second, the
relationship between i’s behavior and her/his peers’ behavior may be due to common
unobserved characteristics that have led both shareholders to make the same choice of
investment. Thus, an observed similarity in votes may be due to selection effects. Third,
a correlation in choices within shareholder meeting may be due to exposition to the same
facts and possibly also to the same recommendation provided by the proxy advisor. I
address each of these challenges using a separate technique: The reflection problem is
solved by calculating a different opposition index for every shareholder i and meeting
date t using only the historical data (already known by the date t) of each shareholder's
votes. This way, I can measure the effect of the presence of more or less management
friendly peer voters, without actually using their present vote. The selection effect is taken
care of by using institution-specific fixed effects in the regressions, in order to make sure
that the peer effect does not evolve from unobservable similarities of fund managers. The
correlated effect is solved by calculating another peer index (a sub-peer), including only
the additional shareholders who belong to shareholder i's fund category. If the effect of
peers on voting is only due to exposure to similar information, then there should not be a
special impact for peers of a specific fund category.
4. Results
4.1 Power distribution
Amendment No. 16 to the Companies Law27, enforced in Israel in May 2011,
implemented the conclusions of the Goshen and the Hamdani committees, which were
concerned about value extraction by the controlling shareholders. They aimed to
strengthen the position of minority shareholders, in particular institutional investors, by
giving them the power to preclude controlling shareholders from carrying out transactions
involving a conflict of interest, which therefore are not in the company's best interest. For
those transactions, the amendment changed the majority rule: instead of requiring the
votes of 1/3 of shareholders who do not personally benefit from the transaction, the
proportion was changed to 1/2. I begin the analysis by examining the distribution of
voting power among minority shareholders under the two voting rules. First, note that
even after the exclusion of control holders from the voting game, the minority's voting
rights are hardly dispersed: in 68% of the votes that require a special majority in my
sample, there is a shareholder holding 33% of minority’s voting rights or more. In 37.1%,
27Companies Law 5759-1999

the largest shareholder holds 50% of the minority’s voting rights or more. I find that,
under such circumstances and given the actual distribution of equity stakes held by Israeli
institutional investors, raising the required majority for a winning coalition strengthens
the largest shareholder. Figure 1 illustrates this with an example: a vote with 17 non self-
interested shareholders, of which 10 hold less than 1% of the voting rights. The largest 7
hold rights as follows: 37%, 17%, 14%, 10%, 9% 8%, 3%.
[Figure 1]
As can be seen in Figure 1, the strongest player becomes even stronger under the new
majority rule, while all other, smaller, players, are weakened. In order to examine how
general this result is, I simulate the effect of the increase in the required level of support
from 33% to 50% using different initial distributions of voting rights (Figure 2). I find
that in 73% (57%) of the initial, simulated, distributions, voting power, calculated using
either the Banzhaf or the Shapley-Shubik indices will become more concentrated. The
exceptions are distributions in which the initial concentration of voting power is low, but
these are not common in the case of Israel.
[Figure 2]
Moving to actual data, the amendment has made the power more concentrated among
institutional investors (minority shareholders) in Israel. The average HHI of shareholder
power indices has increased from 42% (40%) to 49% (53%) using the Shapley-Shubik
(Banzhaf) index when the required level of support was raised from 33 to 50%28. The
28 That raise is for the sample of firms and not proposals, in order not to deviate the average. The raise is
significant in the 1% level also for the sample of proposals.
difference is statistically significant in the 1% level. The concentration of power under
the two required levels of support is illustrated in Figure 3.
[Figure 3]
The main implication of the finding that the increased level of required support bestows
even more power on shareholders which were powerful to begin with is that the effect of
this change on corporate governance depends on the extent to which the empowered large
minority shareholders (institutions) are “management friendly”. To the extent that the
empowered institutions mostly vote “for” management-sponsored proposals, it is not
clear whether an increased required level of support would be effective in preventing
minority shareholder expropriation by controlling shareholders.
4.2 Voting power and voting behavior
Understanding the new distribution of power among institutional shareholders, I
turn to the estimation of the determinants of institutions' voting behavior. Table 5 presents
logit estimates of the probability of voting against management. Explanatory variables
include institution-specific, vote-specific and firm-specific characteristics, as well as
other control variables (year dummies).
[Table 5]
I begin with shareholder voting power. Table 5 (panels A and B) shows that
shareholder's power index is negative and significant in explaining against vote, across
all specifications: stronger shareholders vote "for" more often. This is not a surprising
result if we remember that the data might suffer from selection problem: I only see the
votes on proposals that management has brought to a vote at the general shareholder
meeting. It is likely to assume that before calling the vote, management would try to find
out whether the proposal is going to pass the shareholder's vote29. I will refer to this point
later on, after analyzing some more shareholder's characteristics, vote's characteristics
and firm's characteristics that influence shareholder's vote.
Table 5 shows that insurance companies are the most management friendly
institutional (minority) shareholders (the omitted category is foreign investors), whereas
investment houses and employee owned funds dummy variables are positive and
significant in explaining against votes. An insurance company has on average a 17.6%
lower probability of voting against proposal comparing with employee owned fund, and
a 12.6% lower probability comparing with an investment house. Within shareholder's
category, over and above the direct influence of voting power, the power index is related
with FOR votes only in the employee fund category (columns 3, 4,5).
Looking at firm specific variables effect: firm size (reflected in the variable
"Log(capital) DEC2012") reduces opposition: larger firms have a negative effect on the
probability to vote against management-sponsored proposals. This result is consistent
with two contradicting explanations: either large firms are better managed and less subject
to minority shareholders' expropriation by controlling shareholders, or larger firms have
a greater potential conflicts of interest with institutional investors (higher probability for
underwriting services, or larger number of employees and management members to
provide with insurance or pension funds). This question remains open within the
framework of the present paper. Firm's profitability is expected to reduce opposition to
management's proposals among shareholders, though the effect is not statistically
significant in some of the specifications.
29 Listokin (2008) suggests management control the timing of proposals and withdraw proposals that are
likely to fail on the vote. Becht, Polo and Rossi (2015) and Fos and Tsoutsoura (2014) mention career
considerations of firm managers as the reason for them to avoid "NO votes".
Examination of the issues voted on (Table 5 panel B) shows that issues
institutional investors vote against (over and above the effects of management
friendliness, voting power, shareholder category and firm's characteristics as discussed
above) are compensation related: whether it is the controlling shareholder compensation
(issue 1A), or the compensation of hired executives. This is consistent with the finding in
Hamdani and Yafeh (2013), who discuss whether the reason for that voting behavior is
the heavy media coverage30 or whether it is an issue of concern for minority shareholders,
since compensation is a mechanism for expropriation by controlling shareholders. The
fact that not only issues of compensation to controlling shareholders are positive and
significant in explaining AGAINST votes, but also the compensation to hired executives
might indicate the media coverage explanation over the expropriation explanation.
Going back to the negative correlation of voting power with voting against
proposals: there could be two explanations consistent with this finding. Either the
institutions are acting management friendly because of conflicts of interest, or the terms
of transactions were previously negotiated with them. In that case, if a negotiation took
place, it could end in two different ways, both are consistent with a support of the largest
and strongest shareholder: the first is a negotiation in which the strongest was "bribed"
by the management (for example by promising the fund managers some other businesses).
This possibility is referred to as "the bad story". The second, better, possibility is that the
stronger institutional shareholder uses her power to negotiate and improve the transaction
conditions in favor of all shareholders (and more specifically, minority shareholders).
This will be referred to as "the good story".
Trying to differ between the two possible explanations, I look at a subsample of
the data, where I have an indication for negotiation between management and institutional
shareholders: for this subsample of 54 Meetings (with 83 proposals), after the first call
30 Also see Aggarwal, Erel and Starks (2014) and Kaniel, Starks and Vasudevan (2007) who find causal relations between media coverage and fundnet inflows.
for a meeting and before the actual meeting date, there is an announcement to the stock
exchange on a delay in the meeting. The reason for the delay, when mentioned, is
negotiations, or a request from the institutional shareholders. Assuming that the
management negotiates primarily with the largest and strongest shareholders, this
negotiation on the deal could have two contradicting implications, as mentioned above:
If the good story is the more common explanation, then the negotiation is expected to end
with a good deal for the firm and for the shareholders. In this case, I would expect the
smaller (and weaker) shareholders to vote with the strong shareholders in favor of these
management proposals. On the other hand, if large shareholders are “bribed” by
management, the proposed deal is likely to be favorable to the controlling shareholder. In
that case, I would expect small shareholders to vote "against" those proposals.
[Table 6]
Table 6 shows the percentage of votes "for" and "against" for every quartile of
voting power, in the full sample data of proposals in the issues of 1A: compensation
related self-dealing and 1B: related party transactions, excluding delayed meetings31
(Panel A), and in the subsample of delayed meetings (Panel B), presumably due to
negotiations32. In the delayed meetings, probably after a negotiation took place, the
weakest shareholders vote against the management-sponsored proposals in higher
percentages in comparison with their level of opposition in the full sample, despite the
support of the strongest shareholders. The difference between the two distributions is
31 74 out of 83 delayed proposal's issues are 1A and 1B. For robustness check I repeat the same analysis
with the full sample of non-delayed proposals, the results are of higher difference in the first and fourth
quartiles. 32 Some announcement specifically mentioned a negotiation or a request from the institutional
shareholders as the reason for the delay in the shareholder meeting date, where some delays did not
mention any reason. The data on the delayed meetings is taken from firms' announcements to the TASE
available in the MAYA information system. I thank Oded Cohen from the Bank of Israel and the Hebrew
University for sharing me his data on delayed proposals.
statistically significant. This suggests that the strongest shareholders further their own
interests in negotiating with controlling shareholders, which are not necessarily the
interests of all minority shareholders.
The data also provides us with (very few) examples for the better result of the
negotiation: some deals are voted on twice, since the management failed to approve them
on the first time. a comparison of the two proposals (the one that denied and the one
approved) can teach us a lesson on the benefit that shareholders earned using their voting
power in the negotiation33.
Those examples are rare but they provide us with an evidence for behind-the-
scenes activism by institutional investors and their use of voting power to achieve
governance. Another finding consistent with "the good story" explanation is a result of
an experimental study34, in which people who answered questionnaires used their voting
power in favor with firm's best interest, even when confronting with self-conflicts of
interest.
4.2.2. Who is the strongest shareholder?
It is now interesting to find out which group of shareholders is the most powerful
one and how does it use its voting power? Table 2 above shows that insurance companies
are the largest minority institutional shareholders in my sample. In 42% of the “majority
of the minority” votes, one of the eight insurance companies is the largest shareholder. In
33 First example is "Gamatronics Electronic Industries LTD": on October 11th. 2012 there was a vote on
the proposal for waivers of duty of care and a liability insurance for directors related to the controlling
shareholder. The proposal failed, when all institutional investors vote against it. On January 16th, two
months later, the proposal came to vote on shareholders meeting again, this time it passed with the
support of a 100% of the shareholders. The difference on terms was the removal of the waivers of duty of
care for the directors among the controlling shareholders and their relatives. Second example is
"Bloimegrin Capital" proposal for responsibilities transfer from CEO to the (controlling shareholder)
chairman on August 12th 2012: the proposal failed with 88% of minority shareholders (all 6 institutional
investors) vote against. A month later, on September 20th. The proposal was approved with exactly the
67% (supermajority) required for this issue. The difference between the two proposals was the time
length of the responsibilities transfer: a year instead of three years initially proposed. 34 Taken in an unpublished work with Shoham Choshen-Hillel from the Jerusalem Business School, as a
part of my dissertation.
37% of the votes, an insurance company holds a veto power (i.e. holds over 50% of the
minority’s votes). This makes insurance companies the most powerful group among
institutional investors. Their average voting power is between 8.83% (Shapley-Shubik
index) and 8.98% (Normalized Banzhaf index), around ten times stronger than the
average employee-owned fund. As shown in Table 2 and Table 5 above, insurance
companies tend to be “management friendly” and vote “for” management-sponsored
proposals.
4.3 Voting patterns: management friendliness and peer voting
A management friendliness (or an opposition) voting pattern is referred to the
history of a fund manager voting behavior being significant in explaining the fund's next
vote: one could guess the fund's next vote by looking at its voting history. Table 7 shows
that fund's voting history represented by the "opposition index" (the proportion of votes
“against” in all previous votes), is positive and significant suggesting that funds have a
tendency to vote according to a positive or a negative voting pattern, which predicts their
vote controlling for the subject of the vote and their voting power.
A "peer voting behavior" (the tendency to vote like your peers) is part of a
phenomenon psychologists call "conformity" (the tendency to act in a similar way to
others), but it also could be due to common information. In addition to being an interesting
phenomenon, peer voting behavior has a practical importance: it might lower, or even
cancel the effect of the regulatory change on the effort that management (or a controlling
shareholder) must invest in building a winning coalition to approve any self-related
transaction. The requirement for a stronger support among minority shareholders is
effective only if it forces the management (or controlling shareholder) to negotiate the
terms of transaction with a larger number of shareholders. If a peer effect is significant in
predicting a shareholder's vote – it might be enough for management to assure the
supporting vote of the opinion leader of shareholders.
[Table 7]
Table 7 shows that, in all regression specifications, the proxy for the peer expected
vote variable, calculated as the average opposition index of all other institutional
shareholders present in every meeting is positive and significant in predicting a
shareholder's vote. Controlling for external influence (by calculating also close peer
expected vote using the average opposition index of institutional investors in the same
shareholder category for every institutional shareholder – column 3), and for sample
selection (by using fund-specific fixed effects- columns 4 and 5) the peer effect is
statistically significant. It can also be said that among all peers present in a vote, the peers
that are most similar to the shareholder (close peer as explained above) have the greatest
influence over their vote. The peer's influence is greatest in compensation votes, where
the peer effect raises the likelihood of voting against the proposal.
5. Conclusions
This paper provides evidence on the voting behavior of institutional investors in
a concentrated ownership environment, and the relation of that voting behavior to voting
power. A voting power is shown to be a better measure for the ability of shareholder to
affect the result of a vote, then the simple holding percentage of equity. I show that
increasing the required majority leads to larger inequality in power distribution among
groups of institutional shareholders. Voting power is found negative and significant in
predicting shareholder's AGAINST vote, regardless of other proposal characteristics, firm
characteristics or institutional shareholder's characteristics, though without indicating
causality relations. I also show that stronger shareholders vote with management on self-
related transactions when a negotiation probably occur, whereas weak shareholders vote
against it and conclude that the negotiation do not necessarily serve the minority
shareholders' interest. Along with that, I provide a (small) evidence for negotiations that
end up with management compromise with minority shareholders. I conclude that the
design of voting mechanisms is much more complicated than simply setting up a certain
level of required support.
Institutional investors have management friendliness pattern in their vote: their
voting history is significant in predicting their next vote. Institutional investors also vote
like their peers, and most significantly, like their most similar peers, those that belong to
the same institutional category. Insurance companies, in particular, tend to be
management friendly and employee- and employer-owned funds tend to oppose
management more often. Since the first group is more likely to suffer from conflicts of
interest, strengthening minority shareholders is a necessary but not sufficient act in
improving corporate governance: it should be taken along with reducing or weakening
conflicts of interest of the major players.
References
Aggarwal, R., Erel, I., & Starks, L. (2015). Influance of Public Opinion on Investor
Voting and Proxy Advisors (Fisher College of Business Working Paper Series;
Dice Center WP).
Aggarwal, R., Saffi, P. A. C., & Sturgess, J. (2015). The Role of Institutional Investors
in Voting : Evidence from the Securities Lending Market. The Journal of Finance,
LXX(5), 2309–2346.
Aminadav, G., Bachrach, Y., Konstantin, K., Rosenschein, J. S., & Wilf, Y. (2011).
Rebuilding the Great Pyramids: A method for identifying control relations in
complex ownership structures.
Armstrong, C., Gow, I., & Larcker, D. (2013). The efficacy of shareholder voting:
evidence from equity compensation plans. Journal of Accounting Research, 51(5),
909–950.
Ashraf, R., Jayaramen, N., & Ryan, H. E. jr. (2009). Conflicts of interest and mutual
fund proxy voting : Evidence from shareholder proposals on executive
compensation.
Bachrach, Y., Markakis, E., Resnick, E., Procaccia, A. D., Rosenschein, J. S., & Saberi,
A. (2010). Approximating power indices: theoretical and empirical analysis.
Autonomous Agents and Multi-Agent Systems, 20(2), 105–122.
Becht, M., Franks, J., Mayer, C., & Rossi, S. (2010). Returns to Shareholder Activism :
Evidence from a Clinical Study of the Hermes U.K. Focus Fund. The Review of
Financial Studies, 23(3), 3093–3129.
Becht, M., Polo, A., & Rossi, S. (2016). Does Mandatory Shareholder Voting Prevent
Bad Acquisitions? Review of Financial Studies, 29(11), 3035–3067.
Belcredi, M., & Enriques, L. (2014). Institutional Investor Activism in a Context of
Concentrated Ownership and High Private Benefits of Control : the Case of Italy
(an Corporate Governance Institute (ECGI) - Law Working Paper No. 225/2013).
Bethel, J., & Gillan, S. (2002). The impact of the institutional and regulatory
environment on shareholder voting. Financial Management, 31(4), 29–54.
Cai, J., Garner, J., & Walkling, R. (2009). Electing Directors. The Journal of Finance,
64(5), 2389–2421.
Cai, J., Garner, J., & Walkling, R. (2010). Shareholder Access to the Boardroom : A
Survey of Recent Evidence. Journal of Applied Finance, 20(2), 15–26.
Cai, J., & Walkling, R. A. (2011). Shareholders ’ Say on Pay : Does It Create Value ?
Journal of Financial and Quantitative Analysis, 46(2), 299–339.
Carleton, W. T., Nelson, J. M., & Weisbach, M. S. (1998). The Influence of Institutions
on Corporate Governance through Private Negotiations : Evidence from TIAA-
CREF. The Journal of Finance, 53(4), 1335–1362.
Chen, Z., & Ke, B. (2013). Minority Shareholders’ Control Rights and the Quality of
Corporate Decisions in Weak Investor Protection Countries: A Natural Experiment
from China. The Accounting Review, 88(4), 1211–1238.
Choi, S. J., Fisch, J. E., Kahan, M., & Rock, E. B. (n.d.). Does Majority Voting Improve
Board Accountability ? The University of Chicago Law Review, 83(3), 1119–1180.
Cvijanovi, D., Dasgupta, A., & Zachariadis, K. E. (2016). Ties that Bind : How business
connections affect mutual fund activism. Journal of Finance, 71(6), 2933–2966.
Edelman, P. H., & Thomas, R. S. (2015). The Theory and Practice of Corporate Voting
at U.S. Public Companies. In J. Hill & Thomas Randall (Eds.), The Reasearch
Handbook of Shareholder power. Edgar Elgar.
Edmans, A., & Holderness, C. G. (2017). Blockholders : A Survey of Theory and
Evidence (European Corporate Governance Institute (ECGI) - Finance Working
Paper No. 475/2016).
Felsenthal, D. S., & Machover, M. (2004). A priori voting power : what is it all about ?
Political Studies Review, 2(1), 1–23.
Fischer, P. E., Gramlich, J. D., Miller, B. P., & White, H. D. (2009). Investor
perceptions of board performance : Evidence from uncontested director elections.
Journal of Accounting and Economics, 48(2–3), 172–189.
Fried, J., Kamar, E., & Yafeh, Y. (2016). Empowering Minority Shareholders and
Executive Compensation : Evidence from a Natural Experiment.
Hamdani, A., & Yafeh, Y. (2013). Institutional Investors as Minority Shareholders.
Review of Finance, 17(2), 691–725.
Iliev, P., Lins, K. V., Miller, D. P., & Roth, L. (2015). Shareholder Voting and
Corporate Governance Around the World. Review of Financial Studies, 28(8), 1–
59.
Iliev, P., & Lowry, M. (2015). Are Mutual Funds Active Voters ? The Review of
Financial Studies, 28(2), 446–485.
Iliev, P., & Vitanova, S. (2015). The Effect of the Say-on-Pay Vote in the U.S.
La Porta, R., Florencio, L.-S., Shleifer, A., & Vishny, R. W. (1998). Law and Finance.
Journal of Political Economy, 106(6), 1113–1155.
La Porta, R., Lopez-de-Silanes, F., Shleifer, A., & Vishny, R. (2000). Investor
protection and corporate governance. Journal of Financial Economics, 58(1–2), 3–
27.
Leech, D. (2001). Shareholder Voting Power and Corporate Governance : A Study of
Large British Companies. Nordic Journal If Political Economy, 27(1), 33–54.
Leech, D. (2003). Computing Power Indices for Large Voting Games. Management
Science, 49(6), 831–837.
Listokin, Y. (2008). Management Always Wins the Close Ones. American Law and
Economics Review, 10(2), 159–184.
Massa, M., & Zaldokas, A. (2016). Bankrupt Family Firms.
Matvos, G., & Ostrovsky, M. (2010). Heterogeneity and peer effects in mutual fund
proxy voting. Journal of Financial Economics, 98(1), 90–112.
Maug, E., & Rydqvist, K. (2009). Do Shareholders Vote Strategically? Voting
Behavior, Proposal Screening, and Majority Rules. Review of Finance, 13(1), 47–
79.
McCahery, J. A., & Sautner, Z. (2011). Institutional Investor Preferences and Executive
Compensation (European Banking Center Discussion Paper No. 2012–2).
Mugerman, Y., Sade, O., & Shayo, M. (2014). Long term savings decisions : Financial
reform , peer effects and ethnicity. Journal of Economic Behavior and
Organization, 106, 235–253.
Schwartz-Ziv, M., & Wermers, R. (2016). Do Small Institutional Shareholders Use
Low-Cost Monitoring Opportunities ? Evidence from the Say on Pay Vote.
Varshevsky, D., & Gur Greshgorn, G. (2011). corporate shareholders’ meeting votes:
voting patterns of institutional shareholders and proxy recomendations (Hebrew).
Winter, E. (2002). Chapter 53: “The Shapley Value.” In R. J. Aumann & S. Hart (Eds.),
Handbook of Game Theory with Economic Applications (Vol. 3, pp. 2025–2054).
Elsevier.
Yermack, D. (2010). Shareholder Voting and Corporate Governance. Annual Review of
Financial Economics, 2(1), 2.1-2.23.
Zingales, L. (1995). What determines the value of corporate votes? The Quarterly
Journal of Economics, 110(4), pp. 1047–1073
Figure 1: Weights in voting rights and Power indices under the required support levels of 33% and 50%
Both pies refer to players in the same voting game. Player's voting rights are indicated in the legend, whereas the pies indicate player's voting
power as calculated by Banzhaf index using 33% requires support level versus 50% support level.
38%
19%
14%
9%
9%
8%
3%
support level of 33%
1
2
3
4
5
6
7
Weight
37%
17%
14%
10%
9%
8%
3%
54%
11%
11%
8%
8%6%
2%
support level of 50%
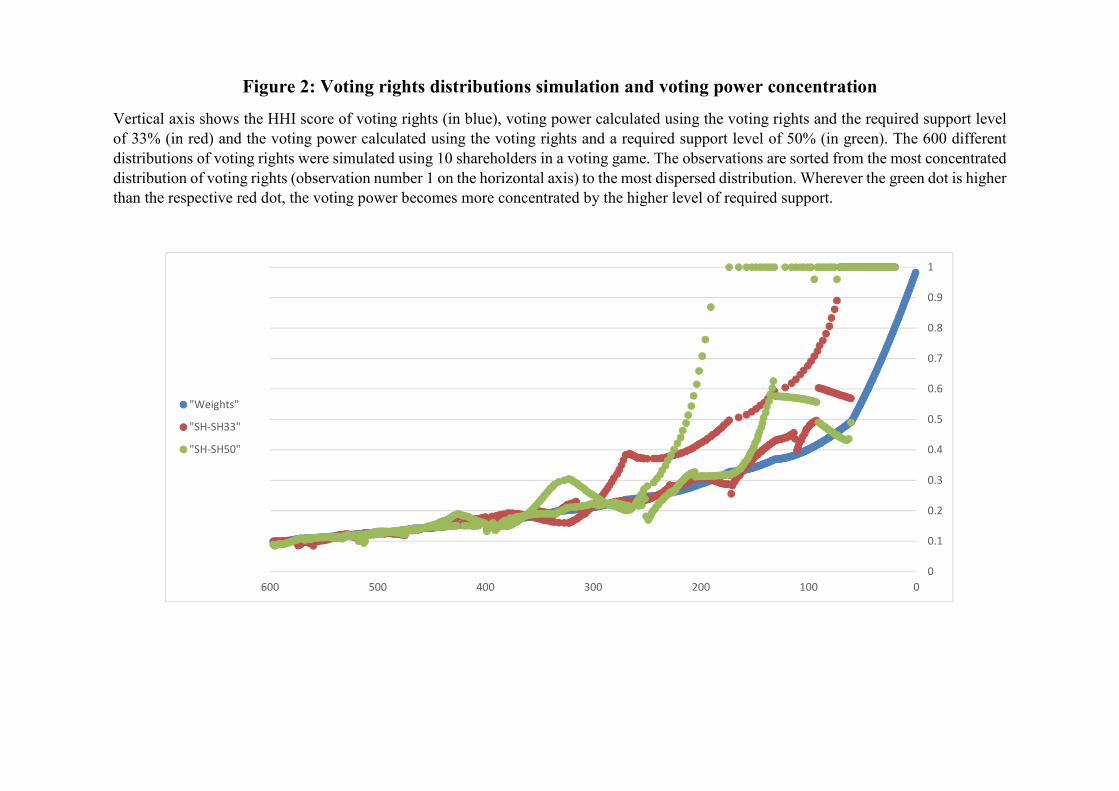
Figure 2: Voting rights distributions simulation and voting power concentration
Vertical axis shows the HHI score of voting rights (in blue), voting power calculated using the voting rights and the required support level
of 33% (in red) and the voting power calculated using the voting rights and a required support level of 50% (in green). The 600 different
distributions of voting rights were simulated using 10 shareholders in a voting game. The observations are sorted from the most concentrated
distribution of voting rights (observation number 1 on the horizontal axis) to the most dispersed distribution. Wherever the green dot is higher
than the respective red dot, the voting power becomes more concentrated by the higher level of required support.
0
0.1
0.2
0.3
0.4
0.5
0.6
0.7
0.8
0.9
1
0100200300400500600
"Weights"
"SH-SH33"
"SH-SH50"
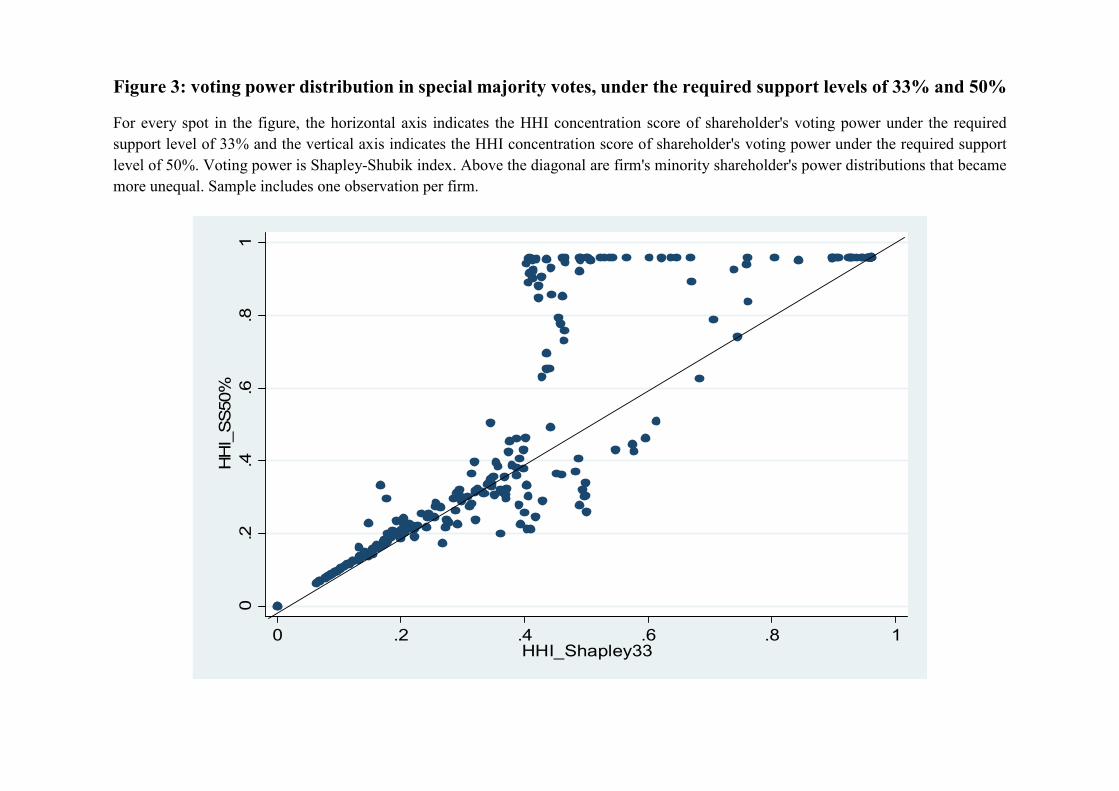
Figure 3: voting power distribution in special majority votes, under the required support levels of 33% and 50%
For every spot in the figure, the horizontal axis indicates the HHI concentration score of shareholder's voting power under the required
support level of 33% and the vertical axis indicates the HHI concentration score of shareholder's voting power under the required support
level of 50%. Voting power is Shapley-Shubik index. Above the diagonal are firm's minority shareholder's power distributions that became
more unequal. Sample includes one observation per firm.
0.2
.4.6
.81
HH
I_S
S50%
0 .2 .4 .6 .8 1HHI_Shapley33
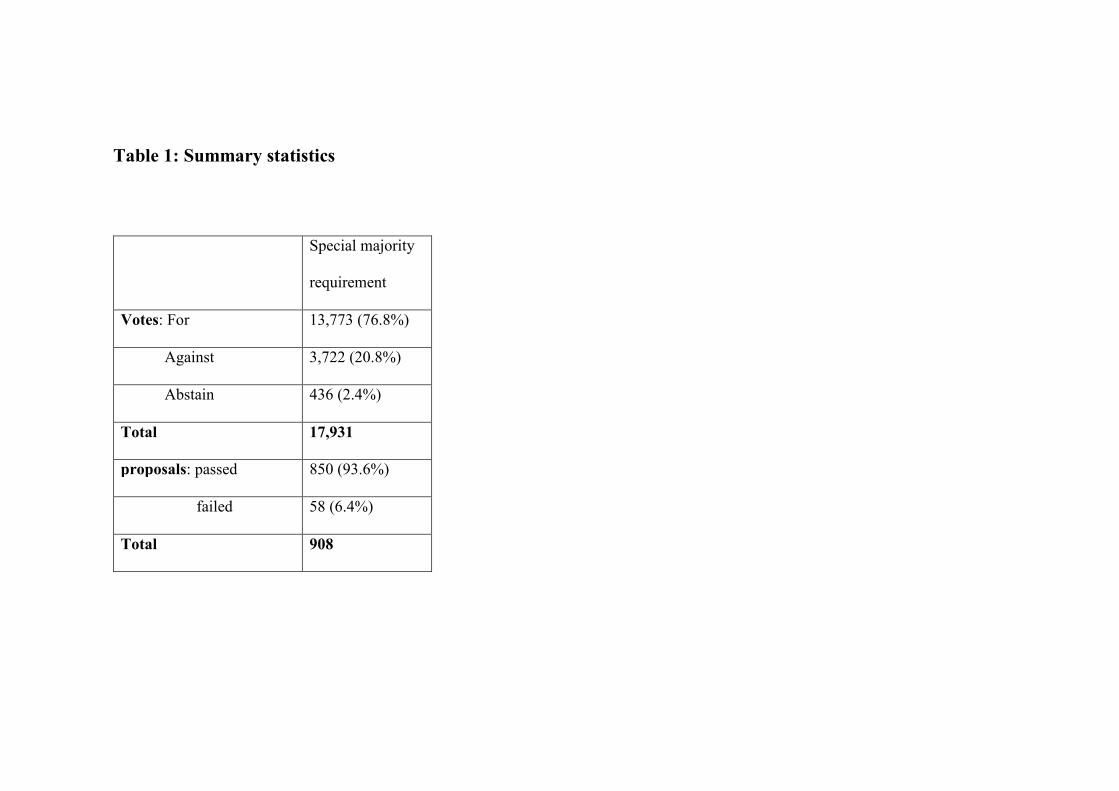
Table 1: Summary statistics
Special majority
requirement
Votes: For 13,773 (76.8%)
Against 3,722 (20.8%)
Abstain 436 (2.4%)
Total 17,931
proposals: passed 850 (93.6%)
failed 58 (6.4%)
Total 908
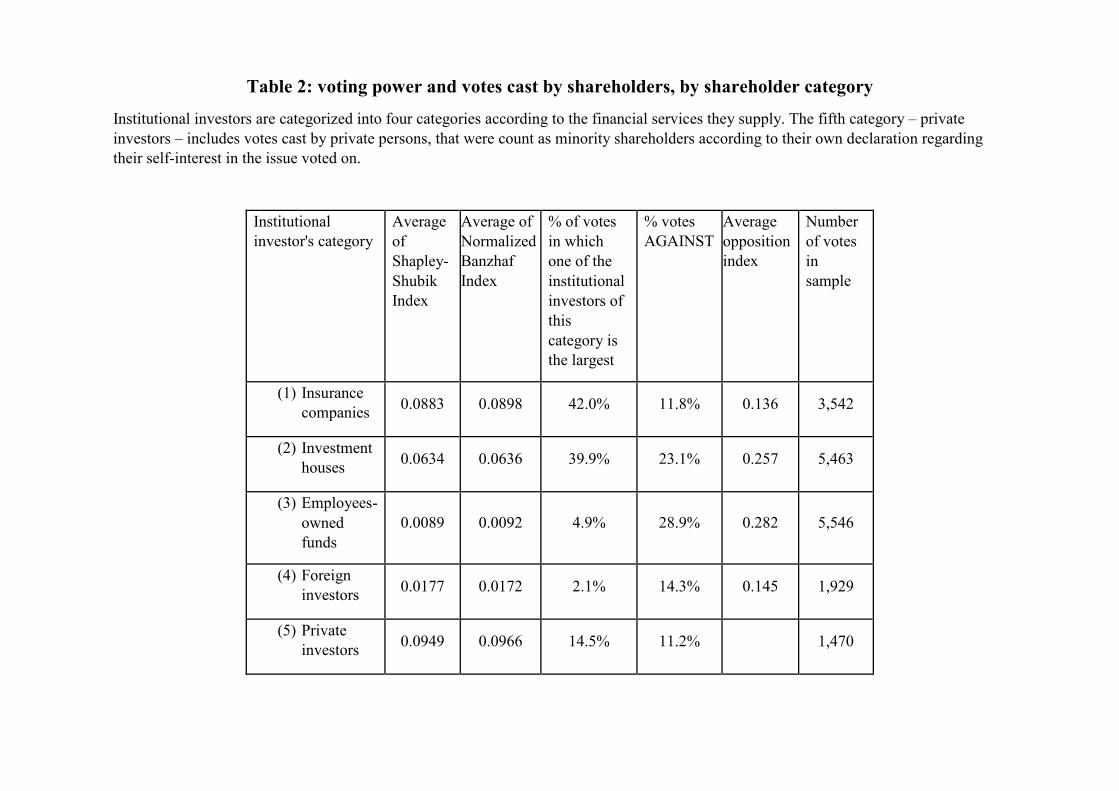
Table 2: voting power and votes cast by shareholders, by shareholder category
Institutional investors are categorized into four categories according to the financial services they supply. The fifth category – private
investors – includes votes cast by private persons, that were count as minority shareholders according to their own declaration regarding
their self-interest in the issue voted on.
Institutional
investor's category
Average
of
Shapley-
Shubik
Index
Average of
Normalized
Banzhaf
Index
% of votes
in which
one of the
institutional
investors of
this
category is
the largest
% votes
AGAINST
Average
opposition
index
Number
of votes
in
sample
(1) Insurance
companies 0.0883 0.0898 42.0% 11.8% 0.136 3,542
(2) Investment
houses 0.0634 0.0636 39.9% 23.1% 0.257 5,463
(3) Employees-
owned
funds
0.0089 0.0092 4.9% 28.9% 0.282 5,546
(4) Foreign
investors 0.0177 0.0172 2.1% 14.3% 0.145 1,929
(5) Private
investors 0.0949 0.0966 14.5% 11.2% 1,470
Table 3: List of all issues in the database, and the required support level, before and after amendment 16.
Issue Required support level
before amendment 16
Required support
level after
amendment 16
(1A) Direct or indirect self-dealing by controlling shareholders or their relatives –
compensation related
1/3 of disinterested
(minority) shareholders 1/2 instead of 1/3
(1B) Direct or indirect self-dealing by controlling shareholders or their relatives –
related party transactions
(2) Waivers of the duty of care, liability insurance, and indemnification when the
beneficiaries include controlling shareholders or their relatives
(3) electing outside directors 1/3 of disinterested
(minority) shareholders, not
including control holders
1/2 instead of 1/3
(4A) CEO/Chairperson unification+
(4B) relatives CEO and Chairperson
2/3 of disinterested
(minority) shareholders
2/3 of disinterested
(minority)
shareholders, not
including self-
related
(5) charter and bylaws amendments Supermajority (75%) Supermajority (75%)
& majority of the
minority
(6) mergers approval or acquisition proposal Supermajority (75%) Supermajority (75%)
& majority of the
minority
(7) Executive compensation for professional managers or directors Regular majority Majority of minority
and say on pay
(amendment 2035)
(7A) private assignment of shares or options Regular majority Majority of minority
and say on pay
(amendment 2035)
(8) Compensation plans for board members Regular majority Majority of minority
and say on pay
(amendment 20)
(9) Electing directors and auditors Regular majority Regular majority
(10) Liability waivers, liability insurance, and indemnification for directors or
officers who are not related to the controlling shareholders
Regular majority Regular majority
(0) All other proposals: increasing the firm's authorized capital, ratifying
dividends, etc.
Regular majority Regular majority
35 Amendment 20 to the company's law passed on Dec. 12 2012 and related to all executive compensation and the compensation policy of the company.
Table 4: votes for and against a management-sponsored proposal, by proposal issue
Against For Proposed Issue
3,722 (21.3%) 13,773 (78.7%) Total Special majority
1,033 (33.6%) 2,037 (66.4%) Controlling Shareholders Compensation (1A)
682 (23.3%) 2,250 (76.7%) Related Party Transaction (1B)
677 (19.2%) 2,842 (80.8%) Waivers of duty (2)
377 (7.3%) 4,820 (92.7%) External director elections (3)
55 (33.3%) 110 (66.7%) Unification of CEO & Chairman (4A+4B)
263 (30.8%) 590 (69.2%) Charter and bylaws amendments (5)
46 (44.2%) 58 (55.8%) Mergers & Acquisitions (6)
589 (35.6%) 1,066 (64.4%) Executive (including board members)
compensation (7,8)
Table 5, panel A:
Voting power and shareholder's characteristics relation to the probability to vote "against"
Logistic regressions. Dependent variable is "vote against". Power index is Shapley-Shubik index. Same
regressions with Normalized Banzhaf indices show very similar results. Shareholder categories are dummy
variables for the 3 categories: insurance companies, investment houses and employee owned funds,
respectively. Omitted category is foreign investors. Standard errors are in parenthesis. Firm's size (capital in
December 2012) and profitability (ROE for 2012) data is taken from the SuperAnalyst information system.
***, ** and * denote statistical significance at the 1, 5 and 10% levels, respectively.
Logistic regression :Vote
(1=against)
(1) (2) (3) (4) (5)
Power Index -1.644***
(0.191)
-1.074***
(0.182)
-1.764***
(0.567)
-2.297***
(0.653)
-2.310***
(0.650)
Shareholder Category 1:
Insurance company
-0.142*
(0.075)
-0.207***
(0.081)
-0.225***
(0.084)
-0.218***
(0.084)
Shareholder Category 2:
Investment house
0.660***
(0.062)
0.632***
(0.066)
0.570***
(0.068)
0.570***
(0.068)
Shareholder Category 3:
Employee owned fund
0.893***
(0.061)
0.905***
(0.064)
0.911***
(0.066)
0.913***
(0.066)
Power Index x Insurance
company
1.289**
(0.648)
1.337*
(0.751)
1.343*
(0.748)
Power Index x Investment
houses
0.793
(0.615)
0.973
(0.711)
1.001
(0.708)
Power Index x Employee
owned fund
-4.781***
(1.716)
-5.074***
(1.938)
-4.965***
(1.932)
Log(Capital) DEC2012
-0.047***
(0.012)
-0.046***
(0.012)
ROE 2012 -0.059
(0.168)
-0.093
(0.168)
2013 year dummy 0.121***
(0.041)
Constant -1.254***
(0.020)
-1.786***
(0.053)
-1.76***
(0.055)
-1.082***
(0.178)
-1.137***
(0.179)
Observations 16,943 16,943 16,943 15,566 15,566
Pseudo R2 0.0058 0.0313 0.0326 0.0342 0.0348
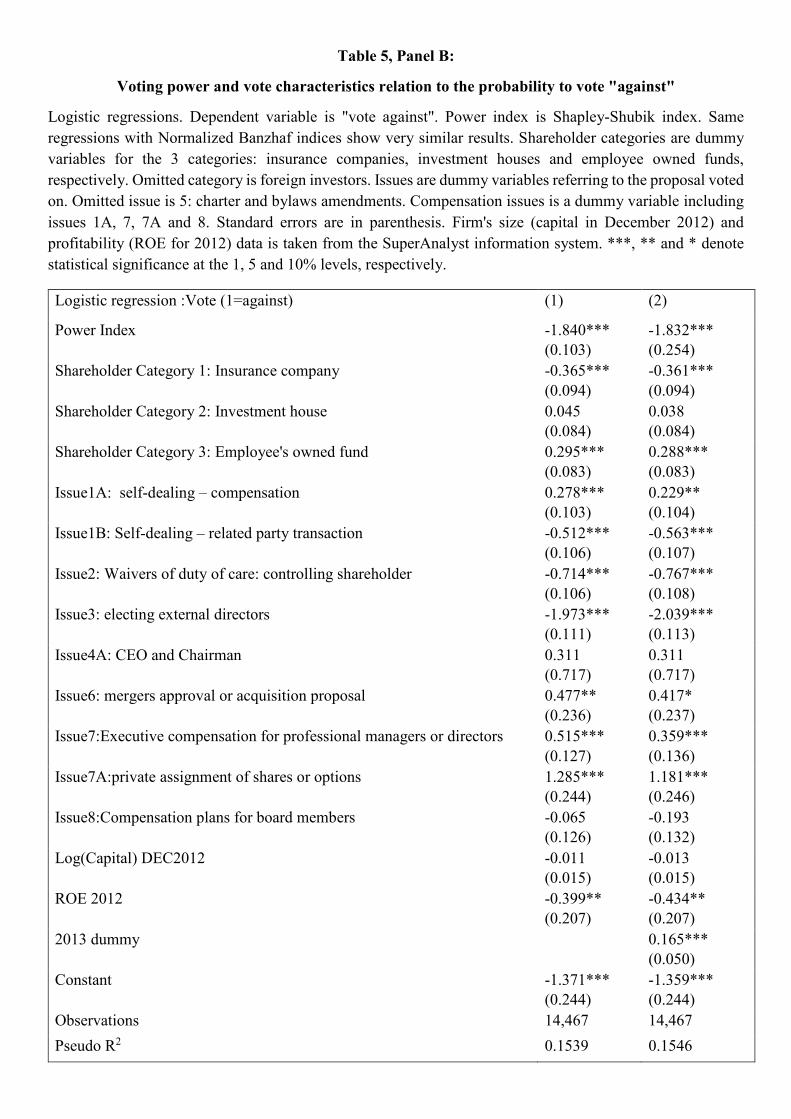
Table 5, Panel B:
Voting power and vote characteristics relation to the probability to vote "against"
Logistic regressions. Dependent variable is "vote against". Power index is Shapley-Shubik index. Same
regressions with Normalized Banzhaf indices show very similar results. Shareholder categories are dummy
variables for the 3 categories: insurance companies, investment houses and employee owned funds,
respectively. Omitted category is foreign investors. Issues are dummy variables referring to the proposal voted
on. Omitted issue is 5: charter and bylaws amendments. Compensation issues is a dummy variable including
issues 1A, 7, 7A and 8. Standard errors are in parenthesis. Firm's size (capital in December 2012) and
profitability (ROE for 2012) data is taken from the SuperAnalyst information system. ***, ** and * denote
statistical significance at the 1, 5 and 10% levels, respectively.
Logistic regression :Vote (1=against) (1) (2)
Power Index -1.840***
(0.103)
-1.832***
(0.254)
Shareholder Category 1: Insurance company -0.365***
(0.094)
-0.361***
(0.094)
Shareholder Category 2: Investment house 0.045
(0.084)
0.038
(0.084)
Shareholder Category 3: Employee's owned fund 0.295***
(0.083)
0.288***
(0.083)
Issue1A: self-dealing – compensation 0.278***
(0.103)
0.229**
(0.104)
Issue1B: Self-dealing – related party transaction -0.512***
(0.106)
-0.563***
(0.107)
Issue2: Waivers of duty of care: controlling shareholder -0.714***
(0.106)
-0.767***
(0.108)
Issue3: electing external directors -1.973***
(0.111)
-2.039***
(0.113)
Issue4A: CEO and Chairman 0.311
(0.717)
0.311
(0.717)
Issue6: mergers approval or acquisition proposal 0.477**
(0.236)
0.417*
(0.237)
Issue7:Executive compensation for professional managers or directors 0.515***
(0.127)
0.359***
(0.136)
Issue7A:private assignment of shares or options 1.285***
(0.244)
1.181***
(0.246)
Issue8:Compensation plans for board members -0.065
(0.126)
-0.193
(0.132)
Log(Capital) DEC2012 -0.011
(0.015)
-0.013
(0.015)
ROE 2012 -0.399**
(0.207)
-0.434**
(0.207)
2013 dummy 0.165***
(0.050)
Constant -1.371***
(0.244)
-1.359***
(0.244)
Observations 14,467 14,467
Pseudo R2 0.1539 0.1546
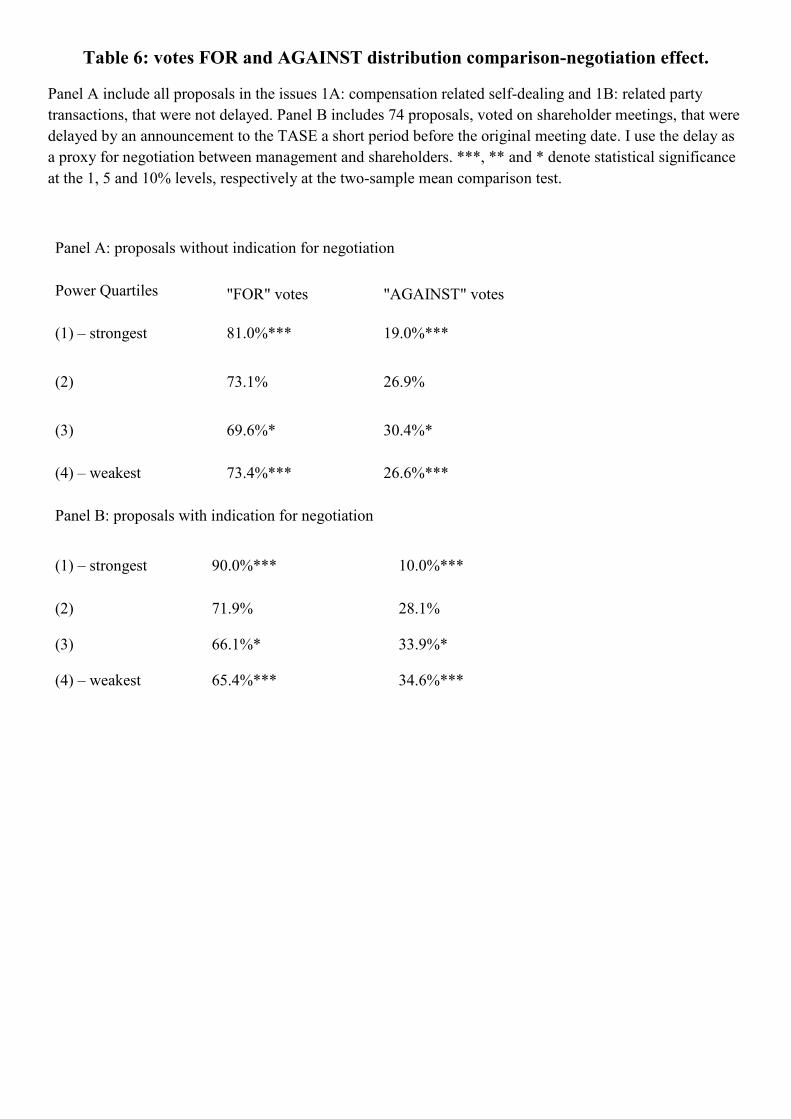
Table 6: votes FOR and AGAINST distribution comparison-negotiation effect.
Panel A include all proposals in the issues 1A: compensation related self-dealing and 1B: related party
transactions, that were not delayed. Panel B includes 74 proposals, voted on shareholder meetings, that were
delayed by an announcement to the TASE a short period before the original meeting date. I use the delay as
a proxy for negotiation between management and shareholders. ***, ** and * denote statistical significance
at the 1, 5 and 10% levels, respectively at the two-sample mean comparison test.
Panel A: proposals without indication for negotiation
Power Quartiles "FOR" votes "AGAINST" votes
(1) – strongest 81.0%*** 19.0%***
(2) 73.1% 26.9%
(3) 69.6%* 30.4%*
(4) – weakest 73.4%*** 26.6%***
Panel B: proposals with indication for negotiation
(1) – strongest 90.0%*** 10.0%***
(2) 71.9% 28.1%
(3) 66.1%* 33.9%*
(4) – weakest 65.4%*** 34.6%***
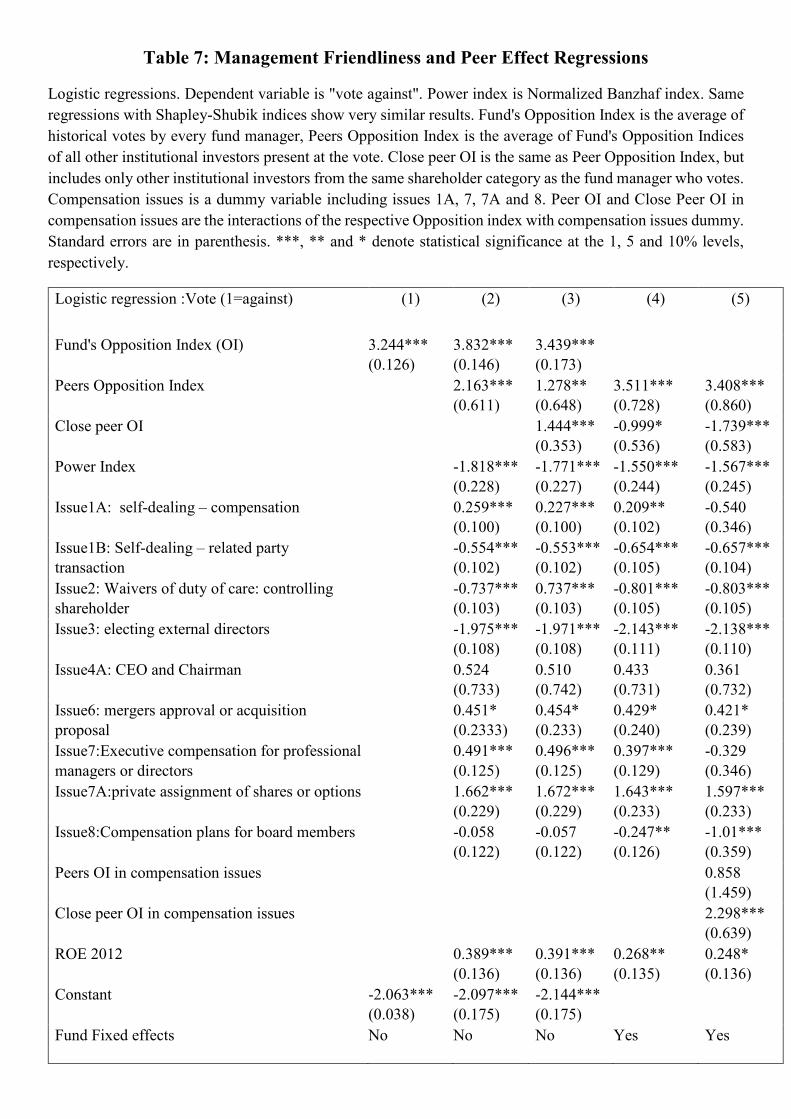
Table 7: Management Friendliness and Peer Effect Regressions
Logistic regressions. Dependent variable is "vote against". Power index is Normalized Banzhaf index. Same
regressions with Shapley-Shubik indices show very similar results. Fund's Opposition Index is the average of
historical votes by every fund manager, Peers Opposition Index is the average of Fund's Opposition Indices
of all other institutional investors present at the vote. Close peer OI is the same as Peer Opposition Index, but
includes only other institutional investors from the same shareholder category as the fund manager who votes.
Compensation issues is a dummy variable including issues 1A, 7, 7A and 8. Peer OI and Close Peer OI in
compensation issues are the interactions of the respective Opposition index with compensation issues dummy.
Standard errors are in parenthesis. ***, ** and * denote statistical significance at the 1, 5 and 10% levels,
respectively.
Logistic regression :Vote (1=against) (1) (2) (3) (4) (5)
Fund's Opposition Index (OI) 3.244***
(0.126)
3.832***
(0.146)
3.439***
(0.173)
Peers Opposition Index 2.163***
(0.611)
1.278**
(0.648)
3.511***
(0.728)
3.408***
(0.860)
Close peer OI 1.444***
(0.353)
-0.999*
(0.536)
-1.739***
(0.583)
Power Index -1.818***
(0.228)
-1.771***
(0.227)
-1.550***
(0.244)
-1.567***
(0.245)
Issue1A: self-dealing – compensation 0.259***
(0.100)
0.227***
(0.100)
0.209**
(0.102)
-0.540
(0.346)
Issue1B: Self-dealing – related party
transaction
-0.554***
(0.102)
-0.553***
(0.102)
-0.654***
(0.105)
-0.657***
(0.104)
Issue2: Waivers of duty of care: controlling
shareholder
-0.737***
(0.103)
0.737***
(0.103)
-0.801***
(0.105)
-0.803***
(0.105)
Issue3: electing external directors -1.975***
(0.108)
-1.971***
(0.108)
-2.143***
(0.111)
-2.138***
(0.110)
Issue4A: CEO and Chairman 0.524
(0.733)
0.510
(0.742)
0.433
(0.731)
0.361
(0.732)
Issue6: mergers approval or acquisition
proposal
0.451*
(0.2333)
0.454*
(0.233)
0.429*
(0.240)
0.421*
(0.239)
Issue7:Executive compensation for professional
managers or directors
0.491***
(0.125)
0.496***
(0.125)
0.397***
(0.129)
-0.329
(0.346)
Issue7A:private assignment of shares or options 1.662***
(0.229)
1.672***
(0.229)
1.643***
(0.233)
1.597***
(0.233)
Issue8:Compensation plans for board members -0.058
(0.122)
-0.057
(0.122)
-0.247**
(0.126)
-1.01***
(0.359)
Peers OI in compensation issues 0.858
(1.459)
Close peer OI in compensation issues 2.298***
(0.639)
ROE 2012 0.389***
(0.136)
0.391***
(0.136)
0.268**
(0.135)
0.248*
(0.136)
Constant -2.063***
(0.038)
-2.097***
(0.175)
-2.144***
(0.175)
Fund Fixed effects No No No Yes Yes

Observations 16,044 14,669 14,669 14,602 14,584
Pseudo R2 0.0404 0.1493 0.1504 0.1192 0.12