voya financials1.q4cdn.com/733568831/files/doc_presentations/voya-2q14-analyst... · company...
TRANSCRIPT

Second Quarter 2014 Investor Presentation Voya Financial
August 6, 2014
This presentation and the remarks made orally contain forward-looking statements. Forward-looking statements include statements relating to future developments in our business or expectations for our future financial performance and any statement not involving a historical fact. Forward-looking statements use words such as “anticipate,” “believe,” “estimate,” “expect,” “intend,” “plan,” and other words and terms of similar meaning in connection with a discussion of future operating or financial performance. Actual results, performance or events may differ materially from those projected in any forward-looking statement due to, among other things, (i) general economic conditions, particularly economic conditions in our core markets, (ii) performance of financial markets, including emerging markets, (iii) the frequency and severity of insured loss events, (iv) mortality and morbidity levels, (v) persistency and lapse levels, (vi) interest rates, (vii) currency exchange rates, (viii) general competitive factors, (ix) changes in laws and regulations and (x) changes in the policies of governments and/or regulatory authorities. Factors that may cause actual results to differ from those in any forward-looking statement also include those described “Risk Factors,” “Management’s Discussion and Analysis of Results of Operations and Financial Condition—Trends and Uncertainties” and “Business—Closed Blocks—Closed Block Variable Annuity” in our Annual Report on Form 10-K for the year ended December 31, 2013 as filed with the Securities and Exchange Commission on March 10, 2014, and in our quarterly report on Form 10-Q for the three months ended March 31, 2014 as filed with the Securities and Exchange Commission on May 12, 2014. This presentation and the remarks made orally contain certain non-GAAP financial measures. Information regarding these non-GAAP financial measures, including reconciliations to the most directly comparable GAAP financial measures, is provided in the press release issued on August 6, 2014 and Voya Financial’s Quarterly Investor Supplement for the three months ended June 30, 2014, which are available at the Investor Relations section of Voya Financial’s website at investors.voya.com. This presentation and the remarks made orally include certain statutory financial results of our insurance company subsidiaries for the quarter ended June 30, 2014. These results are still being finalized, and are therefore preliminary and subject to change.
Forward-Looking and Other Cautionary Statements
2
Agenda
1. Key Highlights Rod Martin, Chairman and Chief Executive Officer
2. Executing Our Return on Equity (ROE) / Return on Capital (ROC) Improvement Plan Alain Karaoglan, Chief Operating Officer
3. Business Operating and Balance Sheet Metrics Ewout Steenbergen, Chief Financial Officer
3

Key Developments
4
Improved Rating Agency Outlook Moody’s and A.M. Best raised Voya Financial’s ratings outlook to positive
Share Repurchase An additional $500 million authorization for share buybacks; $289 million
repurchased as of June 30, 2014 under original $300 million authorization
CBVA Strategic Initiatives Enhanced Annuitization Offer prospectus supplement declared effective by
the SEC Milliman outsourcing agreement executed
Initiating Advertising Rebranding Approximately $100 million advertising rebranding investment planned over
the next 2.5 years
ROE Improvement Continued progress toward 2016 Ongoing Business Adjusted Operating ROE
goal of 12-13%

Second Quarter 2014 Financial Highlights
Closed Block Variable Annuity Performance
After-tax Operating Earnings1
Net Income Available to Common Shareholders1
Ongoing Business Adjusted Operating Earnings (pre-tax)
Ongoing Business 2Q’14 TTM2 Adjusted Operating
Return on Equity
$213 million or $0.83 per diluted share
$207 million or $0.81 per diluted share ex-DAC unlocking
$246 million driven by strong Ongoing Business operating earnings
$346 million
10.7%, up from 10.3% for 1Q’14 TTM
Protected regulatory and rating agency capital from market movements
1. Voya Financial assumes a 35% tax rate on items described as “after-tax.” The 35% tax rate does not reflect actual tax expenses or benefits, including the benefit from recognizing certain deferred tax assets. Net income available to common shareholders reflects the actual effective tax rate
2. Trailing twelve month calculation
5

Premier Franchise with Diverse Earnings
2Q’14 TTM1 Ongoing Business Adjusted Operating Earnings Before Income Taxes2: $1,264 million
Retirement Solutions Leading provider of full service and administrative retirement products
and services for organizations across all markets as well as
individuals
Insurance Solutions Top-tier provider of life insurance
for individuals and comprehensive employee benefits for businesses
Investment Management Prominent multi-asset, multi-channel active asset manager for institutions
and individuals
74% from Retirement Solutions and
Investment Management
Access to 13 million customers3
more than 220,000 points of distribution3
with total AUM and AUA of $525 billion4
1. Trailing twelve months calculation 2. Ongoing Business reflects Retirement, Annuities, Investment Management, Individual Life, and Employee Benefits segments; adjustments are to exclude DAC/VOBA and other intangibles unlocking, the net gain included in
operating earnings from a distribution of cash and securities in conjunction with a Lehman Brothers bankruptcy settlement and the loss recognized as a result of the decision to dispose of certain Low Income Housing tax credit partnerships as a means of exiting this asset class
3. As of December 31, 2013 4. As of June 30, 2014; includes Closed Blocks
6
Retirement Solutions
58%
Inv. Mgmt.16%
Insurance Solutions
26%
7
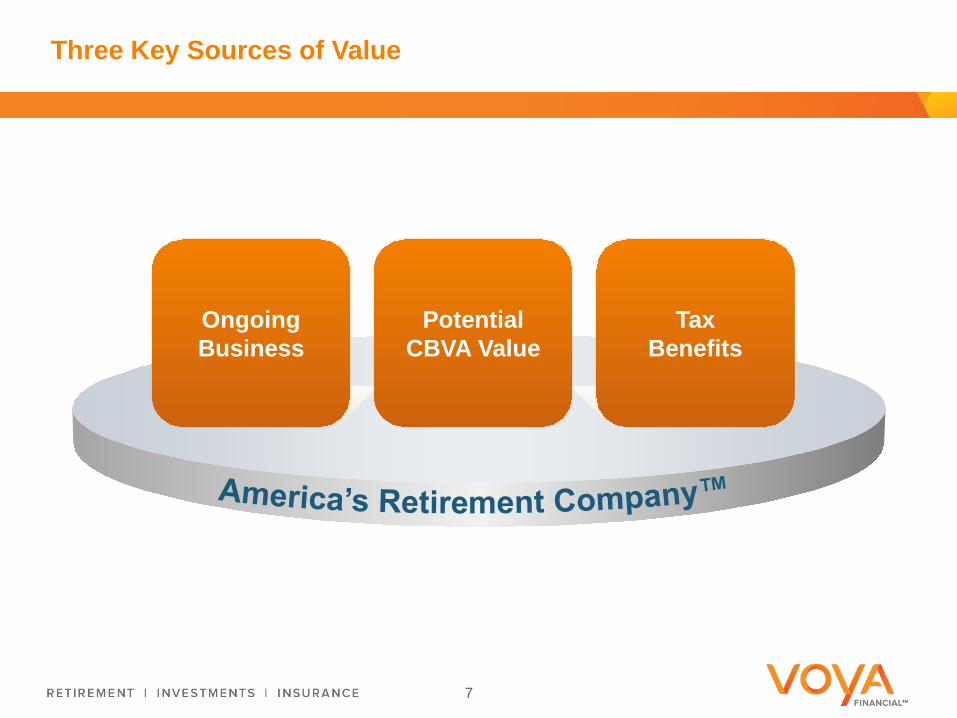
Three Key Sources of Value
Potential CBVA Value
Tax Benefits
Ongoing Business
Agenda
1. Key Highlights Rod Martin, Chairman and Chief Executive Officer
2. Executing Our Return on Equity (ROE) / Return on Capital (ROC) Improvement Plan Alain Karaoglan, Chief Operating Officer
3. Business Operating and Balance Sheet Metrics Ewout Steenbergen, Chief Financial Officer
8

7.6% 8.3% 9.8%
10.3%
FY'11 FY'12 FY'13 2Q'14TTM
2016Target
Ongoing Business Adjusted Operating Return on Equity and Return on Capital Remain on Track to Meet 2016 Target
Ongoing Business1 Adjusted Operating ROC3 Ongoing Business1 Adjusted Operating ROE2
12.0-13.0%
9
10.3%
4
10.7%
6.6% 7.2% 8.2%
8.6%
FY'11 FY'12 FY'13 2Q'14TTM
2016Target
1. Ongoing Business includes Retirement, Annuities, Investment Management, Individual Life, and Employee Benefits segments 2. Ongoing Business adjusted operating earnings is calculated using the operating earnings (loss) before income taxes for the Ongoing Business, excluding DAC/VOBA unlocking, the impact of portfolio restructuring in 2012,
the gain associated with a Lehman Brothers bankruptcy settlement, and the loss recognized as a result of marking low income housing tax credit partnerships to the sales price associated with their disposition. Ongoing Business adjusted operating ROE is then calculated by dividing the after-tax adjusted operating earnings (loss) (using a pro forma effective tax rate of 35% and applying a pro forma allocation of interest expense) by the average capital allocated to the Ongoing Business reflecting an allocation of pro forma debt. Assumes debt-to-capital ratio of 25% for all periods presented, a weighted average pre-tax interest rate of 5.5% for all periods prior to the third quarter of 2013, during which the Company completed its recapitalization initiatives, and the actual weighted average pre-tax interest rate for all periods starting with the third quarter of 2013
3. We calculate Ongoing Business adjusted operating return on capital by dividing Ongoing Business adjusted operating earnings before interest and after income taxes (using a pro forma effective tax rate of 35%) by average capital allocated to the Ongoing Business
4. Trailing twelve months calculation
4
10.0-11.0%
8.6% 8.9%
Items we do not expect to recur at the same levels
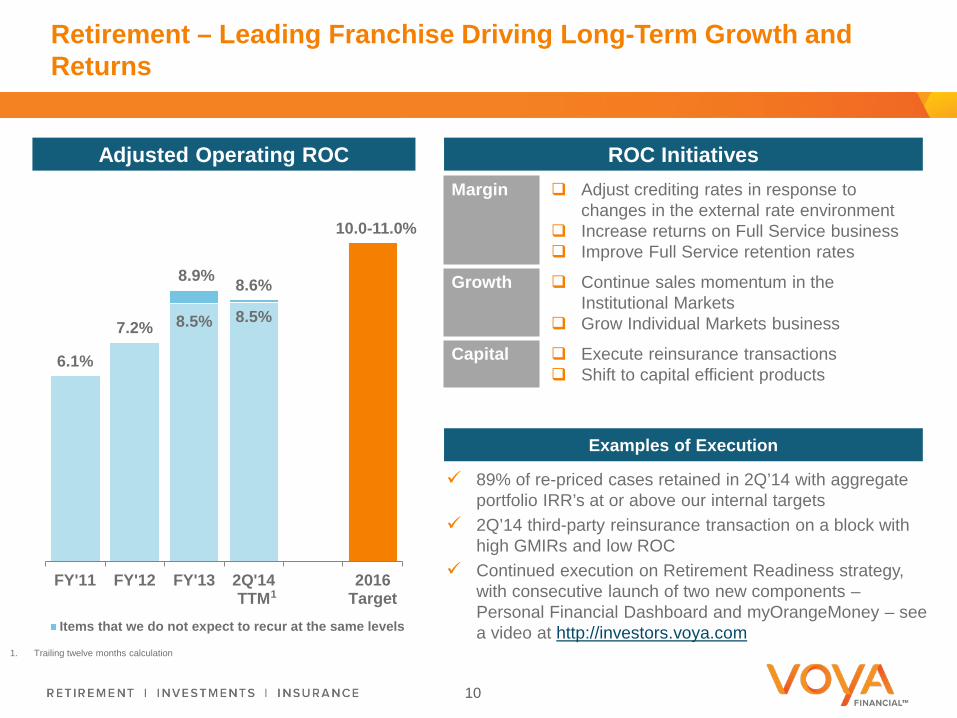
8.5% 8.5%
6.1%
7.2%
8.9% 8.6%
0.0%
10.5%
FY'11 FY'12 FY'13 2Q'14TTM
2016Target
Items that we do not expect to recur at the same levels
Retirement – Leading Franchise Driving Long-Term Growth and Returns
ROC Initiatives Adjusted Operating ROC
Examples of Execution
89% of re-priced cases retained in 2Q’14 with aggregate portfolio IRR’s at or above our internal targets
2Q’14 third-party reinsurance transaction on a block with high GMIRs and low ROC
Continued execution on Retirement Readiness strategy, with consecutive launch of two new components – Personal Financial Dashboard and myOrangeMoney – see a video at http://investors.voya.com
Margin Adjust crediting rates in response to changes in the external rate environment
Increase returns on Full Service business Improve Full Service retention rates
Growth Continue sales momentum in the Institutional Markets
Grow Individual Markets business
Capital Execute reinsurance transactions Shift to capital efficient products
10
1
10.0-11.0%
1. Trailing twelve months calculation

6.8% 7.5%
3.3%
5.9%
7.3% 7.8% 8.0%
FY'11 FY'12 FY'13 2Q'14TTM
2016Target
Items that we do not expect to recur at the same levels
Annuities – Selective Growth While Running Off Less Profitable Business
ROC Initiatives Adjusted Operating ROC
Examples of Execution
Enhancing our FIA product suite and expanding our distribution reach with a renewed focus on the broker/dealer channel
Filing of structured product annuity with SEC
Margin Run off Annual Reset / Multi-Year Guarantee Annuities (products with high fixed rate crediting levels)
Manage crediting rates
Growth Grow sales of higher margin Mutual Fund Custodial product sales and Fixed Indexed Annuities
Capital Execute capital efficient structures
11
1. Trailing twelve months calculation
1
7.0-9.0%

16.3% 18.4%
24.7% 27.7%
17.8%
24.6%
27.7% 31.1% 30%
FY'11 FY'12 FY'13 2Q'14TTM
2016Target
Results from investment capital
Investment Management – Scalable Platform Leveraging Strong Investment Performance
Initiatives Operating Margin
Margin Improve sales force productivity Reduce retail outflows
Growth Increase third-party business Grow in higher-fee asset classes Increase capture of Defined Contribution
Investment Only (DCIO) mandates Replace underperforming non-Voya mutual
fund sub-advisors
1. Excludes gain from Lehman Recovery 2. Trailing twelve months calculation 3. Metrics presented measure each investment product based on (i)rank above the median of its peer category within Morningstar (mutual funds) or eVestment (institutional composites) for unconstrained and fully-
active investment products; or (ii) outperformance against its benchmark index for “index like”, rules based, risk-constrained, or client-specific investment products
12
1 30.0-34.0%
2
Examples of Execution
88% and 99% of fixed income assets outperformed benchmark or peer median returns as of 2Q’14 on a 3-year and 5-year basis, respectively3
79% and 84% of equity assets outperformed benchmark or peer median returns as of 2Q’14 on a 3-year and 5-year basis, respectively3
Continued expense growth discipline supporting business expansion
1
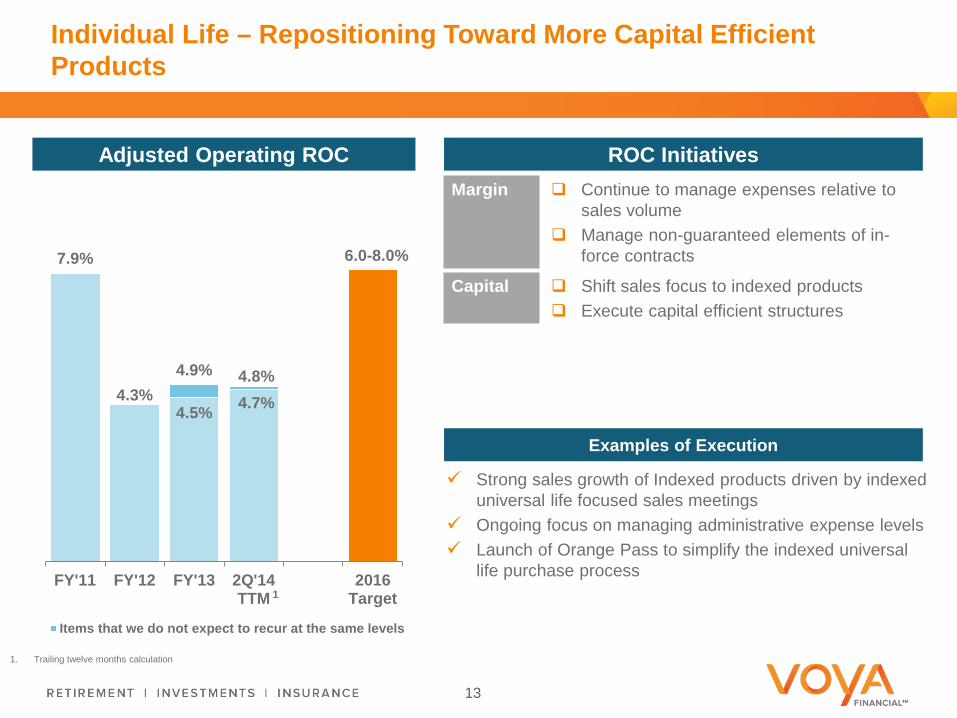
4.5% 4.7%
7.9%
4.3% 4.9% 4.8%
0.0%
8.0%
FY'11 FY'12 FY'13 2Q'14TTM
2016Target
Items that we do not expect to recur at the same levels
Individual Life – Repositioning Toward More Capital Efficient Products
ROC Initiatives Adjusted Operating ROC
Examples of Execution
Strong sales growth of Indexed products driven by indexed universal life focused sales meetings
Ongoing focus on managing administrative expense levels Launch of Orange Pass to simplify the indexed universal
life purchase process
Margin Continue to manage expenses relative to sales volume
Manage non-guaranteed elements of in-force contracts
Capital Shift sales focus to indexed products Execute capital efficient structures
13
1. Trailing twelve months calculation
6.0-8.0%
1

Employee Benefits – High Return and Capital Generation Business
ROC Initiatives Adjusted Operating ROC
Examples of Execution
Launched pilot in June of new Stop Loss and Life renewal packet and voluntary enrollment process to improve retention
On the distribution side, we are expanding our capabilities with consultants, brokers and technology firms to drive growth in Voluntary products.
Supporting sales growth while maintaining expense discipline
Margin Improve loss ratio for Stop Loss policies
Growth Increase persistency and sales in the Group business
Expand the Voluntary business
1. Trailing twelve months calculation
18.1%
21.5%
13.2%
16.9%
18.8%
21.8% 22.0%
FY'11 FY'12 FY'13 2Q'14TTM
2016Target
Items that we do not expect to recur at the same levels
18.0-22.0%
14
1
Agenda
1. Key Highlights Rod Martin, Chairman and Chief Executive Officer
2. Executing Our Return on Equity (ROE) / Return on Capital (ROC) Improvement Plan Alain Karaoglan, Chief Operating Officer
3. Business Operating and Balance Sheet Metrics Ewout Steenbergen, Chief Financial Officer
15
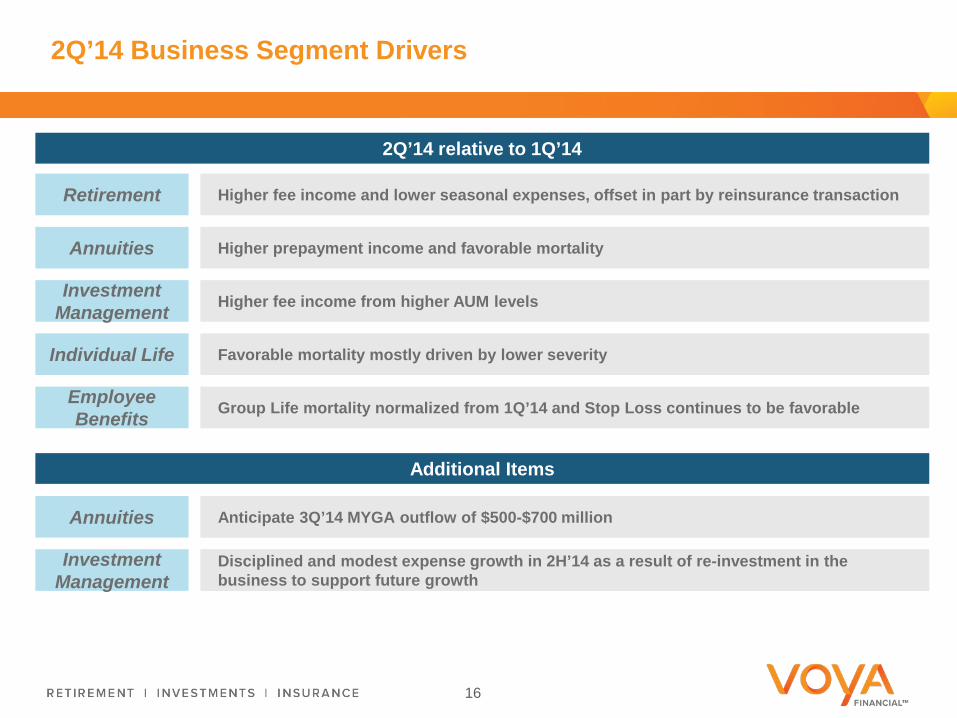
2Q’14 Business Segment Drivers
16
Retirement Higher fee income and lower seasonal expenses, offset in part by reinsurance transaction
2Q’14 relative to 1Q’14
Additional Items
Annuities Higher prepayment income and favorable mortality
Investment Management Higher fee income from higher AUM levels
Individual Life Favorable mortality mostly driven by lower severity
Employee Benefits Group Life mortality normalized from 1Q’14 and Stop Loss continues to be favorable
Annuities Anticipate 3Q’14 MYGA outflow of $500-$700 million
Investment Management
Disciplined and modest expense growth in 2H’14 as a result of re-investment in the business to support future growth
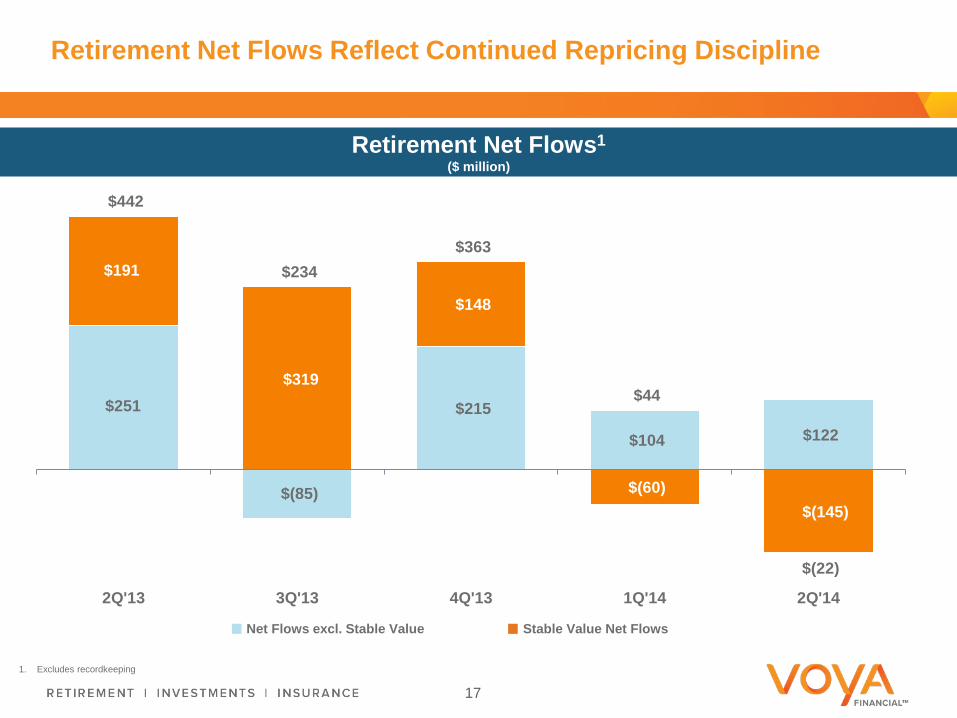
Retirement Net Flows Reflect Continued Repricing Discipline
$251
$(85)
$215
$104 $122
$191
$319
$148
$(60) $(145)
$442
$234 $363
$44
$(22)
2Q'13 3Q'13 4Q'13 1Q'14 2Q'14
Retirement Net Flows1 ($ million)
1. Excludes recordkeeping
17
Net Flows excl. Stable Value Stable Value Net Flows

$169 $137 $153 $23
$126
$(46)
$82
$(82) $(73) $(26)
$(284) $(332)
$(330)
$(233) $(259)
$(244) $(261) $(172)
$55
$(92)
2Q'13 3Q'13 4Q'13 1Q'14 2Q'14
Annuities Growing in Mutual Fund Custodial and Fixed Indexed Products, Running Off Less Profitable Business
Annuities Net Flows1 ($ million)
1. Annual reset (AR) / Multi-year guarantee annuities (MYGA) are in run-off
18
Annual Reset Annuities & Multi-Year Guarantee Annuities Single Premium Immediate Annuities, Payout Annuities & Other Fixed Indexed Annuities Mutual Fund Custodial
$31 $8
$(41)
$120
$146

2Q’13 3Q’13 4Q’13 1Q’14 2Q’14
Sub-Advisor Replacements $0.5 $0.9 $0.0 $4.7 $0.0
Investment Management VA Net Flows
$(0.6) $(0.6) $(0.7) $(0.8) $(0.9)
Total $3.1 $1.8 $0.6 $4.9 $(1.9)
$3.1
$0.7 $1.3 $1.3
($0.6)
$0.9
($0.3)
($0.4)
Investment Management Sourced Net Flows in 2Q’14 Driven By Institutional Mandate Variability
Investment Management Third-Party Net Flows1 ($ billion)
1. Excludes General Account 2. Total Closed Block Variable Annuity net flows were $1.3 billion in 2Q’14, of that $0.9 billion were managed by Investment Management
Affiliate Sourced Investment Management Sourced
19
2
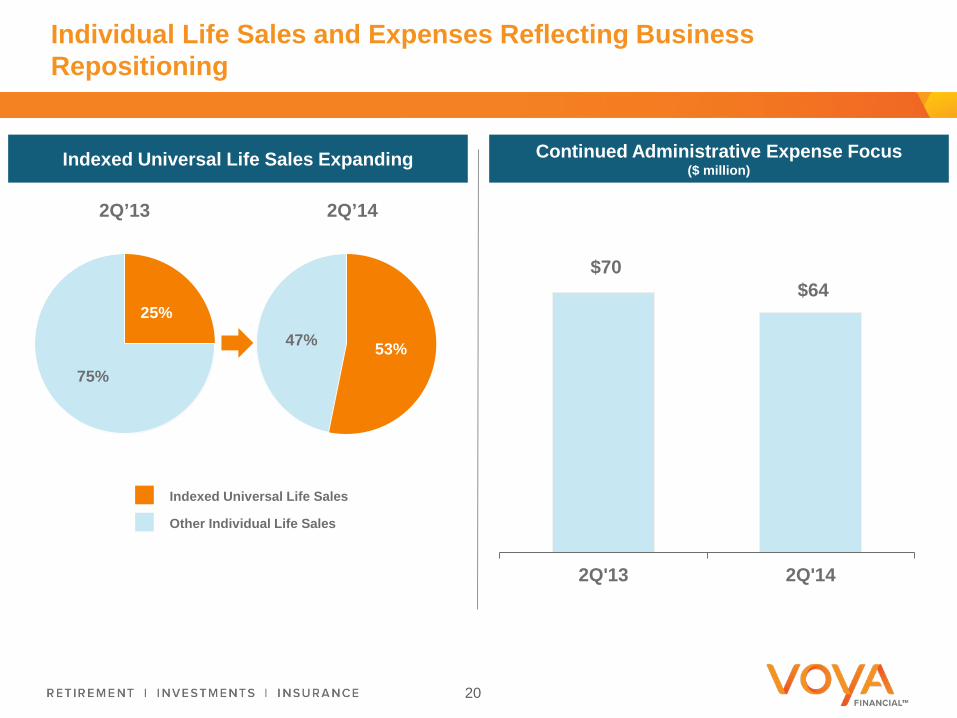
Individual Life Sales and Expenses Reflecting Business Repositioning
Indexed Universal Life Sales Expanding Continued Administrative Expense Focus ($ million)
$70 $64
2Q'13 2Q'14
20
25%
75% 53% 47%
2Q’14 2Q’13
Indexed Universal Life Sales
Other Individual Life Sales
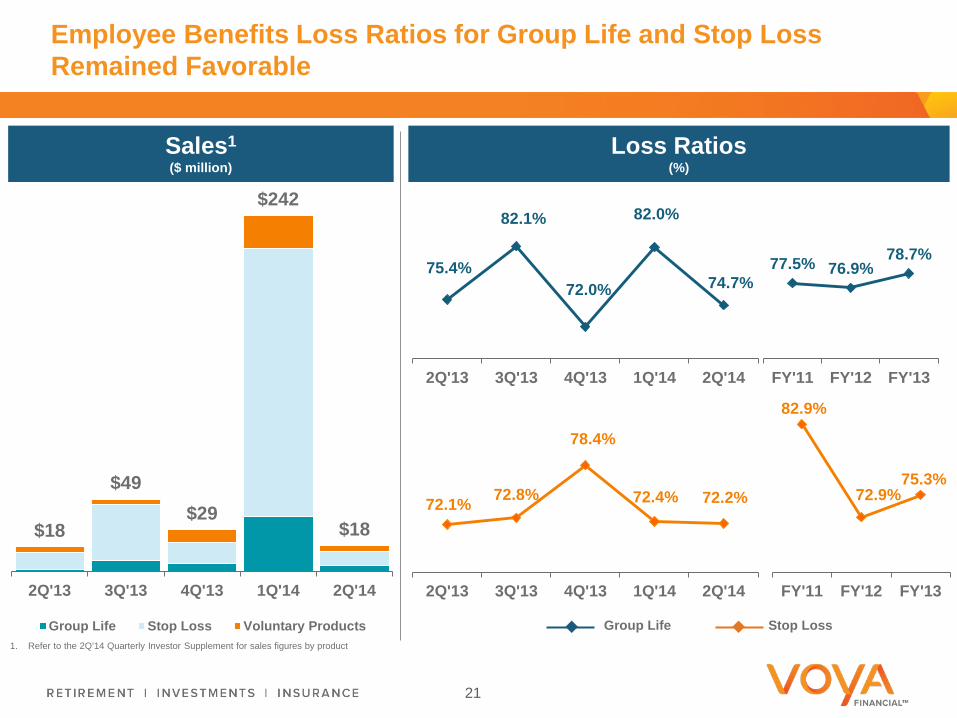
$18
$49 $29
$242
$18
2Q'13 3Q'13 4Q'13 1Q'14 2Q'14
Group Life Stop Loss Voluntary Products
Employee Benefits Loss Ratios for Group Life and Stop Loss Remained Favorable
1. Refer to the 2Q’14 Quarterly Investor Supplement for sales figures by product
Loss Ratios (%)
Sales1 ($ million)
75.4%
82.1%
72.0%
82.0%
74.7%
2Q'13 3Q'13 4Q'13 1Q'14 2Q'14
77.5% 76.9% 78.7%
FY'11 FY'12 FY'13
72.1% 72.8%
78.4%
72.4% 72.2%
2Q'13 3Q'13 4Q'13 1Q'14 2Q'14
82.9%
72.9% 75.3%
FY'11 FY'12 FY'13
Group Life Stop Loss
21

$1.0 $0.2
$1.2 $0.2
$1.0 $1.0 $0.2 $0.6
$(0.8)$(0.1)
$(1.0)$(0.2)
$(0.6) $(0.7)$(0.1) $(0.5)
3Q'12 4Q'12 1Q'13 2Q'13 3Q'13 4Q'13 1Q'14 2Q'14
Active Hedge Program in Closed Block Variable Annuity
Preliminary Impact to Regulatory Capital and Earnings1,2
($ million)
Equity impacts (increase) decrease in stat reserve liability
Equity impacts increase (decrease) in hedge assets
Net Impact (increase / (decrease)) Equity Market (S&P 500) Interest Rates
-25% -15% -5% 5% 15% 25% -1% 1% Regulatory Capital - - - 50 150 200 50 (50)
U.S. GAAP Earnings Before Income Taxes 900 500 100 (200) (500) (700) (350) 200
2Q’14 Results Change in Statutory Reserves Relative to Hedge
($ billion)
Net Impact ($ billion) $0.2 $0.1 $0.2 $0.0 $0.4 $0.3 $0.1 $0.1
1. These sensitivities illustrate the estimated impact of the indicated shocks beginning on the first market trading day following June 30, 2014, and give effect to dynamic rebalancing over the course of the shock event. This reflects the hedging we had in place at the close of business on June 30, 2014 in light of our determination of risk tolerance and available collateral at that time, which may change from time to time. The estimates of equity market shocks reflect a shock to all equity markets, domestic and global, of the same magnitude
2. Actual results will differ due to issues such as basis risk, variance in market volatility versus what is assumed, combined effects of interest rates and equities, rebalancing of hedges in the future, or the effects of time and other variations from assumptions. Additionally, estimated sensitivities vary over time as the market and closed book of business evolve or if assumptions or methodologies that affect sensitivities are refined
22
Estimated available resources of $4.6 billion
Estimated Guaranteed LB Statutory reserves of $2.6 billion
Living Benefit NAR of $2.6 billion
Net Flows of $(1.3) billion, annualized 11.5% of beginning of period assets

Proactive Management Actions in CBVA
Offer May Benefit Contract Owners and Voya Initiative Overview
Potential Benefits to Contract Owners include: Opportunity to receive income prior to the end of the
waiting period Potential for increased amount of guaranteed income Surrender charges waived if applicable
Potential benefits to Voya Financial include: May reduce risk and cost of providing guarantees
under the GMIB Rider Enhances understanding of policyholder behavior Provides insight for consideration of additional
actions or programs to further reduce risk
Prospectus Supplement filed with SEC State filing process commenced
Remaining state approvals expected to be received
Enhancement Offer applies to the 2005 Guaranteed Minimum Income Benefit Rider Series * Those annuitizing during the 60 day Offer window will receive a 10% increase in GMIB Benefit Base
* 2005 GMIB Rider Series includes approximately 36,000 contracts and $3.7 billion of account value as of June 30, 2014
23
MAY 2014
AUGUST 2014
Commencement of 60 day election window SEPTEMBER 2014
Annuitization election takes effect MID-NOVEMBER 2014
Milliman outsourcing agreement executed
Enhanced Annuitization Offer prospectus supplement declared effective by the SEC in July 1
2
Innovative approach to creating a more variable cost structure for a run-off block
Prospectus Supplement declared effective on July 21st Majority of state approvals received
JULY 2014
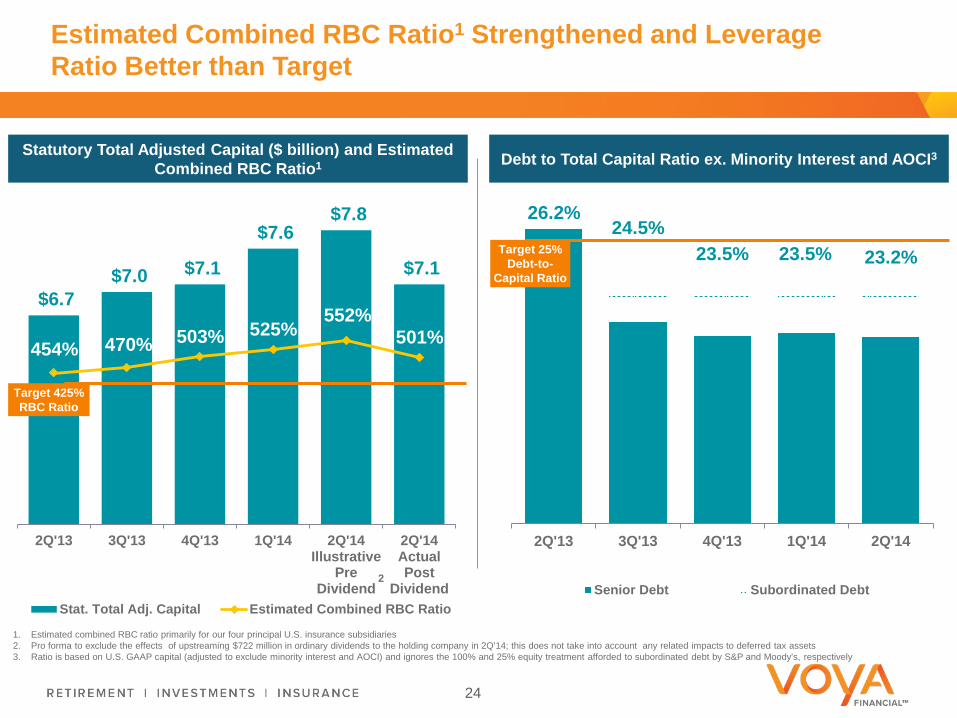
Estimated Combined RBC Ratio1 Strengthened and Leverage Ratio Better than Target
1. Estimated combined RBC ratio primarily for our four principal U.S. insurance subsidiaries 2. Pro forma to exclude the effects of upstreaming $722 million in ordinary dividends to the holding company in 2Q’14; this does not take into account any related impacts to deferred tax assets 3. Ratio is based on U.S. GAAP capital (adjusted to exclude minority interest and AOCI) and ignores the 100% and 25% equity treatment afforded to subordinated debt by S&P and Moody’s, respectively
Statutory Total Adjusted Capital ($ billion) and Estimated Combined RBC Ratio1
$6.7 $7.0 $7.1
$7.6 $7.8
$7.1
454% 470% 503% 525% 552%
501%
2Q'13 3Q'13 4Q'13 1Q'14 2Q'14Illustrative
PreDividend
2Q'14ActualPost
DividendStat. Total Adj. Capital Estimated Combined RBC Ratio
Target 425% RBC Ratio
Debt to Total Capital Ratio ex. Minority Interest and AOCI3
26.2% 24.5%
23.5% 23.5% 23.2%
2Q'13 3Q'13 4Q'13 1Q'14 2Q'14
Senior Debt Subordinated Debt
Target 25% Debt-to-
Capital Ratio
24
2
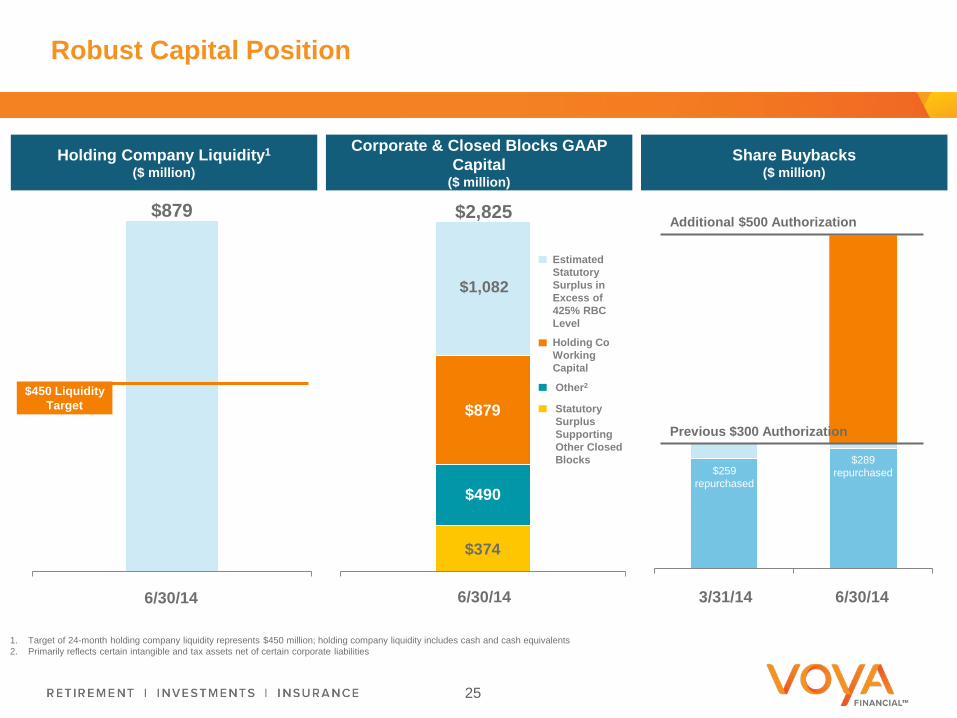
Robust Capital Position
25
Holding Company Liquidity1
($ million)
$879
03/31/20146/30/14
Corporate & Closed Blocks GAAP Capital
($ million)
$879
6/30/146/30/14
Holding Co Working Capital
Estimated Statutory Surplus in Excess of 425% RBC Level
Statutory Surplus Supporting Other Closed Blocks
Other2
$1,082
1. Target of 24-month holding company liquidity represents $450 million; holding company liquidity includes cash and cash equivalents 2. Primarily reflects certain intangible and tax assets net of certain corporate liabilities
$2,825
$374
$450 Liquidity Target
$490
Share Buybacks ($ million)
1Q'14 2Q'14
Additional $500 Authorization
Previous $300 Authorization
$259 repurchased
$289 repurchased
6/30/14 3/31/14

America’s Retirement Company™
26
Experienced Management Team With a Goal of 400-500 bps ROE Improvement from 2012 to 12-13% in 2016
1
3
2
Premier Franchise with Leading Positions in Attractive Markets
Solid Foundation Based on a Re-Capitalized and De-Risked Balance Sheet

Appendix
27
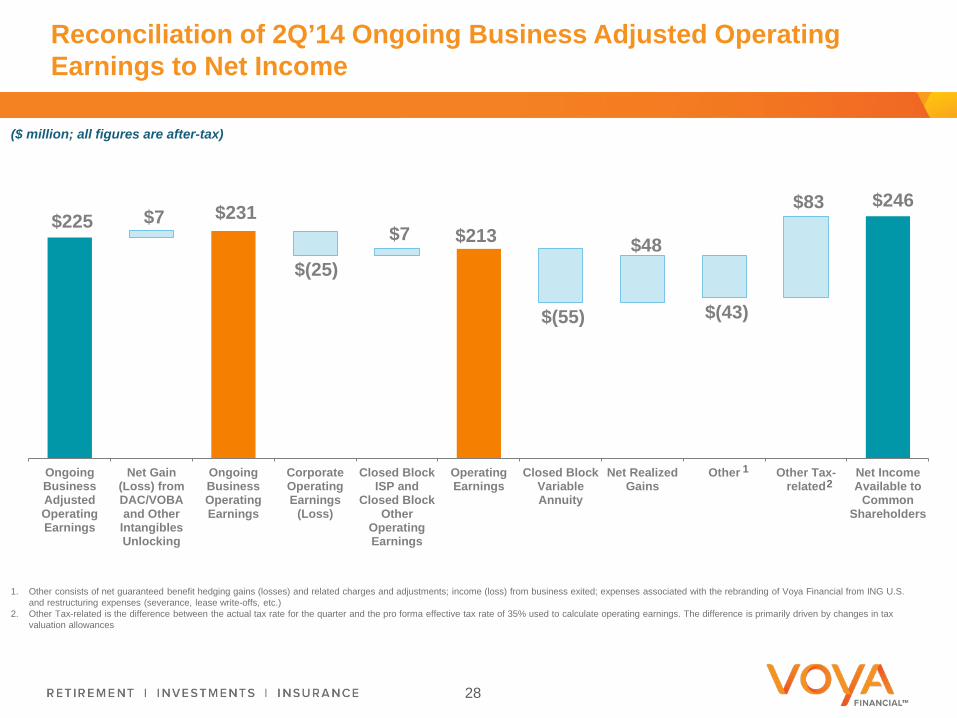
$225 $231 $213
$246 $7
$(25)
$7
$(55)
$48
$(43)
$83
OngoingBusinessAdjustedOperatingEarnings
Net Gain(Loss) fromDAC/VOBAand Other
IntangiblesUnlocking
OngoingBusinessOperatingEarnings
CorporateOperatingEarnings
(Loss)
Closed BlockISP and
Closed BlockOther
OperatingEarnings
OperatingEarnings
Closed BlockVariableAnnuity
Net RealizedGains
Other Other Tax-related
Net IncomeAvailable to
CommonShareholders
Reconciliation of 2Q’14 Ongoing Business Adjusted Operating Earnings to Net Income
($ million; all figures are after-tax)
1. Other consists of net guaranteed benefit hedging gains (losses) and related charges and adjustments; income (loss) from business exited; expenses associated with the rebranding of Voya Financial from ING U.S. and restructuring expenses (severance, lease write-offs, etc.)
2. Other Tax-related is the difference between the actual tax rate for the quarter and the pro forma effective tax rate of 35% used to calculate operating earnings. The difference is primarily driven by changes in tax valuation allowances
28
1 2

Diversified Drivers of Operating Revenues
Primarily consists of spread between yield and credited interest and investment income on capital supporting the business
Investment Spread and Other Investment Income
Primarily consists of fees on AUM and AUA
Fee Based Margin
Primarily consists of difference between premiums or fees charged for insurance risks and incurred benefits
Net Underwriting Gain (Loss) and Other Revenue
Ongoing Business Sources of Revenues ($ millions)
$364 $370 $389 $381 $385
$361 $345 $377 $362 $362
$204 $199 $181 $174 $219
$929 $913 $947 $917 $967
2Q'13 3Q'13 4Q'13 1Q'14 2Q'14
1
29
1. Excludes the net gain from the Lehman bankruptcy settlement and the loss recognized as a result of marking low income housing tax credits partnerships to the sales price associated with their disposition in 3Q’13 and 4Q’13
1

Seasonality of Financial Items
1Q 2Q 3Q 4Q
Ret
irem
ent
Corporate Markets tends to have the highest recurring deposits
Withdrawals also tend to increase
Education Tax-Exempt Markets typically sees lowest recurring deposits
Corporate Markets typically sees highest transfer / single deposits
Withdrawals also tend to increase
Recurring deposits in Corporate Markets may be lower
Inve
stm
ent
Man
agem
ent Performance fees tend to be
lowest Carried interest is minimal
Performance fees tend to be highest
Indi
vidu
al
Life
Universal Life sales tend to be highest
Empl
oyee
B
enef
its Group Life loss ratio tends to
be highest Sales tend to be the highest
Sales tend to be second highest
All
Segm
ents
Payroll taxes tend to be highest Other annual expenses are
concentrated Income on alternatives is
usually lower
Note: Annuities does not have any segment-specific seasonal financial items
30

31