voyage report of a biodiversity survey of seamounts …€¦ · 2) to preserve samples of fishes...
TRANSCRIPT

VOYAGE REPORT OF A BIODIVERSITY SURVEY OF SEAMOUNTS AND SLOPES OF THE NORFOLK RIDGE AND LORD HOWE
RISE (NORFANZ), MAY-JUNE 2003
Malcolm Clark (NIWA) Clive Roberts (Te Papa) Alan Williams (CSIRO)
Peter Last (CSIRO)
Balls Pyramid, Lord Howe Rise.

1
EXECUTIVE SUMMARY A survey of the biodiversity of fishes and benthic invertebrates was carried out on the Lord Howe Rise and Norfolk Ridge in May-June 2003. The “NORFANZ” programme has principal objectives to survey, sample and document the marine biodiversity from seamounts and slopes on the Norfolk Ridge and Lord Howe Rise, to support biosystematics research projects, to assess the faunal uniqueness and conservation value, and to relate observed distribution patterns with measured biological and physical parameters. An international team of scientists was involved in the 4 week long survey on the NIWA research vessel Tangaroa. Fourteen seamount and slope sites were sampled, 10 on the Norfolk Ridge, and 4 on the Lord Howe Rise. A total of 168 stations were completed, consisting of 144 trawl-sled-dredge shots, 15 casts to measure oceanographic conditions, and 9 camera drops to photograph fauna on the seafloor. Trawl depths ranged from less than 100 m to over 2000 m. A mixture of gear was used, including bottom trawls, a midwater trawl, beam trawl, epibenthic sleds, rock and pipe dredges. Over 500 fish species, and 1300 macro-invertebrate species, were provisionally identified onboard. This is regarded as a minimum estimate of biodiversity, as sampling intensity on individual seamounts was not sufficient to measure the complete faunal composition. About 20% of the fish species are likely to be either new records for the region, or new to science. It may take researchers around the world several years to examine fully the material, especially the invertebrates, and describe the unknown species. There were a number of special features of the survey that contributed to its success. There was a very high level of collaboration and cooperation between the New Zealand and Australian funding agencies, and all the scientific institutes and museums. The team of international scientists covered a wide range of skills and experience, and this enabled a lot to be achieved during the survey. The variety of gear types deployed during the survey were able to sample different components of the fauna, and will contribute to a better understanding of the structure of the benthic community. The multibeam system used by Tangaroa enabled bathymetry and bottom type to be rapidly assessed, and was a valuable aid to planning the trawling. Photographs were taken of every species caught, and used as a reference guide throughout the survey to ensure accuracy and consistency of identifications. Overall, there were very strong and productive synergies developed between scientists from various disciplines, and this was coupled with the experience of the officers and crew, to produce an excellent survey result.

2
VOYAGE REPORT TAN0308 (NORFANZ) Project title: Marine biodiversity of Norfolk Ridge and Lord Howe Rise
seamount communities. Project code: ZBD2002/16 (New Zealand Ministry of Fisheries) (National Oceans Office of Australia) Vessel: R.V. Tangaroa Area: Norfolk Ridge, Lord Howe Rise Period: 9 May 2003 to 7 June 2003 Voyage staff:
New Zealand:
Clive Roberts (Te Papa, Chief Scientist), Malcolm Clark (NIWA, Voyage Leader NZ), Andrew Stewart (Te Papa), Rick Webber (Te Papa), Robin McPhee (Te Papa), Peter McMillan (NIWA), Don McKnight (NIWA), Kevin MacKay (NIWA), Neil Bagley (NIWA), Brent Wood (NIWA), Richard Garlick (NIWA), Miles Dunkin (NIWA).
Australia: Leg 1
Alan Williams (CSIRO, AUS voyage leader), Mark Lewis (CSIRO), John Paxton (Australian Museum), Mark McGrouther (Australian Museum), Di Bray (Museum Victoria), Robin Wilson (Museum Victoria), Philip Alderslade (NT Museum), Spikey Riddoch (CSIRO), Karen Miller (University of Tasmania). Leg 2 Peter Last (CSIRO, AUS voyage leader), Martin Gomon (Museum Victoria), Mark Norman (Museum Victoria), Dan Gledhill (CSIRO), Bruce Barker (CSIRO), Peter Davie (Queensland Museum), Tim O’Hara (Museum Victoria), Penny Berents (Australian Museum). All leg 2. Legs 1 & 2 Alastair Graham (CSIRO), Karen Gowlett-Holmes (CSIRO), Ken Graham (NSW Fisheries), Mathilde Richer de Forges (Qld Museum).
France: Leg 1 Bertrand Richer de Forges (IRD Noumea) Leg 2 Bernard Seret (MNHN Paris)
U.S.A: Tomio Iwamoto (Californian Acad. Sciences)

3
OBJECTIVES: Programme objectives: 1) To survey, sample and document the marine biodiversity and environmental data
from seamounts and slopes on the Norfolk Ridge and Lord Howe Rise to a depth of at least 1500m depth.
2) To preserve samples of fishes and invertebrates and hold these in accessible
curated museum collections to support biosystematics research projects; 3) To provide specimens to support projects which research their identity, diversity,
relationships, distributions, and assess its uniqueness and conservation value. 4) To correlate observed distribution patterns, especially diversity hotspots and
pockets of endemism, with measured biological and physical parameters. Survey objectives 1) To collect fishes and invertebrates from seamounts and slopes of the Norfolk
Ridge and Lord Howe Rise, using trawls and benthic sleds. 2) To identify collected fauna on board to the highest taxonomic resolution
possible, and record species composition, location and other data on a database. 3) To compile a photographic record of all fish and macro-invertebrate species
caught. 4) To preserve specimens of the fauna for later identification or more detailed
scientific study. 5) To collect tissue samples from selected taxa for genetic studies to aid taxonomic
identification and understanding of stock relationships. 6) To collect hydrographic data, by regular deployment of conductivity-
temperature-depth and sound-velocity instruments. 7) To record a bathymetric profile of seamounts where practicable, by use of
Tangaroa’s EM300 multi-beam echo-sounder. 8) To collect sediment and rock samples for examination of microfauna, and later
analysis. 9) To collect photographic data of the benthic fauna in situ by deployment of
underwater camera equipment.

4
BACKGROUND: The Norfolk Ridge and Lord Howe Rise are prominent bathymetric features of the Tasman Sea region between New Zealand and Australia. They once formed part of the old coastline of Gondwanaland, and have since existed in one form or another for over 70 million years. The ridges include considerable areas of relatively shallow seabed, comprising chains of seamounts and plateaus rising to depths of 200–1200 m below the sea surface. Limited biodiversity research has shown that in some localities the Norfolk Ridge supports marine communities that are particularly rich and diverse, characterised by high levels of endemism, and support a remarkably high number of species and genera that are new to science. Some of these are likely to be ancient taxa. Age and growth studies have shown that these complex yet fragile communities are dominated by long-lived species, some attaining ages of well over 100 years. Known distribution patterns indicate that some rare and endemic species are confined to individual seamounts, while others may be distributed more widely, perhaps representing a “biological highway” connecting New Zealand and New Caledonia. Commercial fishing interest and activity on these seamounts is increasing, and heavy bottom trawls risk damaging or destroying benthic communities. There is increasing interest in oil and mineral extraction, which also has the potential to damage these communities. The Norfolk Ridge runs through the EEZs of three countries (Australia, New Zealand and New Caledonia), with some areas occurring in international waters. The NORFANZ project has received strong support from the New Zealand and Australian government departments, and was well supported by specialist scientists from these countries, plus France and the U.S.A. This project contributes to objectives of New Zealand's Biodiversity Strategy, and conservation assessment and regional marine planning under Australia’s Oceans Policy. Research based on data generated by the survey will provide a major increase in our knowledge of marine biodiversity in this region of the Tasman Sea. The project will for the first time provide baseline biodiversity data for the most diverse habitats along the Norfolk Ridge, including the high priority, species rich, seamounts at depths of around 200–1500 m. Identification keys, species descriptions, and accurate names for fishes and invertebrates will be assembled based on these collections. These outputs will improve our understanding and underpin the sustainable management and conservation of these fragile communities. Results will be published in scientific journals and popular articles, and it is anticipated that key discoveries will be displayed in museum biodiversity exhibitions in New Zealand, Australia and France. SURVEY DESIGN AND METHODS Survey area The survey covered 14 seamount and slope sites in the general region of the Norfolk Ridge and Lord Howe Rise (see Figure). Several positions were changed from the original schedule, where either features were not present as charted, or where a slightly different geographical distribution was appropriate.

5
Region Site number Latitude S Longitude E
S. Norfolk Ridge 2 34 07’ 171 36' 3 33 22' 170 11'
N. Norfolk Ridge 4 30 11' 167 28' 5 28 49' 167 35' 6 26 25' 167 09'
Lord Howe Rise 7 29 13' 159 01' 8 31 46' 159 15'
Lord Howe Plateau 9 32 40' 162 33' 10 34 12' 162 39'
W. Norfolk Ridge 11 33 46' 167 18' 12 34 19' 168 24' 13 34 35' 168 56' 14 35 11' 169 31' 15 32 36’ 167 35’
Depth strata Seamount and slope sites were sampled in three main depth strata, from the peak to 1500 m. �� 0–500 m �� 500–1000 m �� 1000–1500 m At least 2 stations were completed per depth stratum. Sampling at greater depths (to 2000 m) was carried out on 5 occasions, where time and conditions allowed. Sampling methods At each site, several methods were applied. Two types (“fish” and “benthic”) were carried out on all occasions, with other sampling methods used at times. The first routine sampling method was a NIWA rough-bottom orange roughy trawl, which was used consistently on all seamounts, with 3 trawls per seamount (where the depth range was appropriate). This enables comparison both within, and between, seamounts. This gear predominantly sampled large demersal fishes. The second method employed one or more of a number of gear types, designed to sample the smaller demersal fishes and benthic invertebrate fauna. This included 2 types of epibenthic sled, a full wing-trawl, and beam trawl. The gear used varied between shots, as it was intended to increase the range of biodiversity sampled rather than provide comparative data.

6
A midwater trawl was shot on several occasions, at depths greater than 1000 m. Originally it was intended that this would occur between each seamount site, but there was not enough time for this to happen. Cone nets were also deployed off the wing-ends of the rough-bottom trawl. Photographic transects A camera system mounted on the headline of the trawl net (CSIRO’s PhotoSea system) was used on a number of trawl shots. The self-contained system took 35 mm photographic slides at short pre-determined intervals as the net moved along the seabed. Films were processed on board immediately after each shot, and a selection of individual images digitized to evaluate habitats. In addition, specific photographic transects were carried out on most seamounts. The NIWA Benthos camera system was mounted in a rigid protective frame, and towed slowly along the transect at a height of about 2–3 m above the bottom, and activated with the use of a bottom weight trigger. Following difficulties with the headline system (the frame was badly damaged during a tow where much of one net was lost), and problems with charging batteries for the Benthos camera, the PhotoSea was mounted in the Benthos frame for the camera transects. Biological sampling The catch from each tow was sorted by species, identified, and weighed on motion-compensated scales where possible. More detailed measurements (e.g. individual weight, length) were made on some commercial species where appropriate (e.g. orange roughy, warty oreo, southern boarfish, bluenose). Much of the catch was retained (most fixed onboard, some frozen) for further taxonomic work onshore. Photographs were taken of each species, and a working guide to the fish and macro-invertebrate fauna compiled onboard to ensure consistent identification and naming of specimens. Station data were entered into Tangaroa’s Trawl Coordinator system for each trawl, photographic, or sled shot. Catch information was compiled on special NORFANZ forms for compilation and entry into the central database. The database allowed full integration of the variety of data being collected during the survey. Database recording
Datasets describing physical and environmental details, catches, specimens, tissue samples and photographs were maintained. Data were generally recorded in various logs kept by the scientific staff, then transcribed onto forms for keyboard data entry into relational database tables. These data then underwent a variety of validation checks, with summaries being made available to scientific staff to reconcile with their information before the final version was saved.

7
During discussions between Australian and New Zealand staff prior to the survey it was agreed that the Australian CAAB codes would be more appropriate for a survey of this nature than the NIWA species codes. A custom form for recording catch and specimen information, as well as specimen allocation, was designed and printed for the survey. A further form was designed during the survey to record various tissue samples being taken. Fish and invertebrate photograph databases were maintained independently. More detailed notes on database table structures and content have been prepared to accompany any copies of the database or extracts from it. Genetic sampling Tissue samples and whole specimens were collected and preserved from a variety of fish and invertebrate species. Specimens were dissected and tissues stored in ethanol. The whole specimens for genetic studies were generally frozen. Tissue samples were coded to cross-reference with the original specimens which were routinely preserved in formalin. Bathymetry The study areas were generally surveyed first with the EM 300 multi-beam swath system. This provided detailed and highly accurate bathymetric data for each seamount, as well as information on how hard the bottom was. Depth and positional data were also logged using “Seaplot”. An SVP (sound-velocity profile) and CTD (conductivity-temperature-depth) cast was made in the vicinity of each seamount. The Tangaroa’s Acoustic Doppler Current-Profiler (ADCP) was also run continuously during the survey. Sampling operations At each seamount, we applied a similar survey sequence: 1) At depths of 1000–1200 m, an SVP-CTD drop was completed. This was important
for the accuracy of the multi-beam data, and also gave data on water mass characteristics near each site.
2) A multi-beam survey of bathymetry of the seamount was carried out in the areas to be sampled. Initial station location was determined by a random direction from the peak of the seamount, and targetting depths of 250 m, 750 m, and 1200 m, towards the middle of the 3 depth strata boundaries. Multibeam information was also used to identify trawlable ground, and to direct sampling where possible to span soft and hard bottom (heavy and light reflectivity).
3) The trawling/sled sequence depended upon the nature of the bottom, and trawl gear rigged at the time. Tow duration times depended upon the bottom, but where possible: Rough-bottom orange roughy and ratcatcher trawl duration was 30–60 minutes on the bottom in each depth stratum. Sherman/NIWA sled/ beam trawl duration was 15–30 minutes.

8
4) Fish trawl and benthic sampling methods were generally carried out close together. On several occasions, ORH trawl, ratcatcher, and beam trawl tows were completed alongside each other to enable some comparison in the selectivity of each gear type. Where more than 2 tows were possible in each stratum, a combination of gear types was used to sample the range of biodiversity.
5) A vertical camera drop was carried out on most seamounts. This was generally done on the summit of the seamount.
Figure 1 shows some of the gear types used during NORFANZ. RESULTS Voyage timetable and narrative May 8 Loading gear on vessel May 9 Complete loading gear on vessel. Sail 2000. May 10 Transit up west coast North Island towards Site 2. May 11 Arrive Site 2, 3 ORH trawls, CTD, 1 Sherman, small catches. May 12 Continue Site 2, 4 Sherman tows. Steam towards Site 4, do
midwater trawl at 1200 m in transit. May 13 CTD at Site 4, search for seamount feature on bathy chart, but
doesn’t exist. Move to new site. Bottom is rough, lose a NIWA sled, 1 Sherman shot came fast.
May 14 Continue Site 4. 2 Sherman, head NE towards Norfolk Plateau, 3 ORH, 2 beam, 2 pipe dredge shots
May 15 Midwater shot to 1200 m, steam to Site 5. Shallow top plateau, good beam trawls, plus 3 ORH, SVP.
May 16 Continue Site 5 with ORH, beam and rock dredge tows. CTD. May 17 Complete Site 5, steam to Site 6, repair ORH and beam trawl
nets. CTD, 2 Sherman, 1 ORH trawl. Weather 30-35 kn. May 18 Sherman, beam, ORH trawl complete Site 6, good camera drop.
Steam for Lord Howe Rise, deep midwater shot 2000 m. May 19 Deep ratcatcher shot (1700 m), no catch May 20 Deep ratcatcher (1500 m) good catch. Site 7 is rough, so swath
extensively before fishing. CTD, 1 Sherman, some damage. May 21 3 Sherman, 2 NIWA, 4 ORH tows, come fast often, lose ORH net
and bobbin rig. Camera drop on top of seamount. May 22 Exchange some scientific staff at Lord Howe. Steam to Balls
Pyramid Site 8. 2 Sherman tows, lots of coral and sponge. CTD. May 23 4 ORH trawls, no trawlable ground >1000 m, 3 Sherman tows,
CTD. Very diverse catches. Steam east towards Site 9. May 24 Ratcatcher 1900 m. Arrive Site 9, gradual slope on flanks of Lord
Howe Plateau. 2 ratcatcher,1 ORH, 1 beam, and CTD drop. May 25 Complete 2 beam, 1 ORH, 1 ratcatcher at Site 9, head for Site 10.

9
Figure 1: A selection of the fish trawls, beam trawl, epibenthic sled, and CTD equipment used during NORFANZ.

10
May 26 Site 10 bathymetry complex, swath extensively as many small
volcanic cones.3 ORH trawls, 2 Sherman, 1 beam, 2 ratcatcher. May 27 Steam for Site 11, southern Wanganella Bank. 4 trawls. May 28 Continue Site 11, 3 ORH (2 fast), 1 ratcatcher, 1 beam, 2
Sherman tows. May 29 Beam trawl and CTD to complete 11, head to Site 15 on northern
Wanganella Bank. Good bottom, 3 ratcatcher, 3 beam, CTD. May 30 Site 15 gives diverse catches and because of central location, is
sampled more intensively. 4 ratcatcher, 2 pipe, 3 ORH, 1 beam trawl. Pufferfish, snipefish, redbait shallow. Lots of rattails.
May 31 Complete Site 15 with camera drop and ratcatcher. Steam to Site 3, CTD.2 Sherman, 1 ORH, camera drop.
June 1 Hard bottom. 3 ORH, 3 Sherman, 1 beam, camera drop. June 2 Site 12, CTD, then swath a long narrow ridge. 4 ORH trawls (1
fast), 1 beam, 3 Sherman, camera drop on top in rough. June 3 Complete 2 ratcatcher shots, short steam to Site 13. CTD, 2
Sherman tows, 2 ORH. Catch of boarfish and alfonsino. Good camera drop, and beam trawl with large sponges.
June 4 2 ratcatcher tows complete Site 13, steam to Site 14. CTD, 1 beam, 2 ratcatcher,2 Sherman, 1 ORH trawl shot.
June 5 Rip belly of ORH trawl, do camera drop, then final ORH tow at Site 14. Deep ratcatcher (1770 m), and deep (2000 m) midwater trawl shots to finish the survey.
June 6 Transit to Wellington June 7 Arrive Wellington. Begin unloading vessel. The total distance covered Wellington-Wellington was over 9000 km. A fuller description of daily events was recorded for the “Daily Diary” posted on the NOO website. Please refer to: www.oceans.gov.au/norfanz Survey area The survey covered parts of the Reinga Ridge, southern and central regions of the Norfolk Ridge, central areas of the Lord Howe Rise, and the West Norfolk Ridge (Figure 2). A total of 14 sites was sampled, comprising seamounts/banks (sites 6, 7, 8, 11, 12, 13, 14, 15), slope areas (sites 2, 9, 10), and a combination of both (sites 3, 4, 5). Summit depths of these features ranged from 40 m to 850 m.

11
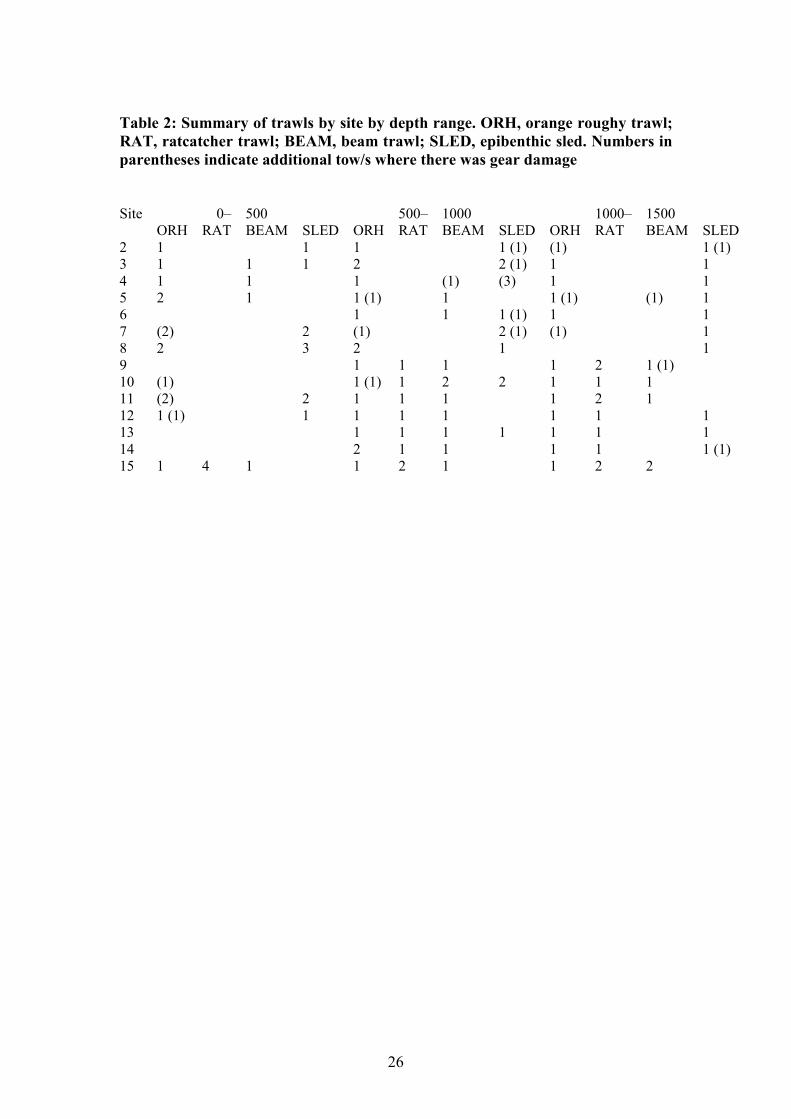
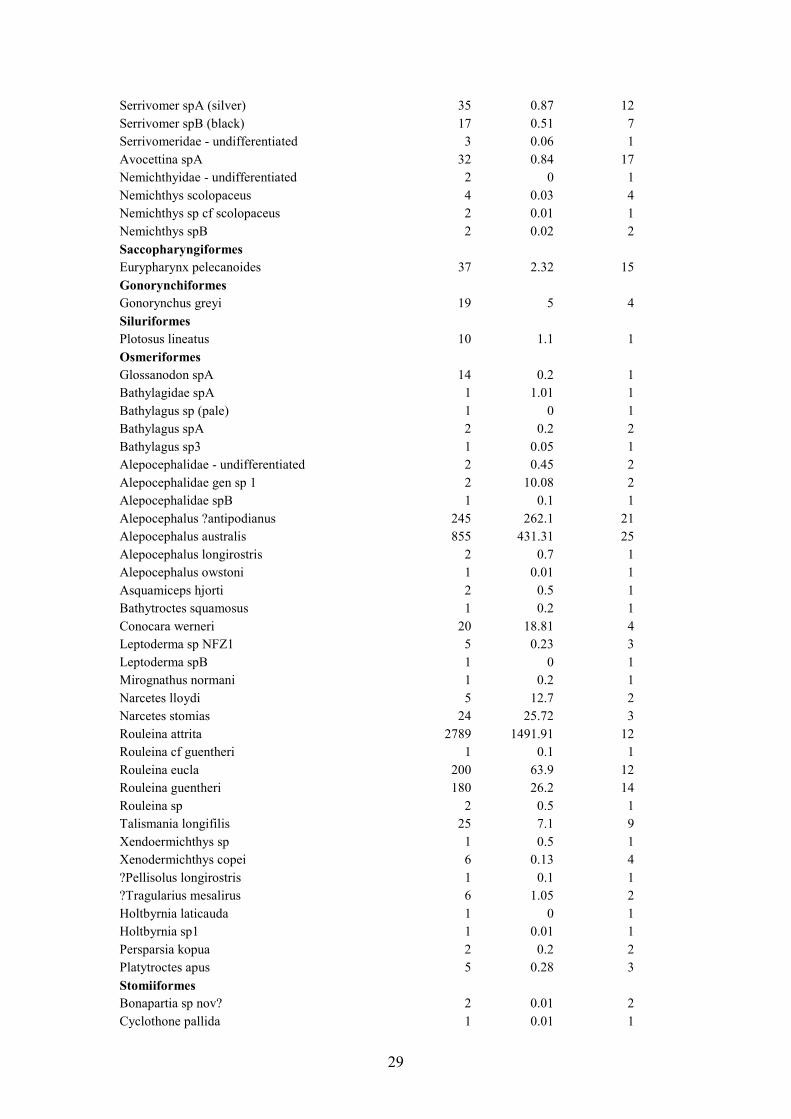
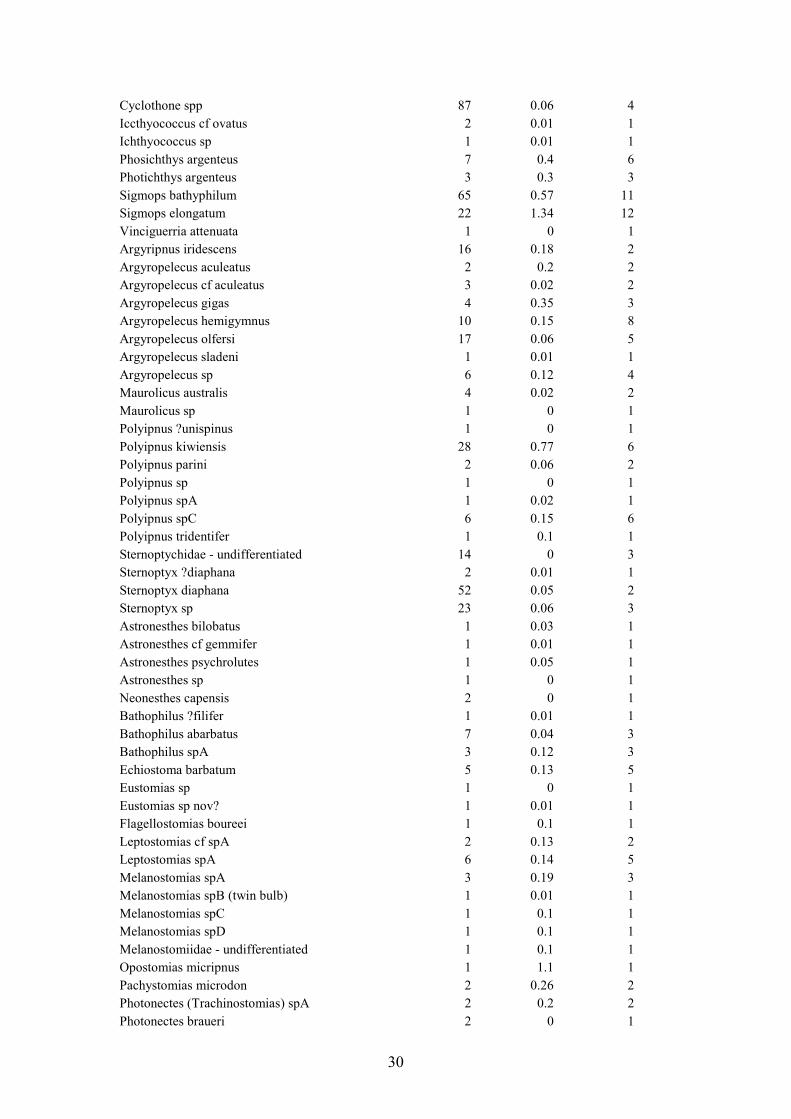
Sampling The total number of stations completed was 168. These comprised: No % of total % of biological Orange roughy trawl 48 29 35 Ratcatcher trawl 27 16 19 Midwater trawl 4 2 3 Epibenthic sled Sherman 36 21 26 NIWA 3 2 2 Beam trawl 21 13 15 Pipe dredge 4 2 Rock dredge 1 1 CTD/SVP 15 9 Camera drops 9 5 Details of these stations, including location, time, depth range and distance are given in Table 1. Their positions are plotted in Figure 3. Trawl stations A total of 132 bottom shots was completed at the 14 sites, using either the orange roughy trawl, ratcatcher, beam trawl, or sled. These were fairly evenly distributed between depth strata, although several sites did not rise to less than 500 m (Table 2). The bottom was very rough and hard at some sites, making trawling difficult. The trawl nets often snagged on the bottom, or were ripped. This was indicated by a gear performance of 3 or 4 in Table 1, and occurred on 24 occasions. These tows still generally had a catch, and were therefore acceptable for species composition, but not for catch rate analyses. Additional bottom trawl shots were carried out on 3 occasions in deeper water (1530 m–1930 m) between sites. Four deep midwater trawl shots (1200 m–2000 m) were also completed. Onboard, 590 fish species were provisionally identified. These are listed in Table 3, together with total number, weight, and frequency of occurrence. The fish catch amounted to 12 700 kg, with the dogfish Deania cf. calcea, slickhead Rouleina attrita, and boarfish Pseudopentaceros richardsoni each contributing over 1 000 kg. However, the species most frequently caught (in 31 tows) was the basketwork eel Diastobranchus capensis. The invertebrate catch could not be identified as well onboard. The high diversity of groups caught, the small size of many species (requiring very careful microscope examination), and the poor knowledge of invertebrate taxonomy in deepwater, made classification to species groups difficult. Over 1300 “species” were separated onboard, and a further several hundred have since been sorted from sediment samples taken during the survey. At this stage, only a list of invertebrate family groups is provided (Table 4), together with their frequency of occurrence. Numbers have not been included, as this is not meaningful when there are colonial forms, or large numbers of very small individuals which were not counted. A large number of

12
families of Porifera (sponges), Cnidaria (corals), Mollusca (including squids), Echinodermata (starfish, urchins), and Crustacea (crabs and prawns) were caught. Crustaceans (especially a number of prawn families) were frequently taken, occurring in over 40 tows. The fish and invertebrate material is currently being sorted further at a number of institutes, and will be described in greater detail in future reports.
Figure 2: Cruise track and location of sampling sites during the survey.

13
Figure 3: Position and number of sample tows carried out during the survey. Refer to Table 1 for more details.

14
Tissue samples were taken from a wide range of invertebrate and fish species for more detailed genetic study to assist taxonomic separation, as well as for studies of stock structure and dispersal. Rock samples were also retained from trawl and sled catches, and kept for several institutes. Specimen photographs A photographic database was compiled onboard. The catch from a tow was sorted, and digital photographs taken of each previously unrecorded species caught. Notes were added on distinctive characteristics of the species. Thus, throughout the survey a comprehensive photographic reference collection was built up of all the fish and invertebrate fauna taken. Hard copies were printed and collated in folders to aid scientists when separating similar animals, and also to ensure consistency between the two watches where different scientists were identifying the catch. The fish and invertebrate photographs were assembled by taxonomic grouping, and the digital files copied to CD. In addition, the fish photographs were loaded into an ACCESS database. Examples of some of the specimen photography are given in Figure 4. Camera stations The headline camera unit (Figure 5) was regularly deployed with the orange roughy net during the first half of the survey. On the second half, the frame was rebuilt after severe damage on tow 59. It required several tows to get the angle of the unit, and the focal length set correctly, after which the camera gave good information. The camera automatically fired at a preset interval (10�30 seconds) after nearing the bottom. Useable photographs were obtained from 19 stations. These have not yet been examined in detail, but should give data on bottom sediments and macro-benthic faunal composition. Examples of the type of photographs obtained from the system are given in Figure 5. The vertical-drop camera stations yielded higher resolution photographs. Nine drops were made, at sites 3 (2 drops), 6, 7, 8, 12, 13, 14, and 15. The vessel drifted slowly during each drop, and transect lengths ranged from 0.1 to 0.9 n.mile. The camera set-up, and examples of images, are given in Figure 6. Bathymetry Bathymetric data were collected from 3 sources during the survey: (1) The Tangaroa’s EM 300 multibeam system ran almost continuously. Data were logged on transit lines when steaming between sites, and given the settled weather, the

15
Figure 4: Examples of specimen preparation and photography, together with the header page of the photographic database.

16
Figure 5: The headline camera unit deployed on the orange roughy trawl, and examples of photographs of the sea floor and trawl net.

17
Figure 6: The drop-camera system, and examples of seafloor photographs.

18
data quality was acceptable at speeds up to 12–13 knots. A more detailed survey pattern at a speed of about 8 knots was instituted at each site. The coverage varied between only a few transect lines where the bottom was sloping gently and was relatively uniform, to a larger number if an entire seamount or cluster of small pinnacles needed surveying. The existing charts of the region proved to be adequate on a large scale, indicating the approximate position of ridge or seamount structures. However, on the smaller scale of an individual feature, the depth, size, and shape of a seamount were often poorly charted. The seafloor features were often hard, rugged, and contorted, and the multibeam output proved essential to the success of fishing several of the sites. The width of seafloor swept was 6 times the water depth, and so at 1000 m depth the bathymetry was determined 3 km either side of the vessel. This enabled rapid evaluation of the shape of the seabed. This information, combined with the backscatter intensity acting as an indicator of substrate hardness, was used to plan trawling operations with less risk to the trawl gear. It also gave us data on the type of sediment and habitat which may be used later in analyses of community structure. Examples of the multibeam output are given in Figure 7, showing a true scale Digital Elevation Model of Site 7, the backscatter imagery, and the location of various types of sampling on the seamount. Bathymetric data were collected continuously from the vessel’s other echosounders, and logged in the Tangaroa Data Acquisition System, filed in Seaplot software on the main navigation computer, and acoustic data were downloaded from the Simrad ES60 sounder. Oceanographic data were collected from 15 CTD/SVP casts. These were made at each site to calibrate the multibeam system, and give data on the water mass characteristics. Conclusions The survey was very successful. The original plan to cover such a large area was ambitious, but was achieved. The original plan of 6 tows per seamount at each of the 14 sites was often exceeded � a total of 139 tows was completed with faunal sampling gear. The diversity of fish and invertebrate fauna will not be fully known for several years to come. Samples need to be examined, new species described and published, and taxa updated and revised. The preliminary list including over 500 fish species and 1300 macro-invertebrates is high, but not surprising. Many of these are either new records for the Tasman Sea area, New Zealand, Australia, or completely new species to science.

19
Figure 7: Multibeam maps from Site 7, showing the relief, the backscatter, and the location of sampling.

20
There were several key factors that significantly contributed to the overall success of the survey:
�� Collaboration: There was very strong, cooperation between all parties involved in NORFANZ. The joint funding by MFish and NOO, and the shared scientific input from NIWA, CSIRO, and the New Zealand and Australian universities and museums, saw unprecedented trans-Tasman cooperation at political, managerial, and scientific levels. A strong international team of specialists, including scientists from France and the USA was assembled, with a wide range of skills and experience, that was openly shared.
�� Range of sampling gear: A wide variety of gear types was deployed from Tangaroa during the survey. Bottom trawls, a midwater trawl, a beam trawl, epibenthic sleds, rock and pipe dredges each sampled different assemblages, and gave a much greater appreciation of faunal diversity than would be gained from using just one or two types of gear. Camera drops to the seafloor, and the headline camera unit further added to information on the nature of benthic habitats, and instruments were deployed to sample the oceanographic characteristics. The research cooperation extended to equipment sharing as well, and several institutes contributed expensive trawls, sleds or camera gear, in the knowledge that they could be damaged or lost.
�� Seafloor mapping: Multibeam data have commonly been used to determine bathymetry, and to investigate geological structures. This was an important use of the swath data during NORFANZ as well, but in addition, interpretation of backscatter with bathymetry enabled successful trawling in rough terrain.
�� Database development: Substantial effort by NIWA went into the establishment of onboard databases. A completely new system was required for this type of survey, to capture catch composition, and track the allocation of specimens to institutes. As well as the station-catch data, a new database was established to hold the photographic record. The use of upgradable photographic guides proved invaluable during the survey, providing an immediate record of every fish and invertebrate species with fresh colouration, and ensuring consistency of identification between different sites, scientists, and shifts. The sharing of ideas and methods between staff on the survey also resulted in the entry of the fish images into a database to allow rapid and easy searches to be made.
A short survey of this nature will not fully describe the biodiversity of the Norfolk Ridge and Lord Howe Rise. However, it will provide an important overview of the fauna and its biogeographic structure enabling more informed marine planning decisions to be taken. A preliminary examination of the data suggests that the Norfolk Ridge and Lord Howe Rise elements of the fauna differ to an extent, and may need to be managed as separate biogeographic units. Also, several seamounts appear to have endemic elements. This survey and its outputs will also provide an invaluable biological and physical baseline for generating hypotheses and for planning and conducting further surveys in the region.

21
Acknowledgements A lot of people have been involved in NORFANZ since its inception in the minds of Clive Roberts and Peter Last. They all can’t be named, but a few acknowledgements are needed. We appreciate the efforts of all members of the scientific team, who worked hard to ensure as much material was identified and processed onboard as possible, and to those staff who put a lot of effort into entering and checking data. The vessel charter was jointly funded by NOO and MFish, and the work by Jacqui Burgess (MFish) and Colleen Johnstone (NOO) to keep the project on track didn’t go unnoticed. The NIWA Vessel Management Company, in particular John Hadfield, were very helpful in organizing gear and equipment prior to the survey. Finally, the vessel officers and crew were excellent: the officers put gear down or tried to sample in rugged places, and the crew were always willing to help clear the net of samples, help sort the catch, change gear over constantly, and repair nets. Copies to: All participating voyage staff New Zealand Jacqui Burgess, John Annala (MFish) Anna Cowie (Te Papa, Acting Manager, Natural History) NIWA: General Managers: Fisheries Research (John McKoy), Biodiversity (Don Robertson) Manager, NIWA Vessels (Clive Glover), Fred Smits, and John Hadfield Master Tangaroa x2 Ships Notice Board Central Data File (P. Shearer) x2 Australia Colleen Johnstone (National Oceans Office) Leanne Wilks, Matt Carr (Environment Australia) Geoff Kelly (NSW Marine Parks) Dr John Hooper (Queensland Museum) CSIRO Marine Research: Dr Tony Haymet, Chief of Division Don Michel (Communications Group) Don McKenzie/ Ron Plaschke (Ship Operations) Dr David McDonald (NESD) Dr Peter Thompson (SESME) Greg Lyden (Project Finance Officer) Dr Tony Rees (Data Centre)

22
Table 1: Station data for NORFANZ (gear codes: 10=ORH trawl, 11=ratcatcher, 13=beam trawl, 20=NIWA sled, 21=Sherman, 22=rock dredge, 23=pipe dredge, 53=midwater trawl, 72=camera drop, 82=SVP/CTD. Performance codes: 1,2 = good; 3,4=poor performance (fast, ripped nets etc)) No Region Site date time latitude longitude min_dep max_dep Gear Perf dist(nm)1 SNR 2 11-May-03 1349 34 06.68 171 39.66 351 400 10 2 1.352 SNR 2 11-May-03 1615 34 09.37 171 27.79 544 584 10 1 1.473 SNR 2 11-May-03 1937 34 03.21 171 08.1 1051 1320 10 3 1.534 SNR 2 11-May-03 2117 34 05.57 171 05.21 0 1500 82 0.335 SNR 2 11-May-03 2309 34 03.74 171 07.39 1228 1332 21 3 1.426 SNR 2 12-May-03 0206 34 09.14 171 27.95 542 554 21 3 0.557 SNR 2 12-May-03 0414 34 06.71 171 39.73 394 400 21 2 0.258 SNR 2 12-May-03 0622 34 09.75 171 27.33 558 573 21 2 0.669 SNR 2 12-May-03 0911 34 02.88 171 08.18 1145 1185 21 2 0.6110 SNR 12-May-03 1918 32 32.25 169 43.56 0 1275 53 1 6.4511 NNR 4 13-May-03 0951 30 37.18 167 48.83 0 1000 82 1 12 NNR 4 13-May-03 2030 30 12.62 167 29.45 606 620 20 4 0.2413 NNR 4 13-May-03 2227 30 12.67 167 29.9 630 634 21 3 0.3314 NNR 4 14-May-03 0355 30 12.22 167 26.83 755 782 21 3 0.3915 NNR 4 14-May-03 0532 30 08.96 167 26.86 1032 1131 21 2 0.4616 NNR 4 14-May-03 0959 29 59.62 167 38.73 1245 1285 10 2 1.2917 NNR 4 14-May-03 1232 29 53.11 167 49.04 650 666 10 2 1.2618 NNR 4 14-May-03 1414 29 53.39 167 48.44 653 656 13 3 0.5519 NNR 4 14-May-03 1652 29 41.46 168 03.48 339 344 10 1 1.5620 NNR 4 14-May-03 1926 29 41.84 168 02.62 322 337 13 1 0.8921 NNR 4 14-May-03 2121 29 41.83 168 01.33 314 327 23 2 0.1622 NNR 4 14-May-03 2158 29 41.35 168 01.46 337 338 23 2 0.4123 NNR 4 15-May-03 0350 29 31.75 167 38.05 200 1200 53 2 4.524 NNR 5 15-May-03 1015 28 54.39 167 41.05 111 115 13 1 0.6925 NNR 5 15-May-03 1143 29 02.24 167 35.96 0 1200 82 26 NNR 5 15-May-03 1642 28 54.34 167 41.14 110 304 10 2 0.5827 NNR 5 15-May-03 1907 28 54.47 167 41.04 110 441 10 1 1.1828 NNR 5 15-May-03 2121 28 51.94 167 40.59 718 859 10 3 1.0829 NNR 5 15-May-03 2345 28 51.21 167 42.53 690 812 13 2 1.0130 NNR 5 16-May-03 0519 28 49.56 167 34.11 1020 1045 10 3 0.2631 NNR 5 16-May-03 1128 28 52.21 167 40.96 648 854 10 2 1.5732 NNR 5 16-May-03 1318 28 51.66 167 41.26 600 773 22 2 0.4333 NNR 5 16-May-03 1853 28 29.37 167 47.15 1056 1116 10 2 2.1634 NNR 5 16-May-03 2142 28 30.71 167 47.71 1040 1090 13 3 1.4835 NNR 5 16-May-03 2324 28 28.03 167 46.11 0 1000 82 36 NNR 5 17-May-03 0052 28 31.22 167 47.38 1035 1065 21 1 0.7637 NNR 6 17-May-03 1320 26 35.40 167 11.80 0 1100 82 38 NNR 6 17-May-03 1601 26 25.56 167 11.35 734 754 10 2 0.9639 NNR 6 17-May-03 1740 26 26.55 167 11.64 733 740 21 3 0.6840 NNR 6 17-May-03 1855 26 25.28 167 11.26 714 756 21 1 141 NNR 6 18-May-03 0259 26 22.80 167 01.53 1017 1035 21 2 0.8142 NNR 6 18-May-03 0833 26 25.72 167 14.49 356 422 72 2 0.2543 NNR 6 18-May-03 1031 26 25.94 167 10.87 750 774 13 2 1.144 NNR 6 18-May-03 1250 26 23.53 167 01.21 1019 1030 10 2 1.4445 18-May-03 1635 26 31.42 166 34.42 0 2000 53 2 6.8846 19-May-03 1111 27 38.57 163 42.73 1635 1749 11 3 3.1

23
Table 1 (cont). No Region Site date time latitude longitude min_dep max_dep Gear Perf dist(nm)47 20-May-03 0227 28 29.88 161 15.56 1530 1530 11 2 2.8848 LHR 7 20-May-03 1536 29 14.05 159 06.09 0 1442 82 49 LHR 7 20-May-03 2309 29 13.09 158 59.85 298 307 21 2 0.7650 LHR 7 21-May-03 0329 29 12.88 158 59.05 505 900 21 2 0.6751 LHR 7 21-May-03 0526 29 13.67 159 01.15 810 1000 21 2 0.4752 LHR 7 21-May-03 0656 29 14.35 159 02.09 1210 1395 21 2 0.4153 LHR 7 21-May-03 0843 29 12.76 159 00.29 280 310 72 2 0.6954 LHR 7 21-May-03 1031 29 12.80 159 00.25 290 290 10 4 055 LHR 7 21-May-03 1237 29 13.12 159 00.45 292 330 20 2 0.3956 LHR 7 21-May-03 1349 29 13.61 159 02.49 740 800 20 3 0.4757 LHR 7 21-May-03 1532 29 13.07 159 00.43 300 300 10 4 058 LHR 7 21-May-03 1741 29 11.93 158 58.97 728 826 10 3 0.2759 LHR 7 21-May-03 1922 29 14.97 159 02.72 1600 1600 10 4 0.0660 LHR 8 22-May-03 2010 31 45.33 159 19.05 48 50 21 1 0.3861 LHR 8 22-May-03 2133 31 49.11 159 20.74 86 89 21 1 0.4462 LHR 8 22-May-03 2333 31 48.02 159 04.92 0 1100 82 63 LHR 8 23-May-03 0307 31 42.53 159 07.93 798 880 10 2 1.4564 LHR 8 23-May-03 0518 31 40.55 159 09.43 587 700 10 2 1.6865 LHR 8 23-May-03 0903 31 48.80 159 20.52 58 90 72 2 0.5466 LHR 8 23-May-03 1054 31 45.73 159 20.93 565 960 21 2 0.5367 LHR 8 23-May-03 1316 31 52.44 159 14.43 72 82 21 2 0.8968 LHR 8 23-May-03 1443 31 52.28 159 16.61 68 91 10 1 1.8469 LHR 8 23-May-03 1625 31 48.60 159 20.74 66 88 10 2 2.270 LHR 8 23-May-03 1855 31 44.03 159 20.80 1012 1292 21 1 0.7571 LHR 24-May-03 0030 32 03.98 159 52.80 1920 1934 11 2 2.2472 LHP 9 24-May-03 0740 32 11.59 160 51.66 1342 1361 11 1 2.6373 LHP 9 24-May-03 1434 32 25.94 161 47.62 1132 1197 11 1 2.9274 LHP 9 24-May-03 1906 32 26.08 161 45.36 1171 1259 10 1 2.9475 LHP 9 24-May-03 2049 32 24.22 161 38.94 0 1050 82 76 LHP 9 24-May-03 2214 32 24.34 161 40.64 1257 1288 13 4 177 LHP 9 25-May-03 0020 32 26.70 161 46.95 1130 1147 13 2 0.8678 LHP 9 25-May-03 0455 32 39.33 162 33.11 864 870 13 2 0.8179 LHP 9 25-May-03 0653 32 41.80 162 33.47 855 874 10 2 3.1580 LHP 9 25-May-03 0954 32 42.50 162 33.86 850 872 11 2 3.1681 LHP 10 25-May-03 1916 34 01.95 162 35.96 780 818 11 1 2.9182 LHP 10 26-May-03 0106 34 12.44 162 39.50 758 760 13 2 0.8183 LHP 10 26-May-03 0320 34 11.83 162 37.10 761 765 10 2 2.8484 LHP 10 26-May-03 0456 34 12.20 162 41.55 0 740 82 2 85 LHP 10 26-May-03 0616 34 13.89 162 40.59 515 700 21 2 0.6286 LHP 10 26-May-03 0833 34 11.06 162 39.19 430 740 21 2 0.5787 LHP 10 26-May-03 1028 34 11.09 162 39.17 450 740 10 3 0.5788 LHP 10 26-May-03 1156 34 11.04 162 39.18 435 440 10 4 0.0289 LHP 10 26-May-03 1349 34 12.18 162 41.18 748 772 11 2 3.0890 LHP 10 26-May-03 1951 34 12.17 163 21.36 1090 1117 11 1 3.8191 LHP 10 26-May-03 2217 34 12.41 163 17.20 1076 1083 13 1 0.9692 LHP 10 27-May-03 0038 34 12.70 163 21.59 1082 1120 10 1 3.4293 WNR 11 27-May-03 1854 33 49.47 167 03.45 804 944 10 1 2.9394 WNR 11 27-May-03 2124 33 49.50 166 58.80 950 987 13 1 0.87

24
Table 1 (cont). No Region Site date time latitude longitude min_dep max_dep Gear Perf dist(nm)95 WNR 11 27-May-03 2326 33 49.24 167 03.35 805 938 11 1 2.9696 WNR 11 28-May-03 0433 33 37.10 166 55.50 1017 1042 11 2 2.9897 WNR 11 28-May-03 0949 33 46.26 167 19.50 260 273 21 2 1.3398 WNR 11 28-May-03 1150 33 45.11 167 16.59 248 250 10 4 0.0399 WNR 11 28-May-03 1248 33 45.26 167 17.07 254 259 10 3 0.84100 WNR 11 28-May-03 1514 33 46.78 167 19.24 265 280 21 1 1.26101 WNR 11 28-May-03 1922 33 45.20 167 28.30 1410 1470 10 1 2.65102 WNR 11 28-May-03 2220 33 42.45 167 27.03 1451 1478 13 1 1.18103 WNR 11 29-May-03 0055 33 46.55 167 29.28 1431 1460 11 1 2.66104 WNR 11 29-May-03 0248 33 41.44 167 27.71 0 1200 82 105 WNR 15 29-May-03 0946 32 36.07 167 35.21 116 122 11 2 1.69106 WNR 15 29-May-03 1100 32 37.38 167 35.17 121 126 13 2 0.98107 WNR 15 29-May-03 1405 32 36.49 167 43.98 699 707 13 2 1.04108 WNR 15 29-May-03 1547 32 35.67 167 44.12 698 724 11 1 1.5109 WNR 15 29-May-03 1758 32 35.01 167 47.75 1023 1045 11 4 1.44110 WNR 15 29-May-03 2056 32 37.06 167 48.68 0 1050 82 111 WNR 15 29-May-03 2307 32 36.30 167 47.44 1008 1029 13 1 0.9112 WNR 15 30-May-03 0158 32 36.05 167 34.60 116 119 11 1 0.78113 WNR 15 30-May-03 0440 32 35.57 167 38.81 348 362 11 1 1.66114 WNR 15 30-May-03 0641 32 35.22 167 47.66 1021 1052 11 2 3.02115 WNR 15 30-May-03 0917 32 36.65 167 35.05 120 124 23 3 0.24116 WNR 15 30-May-03 0951 32 37.25 167 35.27 125 126 23 2 0.28117 WNR 15 30-May-03 1043 32 36.34 167 35.73 120 127 11 2 1.73118 WNR 15 30-May-03 1254 32 35.79 167 38.55 325 497 10 2 2.36119 WNR 15 30-May-03 1501 32 35.65 167 47.05 957 977 10 1 2.51120 WNR 15 30-May-03 1747 32 36.57 167 50.33 1303 1313 10 2 2.83121 WNR 15 30-May-03 2132 32 36.39 167 50.59 1331 1345 13 2 2.41122 WNR 15 31-May-03 0020 32 37.46 167 36.19 0 218 72 0.9123 WNR 15 31-May-03 0249 32 36.23 167 47.09 926 969 11 2 2.74124 SNR 3 31-May-03 1256 33 15.95 169 43.36 0 1000 82 125 SNR 3 31-May-03 1832 33 23.60 170 09.53 605 622 21 3 0.69126 SNR 3 31-May-03 1931 33 23.41 170 11.58 469 526 21 2 127 SNR 3 31-May-03 2121 33 23.47 170 11.91 477 483 72 0.49128 SNR 3 31-May-03 2314 33 23.57 170 09.95 627 662 10 1 1.45129 SNR 3 1-Jun-03 0450 33 29.24 170 00.71 1158 1230 10 2 2.1130 SNR 3 1-Jun-03 0704 33 32.62 170 04.13 1270 1350 21 2 1.17131 SNR 3 1-Jun-03 0933 33 23.56 170 10.99 617 670 21 2 0.97132 SNR 3 1-Jun-03 1057 33 22.61 170 12.70 514 540 21 2 1.11133 SNR 3 1-Jun-03 1317 33 23.74 170 13.03 465 490 10 2 1.26134 SNR 3 1-Jun-03 1516 33 20.51 170 13.98 614 675 10 1 2.48135 SNR 3 1-Jun-03 1717 33 23.65 170 12.51 463 470 72 1 0.45136 SNR 3 1-Jun-03 1828 33 23.60 170 12.38 469 490 13 1 0.55137 WNR 12 2-Jun-03 0350 34 18.01 168 26.14 0 1100 82 2 138 WNR 12 2-Jun-03 0822 34 22.98 168 25.66 373 374 10 3 0.14139 WNR 12 2-Jun-03 1002 34 20.50 168 23.19 382 390 10 2 1.2140 WNR 12 2-Jun-03 1403 34 19.14 168 24.63 831 846 10 1 3.01141 WNR 12 2-Jun-03 1611 34 17.09 168 21.50 785 800 13 1 0.85142 WNR 12 2-Jun-03 1903 34 16.49 168 24.08 1246 1249 10 2 0.95
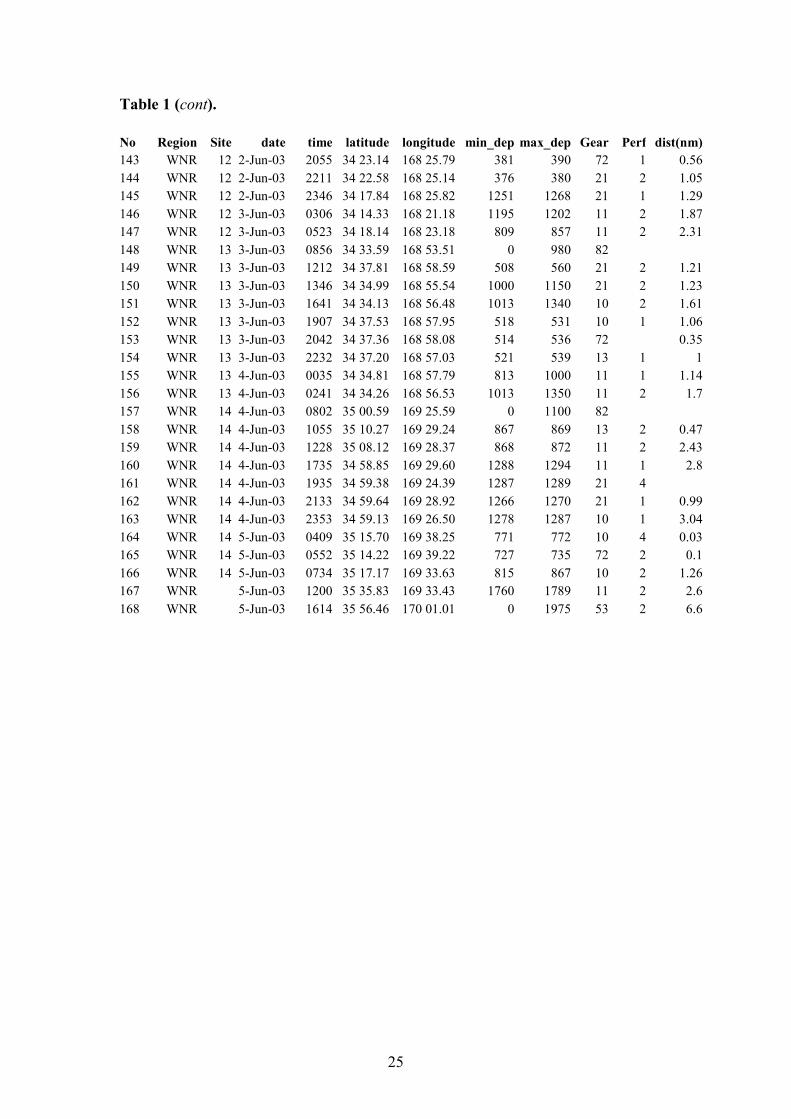
25
Table 1 (cont). No Region Site date time latitude longitude min_dep max_dep Gear Perf dist(nm)143 WNR 12 2-Jun-03 2055 34 23.14 168 25.79 381 390 72 1 0.56144 WNR 12 2-Jun-03 2211 34 22.58 168 25.14 376 380 21 2 1.05145 WNR 12 2-Jun-03 2346 34 17.84 168 25.82 1251 1268 21 1 1.29146 WNR 12 3-Jun-03 0306 34 14.33 168 21.18 1195 1202 11 2 1.87147 WNR 12 3-Jun-03 0523 34 18.14 168 23.18 809 857 11 2 2.31148 WNR 13 3-Jun-03 0856 34 33.59 168 53.51 0 980 82 149 WNR 13 3-Jun-03 1212 34 37.81 168 58.59 508 560 21 2 1.21150 WNR 13 3-Jun-03 1346 34 34.99 168 55.54 1000 1150 21 2 1.23151 WNR 13 3-Jun-03 1641 34 34.13 168 56.48 1013 1340 10 2 1.61152 WNR 13 3-Jun-03 1907 34 37.53 168 57.95 518 531 10 1 1.06153 WNR 13 3-Jun-03 2042 34 37.36 168 58.08 514 536 72 0.35154 WNR 13 3-Jun-03 2232 34 37.20 168 57.03 521 539 13 1 1155 WNR 13 4-Jun-03 0035 34 34.81 168 57.79 813 1000 11 1 1.14156 WNR 13 4-Jun-03 0241 34 34.26 168 56.53 1013 1350 11 2 1.7157 WNR 14 4-Jun-03 0802 35 00.59 169 25.59 0 1100 82 158 WNR 14 4-Jun-03 1055 35 10.27 169 29.24 867 869 13 2 0.47159 WNR 14 4-Jun-03 1228 35 08.12 169 28.37 868 872 11 2 2.43160 WNR 14 4-Jun-03 1735 34 58.85 169 29.60 1288 1294 11 1 2.8161 WNR 14 4-Jun-03 1935 34 59.38 169 24.39 1287 1289 21 4 162 WNR 14 4-Jun-03 2133 34 59.64 169 28.92 1266 1270 21 1 0.99163 WNR 14 4-Jun-03 2353 34 59.13 169 26.50 1278 1287 10 1 3.04164 WNR 14 5-Jun-03 0409 35 15.70 169 38.25 771 772 10 4 0.03165 WNR 14 5-Jun-03 0552 35 14.22 169 39.22 727 735 72 2 0.1166 WNR 14 5-Jun-03 0734 35 17.17 169 33.63 815 867 10 2 1.26167 WNR 5-Jun-03 1200 35 35.83 169 33.43 1760 1789 11 2 2.6168 WNR 5-Jun-03 1614 35 56.46 170 01.01 0 1975 53 2 6.6
26
Table 2: Summary of trawls by site by depth range. ORH, orange roughy trawl; RAT, ratcatcher trawl; BEAM, beam trawl; SLED, epibenthic sled. Numbers in parentheses indicate additional tow/s where there was gear damage Site 0– 500 500– 1000 1000– 1500 ORH RAT BEAM SLED ORH RAT BEAM SLED ORH RAT BEAM SLED2 1 1 1 1 (1) (1) 1 (1) 3 1 1 1 2 2 (1) 1 1 4 1 1 1 (1) (3) 1 1 5 2 1 1 (1) 1 1 (1) (1) 1 6 1 1 1 (1) 1 1 7 (2) 2 (1) 2 (1) (1) 1 8 2 3 2 1 1 9 1 1 1 1 2 1 (1) 10 (1) 1 (1) 1 2 2 1 1 1 11 (2) 2 1 1 1 1 2 1 12 1 (1) 1 1 1 1 1 1 1 13 1 1 1 1 1 1 1 14 2 1 1 1 1 1 (1) 15 1 4 1 1 2 1 1 2 2

27
Table 3: List of fish species recorded during NORFANZ (Number = total number of individuals, Weight = kg, No_stations = number of stations in which the species was caught). Ordinal classification follows Eschmeyer (1998) Catalog of Fishes, Vol. 3, California Academy of Sciences, San Francisco, 1821-2905 pp. Order and species name Number Weight No_stations Hexanchiformes Heptranchias perlo 2 11 2 Carchariniformes Apristurus cf herklotsi 37 8.6 7 Apristurus cf spD 1 0.5 1 Apristurus cf spE 3 1.7 2 Apristurus cf spG 1 0.4 1 Apristurus sp (egg case) 1 0.01 1 Apristurus spA [in Last & Stevens, 1994] 88 42.8 14 Apristurus spB [in Last & Stevens, 1994] 15 2.5 5 Apristurus spC [in Last & Stevens, 1994] 4 1.8 3 Apristurus spE [in Last & Stevens, 1994] 26 19 8 Cephaloscyllium sp NFZ1 1 8.2 1 Parmaturus sp NFZ1 1 0.6 1 Mustelus sp NFZ1 4 11.7 4 Gollum cf attenuatus 3 6.8 1 Carcharhinus galapagensis 19 107.9 2 Squaliformes Centrophorus cf squamosus 2 18.8 2 Centrophorus squamosus 5 45.8 3 Centroscyllium kamoharai 6 1.5 3 Centroscymnus (cf owstoni) sp NFZ1 74 240.1 13 Centroscymnus cf coelolepis NZ 52 309.4 8 Centroscymnus cf plunketi 1 0.4 1 Centroscymnus crepidater 63 35.2 10 Centroscymnus owstoni 4 23.2 2 Centroscymnus plunketi 5 26.3 3 Dalatias licha 9 52.9 7 Deania calcea 2 1.7 2 Deania cf calcea 546 1568.9 21 Deania cf quadrispinosa 1 1 1 Deania quadrispinosa 1 0.5 1 Deania sp NFZ1 31 62.7 9 Etmopterus baxteri 3 8.3 1 Etmopterus cf spB 15 14.4 3 Etmopterus granulosus 6 0.6 1 Etmopterus lucifer 138 34.7 15 Etmopterus molleri 33 6.1 4 Etmopterus pusillus 8 2.8 2 Etmopterus spB [in Last & Stevens, 1994] 41 39.5 15 Isistius brasiliensis 1 0.3 1 Squalus cf spB [in Last & Stevens, 1994] 4 9.3 2 Squalus sp cf griffini 1 7.5 1 Squalus spB [in Last & Stevens, 1994] 12 18.35 4 Zameus squamulosus 2 1.6 2 Oxynotus bruniensis 5 16.7 2

28
Torpediniformes Torpedo macneilli 2 16.1 2 Rajiformes Bathyraja sp 1 10 1 Bathyraja spA 1 0.2 1 Dipturus sp NFZ1 4 26.7 4 Notoraja sp. NFZ1 1 0.2 1 Rajidae (egg cases) 2 0.01 1 Rajidae ngen spB 5 0.51 3 Rajidae ngen spC 15 4.9 5 Rajidae ngen spD 5 0.9 4 Rajidae ngen spE 3 0 2 Rajidae ngen spF 2 0.4 2 Dasyatis thetidis 2 25 1 Chimaeriformes Chimaera sp NFZ1 12 57.6 8 Chimaera sp NFZ2 3 6 1 Chimaera sp NFZ3 1 4.9 1 Chimaera spB [in Last & Stevens, 1994] 1 3.1 1 Hydrolagus spA [in Last & Stevens, 1994] 13 39.6 6 Hydrolagus trolli 28 98.8 9 Harriotta sp NFZ1 1 1.9 1 Harriotta raleighana 1 3.4 1 Rhinochimaera pacifica 9 36.9 8 Notacanthiformes Aldrovandia affinis 55 14.83 7 Aldrovandia cf phalacra 1 0.1 1 Halosauropsis macrochir 43 9.01 5 Halosaurus pectoralis 102 21.31 7 Notacanthus sexspinis 22 4.55 11 Notocanthus ?abbotti 1 0.01 1 Polyacanthonotus rissoanus 1 0.05 1 Anguilliformes Gymnothorax nubilus 1 0.2 1 Nettastoma sp 1 0.1 1 Nettastoma spB 1 0.1 1 Nettastomatidae - undifferentiated 2 0.2 2 Venefica spA 15 1.32 9 Bassanago bulbiceps 5 3.02 4 Bassanago hirsutus 2 2.4 2 Congridae - undifferentiated 1 0.01 1 Diastobranchus capensis 698 496.8 31 Ilyophis spA 1 0.03 1 Simenchelys parasitica 2 0.21 2 Synaphobranchus affinis 51 7.19 17 Synaphobranchus brevidorsalis 2 0.1 1 Synaphobranchus kaupii 10 1.3 4 cf Ilyophus spB 1 0.3 1 Derichthys serpentinus 1 0 1 Nessorhamphus ingolfianus 3 0.6 2 Nessorhamphus sp 1 0.1 1 Serrivomer sp 29 0.53 8
29
Serrivomer spA (silver) 35 0.87 12 Serrivomer spB (black) 17 0.51 7 Serrivomeridae - undifferentiated 3 0.06 1 Avocettina spA 32 0.84 17 Nemichthyidae - undifferentiated 2 0 1 Nemichthys scolopaceus 4 0.03 4 Nemichthys sp cf scolopaceus 2 0.01 1 Nemichthys spB 2 0.02 2 Saccopharyngiformes Eurypharynx pelecanoides 37 2.32 15 Gonorynchiformes Gonorynchus greyi 19 5 4 Siluriformes Plotosus lineatus 10 1.1 1 Osmeriformes Glossanodon spA 14 0.2 1 Bathylagidae spA 1 1.01 1 Bathylagus sp (pale) 1 0 1 Bathylagus spA 2 0.2 2 Bathylagus sp3 1 0.05 1 Alepocephalidae - undifferentiated 2 0.45 2 Alepocephalidae gen sp 1 2 10.08 2 Alepocephalidae spB 1 0.1 1 Alepocephalus ?antipodianus 245 262.1 21 Alepocephalus australis 855 431.31 25 Alepocephalus longirostris 2 0.7 1 Alepocephalus owstoni 1 0.01 1 Asquamiceps hjorti 2 0.5 1 Bathytroctes squamosus 1 0.2 1 Conocara werneri 20 18.81 4 Leptoderma sp NFZ1 5 0.23 3 Leptoderma spB 1 0 1 Mirognathus normani 1 0.2 1 Narcetes lloydi 5 12.7 2 Narcetes stomias 24 25.72 3 Rouleina attrita 2789 1491.91 12 Rouleina cf guentheri 1 0.1 1 Rouleina eucla 200 63.9 12 Rouleina guentheri 180 26.2 14 Rouleina sp 2 0.5 1 Talismania longifilis 25 7.1 9 Xendoermichthys sp 1 0.5 1 Xenodermichthys copei 6 0.13 4 ?Pellisolus longirostris 1 0.1 1 ?Tragularius mesalirus 6 1.05 2 Holtbyrnia laticauda 1 0 1 Holtbyrnia sp1 1 0.01 1 Persparsia kopua 2 0.2 2 Platytroctes apus 5 0.28 3 Stomiiformes Bonapartia sp nov? 2 0.01 2 Cyclothone pallida 1 0.01 1
30
Cyclothone spp 87 0.06 4 Iccthyococcus cf ovatus 2 0.01 1 Ichthyococcus sp 1 0.01 1 Phosichthys argenteus 7 0.4 6 Photichthys argenteus 3 0.3 3 Sigmops bathyphilum 65 0.57 11 Sigmops elongatum 22 1.34 12 Vinciguerria attenuata 1 0 1 Argyripnus iridescens 16 0.18 2 Argyropelecus aculeatus 2 0.2 2 Argyropelecus cf aculeatus 3 0.02 2 Argyropelecus gigas 4 0.35 3 Argyropelecus hemigymnus 10 0.15 8 Argyropelecus olfersi 17 0.06 5 Argyropelecus sladeni 1 0.01 1 Argyropelecus sp 6 0.12 4 Maurolicus australis 4 0.02 2 Maurolicus sp 1 0 1 Polyipnus ?unispinus 1 0 1 Polyipnus kiwiensis 28 0.77 6 Polyipnus parini 2 0.06 2 Polyipnus sp 1 0 1 Polyipnus spA 1 0.02 1 Polyipnus spC 6 0.15 6 Polyipnus tridentifer 1 0.1 1 Sternoptychidae - undifferentiated 14 0 3 Sternoptyx ?diaphana 2 0.01 1 Sternoptyx diaphana 52 0.05 2 Sternoptyx sp 23 0.06 3 Astronesthes bilobatus 1 0.03 1 Astronesthes cf gemmifer 1 0.01 1 Astronesthes psychrolutes 1 0.05 1 Astronesthes sp 1 0 1 Neonesthes capensis 2 0 1 Bathophilus ?filifer 1 0.01 1 Bathophilus abarbatus 7 0.04 3 Bathophilus spA 3 0.12 3 Echiostoma barbatum 5 0.13 5 Eustomias sp 1 0 1 Eustomias sp nov? 1 0.01 1 Flagellostomias boureei 1 0.1 1 Leptostomias cf spA 2 0.13 2 Leptostomias spA 6 0.14 5 Melanostomias spA 3 0.19 3 Melanostomias spB (twin bulb) 1 0.01 1 Melanostomias spC 1 0.1 1 Melanostomias spD 1 0.1 1 Melanostomiidae - undifferentiated 1 0.1 1 Opostomias micripnus 1 1.1 1 Pachystomias microdon 2 0.26 2 Photonectes (Trachinostomias) spA 2 0.2 2 Photonectes braueri 2 0 1

31
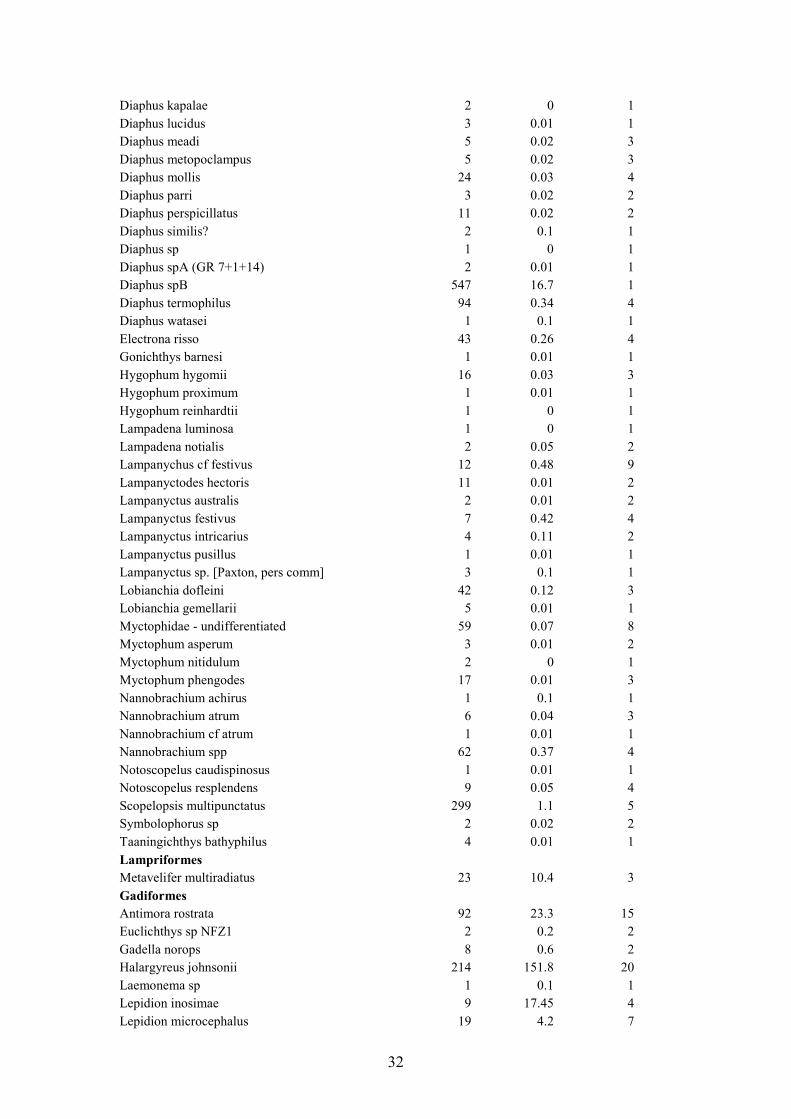
Photostomias spB 1 0.1 1 Thysanactis spA 1 0.01 1 Malacosteidae - undifferentiated 4 0.15 2 Malacosteus niger 7 0.14 3 Malacosteus ?spA 22 0.74 14 Chauliodus ?sloani 77 2.66 12 Chauliodus sloani 112 2.25 25 Stomias boa 5 0.11 3 Stomias longibarbatus 2 0 2 Idiacanthis sp 1 0.1 1 Idiacanthus atlanticus 5 0.13 5 Idiacanthus fasciola 1 0.05 1 Aulopiformes Hime sp NFZ1 5 0.21 2 Bathysaurus ferox 10 7.3 6 Synodus cf rubromarmoratus 4 0.6 2 Synodus doaki 1 0.05 1 Synodus similis 1 0.1 1 Bathysauropsis gracilis 5 0.5 2 Chlorophthalmus albatrossis 2 0.15 2 Paraulopid spA 2 0.02 2 Paraulopus cf novazeelandiae 1 0.01 1 Paraulopus legandi 6 0.1 1 Paraulopus okamurai 40 10.3 6 Paraulopus spA (not Gomon) 1 0.1 1 Bathypterois filiferus 2 0.2 2 Bathypterois cf filiferus 1 0.1 1 Bathypterois longifilis 103 21.7 20 Bathypterois cf longifilis 6 1.4 2 Ahliesaurus brevis 1 0.01 1 Luciosudis normani 2 0.01 2 Scopelosaurus spA 2 0.2 2 Scopelosaurus spB 1 0.01 1 Macroparalepis sp 1 0 1 Notolepis risso 8 0.06 4 Omosudis lowei 4 0.05 3 Alepisaurus brevirostris 17 0.22 4 Anotopterus cf pharoa 1 0.01 1 Evermannella balbo 2 0.11 2 Odontostomops normalops 3 0.16 3 Giganturidae - undifferentiated 1 0.01 1 Myctophiformes Neoscopelus macrolepidotus 742 58.13 17 Bolinichthys longipes 1 0 1 Bolinichthys nikolayi 1 0.01 1 Bolinichthys supralateralis 9 0.02 3 Ceratoscopelus warmingii 13 0.04 4 Diaphus adenomus 2 0.01 2 Diaphus brachycephalus 16 0.03 2 Diaphus cf lucidus 8 0 1 Diaphus fragilis 1 0 1 Diaphus hudsoni 2 0 1
32
Diaphus kapalae 2 0 1 Diaphus lucidus 3 0.01 1 Diaphus meadi 5 0.02 3 Diaphus metopoclampus 5 0.02 3 Diaphus mollis 24 0.03 4 Diaphus parri 3 0.02 2 Diaphus perspicillatus 11 0.02 2 Diaphus similis? 2 0.1 1 Diaphus sp 1 0 1 Diaphus spA (GR 7+1+14) 2 0.01 1 Diaphus spB 547 16.7 1 Diaphus termophilus 94 0.34 4 Diaphus watasei 1 0.1 1 Electrona risso 43 0.26 4 Gonichthys barnesi 1 0.01 1 Hygophum hygomii 16 0.03 3 Hygophum proximum 1 0.01 1 Hygophum reinhardtii 1 0 1 Lampadena luminosa 1 0 1 Lampadena notialis 2 0.05 2 Lampanychus cf festivus 12 0.48 9 Lampanyctodes hectoris 11 0.01 2 Lampanyctus australis 2 0.01 2 Lampanyctus festivus 7 0.42 4 Lampanyctus intricarius 4 0.11 2 Lampanyctus pusillus 1 0.01 1 Lampanyctus sp. [Paxton, pers comm] 3 0.1 1 Lobianchia dofleini 42 0.12 3 Lobianchia gemellarii 5 0.01 1 Myctophidae - undifferentiated 59 0.07 8 Myctophum asperum 3 0.01 2 Myctophum nitidulum 2 0 1 Myctophum phengodes 17 0.01 3 Nannobrachium achirus 1 0.1 1 Nannobrachium atrum 6 0.04 3 Nannobrachium cf atrum 1 0.01 1 Nannobrachium spp 62 0.37 4 Notoscopelus caudispinosus 1 0.01 1 Notoscopelus resplendens 9 0.05 4 Scopelopsis multipunctatus 299 1.1 5 Symbolophorus sp 2 0.02 2 Taaningichthys bathyphilus 4 0.01 1 Lampriformes Metavelifer multiradiatus 23 10.4 3 Gadiformes Antimora rostrata 92 23.3 15 Euclichthys sp NFZ1 2 0.2 2 Gadella norops 8 0.6 2 Halargyreus johnsonii 214 151.8 20 Laemonema sp 1 0.1 1 Lepidion inosimae 9 17.45 4 Lepidion microcephalus 19 4.2 7

33
Lepidion schmidti 3 15.7 2 Melanonus gracilis 4 0.13 4 Melanonus zugmayeri 3 0.11 3 Mora moro 594 740.11 24 Physiculus cf luminosa 27 0.67 8 Physiculus luminosa 1 0.01 1 Physiculus spA 6 0.7 3 Physiculus spB 1 0.1 1 Physiculus therosideros 1 0.01 1 Tripterophycis gilchristi 6 0.21 4 Tripterophycis spA 1 0.1 1 Trypterophycius spB 8 0.81 3 Lyconus sp. [in Paxton et al, 1989] 1 0.2 1 Macruronus novaezelandiae 6 24.1 2 Asthenomacrurus victoris 1 0.01 1 Bathygadus cottoides 312 8.11 20 Bathygadus sp1 1 0.01 1 Bathygadus spongiceps 10 3.7 3 Caelorinchus ?cookianus (juvs) 72 1.02 4 Caelorinchus acanthiger 68 18.9 12 Caelorinchus celaenostomus 87 74.3 7 Caelorinchus cookianus 99 4.75 13 Caelorinchus cylindricus 26 0.21 3 Caelorinchus horribilis 8 0.45 4 Caelorinchus innotabilis 561 27.08 22 Caelorinchus kermadecus 15 12.8 4 Caelorinchus matamuus 3 1 1 Caelorinchus maurofasciatus 8 1.62 5 Caelorinchus melanobranchus 7 1.1 1 Caelorinchus mycterismus 712 147.3 20 Caelorinchus mystax 1 0.1 1 Caelorinchus sp (Juvs too small to id) 2 0.02 2 Caelorinchus sp NFZ3 14 2.7 3 Caelorinchus sp1 (sp nov) 1 1.4 1 Caelorinchus sp2 1 0.01 1 Caelorinchus spathulatus 21 1 3 Caelorinchus supernasutus 25 15.4 5 Caelorinchus trachycarus 43 8.4 12 Cetonurus globiceps 1164 224.5 19 Coryphaenoides dossenus 6 1.8 5 Coryphaenoides filicauda 40 2.1 2 Coryphaenoides grahami 19 2.3 8 Coryphaenoides mcmillani 35 2 5 Coryphaenoides rudis 7 41.2 4 Coryphaenoides serrulatus 204 44.88 18 Coryphaenoides striaturus 111 20.66 19 Coryphaenoides subserrulatus 5 0.45 4 Gadomus aoteanus 215 33.6 28 Gadomus colletti 2 0.3 2 Hymenocephalus ?megalops 2 0.01 1 Hymenocephalus gracilis 2 0.01 2 Hymenocephalus longibarbis 1 0.01 1

34
Hymenocephalus megalops 58 0.5 9 Hymenocephalus nascens 49 1.17 10 Hymenocephalus sp (cf aterrimus) 3 0.3 1 Hymenocephalus spA 1 0.01 1 Hymenocephalus striatissimus 1 0.01 1 Kuronezumia bubonis 3 1.2 3 Lepidorhynchus denticulatus 1 0.5 1 Lucigadus nigromaculatus 5 0.14 5 Macrouridae - undifferentiated 7 0.12 3 Malacocephalus laevis 55 17.5 11 Mesobius antipodum 19 13.5 7 Nezumia coheni 35 6.38 11 Nezumia kapala 2 0.25 2 Nezumia namatahi 17 2.06 10 Nezumia propinqua 46 1.68 15 Sphagemacrurus pumiliceps 11 0.85 4 Sphagemacrurus richardi 32 2.45 9 Squalogadus modificatus 10 8.1 3 Trachonurus gagates 116 26.3 12 Trachonurus sp NFZ1 2 0.3 2 Trachonurus villosus 24 2 8 Ventrifossa atherodon 1 0.01 1 Ventrifossa johnboborum 3 0.31 3 Ventrifossa macropogon 2 0.2 1 Ventrifossa paxtoni 1 0.4 1 Ophidiiformes Aphyonus gelatinosus 1 0.05 1 Bassozetus robustus 3 2.7 1 Genypterus blacodes 1 6.3 1 Sciadonus spA 1 0.01 1 Spectrunculus grandis 5 3.6 2 Carapidae - undifferentiated 2 0.01 2 Carapus sp 3 0.02 2 Eurypleuron owasianum 1 0 1 Pyramodon punctatus 1 0.3 1 Lophiiformes Antennariidae spA 1 0.01 1 Chaunax spA 4 1.9 3 Chaunax spB white pect filaments 4 0.3 2 Chaunax spC 23 0.42 11 Chaunax spD narrow lure 5 0.8 3 Chaunax spE fat lure, red toes 19 3.65 2 Chaunax spF (thin lure, red toes) 39 4.48 2 Dibranchus sp NFZ1 4 0.2 2 Dibranchus spA 1 0.05 1 Halieutaea spA 2 0.2 1 Malthopsis cf mitrigea 1 0 1 Malthopsis sp NFZ3 1 0.1 1 Malthopsis spA (yellow spots) 1 0.01 1 Ceratoidei (male; D14) 1 0 1 Melanocetus johnsoni 6 0.59 5 Melanocetus murrayi 1 0 1

35
Chaenophryne longiceps 1 0.05 1 Oneirodes sp 1 0.2 1 Spinophryne gladisfenae 1 0 1 Gigantactis paxtoni 1 0.25 1 Ceratiidae - undifferentiated 1 0.01 1 Cryptopsaras couesii 4 0.72 4 Caulophryne jordani 1 0.1 1 Haplophryne mollis 1 0.01 1 Gobiesociformes Kopua spA 1 0 1 Stephanoberyciformes Melamphaes (red rakers) 1 0.1 1 Melamphaes cf indicus 2 0.03 2 Melamphaes polylepis 2 0.02 1 Melamphaes sp 3 0.1 2 Melamphaidae - undifferentiated 13 0.01 3 Poromitra cf megalops 2 0.01 1 Poromitra crassiceps 8 0.86 4 Poromitra sp 1 0.1 1 Scopeloberyx microlepis 1 0.01 1 Scopelogadus beanii 9 0.12 4 Scopelogadus mizolepis 4 0.13 2 Cetomimidae spA 1 0 1 Beryciformes Diretmichthys parini 13 11.58 9 Diretmus argenteus 5 0.13 4 Hoplostethus ?mediterraneus (= ?intermedius) 82 9.25 8 Hoplostethus atlanticus 149 116.2 19 Hoplostethus cf gigas (E. Aust species) 1 1.6 1 Hoplostethus intermedius 5109 628 21 Paratrachichthys trailli 2 0.4 1 Parinoberyx horridus 1 0.3 1 Anoplogaster cornuta 5 0.55 4 Beryx decadactylus 59 59.1 5 Beryx sp NFZ1 (cf splendens) 3 2.6 1 Beryx splendens 211 96.4 5 Centroberyx affinis 15 20.3 1 Centroberyx spA 4 2.2 3 Centroberyx spB 21 24.2 1 Cleidopus gloriamaris 1 0.2 1 Cetomimiformes Rondeletia loricata 2 0.15 2 Zeiformes Zenion spA 1 0.01 1 Zenion spB 350 2.5 1 Cyttopsis roseus 5 0.6 2 Zenopsis nebulosus 117 123.9 4 Zeus faber 1 0.5 1 Grammicolepis brachiusculus 18 12.6 4 Allocyttus verrucosus 641 356.4 22 Neocyttus rhomboidalis 13 3.85 4 Antigonia spA (big) 11 3.15 4

36
Antigonia spB cf malayana (small) 13 0.7 2 Antigonia spC 3 0.11 2 Syngnathiformes Fistularia commersonii 1 0.1 1 Fistularia petimba 6 1.9 2 Centriscops humerosus 9 1.4 2 Macroramphosus scolopax 5140 79.7 3 Notopogon xenosoma 14 1.11 4 Solegnathus dunckeri 3 0.3 2 Scorpaeniformes ?Phaenacoscorpia megalops 1 0.01 1 Dendrochirus cf zebra 2 0.01 1 Helicolenus barathri 404 98.35 14 Helicolenus percoides 30 30 3 Maxillicosta sp NFZ1 2 0.1 1 Neomerinthe sp 2 0.1 1 Pterois volitans 3 2.1 1 Scorpaena gibbifrons ? 1 0.01 1 Scorpaena spA 1 0.25 1 Scorpaena ?cookii 17 1.63 5 Scorpaenidae - undifferentiated 3 0.02 2 Setarches cf longimanus 5 0.25 2 Trachyscorpia capensis 10 9.9 5 Trachyscorpia sp. [in ISR Munro collection] 44 18.31 10 cf Sebastiscus spA 1 0.1 1 Pterygotrigla andertoni 1 0.01 1 Pterygotrigla pauli 292 69.5 5 Pterygotrigla spA 1 0.2 1 Onigocia pedimacula 1 0 1 Hoplichthys citrinus 2 0 1 Hoplichthys gilberti 4 0 1 Psychrolutes microporos 2 1.7 1 Psychrolutes spA 3 0.6 3 Psychrolutes spB 3 12.2 3 Psychrolutes spC 3 1.8 3 (Paraparidae) Psednos spA 1 0.1 1 Cyclopteridae - undifferentiated 1 0.01 1 Paraliparis sp. 1 0.01 1 Perciformes Callanthias australis 47 9.1 2 Caprodon spA 1 0.5 1 Caprodon spB 1 1 1 Caprodon spC 357 34.7 2 Chelidoperca lecromi 2 0.03 1 Epinephelus ergastularius 1 16 1 Epinephelus undulatostriatus 1 5.2 1 Hypoplectodes spA 2 0.01 1 Lepidoperca aurantia 3 1.3 1 Lepidoperca inornata 39 6 2 Lepidoperca magna 37 14.9 3 Ostracoberyx dorygenys 2 0.1 1 Plectranthias maculicauda 3 0.2 2

37
Plectranthias spA 3 0.03 2 Plectranthias spB 1 0.01 1 Plectranthias spC 3 0.1 1 Polyprion americanus 1 12.2 1 Synagrops japonicus 2 0.3 2 Synagrops philippinensis 4 0.4 1 ?Apogonichthys sp 5 0.1 1 Bathysphyrenops sp (Howella?) 1 0.01 1 Epigonus denticulatus 9 0.21 2 Epigonus lenimen 1 0.05 1 Epigonus telescopus 12 23.4 3 Howella sherboni 2 0.01 2 Howellidae 2 0.01 1 Pseudocaranx dentex 1 0.02 1 Seriola lalandi 2 28.7 1 Trachurus declivis 22 3.2 4 Trachurus novaezelandiae 23 0.3 2 Coryphaena hippurus 1 2.5 1 Brama brama 1 0.05 1 Emmelichthys nitidus 15091 645.05 3 Plagiogeneion rubiginosus 51 76.6 4 Pristipomoides filamentosus 3 25.5 2 Pterocaesio spA 1 0.25 1 Wattsia spA 1 0 1 Bathyclupea ?gracilis 31 7.5 3 Amphichaetodon howensis 2 0.22 2 Chaetodon guentheri 1 0.1 1 Chaetodontoplus ballinae 3 0.4 1 Parazanclistius spA 5 2.7 2 Pentaceros decacanthus 8 4.6 2 Pseudopentaceros richardsoni 437 1187.4 4 Zanclistius elevatus 4 2.3 2 Chromis abyssicola 1 0.1 1 Cheilodactylus vittatus 3 1.2 1 Nemadactylus sp. 24 20.45 3 Bodianus spA 1 0.02 1 Bodianus unimaculatus 7 0.45 2 Oxycheilinus bimaculatus 1 0.01 1 Suezichthys spA 1 0.1 1 Melanostigma gelatinosum 1 0.01 1 Melanostigma spA 1 0.01 1 Ophthalmolycus spA 1 0.1 1 Parapercis sp NFZ1 8 0.08 1 Parapercis spA 3 0.12 2 Parapercis spB 2 0.8 1 ?Pteropsaron spA 1 0.01 1 Acanthaphritis grandisquama 10 0.01 1 Percophidae gen spA 1 0 1 Kathetostoma sp (NZ n sp) 16 25.4 7 Pleuroscopus pseudodorsalis 8 26.3 7 Uranoscopus spA 1 0.3 1 Champsodon guentheri 1 0.05 1

38
Champsodon sp 1 0.1 1 Chiasmodon niger 3 0 1 Kali macrodon 4 0 1 Kali spA 2 0.11 2 Ammodytoides spA 2 0.11 2 Centrodraco cf rubellus 1 0.01 1 Prionurus maculatus 3 11.8 1 Diplospinus multistriatus 3 0.11 2 Promethichtys prometheus 1 0.5 1 Rexea antefurcata 339 54.3 9 Rexea solandri 1 0.6 1 Benthodesmus cf pacificus 2 1.1 2 Benthodesmus elongatus 3 0.8 2 Benthodesmus spA 3 0.2 1 Benthodesmus tuckeri 11 1.7 4 Benthodesmus ?tuckeri 9 2 3 Lepidopus caudatus 59 88.4 3 Centrolophus niger 1 5 1 Hyperoglyphe antarctica 20 63.4 4 Cubiceps baxteri 2 0.3 2 Cubiceps caeruleus 2 0.5 1 Cubiceps cf capesis 1 0.1 1 Cubiceps pauciradiatus 1 0.2 1 Pleuronectiformes Bothidae, Achiropsettidae, Paralichthyidae -undif 1 0.01 1 Bothus spA 1 0.01 1 Lophonectes sp NFZ1 19 0.7 4 Psettina spA 2 0.02 1 Azygopus cf pinnifasciatus 1 0.01 1 Symphurus sp 1 0.01 1 (Cyanoglossidae) Symphurus spB 15 0.07 3 Symphurus spC 7 0.13 4 Tetraodontiformes Aluterus monoceros 1 1.8 1 Meuschenia scaber 6 3.2 2 Thamnaconus analis 21 1.4 4 Thamnaconus cf modestoides 8 6.4 2 Thamnaconus spA 1 0.01 1 Lactoria fornasini 1 0.1 1 Lactoria reipublicae 3 2.1 1 Lactoria var1 5 1.8 2 Lactoria var2 1 0.1 1 Ostracion cf cubicus 1 0 1 Polyplacapros tyleri 41 8.2 4 Canthigaster callisterna 30 2.92 4 Pelagocephalus ?marki = (P. ?coheni) 6 0 2 Sphoeroides pachygaster 2 1.3 2 Torquigener spA 1 0.01 1 Allomycterus pilatus 710 521.5 4 Chilomycterus reticulatus 2 6.5 2 Diodon holocanthus 1 0.5 1 Diodontidae - undifferentiated 1 0.01 1

39
Table 4: List of invertebrate family groups recorded during NORFANZ (No_stations=number of trawls in which the family was caught). Family name No_stationsPorifera Tetillidae 1Ancorinidae 1Geodiidae 1Clionidae 2Tethyidae 1Raspailiidae 1Myxillidae 1Axinellidae 6Halichondriidae 14Callyspongiidae 7Chalinidae 1Niphatidae 4Phloeodictyidae 3Petrosiidae 1Irciniidae 8Thorectidae 1Dysideidae 1Farreidae 4Cnidaria Stylasteridae 17Physaliidae 1Antipathidae 10Alcyoniidae 3Chrysogorgiidae 14Clavulariidae 3Ellisellidae 3Isididae 25Melithaeidae 1Nephtheidae 4Nidaliidae 4Plexauridae 14Primnoidae 15Umbellulidae 3Pteroeididae 9Caryophylliidae 13Dendrophylliidae 4Flabellidae 17Priapulida Pogonophora? 3Phylum Priapulida 8Bryozoa Candidae 1Adeonidae 3Phidoloporidae 4Annelida Amphinomidae 4Eunicidae 3

40
Onuphidae 6Aphroditidae 1Nereididae 7Phyllodocidae 1Polynoidae 9Serpulidae 9Chaetopteridae 1Mollusca (non-Gastropda) Lepidopleuridae 1Chitonidae 1Mytilidae 3Arcidae 2Noetiidae 1Limopsidae 2Pteriidae 2Malleidae 1Limidae 3Ostreidae 3Pectinidae 1Propeamussiidae 7Spondylidae 2Anomiidae 1Chamidae 1Lucinidae 1Cardiidae 2Hiatellidae 1Cuspidariidae 7Spirulidae 3Sepiidae 1Sepiolidae 4Ancistrocheiridae 6Enoploteuthidae 6Undifferentiated 6Pyroteuthidae 6Octopoteuthidae 2Onychoteuthidae 2Histioteuthidae 16Ommastrephidae 11Chiroteuthidae 4Mastigoteuthidae 2Cranchiidae 19Vampyroteuthidae 2Opisthoteuthidae 5Bolitaenidae 3Octopodidae 3Gastropoda Fissurellidae 2Turbinidae 2Trochidae 2Caliostomatidae 6Seguenziidae 6Turritellidae 1

41
Xenophoridae 2Ovulidae 1Velutinidae 1Naticidae 1Ranellidae 5Epitoniidae 3Eulimidae 6Muricidae 6Buccinidae 8Volutidae 1Mitridae 3Costellariidae 1Turridae 6Conidae 5Philinidae 1Aplysiidae 1Echinodermata Pentacrinitidae 9Comasteridae 3Charitometridae 1Antedonidae 4Luidiidae 2Astropectinidae 18Benthopectinidae 13Goniasteridae 22Ophidiasteridae - unifferentiated 4Asterodiscididae 1Solasteridae 5Pterasteridae 5Asterinidae 4Echinasteridae 8Brisingidae 12Zoroasteridae 12Asteriidae 5Ophiomyxidae 9Euryalidae - informal 4Gorgonocephalidae 13Asteroschematidae 11Asteronychidae 2Ophiuridae 37Ophioleucidae - undiferentiated 5Ophionereididae 4Ophiodermatidae 4Ophiacanthidae 30Hemieuryalidae 1Ophiactidae 15Amphiuridae 8Ophiotrichidae 12Class Echinoidea 16Cidaridae 13Echinothuriidae 12Phormosomatidae 8

42
Diadematidae 3Aspidodiadematidae 6Pedinidae 9Toxopneustidae 1Echinidae 41Clypeasteridae 2Fibulariidae 4Laganidae 3Spatangidae 2Loveniidae 1Asterostomatidae 3Psolidae 2Cucumariidae 4Ypsilothuriidae 1Synallactidae 3Deimatidae 1Molpadiidae 2Crustacea (non-Malacostraca) Scalpellidae 6Sacculinidae 1Crustacea (Malacostraca) Lophogastridae 28Mysidae 13Cirolanidae 1Cymothoidae 1Serolidae 5Sphaeromatidae 7Lysianassidae 1Melitidae 2Corophiidae 3Euphausiidae 22Penaeidae 2Aristeidae 48Benthesicymidae 36Solenoceridae 32Sicyoniidae 12Sergestidae 28Spongicolidae 5Oplophoridae 43Nematocarcinidae 16Stylodactylidae 4Pasiphaeidae 39Bathypalaemonellidae 1Palaemonidae 8Alpheidae 3Hippolytidae 4Processidae 1Pandalidae 29Glyphocrangonidae 16Crangonidae 3Nephropidae 2Axiidae 1

43
Upogebiidae 1Polychelidae 39Palinuridae 1Scyllaridae 5Pylochelidae 3Paguridae 8Lithodidae 5Parapaguridae 37Galatheidae 24Chirostylidae 21Dromiidae 1Cyclodorippidae 3Homolidae 10Latreilliidae 2Dorippidae 2Leucosiidae 4Majidae 45Parthenopidae 3Cancridae 1Portunidae 9Xanthidae 2Goneplacidae 10Pilumnidae 4Plagusiidae 5Pycnogonida Colossendeidae 7Urochordata Didemnidae 1Pyrosomatidae 5Salpidae 6