vp sales and marketing---u · 2014 dmo compensation & benefits study 1 destination & travel...
TRANSCRIPT

ConfidentialAll Rights Reserved
Powered by

2014 DMO COMPENSATION & BENEFITS STUDY
Destination & Travel Foundation 2025 M Street, NW, Suite 500 Washington, DC 20036 USA www.destinationtravel.org
Tel: +1.202.296.7888
© 2014 – Destination & Travel Foundation
All rights reserved. This report may not be reproduced or transmitted in any form or by any means, electronic or mechanical, including photocopying, recording, or by an information storage and retrieval system, without permission in writing from the publisher.

2014 DMO Compensation & Benefits Study Destination & Travel Foundation
Table of Contents
Overview and Methodology ............................................................................................................................................................... 1
List of Participants ............................................................................................................................................................................. 2
Guide to Using This Report ............................................................................................................................................................... 4
Executive Summary Industry & Compensation Outlook ................................................................................................................................................. 8 DMOs Respond to the Economy ................................................................................................................................................. 10 Respondent Profile ..................................................................................................................................................................... 12 Compensation Levels ................................................................................................................................................................. 16 Benefit Policies ........................................................................................................................................................................... 18
Economic Climate ............................................................................................................................................................................ 21
Salary and Compensation Section ................................................................................................................................................. 28
Benefits Section Health and Dental Insurance ....................................................................................................................................................... 85 Life Insurance ............................................................................................................................................................................. 96 Disability Insurance/Paid Leave .................................................................................................................................................. 98 Retirement ................................................................................................................................................................................ 113 Special Benefits ........................................................................................................................................................................ 118 Contracts and Performance Evaluation (for CEOs only) ........................................................................................................... 137
Appendix Job Descriptions ....................................................................................................................................................................... 142 Survey Questionnaire ............................................................................................................................................................... 144

2014 DMO Compensation & Benefits Study 1 Destination & Travel Foundation
Overview and Methodology
The 2014 DMO Compensation & Benefits Study is the most comprehensive and up-to-date compensation and benefits data produced for DMOs. It provides valuable information when planning budgets, negotiating salary and compensation, hiring new employees, determining raises, evaluating DMO benefits programs and negotiating contracts. It is a must-have resource when justifying staff investment to stakeholders. The results are based on a survey of destination marketing organizations conducted in the first quarter of 2014. A total of 301 DMOs participated — 281 from the U.S. and twenty from Canada. Each completed questionnaire was assigned a confidential number and any reference to the DMO’s name was removed. The 2014 study marked the first time that the survey was sent to state and provincial DMOs. Included in the 301 respondents were four state/provincial DMOs. All data were checked manually and by a specially designed computer editing procedure. Strict confidentiality was maintained throughout the course of the project. The survey was compiled, tabulated and prepared for the Destination & Travel Foundation by Industry Insights, Inc., a research and consulting firm that specializes in industry operating surveys, compensation studies, member needs surveys, educational programs and customized research activities. To provide the detail needed, most tables report results by DMO Total Revenue, type of DMO and number of full-time equivalent employees. To simplify using the vast amount of information in this report, an executive summary is included, as well as a guide to using the data. The questionnaire and job descriptions used are included in the Appendix. Questions about the results or the Destination & Travel Foundation’s research program should be directed to [email protected] (tel: 1.202.296.7888). DMAI AND THE DESTINATION & TRAVEL FOUNDATION HAVE MADE NO INDEPENDENT VERIFICATION OF THE INFORMATION CONTAINED IN THE REPORT AND MAKE NO REPRESENTATIONS, ASSURANCES, GUARANTEES OR WARRANTIES, EXPRESS OR IMPLIED, WITH RESPECT TO THE ACCURACY OR COMPLETENESS OF THE INFORMATION PROVIDED. DMAI AND THE DESTINATION & TRAVEL FOUNDATION SHALL NOT BE LIABLE TO ANY OF THEIR MEMBERS OR ANY OTHER PERSONS OR ENTITIES FOR ANY INACCURACIES, ERRORS, OMISSIONS OR UNFAVORABLE COMPARISONS CONTAINED IN THE REPORT.

2014 DMO Compensation & Benefits Study 2 Destination & Travel Foundation
List of Respondents
The Destination & Travel Foundation thanks the destination marketing organizations representing these destinations for participating in this study:
Aberdeen, SD USA Alabama Gulf Coast, AL USA Albany County, NY USA Albert Lea, MN USA Albuquerque, NM USA Alexandria, VA USA Alexandria, MN USA Alpharetta, GA USA Amarillo, TX USA Amelia Island, FL USA Ames, IA USA Anaheim/Orange County, CA USA Anchorage, AK USA Ann Arbor, MI USA Annapolis/Anne Arundel Co., MD USA Arlington, TX USA Asheville, NC USA Ashtabula County, OH USA Athens, GA USA Atlanta, GA USA Auburn/Opelika, AL USA Auglaize/Mercer Counties, OH USA Augusta, GA USA Austin, TX USA Baltimore, MD USA Baton Rouge, LA USA Battle Creek/Calhoun County, MI USA Bay Area Houston, TX USA Bemidji, MN USA Block Island, RI USA Bloomington, IN USA Bloomington, MN USA Boston, MA USA Bowling Green, KY USA Branson/Lakes Area, MO USA Brownwood, TX USA Buffalo Niagara, NY USA
Burlington, ON Canada Burlington/Alamance County, NC USA Butler County, OH USA Cabarrus County, NC USA Cabell-Huntington, WV USA Cambridge/Guernsey Co., OH USA Cannon Beach, OR USA Carlsbad, CA USA Carroll County, OH USA Cass County, IN USA Central Florida, FL USA Charleston, SC USA Charlotte, NC USA Charlottesville Albemarle, VA USA Cheyenne, WY USA Chicago, IL USA Chicago Northwest, IL USA Chicago Southland, IL USA Chinook Country, AB Canada Cincinnati, OH USA Cincinnati Regional, KY USA Citrus County, FL USA City of Southlake, TX USA City of Warwick, RI USA Clark-Floyd Counties, IN USA Clermont County, OH USA Cleveland, OH USA Clinton County, OH USA Cobb, GA USA Colorado Springs, CO USA Columbus, OH USA Connecticut, USA Corvallis, OR USA Council Bluffs, IA USA Currituck County, NC USA Dallas, TX USA Dalton, GA USA
Darke County, OH USA Dayton/Montgomery County, OH USA DeKalb, GA USA Denton, TX USA Denver, CO USA Des Moines, IA USA Detroit, MI USA Door County, WI USA Dublin, OH USA DuPage, IL USA Durham, NC USA Eagan, MN USA Eau Claire, WI USA Elkhart County, IN USA Enid, OK USA Erie, PA USA Estes Park, CO USA Fairbanks, AK USA Fairfax, VA USA Fargo-Moorhead, ND USA Fayetteville, NC USA Finger Lakes, NY USA Florence, SC USA Florence/Lauderdale, AL USA Florida, USA Fort Collins, CO USA Fort Lauderdale, FL USA Fort Myers/Sanibel-Lee Co., FL USA Fort Wayne, IN USA Fort Worth, TX USA Fox Cities, WI USA French Lick West Baden, IN USA Fresno/Clovis, CA USA Glacier Country, MT USA Glenwood Springs, CO USA Gold Beach, OR USA Golden, BC Canada
Golden Isles, GA USA Grand Junction, CO USA Grand Rapids, MI USA Great Lakes Bay, MI USA Greenbrier County, WV USA Greene County, OH USA Greensboro, NC USA Gunnison-Crested Butte, CO USA Halifax, NS Canada Hamilton County, IN USA Hayward Lakes, WI USA Haywood County, NC USA Hendricks County, IN USA Henry County, IL USA Heritage Corridor, IL USA Hernando County, FL USA Hilliard, OH USA Hilton Head Island, SC USA Holland, MI USA Houma, LA USA Houston, TX USA Huntingdon County, PA USA Independence, MO USA Indiana Dunes, IN USA Indianapolis, IN USA Iowa City/Coralville, IA USA Iron Range, MN USA Irving, TX USA Ithaca/Tompkins County, NY USA Jackson, MS USA Jackson County, MI USA Jacksonville, FL USA Janesville, WI USA Jasper, AB Canada Johnston County, NC USA Joplin, MO USA Kalamazoo, MI USA

2014 DMO Compensation & Benefits Study 3 Destination & Travel Foundation
List of Respondents (cont.)
Kamloops, BC Canada Kansas City, MO USA Kelowna, BC Canada Klamath, OR USA Knoxville, TN USA Kosciusko County, IN USA Lafayette, LA USA Lafayette - West Lafayette, IN USA Lake Charles/SW Louisiana, LA USA Lake County, OH USA Lake County, IL USA Lake Erie Shores & Islands, OH USA Lake Havasu City, AZ USA Lansing, MI USA Las Vegas, NV USA Laurel Highlands, PA USA Lehigh Valley, PA USA Lexington, KY USA Lisle, IL USA Little Rock, AR USA Long Island, NY USA Longmont, CO USA Lorain County, OH USA Los Angeles, CA USA Loudoun, VA USA Louisville, KY USA Lubbock, TX USA Macon-Bibb County, GA USA Madison, IN USA Madison, WI USA Mammoth Lakes, CA USA Mansfield/Richland County, OH USA Marietta/Washington Co., OH USA McAllen, TX USA Memphis, TN USA Mendocino County, CA USA Miami, FL USA Middlesex County, NJ USA Milwaukee, WI USA
Minneapolis, MN USA Missouri, USA Mitchell, SD USA Monterey County, CA USA Montreal, QC Canada Myrtle Beach, SC USA Napa Valley, CA USA Naples, Marco Island, Everglades, FL USA Nashville, TN USA New Orleans, LA USA New Smyrna Beach, FL USA Newport, RI USA Newport Beach, CA USA Norfolk, VA USA Northern Kentucky, KY USA Oak Park, IL USA Oakland, CA USA Ocala/Marion County, FL USA Oklahoma City, OK USA Omaha, NE USA Orlando, FL USA Ottawa, ON Canada Palm Beach County, FL USA Palm Springs, CA USA Peachtree City, GA USA Prince Edward Island, Canada Pennsylvania Dutch, PA USA Peoria, IL USA Perry County, IN USA Philadelphia, PA USA Phoenix, AZ USA Pittsburgh, PA USA Placer Valley, CA USA Plano, TX USA Pocono Mountains, PA USA Portland, OR USA Providence Warwick, RI USA Puerto Rico, USA
Pulaski County, MO USA Racine, WI USA Raleigh, NC USA Randolph County, NC USA Reading, PA USA Red Wing, MN USA Reno-Sparks, NV USA Richmond, BC Canada Richmond, VA USA Ridgeland, MS USA Rochester, NY USA Rock Hill/York County, SC USA Rockford, IL USA Roseville, MN USA Ross-Chillicothe, OH USA Roswell, GA USA Ruston Lincoln Parish, LA USA Saint John, NB Canada Salem, OR USA Salt Lake, UT USA San Antonio, TX USA San Diego, CA USA San Jose, CA USA San Marcos, TX USA Santa Clara, CA USA Santa Monica, CA USA Santa Rosa, CA USA Sarasota County, FL USA Saskatoon, SK Canada Savannah, GA USA Scottsdale, AZ USA Seattle, WA USA Seattle Southside, WA USA Sheboygan County, WI USA Shreveport-Bossier, LA USA South County, RI USA South Shore, IN USA South Walton, FL USA Spokane, WA USA
Springfield, MO USA St. Charles, IL USA St. Louis Park, MN USA St. Petersburg/Clearwater, FL USA Stevens Point, WI USA Stockton, CA USA Sun Peaks, BC Canada Syracuse, NY USA Tempe, AZ USA Toledo, OH USA Topeka, KS USA Toronto, ON Canada Traverse City, MI USA Tri-Cities, WA USA Tucson, AZ USA Tuscarawas County, OH USA Utah Valley, UT USA Valley Forge, PA USA Vancouver, BC Canada Victoria, BC Canada Virginia Beach, VA USA Warren County, OH USA Washington County, FL USA Washington, DC USA Waterloo, IA USA Waterloo Region, ON Canada Wayne County, OH USA Westchester County, NY USA Wichita, KS USA Wilmington, DE USA Windsor Essex Pelee Island, ON Canada Winnipeg, MB Canada Winston-Salem, NC USA Wisconsin Dells, WI USA Yakima Valley, WA USA York County, PA USA
2014 DMO Compensation & Benefits Study 4 Destination & Travel Foundation
Guide to Using This Report
Comparing Your DMO’s Compensation Information to Survey Results
As a DMO compares its compensation information to that of the industry as a whole, it is important to remember that the statistics in this report should be regarded as guidelines rather than absolute standards. Because DMOs differ depending on their location, size and other factors, any two DMOs may offer their employees a reasonably attractive compensation package and yet be very different. For example, duration of employment and nature of previous experience will influence the compensation offering for a particular individual. Thus, a deviation between any one DMO’s figures and a number appearing on a table in this report is not necessarily good or bad; it is merely an indication that additional scrutiny may be warranted.
Compensation information can be used to:
“market price” jobs to determine appropriate wages
develop budgets
set pay structures
develop job evaluation systems
evaluate new programs
determine whether certain non-base salary programs are competitive
Choosing the Correct Breakdown of the Data
DMOs should first compare their positions under review with the positions and job descriptions provided in this report. The job descriptions should be used as a deciding factor when choosing comparable positions. In some cases, the job description will not be identical to the position under review. In such cases, either of the “earning” percentiles can be used. If the position under review involves more responsibilities than those listed in the job description, the “25% earn more than” statistic may be used to take into consideration this increased complexity. If the position under review involves less responsibility, then the “75% earn more than” statistic can be used.
In addition, other factors can be taken into consideration when comparing results, including:
number of employees
Total Revenue
type of DMO
Users of this report should also seek other available non-DMO compensation and benefits surveys in their geographical areas since DMOs compete with other industries for some of their employees.

2014 DMO Compensation & Benefits Study 5 Destination & Travel Foundation
Guide to Using This Report (cont.)
Using the Statistics Provided in This Report
Four statistics are provided for all compensation information: mean, median, “25% earn more than” and “75% earn more than.” The choice of which statistic to use is based on organizational goals as well as on the position being analyzed. For example, if the goal of the organization is to lead the market in terms of pay levels, the “25% earn more than” statistic should be used. The mean and the median are both accepted statistics for analysis. Whether one or the other is used is largely due to personal preference, with one exception. If the mean and the median differ greatly for a given position, the range of information provided by respondents is wide. The median will show a result that minimizes the impact of “outlying values” (values that are either very high or very low relative to most responses). Calculating Market Ratios
Market ratios show where current pay levels are above or below the benchmark provided in the survey. A ratio can be obtained by dividing existing salary levels by the level provided in this report and multiplying the result by 100. If the ratio is close to 100, the existing salary level is close to the market average. Ratios that are significantly higher or lower than 100 (usually over 110 or below 90) should be analyzed further to determine if a position is overpaid or underpaid in relation to the market. In these cases it is important to verify the accuracy of the comparison. Factors such as the applicability of the job description to the position being analyzed and the DMO characteristics (size, location) can affect the accuracy of the comparison. Format of Data Tabulations
The tables in this report are formatted to provide summary information as well as breakdowns of survey data, where applicable. Breakdowns of the data are provided for the following three groupings:
Current budget: The DMO’s budget for the current fiscal year broken out into various ranges.
Type of DMO: Separated by public or private sector, and membership or non-membership base.
Number of Employees (full-time equivalent): Number of employees calculated in terms of full-time equivalency. Full-time equivalency is calculated by dividing the total number of hours worked per year by part-time employees by 2080 hours, which is the traditional number of hours worked by a full-time employee in one year, added to the number of full-time employees.
Minimum Reporting Requirements for Salary Levels
To ensure the confidentiality of individual responses, minimum levels of response were required for release of compensation information. At least four responses were required to release the data.

2014 DMO Compensation & Benefits Study 6 Destination & Travel Foundation
Guide to Using This Report (cont.)
Using the Statistics Provided in This Report Definitions
Mean: The average of all responses received to a question.
Median: A measure of central tendency, i.e., half of the responses received were higher than the median reported while the other half were lower.
“75% earn more than. . .”: 75% of the people in this position earn at least the amount shown.
“25% earn more than. . .”: 25% of the people in this position earn at least the amount shown.
Fixed Salary: Fixed salary for the most current fiscal year. Excludes variable compensation.
Variable—Performance-based Cash Compensation: Portion of annual wages earned from meeting established performance objectives, which would be reflected on a W-2/T-4 statement for the most current fiscal year (estimated).
Variable—Transaction-based Cash Compensation (Commissions): Wages earned from the volume and/or dollar amount of transactions generated that would be reflected on a W-2/T-4 for the most current fiscal year (estimated).
Total Compensation: The sum of the fixed salary, performance-based cash compensation and transaction-based cash compensation (commission) awarded to the employee.
Employee Benefits: All benefits that the DMO voluntarily provides to employees (i.e., not including mandatory taxes and workers’ compensation). Includes the annual employer-provided portion of all types of insurance plans (not including employees’ contributions to these plans); and various reimbursed expenses such as car allowances, country/city club memberships, educational expenses, and association membership fees.
Deferred Compensation: Compensation that is performance-based (paid by the employer) and deferred beyond the current year and placed into some type of trust. This is not to be confused with deferred compensation that goes into a benefit plan on behalf of an employee, such as a pension plan, and in the U.S., 401(k), 403(b), Section 457(f) or 457(b), which are not part of a performance-based incentive plan.
Public Sector Entity: DMO operates as a government entity, such as a city, county, regional or quasi-government agency.
Private Sector Entity: DMO operates as an independent, non-profit organization and is not part of a government entity.
Membership/Partner Based: DMO receives funding from local organizations (i.e., hotels, restaurants, etc.) that pay dues.
Non-membership/Partner Based: DMO does not have members/partners that pay dues.

2014 DMO Compensation & Benefits Study 7 Destination & Travel Foundation
Executive Summary

2014 DMO Compensation & Benefits Study 8 Destination & Travel Foundation
Industry & Compensation Outlook
Travel Expenditures Continue Upward Rise
U.S. travel expenditures have risen 28% from 2009 to 2013. Overall travel spending by domestic and international visitors in the U.S. is expected to reach $940 billion in 2014, a 5.1% increase over 2013 (see Chart 1). Additional growth is forecast in 2015 as the overall economy continues to post modest growth.
Chart 1
Total U.S. Travel Expenditures (U.S. Residents and International Visitors)
Source: US Travel Assn., U.S. Dept. of Commerce, Office of Travel & Tourism Industries. *Forecast
Inflation Remains Low
The cost for goods and services in the U.S. fell to 1.5% in 2013 and is expected to remain low through 2015. (see Chart 2).
Chart 2
Inflation (Consumer Price Index) % Change From Previous Year
Source: U.S. Department of Labor, U.S. Travel Association *Forecast
Cost of Travel Modestly Higher
After a big jump in 2011, the cost of travel showed slower growth in 2012 and 2013. The cost of travel is expected to increase at a slightly faster pace in 2014 and 2015.
Chart 3
Travel Price Index % Change From Previous Year
Source: US Travel Association *Forecast
$773 $700 $747
$813 $855 $894 $940 $985
2008 2009 2010 2011 2012 2013 2014* 2015*
3.8%
-0.3%
1.6%
3.1% 2.1%
1.5% 2.0% 2.2%
2008 2009 2010 2011 2012 2013 2014* 2015*
5.6%
-6.3%
3.8% 6.5%
2.3% 2.4% 3.3% 2.7%
2008 2009 2010 2011 2012 2013 2014* 2015*

2014 DMO Compensation & Benefits Study 9 Destination & Travel Foundation
Industry & Compensation Outlook (cont.)
Consumer Confidence Remains Low
Consumer confidence dipped in the fall of 2013 following the government shutdown and the rollout of the Affordable Care Act (ACA). In more recent months consumer confidence has picked up, remaining above 80% in 2014. (The Consumer Confidence Index signals weakness in the economy when below 75.0%.)
Chart 4
Consumer Confidence Index 2013 and 2014
Indexed to 1985 = 100. Source: Conference Board
Unemployment Rate Jumps
The unemployment rate has steadily fallen from the highs experienced in 2010, but remains at a historically elevated level.
Chart 5
Unemployment Rate
Source: U.S. Department of Labor *Forecast
Salary Budgets Increase Slightly Across all industries, salary budget increases in 2009 were the lowest in well over 10 years in the U.S., at around two percent. Since then, companies have experienced salary budget increases of 3%.
Table 1 Salary Budget Increases
2008 2009 2010 2011 2012 2013* 2014*
Non-exempt, hourly non-union 3.8% 2.3% 2.7% 3.0% 3.0% 2.8% 3.0%
Non-exempt salaried 3.8% 2.1% 2.7% 3.0% 3.0% 2.9% 3.1%
Exempt salaried 3.9% 2.2% 2.7% 3.0% 3.0% 2.9% 3.1%
Officers/Executives 4.0% 2.0% 2.7% 3.0% 3.0% 2.9% 3.1% Source: WorldatWork 2013-2014 Salary Budget Survey *Forecast
72
.9%
73
.8%
77
.6%
78
.6%
76
.4%
84
.5%
84
.1%
85
.1%
82
.1%
77
.5%
73
.2%
75
.1%
82
.5%
81
.2%
81
.6%
80
.0%
84
.1%
J F M A M J J A S O N D2013 2014
5.8%
9.3% 9.6% 8.9% 8.1% 7.6% 6.7% 6.3%
2008 2009 2010 2011 2012 2013 2014* 2015*

2014 DMO Compensation & Benefits Study 10 Destination & Travel Foundation
DMOs Respond to the Economy
The improving economic conditions in the U.S. are evident in Table 2. The most popular action in 2013 among DMOs was to create new positions and fill them (35%), while another 20% indicated they filled vacant or previously frozen positions. Only 2% of the respondents reported making staff layoffs or mandating a temporary hiring freeze.
Table 2
Percent of DMOs that have taken the following actions in 2013:
Created new positions and filled them .......................................................................................................35%
Filled vacant/previously frozen positions ...................................................................................................20%
Added any employee benefits ....................................................................................................................14%
Reduced travel, training or other employee-related expenses ..................................................................10%
Frozen salaries ..............................................................................................................................................7%
Reduced the percentage or amount your DMO contributes toward health insurance premiums ..............4%
Eliminated or adjusted 401(k)/403(b) match contributions .........................................................................4%
Eliminated or postponed bonuses ................................................................................................................3%
Made staff layoffs .........................................................................................................................................3%
Terminated contract employees or any third party/outside employee arrangements ...............................3%
Mandated a temporary hiring freeze ...........................................................................................................2%
Offered a buyout offer/voluntary early retirement......................................................................................2%
Eliminated any other employee benefits......................................................................................................1%
Reduced, frozen or terminated a defined benefit pension plan ..................................................................1%
Implemented leave without pay/mandatory unpaid vacation .....................................................................0%
2014 DMO Compensation & Benefits Study 11 Destination & Travel Foundation
DMOs Respond to the Economy (cont.)
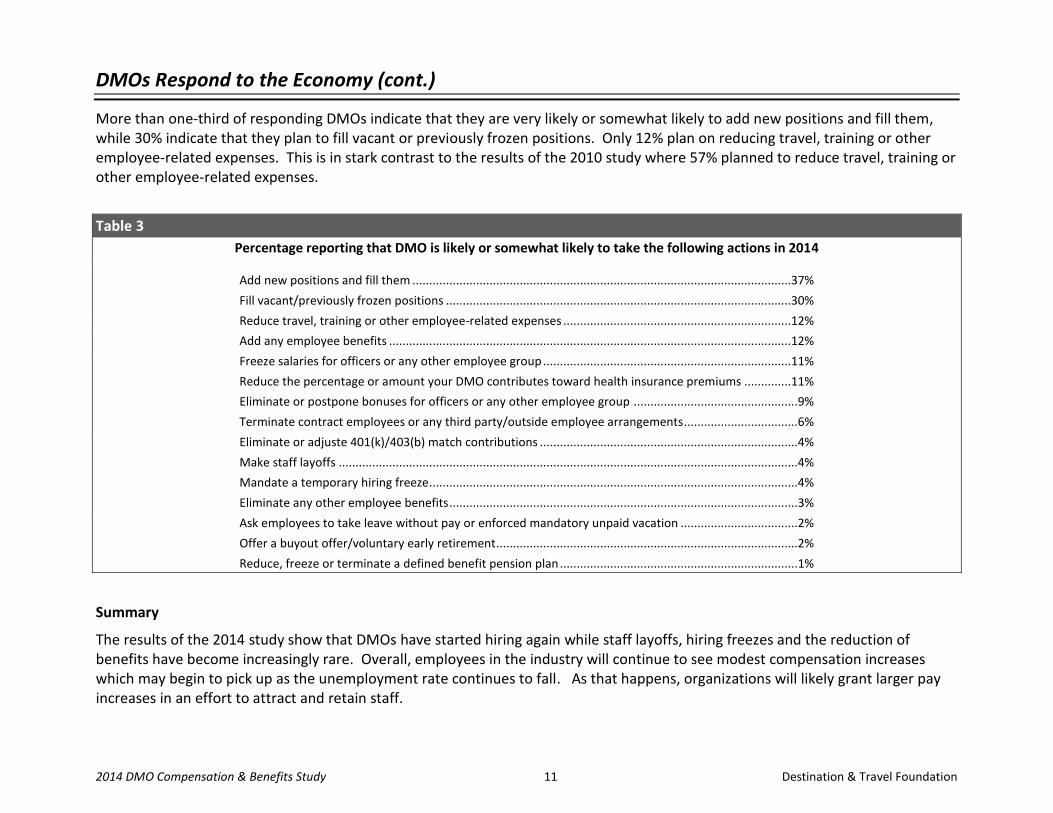
More than one-third of responding DMOs indicate that they are very likely or somewhat likely to add new positions and fill them, while 30% indicate that they plan to fill vacant or previously frozen positions. Only 12% plan on reducing travel, training or other employee-related expenses. This is in stark contrast to the results of the 2010 study where 57% planned to reduce travel, training or other employee-related expenses.
Table 3
Percentage reporting that DMO is likely or somewhat likely to take the following actions in 2014
Add new positions and fill them .................................................................................................................37%
Fill vacant/previously frozen positions .......................................................................................................30%
Reduce travel, training or other employee-related expenses ....................................................................12%
Add any employee benefits ........................................................................................................................12%
Freeze salaries for officers or any other employee group ..........................................................................11%
Reduce the percentage or amount your DMO contributes toward health insurance premiums ..............11%
Eliminate or postpone bonuses for officers or any other employee group .................................................9%
Terminate contract employees or any third party/outside employee arrangements..................................6%
Eliminate or adjuste 401(k)/403(b) match contributions .............................................................................4%
Make staff layoffs .........................................................................................................................................4%
Mandate a temporary hiring freeze..............................................................................................................4%
Eliminate any other employee benefits ........................................................................................................3%
Ask employees to take leave without pay or enforced mandatory unpaid vacation ...................................2%
Offer a buyout offer/voluntary early retirement..........................................................................................2%
Reduce, freeze or terminate a defined benefit pension plan .......................................................................1%
Summary
The results of the 2014 study show that DMOs have started hiring again while staff layoffs, hiring freezes and the reduction of benefits have become increasingly rare. Overall, employees in the industry will continue to see modest compensation increases which may begin to pick up as the unemployment rate continues to fall. As that happens, organizations will likely grant larger pay increases in an effort to attract and retain staff.

2014 DMO Compensation & Benefits Study 12 Destination & Travel Foundation
Respondent Profile
A total of 301 DMOs responded to the survey. Of those, 281 were in the United States and twenty were in Canada. Respondents included a cross-cut of large and small DMOs operating as either public sector or private sector entities. This ensures that a wide range of DMOs will find the results of this survey applicable to their organizations. The following charts provide a profile of respondents within the various demographic components of the study.
Total Revenues-U.S. Respondents (U.S. Dollars)
Total Revenues-Canadian Respondents (Canadian Dollars)
Percentage of Total
$0 to $499,999 13.5%
$500,000 to $999,999 17.4%
$1,000,000 to $1,999,999 20.3%
$2,000,000 to $3,999,999 17.1%
$4,000,000 to $9,999,999 13.5%
$10 million or more 18.1%
Percentage of Total
$0 to $499,999 10.0%
$500,000 to $999,999 20.0%
$1,000,000 to $1,999,999 15.0%
$2,000,000 to $3,999,999 30.0%
$4,000,000 to $9,999,999 5.0%
$10 million or more 20.0%
The median total revenues for U.S. DMOs was $1.9 million. The median increase in total revenues over the past year for
U.S. DMOs was 3.1%.
The median total revenues for Canadian DMOs was $2.3
million (Canadian dollars). The median increase in total revenues over the past year for
Canadian DMOs was 2.4%.

2014 DMO Compensation & Benefits Study 13 Destination & Travel Foundation
Respondent Profile (cont.)
Organizational Structure of DMO (All Respondents)
Type of DMO (All Respondents)
The majority of respondents classify themselves as 501(c)(6)s.
Quasi-government entities made up nearly 10% of the DMO respondents.
The majority of responding DMOs are non-membership based.
Non-profit (Canada only),
6.7%
Quasi-gov't. Entity, 9.1%
State/Regional/Provincial
Agency, 2.4%
County Agency, 5.1%
City Agency, 4.7%
Chamber of Commerce,
4.0% Independent
501(c)(3), 4.7%
Independent 501(c)(6), 60.3%
Other, 3.0%
Membership based, 41.2%
Non-membership Based, 58.8%

2014 DMO Compensation & Benefits Study 14 Destination & Travel Foundation
Respondent Profile (cont.)
Number of Employees (Full-time Equivalent)—All Respondents
Staff Employed by DMO (Full-time Equivalent) All Respondents
Current Fiscal Year
(median) Past Fiscal Year
(median)
All Respondents 11.5 11.5
Current Revenue
$0 to $499,999 2.0 2.0
$500,000 to $999,999 5.0 5.0
$1,000,000 to $1,999,999 8.0 7.0
$2,000,000 to $3,999,999 15.6 15.6
$4,000,000 to $9,999,999 25.0 24.0
$10 million or more 60.0 60.0
One-third of all respondents reported 20 or more full-time equivalent (FTE) employees.
One out of five responding DMOs reported fewer than five full-time equivalent employees.
The median number of full-time equivalent employees remained steady at 11.5 in both the current and past fiscal year.
The smallest responding DMOs (budget less than $500,000) reported a median number of FTE employees of 2.0, while the largest (budget of $10 million or more) reported 60.0.
Note: The table above reflects the median number FTE employees for those DMOs providing figures for fiscal year 2013 and 2014.
Fewer than 5, 20.0%
5 to 9, 25.7%
10 to 19, 21.0%
20 to 34, 13.0%
35 to 59, 11.0%
60+, 9.3%

2014 DMO Compensation & Benefits Study 15 Destination & Travel Foundation
Respondent Profile (cont.)
Gross Payroll/Personnel Costs for Current Fiscal Year – All Respondents
Count
Shown as a Percent of Gross Payroll/Personnel Costs Personnel Cost as a % of Budget Fixed Salary
Variable Cash Compensation Payroll Taxes Benefits Total
All Respondents 279 77.6% 3.1% 6.1% 13.1% 100.0% 37.4%
Organizational Structure
Private 190 77.9% 3.7% 6.5% 11.9% 100.0% 39.1%
Public 77 76.7% 1.8% 5.2% 16.3% 100.0% 34.0%
Type of Bureau
Membership based 111 77.1% 4.6% 6.1% 12.2% 100.0% 39.0%
Non-membership based 163 77.9% 2.1% 6.2% 13.8% 100.0% 36.4%
Total Revenue
$0 to $499,999 35 85.0% 0.2% 7.0% 7.8% 100.0% 38.8%
$500,000 to $999,999 48 79.3% 1.7% 6.1% 12.9% 100.0% 42.7%
$1,000,000 to $1,999,999 57 78.2% 1.8% 6.4% 13.7% 100.0% 39.0%
$2,000,000 to $3,999,999 52 77.9% 4.0% 5.4% 12.7% 100.0% 36.2%
$4,000,000 to $9,999,999 37 76.3% 4.5% 6.0% 13.3% 100.0% 35.8%
$10 million or more 50 70.9% 6.2% 6.2% 16.7% 100.0% 32.0%
Number of Employees
Less than 5 52 82.3% 1.1% 6.9% 9.7% 100.0% 37.1%
5 to 9 71 79.0% 1.7% 6.1% 13.2% 100.0% 39.6%
10 to 19 60 78.5% 2.9% 5.5% 13.1% 100.0% 38.9%
20 to 34 37 76.2% 4.2% 6.1% 13.5% 100.0% 38.1%
35 to 59 33 72.7% 5.5% 6.2% 15.6% 100.0% 36.8%
60 or more 25 70.1% 7.1% 6.3% 16.6% 100.0% 34.9%
Personel costs averaged 37.4% of total revenue for responding DMOs, down from 38.8% reported in 2012.
In general, variable cash compensation is more common with larger organizations.

Transaction-based cash compensation is uncommon for many job titles, therefore some of the results in this column are very low.
2014 DMO Compensation & Benefits Study 16 Destination & Travel Foundation
Compensation Levels
Compensation levels are provided for 51 key DMO positions. Annual fixed salaries are reported for the most current fiscal year. Performance-based cash compensation includes the portion of annual wages that is earned from meeting established performance objectives. Transaction-based cash compensation is wages earned from the volume and/or dollar amount of transactions generated. Total compensation is the sum of fixed salary, performance-based and transaction-based cash compensation.
Summary Results – All Respondents Count Average Fixed
Salary
Average Variable: Transaction-based
Cash Compensation
Average Variable: Performance-based Cash Compensation
Average Total Compensation
Executive President/CEO/Executive Director 276 $137,894 $1,814 $16,674 $156,381
Deputy Director/COO 43 $125,055 $151 $9,622 $134,828
Sales and Marketing EVP, Sales & Marketing 58 $126,640 $4,372 $19,718 $150,730
VP, Convention Sales 72 $119,897 $4,294 $12,479 $136,670
Director, Convention Sales 103 $86,296 $3,870 $6,318 $96,484
National/Senior Convention Sales Manager 77 $81,177 $4,049 $7,781 $93,007
Convention Sales Manager 122 $58,046 $2,495 $3,207 $63,748
Convention Sales/Account Executive 48 $46,841 $1,195 $2,855 $50,892
Satellite Office Manager in Washington, DC 31 $94,243 $5,655 $7,856 $107,754
Satellite Office Manager in Chicago, IL 25 $92,349 $5,195 $8,939 $106,484
Sales/Promotion Coordinator 83 $42,959 $517 $776 $44,252
Director, Convention Services 62 $74,908 $1,136 $4,781 $80,825
Manager, Convention Services 93 $51,342 $610 $1,874 $53,826
Director, Housing Services 7 $57,367 $1,007 $2,162 $60,535
Manager, Housing Services 27 $49,129 $696 $61,713 $51,538
Housing Clerk 13 $38,635 $27 $743 $39,405
Director/Manager of Sports Marketing/Sales 103 $64,459 $2,060 $4,348 $70,867
Convention Research Analyst 26 $55,172 $394 $1,687 $57,253
VP/Director, Tourism/Travel Trade Sales 60 $89,329 $1,980 $5,623 $96,931
National/Senior Tourism Sales Manager 33 $69,152 $2,018 $2,590 $73,761
Tourism Sales Manager 87 $50,435 $1,073 $2,044 $53,552
International Tourism Sales Manager 21 $62,508 $1,390 $2,955 $66,853
Manager, Visitor Services/Information 114 $46,192 $86 $1,294 $47,572
Visitor Services Specialist/Counselor 100 $34,990 $47 $290 $35,327

Transaction-based cash compensation is uncommon for many job titles, therefore some of the results in this column are very low.
2014 DMO Compensation & Benefits Study 17 Destination & Travel Foundation
Compensation Levels (cont.)
Sales and Marketing (cont.)
Chief Marketing Officer 24 $144,341 $0 $19,090 $163,430
VP, Marketing 49 $105,245 $1,050 $7,455 $113,751
Director of Marketing 110 $65,447 $211 $2,420 $68,078
Manager of Online Marketing/Digital Marketing/eMarketing 90 $54,930 $218 $1,966 $57,114
Content Marketing Manager/Social Media Manager 89 $43,627 $351 $1,102 $45,081
Director/Manager of Multicultural Tourism 15 $80,038 $1,951 $3,592 $85,582
Director/Manager, Research 29 $70,607 $82 $3,226 $73,915
Manager, Product/Special Event Development 50 $54,183 $0 $1,649 $55,832
Communications VP, Communications 37 $106,174 $238 $7,966 $114,379
Director/Manager of Communications/PR 137 $58,899 $109 $1,852 $60,861
Director/Manager, Publications 33 $59,226 $486 $1,777 $61,489
Publications/Graphic Designer 72 $48,232 $157 $1,303 $49,693
Director/Manager, Government Affairs/Public Policy/Community Relations 25 $73,744 $1,704 $2,809 $78,257
Film Commissioner 11 $68,587 $1,136 $685 $70,409
Communications/PR Coordinator/Assistant 102 $38,777 $297 $931 $40,004
Membership VP, Membership 20 $97,229 $10,970 $6,778 $114,978
Director, Membership 45 $63,242 $2,694 $2,885 $68,821
Membership Sales Manager 54 $45,194 $9,117 $1,932 $56,243
Membership Services Manager 34 $42,998 $1,480 $1,596 $46,075
Membership Coordinator 47 $37,292 $122 $842 $38,256
Director/Manager, Partnerships/Sponsorships 29 $62,335 $5,064 $3,680 $71,080
Finance/Operations/Administration VP/Director of Finance/Administration 87 $115,419 $529 $8,948 $124,897
Director/Manager of Accounting/Finance 97 $68,535 $111 $2,143 $70,789
Accounting Clerk/Bookkeeper 77 $45,030 $95 $882 $46,007
Technology Director/Manager of Human Resources 52 $69,232 $149 $4,178 $73,559
Office Manager 74 $46,862 $39 $1,078 $47,979
Supervisor, Printing/Mailing/Copying 24 $39,638 $75 $1,309 $41,022

2014 DMO Compensation & Benefits Study 18 Destination & Travel Foundation
Benefit Policies*
Health and Dental Insurance
Preferred Provider Organization (PPO) plans are the most popular type of health plan among responding DMOs (52% offered). High deductible/health savings account plans (HSAs) ranked second in popularity (21%). Traditional indemnity plans are offered by only 7%. DMOs reported a 6% increase in their healthcare costs over the previous year and a 2% increase in dental costs. Nearly half (47%) of the respondents have taken steps within the last year to reduce healthcare costs. The most popular steps were
increasing deductibles, changing insurance carriers and increasing the out-of-pocket maximum limit. Twenty percent of the respondents made changes to their health insurance due to the implementation of the Affordable Care Act (ACA).
Of those, one-third increased coverage to comply with the ACA. Life Insurance
More than half of responding DMOs offer accidental death and dismemberment insurance (59%) and term life insurance (55%). Only 13% report offering whole/universal life insurance. Less than one-quarter of the respondents offer dependent life insurance. Disability Insurance/Paid Leave
More than half (54%) of responding DMOs offer short-term disability insurance, while more than two-thirds (72%) offer long-term disability insurance. Both short- and long-term disability coverage typically pay 60% of salary. The typical DMO offers two weeks vacation after one year of service, three weeks after five years of service, four weeks after 10 years of service and five weeks after 15 years of service. The typical DMO offers 10 sick days. More than half (58%) of the respondents offer a paid time off plan (PTO) that combines vacation, sick and personal leave. Retirement Plans
The vast majority of responding DMOs (83%) provide retirement plans for which all employees can be eligible. Of those, 50% offer defined contribution plans and 17% offer defined benefit plans (pension). The most popular defined contribution plan is a 401(k) plan, offered by 74% of those with defined contribution plans.
*The percentages referenced in this section refer to benefits provided to all employees excluding CEO and/or Senior/Middle Management.

2014 DMO Compensation & Benefits Study 19 Destination & Travel Foundation
Benefit Policies (cont.)
Special Benefits
Two-thirds of the responding DMOs offer fees for meetings/conferences (70%), mileage reimbursement (66%) and education programs and/or seminars (66%). If offered, company-paid automobiles, club memberships and spouse/partner travel to DMO meetings are perquisites generally provided to the CEO and senior management only.
Contracts
More than half (53%) of responding DMOs have formal contracts or letters of agreement for their chief executive officers, while nearly one-quarter of respondents report having no contracts. The typical length of contracts is three years. Variable Cash Compensation
One-third of responding DMOs have a variable cash compensation plan. Of the two types of variable cash compensation (performance-based and transaction-based), performance-based is much more popular. The table below summarizes the top three criteria for determining variable cash compensation for key functional areas.
Top Three Criteria for Determining Variable Cash Compensation by Functional Area
Functional Area Criterion #1 Criterion #2 Criterion #3
CEO Board-set objectives (55%) DMO performance (51%) Personal performance objectives (44%)
Sales-Conventions Room nights (48%) Sales leads (33%) Bookings and Personnel performance objectives (31% each)
Sales-Travel Trade Personal performance objectives (26%) Sales leads (24%) Room nights (22%)
Sales-Membership New member dues (25%) Member retention (22%) Personnel performance objectives (20%)
Marketing Personal performance objectives (34%) DMO performance (17%) Board-set objectives (9%)
Convention Services Personal performance objectives (26%) DMO performance (16%) Room nights (12%)
Communications/PR Personal performance objectives (25%) DMO performance (12%) Board-set objectives (10%)
Finance/Accounting Personal performance objectives (30%) DMO performance (18%) Board-set objectives (9%)
Visitor Services Personal performance objectives (23%) DMO performance (11%) Board-set objectives (8%)
Technology Personal performance objectives (18%) DMO performance (10%) Board-set objectives (6%)

2014 DMO Compensation & Benefits Study 20 Destination & Travel Foundation
Economic Climate Section

2014 DMO Compensation & Benefits Study 21 Destination & Travel Foundation
Economic Climate
Total Revenue
All Respondents $0 to
$499,999 $500,000 to
$999,999 $1,000,000 to
$1,999,999 $2,000,000 to
$3,999,999 $4,000,000 to
$9,999,999 $10 million
or more
Percent of DMOs that have taken the following actions in 2013:
Count 301 121 173 40 53 60 54
Created new positions and filled them 35% 41% 31% 18% 21% 32% 31%
Filled vacant/previously frozen positions 20% 21% 19% 18% 11% 20% 19%
Added any employee benefits 14% 18% 12% 10% 8% 10% 20%
Reduced travel, training or other employee-related expenses 10% 12% 9% 5% 21% 8% 6%
Frozen salaries 7% 6% 8% 5% 13% 5% 4%
Reduced the percentage or amount your DMO contributes toward health insurance premiums 4% 6% 3% 8% 6% 2% 6%
Eliminated or adjusted 401(k)/403(b) match contributions 4% 5% 2% 3% 4% 3% 2%
Eliminated or postponed bonuses 3% 3% 2% 5% 0% 2% 6%
Made staff layoffs 3% 2% 3% 0% 2% 5% 2%
Terminated contract employees or any third party/outside employee arrangements 3% 5% 1% 0% 4% 0% 6%
Mandated a temporary hiring freeze 2% 2% 2% 0% 4% 0% 2%
Offered a buyout offer/voluntary early retirement 2% 2% 1% 0% 0% 2% 2%
Eliminated any other employee benefits 1% 2% 1% 3% 0% 0% 2%
Reduced, frozen or terminated a defined benefit pension plan 1% 2% 0% 3% 0% 0% 0%
Implemented leave without pay/mandatory unpaid vacation 0% 0% 0% 0% 0% 0% 0%

Economic Climate (cont.)
2014 DMO Compensation & Benefits Study 22 Destination & Travel Foundation
Total Revenue
All Respondents $0 to
$499,999 $500,000 to
$999,999 $1,000,000 to
$1,999,999 $2,000,000 to
$3,999,999 $4,000,000 to
$9,999,999 $10 million
or more
Likelihood that your DMO will consider the following in 2014:
Add any employee benefits
Count 297 118 173 39 53 59 52
Very unlikely 60% 48% 69% 72% 64% 63% 63%
Somewhat unlikely 14% 21% 10% 10% 15% 12% 13%
Uncertain 13% 17% 10% 5% 4% 14% 12%
Somewhat likely 7% 7% 7% 5% 9% 10% 4%
Very likely 5% 7% 4% 8% 8% 2% 8%
Fill vacant/previously frozen positions
Count 301 121 173 40 53 60 54
Very unlikely 42% 31% 50% 55% 68% 43% 41%
Somewhat unlikely 4% 7% 3% 0% 2% 8% 4%
Uncertain 14% 11% 15% 8% 4% 18% 19%
Somewhat likely 8% 11% 6% 5% 6% 5% 7%
Very likely 22% 28% 17% 13% 6% 18% 19%
Add new positions and fill them
Count 301 121 173 40 53 60 54
Very unlikely 37% 25% 45% 45% 55% 38% 41%
Somewhat unlikely 15% 17% 13% 8% 15% 18% 11%
Uncertain 10% 13% 8% 10% 8% 7% 6%
Somewhat likely 17% 20% 13% 13% 8% 20% 22%
Very likely 20% 22% 20% 18% 13% 15% 17%

Economic Climate (cont.)
2014 DMO Compensation & Benefits Study 23 Destination & Travel Foundation
Total Revenue
All Respondents $0 to
$499,999 $500,000 to
$999,999 $1,000,000 to
$1,999,999 $2,000,000 to
$3,999,999 $4,000,000 to
$9,999,999 $10 million
or more
Eliminate or postpone bonuses for officers or any other employee group
Count 278 113 159 34 50 53 50
Very unlikely 69% 64% 74% 65% 66% 66% 66%
Somewhat unlikely 12% 19% 6% 3% 8% 15% 14%
Uncertain 10% 10% 10% 18% 6% 11% 14%
Somewhat likely 2% 1% 3% 0% 4% 4% 2%
Very likely 7% 7% 8% 15% 16% 4% 4%
Freeze salaries for officers or any other employee group
Count 289 115 168 36 51 59 51
Very unlikely 64% 60% 66% 56% 61% 61% 65%
Somewhat unlikely 15% 19% 12% 11% 12% 14% 27%
Uncertain 11% 10% 12% 22% 6% 10% 4%
Somewhat likely 5% 6% 4% 3% 12% 7% 2%
Very likely 6% 5% 6% 8% 10% 8% 2%
Eliminate or adjust 401(k)/403(b) match contributions
Count 275 109 160 30 50 57 50
Very unlikely 81% 78% 84% 80% 86% 77% 72%
Somewhat unlikely 8% 9% 8% 7% 2% 14% 12%
Uncertain 5% 6% 5% 3% 4% 5% 12%
Somewhat likely 1% 3% 1% 7% 2% 0% 2%
Very likely 3% 4% 3% 3% 6% 4% 2%

Economic Climate (cont.)
2014 DMO Compensation & Benefits Study 24 Destination & Travel Foundation
Total Revenue
All Respondents $0 to
$499,999 $500,000 to
$999,999 $1,000,000 to
$1,999,999 $2,000,000 to
$3,999,999 $4,000,000 to
$9,999,999 $10 million
or more
Reduce, freeze or terminate a defined benefit pension plan
Count 271 105 160 30 48 58 49
Very unlikely 86% 82% 88% 80% 94% 81% 80%
Somewhat unlikely 6% 9% 5% 7% 0% 10% 10%
Uncertain 6% 7% 6% 7% 4% 7% 10%
Somewhat likely 0% 1% 0% 3% 0% 0% 0%
Very likely 1% 2% 1% 3% 2% 2% 0%
Make staff layoffs
Count 289 114 169 35 51 58 51
Very unlikely 81% 79% 82% 83% 78% 79% 82%
Somewhat unlikely 9% 12% 8% 11% 6% 10% 12%
Uncertain 5% 4% 7% 3% 6% 5% 4%
Somewhat likely 2% 4% 1% 0% 4% 2% 2%
Very likely 2% 2% 3% 3% 6% 3% 0%
Ask employees to take leave without pay or enforced mandatory unpaid vacation
Count 288 114 168 35 51 59 50
Very unlikely 90% 87% 91% 89% 94% 88% 90%
Somewhat unlikely 6% 9% 5% 9% 4% 5% 8%
Uncertain 2% 2% 2% 0% 0% 3% 2%
Somewhat likely 1% 1% 1% 0% 0% 2% 0%
Very likely 1% 2% 1% 3% 2% 2% 0%

Economic Climate (cont.)
2014 DMO Compensation & Benefits Study 25 Destination & Travel Foundation
Total Revenue
All Respondents $0 to
$499,999 $500,000 to
$999,999 $1,000,000 to
$1,999,999 $2,000,000 to
$3,999,999 $4,000,000 to
$9,999,999 $10 million
or more
Offer a buyout offer/voluntary early retirement
Count 287 115 166 35 50 59 51
Very unlikely 88% 83% 91% 89% 92% 90% 90%
Somewhat unlikely 6% 9% 4% 9% 0% 7% 8%
Uncertain 4% 7% 2% 0% 2% 2% 2%
Somewhat likely 1% 1% 1% 0% 4% 0% 0%
Very likely 1% 1% 1% 3% 2% 2% 0%
Terminate contract employees or any third party/outside employee arrangements
Count 283 112 165 34 50 57 51
Very unlikely 77% 72% 79% 79% 84% 68% 78%
Somewhat unlikely 10% 13% 8% 12% 2% 18% 8%
Uncertain 8% 5% 10% 6% 12% 9% 6%
Somewhat likely 3% 4% 2% 0% 0% 2% 6%
Very likely 3% 4% 2% 3% 2% 4% 2%
Reduce travel, training or other employee-related expenses
Count 287 114 167 36 50 58 51
Very unlikely 62% 58% 65% 44% 62% 62% 67%
Somewhat unlikely 17% 19% 15% 31% 16% 14% 16%
Uncertain 9% 11% 8% 14% 2% 12% 10%
Somewhat likely 7% 5% 8% 8% 14% 5% 4%
Very likely 5% 6% 4% 3% 6% 7% 4%

Economic Climate (cont.)
2014 DMO Compensation & Benefits Study 26 Destination & Travel Foundation
Total Revenue
All Respondents $0 to
$499,999 $500,000 to
$999,999 $1,000,000 to
$1,999,999 $2,000,000 to
$3,999,999 $4,000,000 to
$9,999,999 $10 million
or more
Mandate a temporary hiring freeze
Count 282 112 164 32 50 58 51
Very unlikely 78% 71% 82% 75% 82% 76% 82%
Somewhat unlikely 10% 15% 6% 9% 2% 16% 4%
Uncertain 7% 4% 9% 9% 8% 5% 10%
Somewhat likely 2% 5% 1% 0% 4% 0% 4%
Very likely 2% 4% 2% 6% 4% 3% 0%
Reduce the percentage or amount your DMO contributes toward health insurance premiums
Count 285 114 165 32 50 59 51
Very unlikely 57% 52% 60% 53% 58% 63% 57%
Somewhat unlikely 16% 16% 16% 25% 16% 15% 10%
Uncertain 16% 17% 17% 13% 10% 19% 24%
Somewhat likely 6% 8% 4% 6% 8% 0% 4%
Very likely 5% 8% 2% 3% 8% 3% 6%
Eliminate any other employee benefits
Count 289 115 168 35 50 59 51
Very unlikely 70% 70% 69% 63% 72% 73% 69%
Somewhat unlikely 17% 19% 15% 23% 12% 14% 16%
Uncertain 10% 7% 13% 9% 8% 12% 16%
Somewhat likely 1% 1% 1% 3% 2% 0% 0%
Very likely 2% 3% 2% 3% 6% 2% 0%

2014 DMO Compensation & Benefits Study 27 Destination & Travel Foundation
Salary and Compensation Section

Note: A minimum of four responses required to show data.
2014 DMO Compensation & Benefits Study 28 Destination & Travel Foundation
Salary and Compensation Section
President/CEO/Executive Director
Job Description: Directs and leads DMO toward its mission. Works directly with/for Board or governing body on policy making and strategy for organization. Primary spokesperson for organization. Direct reports typically are top department heads of Convention Sales, Travel Trade Sales, Membership, Finance/Administration, Marketing, and Communications.
Count
Average Number of FTEs
Reported
Fixed Salary for FY 2014 Total Compensation Variable
Mean Median 75% earn
more than 25% earn
more than Mean Median 75% earn
more than 25% earn
more than
Transaction-based Cash
Comp.
Performance-based Cash
Comp. All Respondents 276 1.0 $137,894 $117,775 $80,427 $172,845 $156,381 $124,200 $81,746 $193,031 $1,814 $16,674
ORGANIZATIONAL STRUCTURE
Private 189 1.0 $144,625 $122,400 $80,984 $184,000 $167,288 $127,481 $82,000 $222,481 $2,281 $20,383
Public 75 1.0 $125,487 $115,000 $85,041 $150,849 $135,206 $115,000 $86,750 $168,385 $926 $8,794
TYPE OF BUREAU
Membership Based 111 1.0 $179,175 $147,519 $107,495 $246,272 $209,948 $156,875 $116,836 $302,000 $4,028 $26,745
Non-Membership Based 160 1.0 $110,456 $97,549 $74,469 $138,848 $120,463 $99,516 $74,469 $153,401 $306 $9,700
TOTAL REVENUE
0 to $499,999 34 1.0 $55,979 $56,250 $47,140 $60,000 $56,772 $56,275 $47,140 $61,125 $44 $749
$500,000 to $999,999 48 1.0 $82,507 $80,992 $68,250 $95,365 $86,459 $82,816 $71,250 $100,332 $479 $3,473
$1,000,000 to $1,999,999 57 1.0 $99,436 $96,700 $86,822 $115,000 $103,539 $99,000 $87,500 $117,550 $186 $3,917
$2,000,000 to $3,999,999 48 1.0 $133,132 $130,119 $119,667 $149,123 $146,182 $140,929 $125,000 $163,364 $2,092 $10,957
$4,000,000 to $9,999,999 38 1.0 $185,684 $180,000 $157,438 $210,818 $215,567 $209,341 $172,903 $259,779 $1,301 $28,581
$10 Million or More 51 1.0 $256,485 $254,250 $196,946 $309,500 $313,153 $317,335 $218,250 $392,600 $6,188 $50,480
NUMBER OF EMPLOYEES
Less Than 5 51 1.0 $64,176 $60,000 $49,890 $75,000 $66,100 $61,500 $49,890 $76,250 $392 $1,532
5 to 9 70 1.0 $89,457 $87,905 $75,367 $98,748 $93,987 $89,805 $75,367 $101,835 $216 $4,314
10 to 19 58 1.0 $127,171 $122,830 $109,992 $139,804 $135,513 $129,295 $112,170 $153,465 $792 $7,549
20 to 34 37 1.0 $166,146 $165,551 $140,000 $184,000 $192,121 $193,000 $154,440 $222,481 $2,809 $23,166
35 to 59 32 1.0 $217,536 $227,473 $161,613 $250,500 $261,066 $269,483 $164,413 $322,226 $3,125 $40,405
60 or More 27 1.0 $295,598 $295,984 $249,797 $349,000 $364,096 $350,000 $288,125 $414,284 $7,985 $60,513

Note: A minimum of four responses required to show data.
2014 DMO Compensation & Benefits Study 29 Destination & Travel Foundation
Deputy Director/COO
Job Description: In larger DMOs, assists CEO in managing DMO operations and implementing policies and procedures. May provide staff support to Board, committees and outside organizations and can represent DMO as spokesperson.
Count
Average Number of FTEs
Reported
Fixed Salary for FY 2014 Total Compensation Variable
Mean Median 75% earn
more than 25% earn
more than Mean Median 75% earn
more than 25% earn
more than
Transaction-based Cash
Comp.
Performance-based Cash
Comp. All Respondents 43 1.0 $125,055 $101,982 $81,425 $177,994 $134,828 $113,000 $86,701 $187,700 $151 $9,622
ORGANIZATIONAL STRUCTURE
Private 28 1.0 $139,300 $125,750 $92,025 $190,889 $151,563 $127,604 $92,025 $212,608 $232 $12,030
Public 14 1.0 $98,381 $90,826 $59,806 $129,250 $103,873 $94,500 $59,806 $129,250 $0 $5,492
TYPE OF BUREAU
Membership Based 20 1.0 $165,677 $177,994 $115,882 $201,887 $181,891 $187,700 $115,882 $232,170 $325 $15,890
Non-Membership Based 22 1.0 $91,663 $86,701 $60,437 $117,083 $95,797 $90,826 $60,437 $120,425 $0 $4,134
TOTAL REVENUE
0 to $499,999 2
$500,000 to $999,999 4 0.9 $51,560 $52,120 $41,688 $61,992 $53,060 $54,620 $45,688 $61,992 $0 $1,500
$1,000,000 to $1,999,999 5 1.0 $79,932 $83,750 $75,507 $89,652 $79,982 $83,750 $75,757 $89,652 $0 $50
$2,000,000 to $3,999,999 8 1.0 $92,591 $92,835 $77,020 $108,237 $99,266 $97,476 $87,220 $116,500 $813 $5,863
$4,000,000 to $9,999,999 6 1.0 $129,656 $112,800 $95,500 $142,654 $139,572 $114,654 $95,500 $152,421 $0 $9,916
$10 Million or More 18 1.0 $174,935 $182,294 $130,094 $205,962 $191,662 $193,900 $130,094 $236,857 $0 $16,727
NUMBER OF EMPLOYEES
Less Than 5 3
5 to 9 7 1.0 $56,616 $49,891 $48,475 $63,885 $57,366 $52,250 $49,796 $63,885 $0 $750
10 to 19 7 1.0 $98,444 $92,971 $91,176 $101,517 $98,444 $92,971 $91,176 $101,517 $0 $0
20 to 34 6 1.0 $106,406 $96,000 $91,250 $121,750 $117,271 $105,000 $95,500 $140,375 $1,083 $9,781
35 to 59 9 1.0 $158,659 $173,493 $122,900 $189,999 $173,569 $173,493 $122,900 $210,144 $0 $14,910
60 or More 11 1.0 $188,137 $193,559 $153,588 $214,000 $207,647 $220,000 $157,888 $255,092 $0 $19,509
Note: A minimum of four responses required to show data.
2014 DMO Compensation & Benefits Study 30 Destination & Travel Foundation
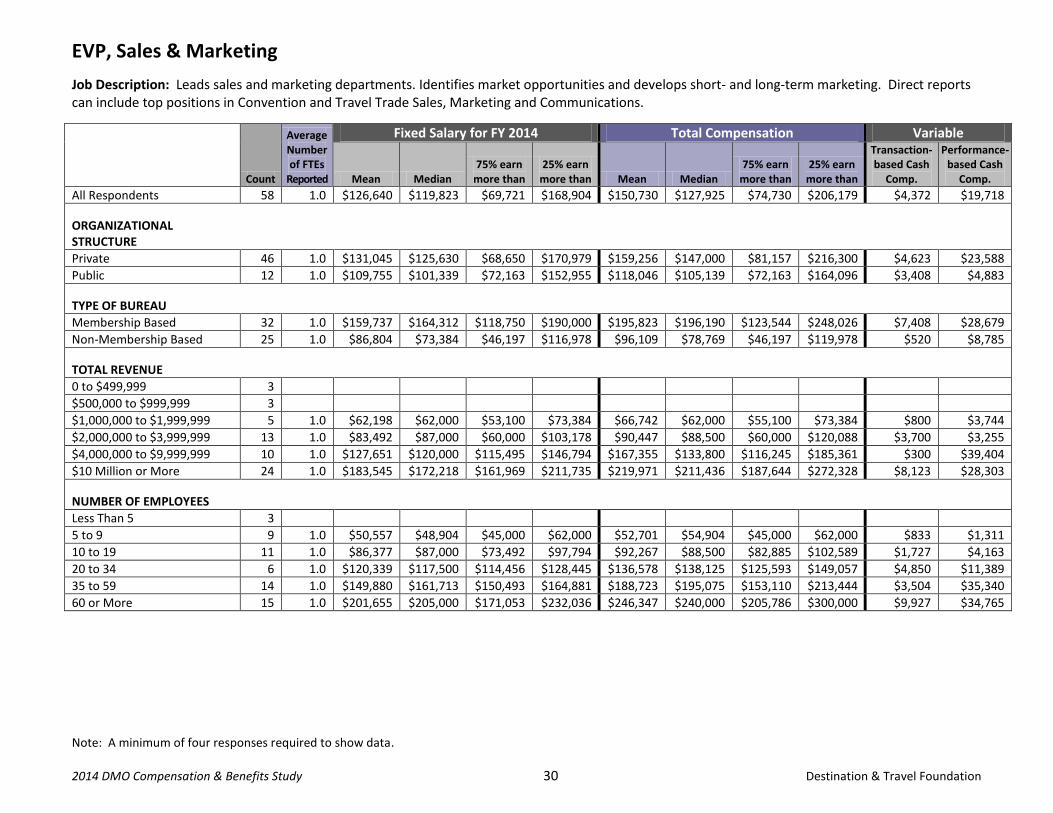
EVP, Sales & Marketing
Job Description: Leads sales and marketing departments. Identifies market opportunities and develops short- and long-term marketing. Direct reports can include top positions in Convention and Travel Trade Sales, Marketing and Communications.
Count
Average Number of FTEs
Reported
Fixed Salary for FY 2014 Total Compensation Variable
Mean Median 75% earn
more than 25% earn
more than Mean Median 75% earn
more than 25% earn
more than
Transaction-based Cash
Comp.
Performance-based Cash
Comp.
All Respondents 58 1.0 $126,640 $119,823 $69,721 $168,904 $150,730 $127,925 $74,730 $206,179 $4,372 $19,718
ORGANIZATIONAL STRUCTURE
Private 46 1.0 $131,045 $125,630 $68,650 $170,979 $159,256 $147,000 $81,157 $216,300 $4,623 $23,588
Public 12 1.0 $109,755 $101,339 $72,163 $152,955 $118,046 $105,139 $72,163 $164,096 $3,408 $4,883
TYPE OF BUREAU
Membership Based 32 1.0 $159,737 $164,312 $118,750 $190,000 $195,823 $196,190 $123,544 $248,026 $7,408 $28,679
Non-Membership Based 25 1.0 $86,804 $73,384 $46,197 $116,978 $96,109 $78,769 $46,197 $119,978 $520 $8,785
TOTAL REVENUE
0 to $499,999 3
$500,000 to $999,999 3
$1,000,000 to $1,999,999 5 1.0 $62,198 $62,000 $53,100 $73,384 $66,742 $62,000 $55,100 $73,384 $800 $3,744
$2,000,000 to $3,999,999 13 1.0 $83,492 $87,000 $60,000 $103,178 $90,447 $88,500 $60,000 $120,088 $3,700 $3,255
$4,000,000 to $9,999,999 10 1.0 $127,651 $120,000 $115,495 $146,794 $167,355 $133,800 $116,245 $185,361 $300 $39,404
$10 Million or More 24 1.0 $183,545 $172,218 $161,969 $211,735 $219,971 $211,436 $187,644 $272,328 $8,123 $28,303
NUMBER OF EMPLOYEES
Less Than 5 3
5 to 9 9 1.0 $50,557 $48,904 $45,000 $62,000 $52,701 $54,904 $45,000 $62,000 $833 $1,311
10 to 19 11 1.0 $86,377 $87,000 $73,492 $97,794 $92,267 $88,500 $82,885 $102,589 $1,727 $4,163
20 to 34 6 1.0 $120,339 $117,500 $114,456 $128,445 $136,578 $138,125 $125,593 $149,057 $4,850 $11,389
35 to 59 14 1.0 $149,880 $161,713 $150,493 $164,881 $188,723 $195,075 $153,110 $213,444 $3,504 $35,340
60 or More 15 1.0 $201,655 $205,000 $171,053 $232,036 $246,347 $240,000 $205,786 $300,000 $9,927 $34,765

Note: A minimum of four responses required to show data.
2014 DMO Compensation & Benefits Study 31 Destination & Travel Foundation
VP, Convention Sales
Job Description: Manages convention sales and services. Identifies opportunities, formulates sales strategies and develops sales training programs. May handle top-priority accounts. Direct reports include senior sales managers and director of convention services.
Count
Average Number of FTEs
Reported
Fixed Salary for FY 2014 Total Compensation Variable
Mean Median 75% earn
more than 25% earn
more than Mean Median 75% earn
more than 25% earn
more than
Transaction-based Cash
Comp.
Performance-based Cash
Comp. All Respondents 72 1.1 $119,897 $117,041 $92,251 $140,967 $136,670 $128,258 $97,052 $169,190 $4,294 $12,479
ORGANIZATIONAL STRUCTURE
Private 52 1.1 $122,850 $120,059 $99,131 $143,275 $140,754 $136,480 $107,188 $169,428 $4,348 $13,557
Public 18 1.0 $114,890 $106,237 $85,526 $136,695 $128,495 $118,468 $94,017 $165,244 $4,616 $8,989
TYPE OF BUREAU
Membership Based 48 1.1 $129,232 $125,841 $101,646 $153,287 $149,009 $142,071 $116,197 $179,561 $5,044 $14,733
Non-Membership Based 24 1.0 $101,226 $101,992 $82,110 $116,150 $111,992 $111,862 $88,551 $130,289 $2,795 $7,970
TOTAL REVENUE
0 to $499,999 1
$500,000 to $999,999 4 1.0 $90,393 $90,257 $73,650 $107,000 $95,268 $100,007 $73,650 $121,625 $0 $4,875
$1,000,000 to $1,999,999 4 1.0 $76,700 $70,400 $60,600 $86,500 $77,318 $71,636 $62,454 $86,500 $618 $0
$2,000,000 to $3,999,999 12 1.0 $87,870 $90,440 $77,361 $96,697 $94,915 $91,791 $84,903 $102,748 $2,143 $4,902
$4,000,000 to $9,999,999 18 1.0 $110,557 $112,250 $98,820 $126,261 $126,088 $126,977 $111,832 $143,750 $3,171 $12,360
$10 Million or More 33 1.1 $148,128 $142,700 $120,484 $169,744 $173,025 $174,613 $139,993 $203,475 $6,786 $18,112
NUMBER OF EMPLOYEES
Less Than 5 1
5 to 9 3
10 to 19 12 1.0 $85,708 $88,752 $71,287 $94,017 $89,533 $90,440 $79,430 $94,017 $369 $3,457
20 to 34 18 1.0 $104,635 $103,981 $96,649 $113,945 $120,337 $118,667 $111,832 $127,215 $4,491 $11,211
35 to 59 17 1.0 $127,988 $126,681 $118,821 $138,000 $144,337 $144,142 $135,960 $153,782 $3,713 $12,636
60 or More 21 1.2 $158,100 $157,700 $138,927 $187,200 $186,729 $187,700 $167,700 $222,170 $7,657 $20,972

Note: A minimum of four responses required to show data.
2014 DMO Compensation & Benefits Study 32 Destination & Travel Foundation
Director, Convention Sales
Job Description: May have similar line responsibilities as VP, Convention Sales. Typically handles full sales account load.
Count
Average Number of FTEs
Reported
Fixed Salary for FY 2014 Total Compensation Variable
Mean Median 75% earn
more than 25% earn
more than Mean Median 75% earn
more than 25% earn
more than
Transaction-based Cash
Comp.
Performance-based Cash
Comp. All Respondents 103 1.3 $86,296 $84,872 $65,588 $99,102 $96,484 $90,600 $70,000 $118,408 $3,870 $6,318
ORGANIZATIONAL STRUCTURE
Private 80 1.3 $86,803 $84,461 $64,965 $102,519 $97,764 $91,216 $69,515 $120,972 $4,542 $6,419
Public 20 1.2 $85,892 $91,000 $74,421 $97,987 $93,953 $93,500 $77,840 $110,077 $1,761 $6,301
TYPE OF BUREAU
Membership Based 61 1.3 $92,472 $90,000 $74,700 $113,400 $106,087 $106,000 $78,423 $135,400 $5,458 $8,156
Non-Membership Based 42 1.1 $77,326 $73,317 $61,050 $90,508 $82,537 $78,775 $61,684 $91,650 $1,562 $3,649
TOTAL REVENUE
0 to $499,999 0
$500,000 to $999,999 10 1.1 $64,768 $63,500 $55,050 $78,421 $67,638 $66,750 $55,050 $82,738 $0 $2,870
$1,000,000 to $1,999,999 15 1.1 $71,702 $60,626 $50,950 $73,940 $72,969 $60,626 $52,450 $76,815 $233 $1,033
$2,000,000 to $3,999,999 24 1.1 $72,233 $68,429 $62,688 $84,250 $77,439 $73,214 $63,524 $89,894 $4,150 $1,056
$4,000,000 to $9,999,999 17 1.1 $93,646 $90,000 $75,008 $104,000 $107,176 $96,445 $82,800 $135,400 $4,415 $9,115
$10 Million or More 37 1.5 $103,775 $100,000 $90,230 $118,066 $121,254 $118,750 $103,150 $142,167 $5,957 $11,522
NUMBER OF EMPLOYEES
Less Than 5 3
5 to 9 11 1.1 $57,136 $58,000 $48,359 $62,500 $58,586 $58,000 $49,984 $65,000 $318 $1,132
10 to 19 26 1.1 $73,644 $65,888 $57,292 $79,900 $76,736 $70,750 $60,765 $82,783 $1,320 $1,773
20 to 34 20 1.2 $83,042 $81,228 $70,750 $93,550 $92,428 $91,916 $77,334 $106,700 $5,227 $4,158
35 to 59 22 1.1 $100,087 $94,075 $87,935 $110,675 $114,952 $106,385 $93,164 $137,350 $6,044 $8,821
60 or More 21 1.9 $110,167 $108,593 $97,920 $121,524 $130,752 $126,112 $118,066 $144,762 $5,869 $14,716

Note: A minimum of four responses required to show data.
2014 DMO Compensation & Benefits Study 33 Destination & Travel Foundation
National/Senior Convention Sales Manager
Job Description: Senior sales position, generally without direct management responsibilities (with exception of administrative support). Handles major accounts.
Count
Average Number of FTEs
Reported
Fixed Salary for FY 2014 Total Compensation Variable
Mean Median 75% earn
more than 25% earn
more than Mean Median 75% earn
more than 25% earn
more than
Transaction-based Cash
Comp.
Performance-based Cash
Comp. All Respondents 77 2.7 $81,177 $70,361 $62,400 $85,094 $93,007 $82,880 $68,000 $104,265 $4,049 $7,781
ORGANIZATIONAL STRUCTURE
Private 55 2.8 $83,990 $76,220 $65,490 $90,583 $98,290 $92,600 $73,879 $113,563 $4,789 $9,511
Public 18 2.8 $78,345 $67,557 $58,606 $70,885 $84,701 $71,443 $65,500 $81,410 $2,689 $3,667
TYPE OF BUREAU
Membership Based 47 3.2 $82,939 $75,038 $65,678 $90,583 $97,978 $92,600 $74,719 $110,394 $5,243 $9,795
Non-Membership Based 28 2.0 $80,716 $68,547 $57,364 $80,931 $87,713 $71,443 $64,218 $93,315 $2,245 $4,752
TOTAL REVENUE
0 to $499,999 1
$500,000 to $999,999 3
$1,000,000 to $1,999,999 4 1.8 $87,931 $81,000 $47,608 $121,323 $96,763 $91,000 $62,858 $124,905 $0 $8,832
$2,000,000 to $3,999,999 12 1.7 $60,562 $63,239 $50,280 $66,361 $66,307 $67,339 $52,681 $70,901 $4,371 $1,375
$4,000,000 to $9,999,999 23 2.6 $95,401 $69,850 $63,950 $81,443 $106,136 $80,328 $72,513 $95,347 $3,876 $6,859
$10 Million or More 34 3.4 $82,521 $77,793 $69,603 $90,624 $98,653 $96,423 $81,341 $111,760 $4,933 $11,199
NUMBER OF EMPLOYEES
Less Than 5 2
5 to 9 3
10 to 19 10 1.3 $63,546 $61,652 $50,500 $65,891 $68,876 $67,500 $65,425 $69,921 $1,000 $4,330
20 to 34 20 2.2 $86,133 $66,573 $56,203 $79,184 $94,935 $73,049 $64,244 $95,021 $4,653 $4,149
35 to 59 22 3.1 $83,131 $75,000 $66,712 $81,955 $97,367 $85,818 $75,387 $102,100 $5,506 $8,730
60 or More 20 3.8 $87,405 $86,022 $74,096 $92,692 $104,545 $100,800 $91,082 $119,727 $4,255 $12,885

Note: A minimum of four responses required to show data.
2014 DMO Compensation & Benefits Study 34 Destination & Travel Foundation
Convention Sales Manager
Job Description: Experienced sales manager handling mid-size/priority accounts. Typically, no management responsibilities.
Count
Average Number of FTEs
Reported
Fixed Salary for FY 2014 Total Compensation Variable
Mean Median 75% earn
more than 25% earn
more than Mean Median 75% earn
more than 25% earn
more than
Transaction-based Cash
Comp.
Performance-based Cash
Comp. All Respondents 122 2.2 $58,046 $53,911 $45,335 $65,397 $63,748 $58,225 $47,917 $75,315 $2,495 $3,207
ORGANIZATIONAL STRUCTURE
Private 83 2.1 $57,993 $53,000 $45,000 $67,600 $64,854 $59,405 $47,680 $78,859 $3,160 $3,701
Public 31 2.5 $58,048 $57,624 $47,223 $64,677 $61,515 $59,541 $49,880 $66,250 $1,359 $2,107
TYPE OF BUREAU
Membership Based 53 2.6 $59,494 $56,650 $50,460 $68,572 $67,534 $63,000 $55,500 $77,391 $4,334 $3,706
Non-Membership Based 68 1.9 $55,964 $50,830 $43,924 $60,748 $59,898 $55,088 $45,433 $63,553 $1,099 $2,835
TOTAL REVENUE
0 to $499,999 3
$500,000 to $999,999 6 2.2 $52,424 $50,203 $34,170 $70,911 $53,258 $50,203 $34,170 $70,911 $0 $833
$1,000,000 to $1,999,999 22 1.2 $49,933 $47,009 $41,125 $55,000 $51,459 $48,094 $41,677 $55,000 $0 $1,525
$2,000,000 to $3,999,999 29 1.3 $54,769 $50,000 $43,450 $55,166 $58,168 $53,560 $45,000 $59,405 $1,233 $2,166
$4,000,000 to $9,999,999 25 1.8 $61,484 $56,000 $50,684 $67,500 $68,044 $59,840 $56,000 $73,753 $2,867 $3,693
$10 Million or More 37 3.8 $65,239 $63,996 $56,650 $71,000 $75,644 $75,266 $60,395 $84,695 $5,173 $5,232
NUMBER OF EMPLOYEES
Less Than 5 2
5 to 9 17 1.1 $47,132 $48,670 $38,675 $53,560 $48,906 $48,670 $39,000 $55,000 $106 $1,669
10 to 19 37 1.4 $58,250 $49,200 $43,627 $63,000 $61,716 $52,800 $44,000 $63,800 $1,532 $1,934
20 to 34 23 1.7 $54,398 $52,150 $45,649 $58,724 $58,904 $56,766 $49,921 $61,201 $1,565 $2,942
35 to 59 24 3.3 $63,115 $60,248 $52,668 $68,143 $73,285 $67,071 $58,444 $83,345 $5,955 $4,216
60 or More 19 4.2 $65,928 $67,200 $55,448 $72,324 $75,794 $75,331 $65,031 $84,885 $3,528 $6,338

Note: A minimum of four responses required to show data.
2014 DMO Compensation & Benefits Study 35 Destination & Travel Foundation
Convention Sales/Account Executive
Job Description: Entry level position. Handles smaller meetings and, in some cases, telemarketing responsibilities.
Count
Average Number of FTEs
Reported
Fixed Salary for FY 2014 Total Compensation Variable
Mean Median 75% earn
more than 25% earn
more than Mean Median 75% earn
more than 25% earn
more than
Transaction-based Cash
Comp.
Performance-based Cash
Comp. All Respondents 48 1.7 $46,841 $40,500 $35,000 $53,275 $50,892 $44,599 $36,859 $61,631 $1,195 $2,855
ORGANIZATIONAL STRUCTURE
Private 34 1.9 $47,816 $43,809 $37,000 $55,329 $52,579 $49,637 $37,250 $63,416 $1,630 $3,133
Public 12 1.3 $45,942 $36,793 $34,700 $47,375 $48,401 $38,000 $35,890 $51,120 $163 $2,297
TYPE OF BUREAU
Membership Based 25 2.1 $52,438 $47,212 $41,000 $55,438 $58,564 $55,000 $46,720 $66,100 $1,971 $4,155
Non-Membership Based 23 1.3 $40,758 $36,586 $34,473 $39,250 $42,552 $37,000 $34,473 $42,849 $352 $1,443
TOTAL REVENUE
0 to $499,999 2
$500,000 to $999,999 2
$1,000,000 to $1,999,999 8 1.3 $43,412 $36,000 $34,737 $45,338 $45,006 $38,000 $34,737 $46,775 $0 $1,594
$2,000,000 to $3,999,999 11 1.5 $41,243 $37,000 $35,065 $51,000 $43,113 $38,200 $35,400 $52,000 $164 $1,706
$4,000,000 to $9,999,999 8 1.1 $46,296 $37,543 $34,125 $40,965 $49,036 $39,475 $35,315 $45,932 $2,490 $250
$10 Million or More 17 2.5 $55,187 $48,904 $44,130 $55,438 $63,179 $58,200 $50,273 $66,100 $2,042 $5,950
NUMBER OF EMPLOYEES
Less Than 5 2
5 to 9 4 0.9 $30,527 $35,000 $30,527 $35,000 $31,527 $35,000 $30,527 $36,000 $0 $1,000
10 to 19 12 1.5 $43,403 $37,500 $34,737 $49,838 $45,201 $37,500 $36,199 $52,775 $212 $1,586
20 to 34 9 1.3 $50,544 $36,586 $36,329 $55,000 $52,759 $39,298 $36,586 $55,000 $1,175 $1,041
35 to 59 10 1.9 $43,648 $42,065 $35,875 $53,637 $50,662 $46,986 $36,750 $65,479 $2,950 $4,064
60 or More 11 2.5 $58,154 $48,904 $44,148 $53,550 $65,147 $56,239 $50,268 $63,077 $1,309 $5,683

Note: A minimum of four responses required to show data.
2014 DMO Compensation & Benefits Study 36 Destination & Travel Foundation
Satellite Office Manager in Washington, DC
Job Description: Similar experience and duties as National/Senior Sales Manager. Usually responsible for management of support staff, activities for and budget of satellite office.
Count
Average Number of FTEs
Reported
Fixed Salary for FY 2014 Total Compensation Variable
Mean Median 75% earn
more than 25% earn
more than Mean Median 75% earn
more than 25% earn
more than
Transaction-based Cash
Comp.
Performance-based Cash
Comp. All Respondents 31 1.2 $94,243 $93,000 $86,101 $103,864 $107,754 $108,025 $96,094 $117,713 $5,655 $7,856
ORGANIZATIONAL STRUCTURE
Private 24 1.2 $92,633 $91,812 $85,167 $102,642 $107,372 $107,492 $95,091 $117,566 $6,105 $8,635
Public 7 1.0 $99,762 $97,298 $93,526 $106,990 $109,063 $108,025 $102,124 $115,582 $4,116 $5,185
TYPE OF BUREAU
Membership Based 25 1.1 $93,484 $92,900 $85,402 $102,613 $108,009 $106,950 $96,188 $117,420 $6,613 $7,912
Non-Membership Based 6 1.3 $97,403 $99,797 $88,510 $107,508 $106,691 $109,727 $95,361 $116,584 $1,667 $7,621
TOTAL REVENUE
0 to $499,999 0
$500,000 to $999,999 1
$1,000,000 to $1,999,999 0
$2,000,000 to $3,999,999 0
$4,000,000 to $9,999,999 7 1.1 $86,481 $86,800 $82,701 $90,159 $99,593 $96,000 $91,751 $106,991 $8,599 $4,513
$10 Million or More 23 1.2 $96,719 $95,000 $88,932 $105,978 $110,143 $111,429 $97,869 $118,651 $5,005 $8,419
NUMBER OF EMPLOYEES
Less Than 5 0
5 to 9 0
10 to 19 0
20 to 34 5 1.0 $83,405 $85,000 $80,000 $85,402 $97,931 $96,000 $95,000 $102,482 $3,416 $11,110
35 to 59 11 1.3 $93,025 $92,000 $87,109 $95,744 $104,474 $105,060 $92,065 $114,460 $8,703 $2,746
60 or More 15 1.1 $98,748 $102,613 $93,526 $107,013 $113,434 $112,891 $103,951 $125,924 $4,167 $10,518

Note: A minimum of four responses required to show data.
2014 DMO Compensation & Benefits Study 37 Destination & Travel Foundation
Satellite Office Manager in Chicago, IL
Job Description: Similar experience and duties as National/Senior Sales Manager. Usually responsible for management of support staff, activities for and budget of satellite office.
Count
Average Number of FTEs
Reported
Fixed Salary for FY 2014 Total Compensation Variable
Mean Median 75% earn
more than 25% earn
more than Mean Median 75% earn
more than 25% earn
more than
Transaction-based Cash
Comp.
Performance-based Cash
Comp. All Respondents 25 1.1 $92,349 $95,481 $86,000 $102,209 $106,484 $108,814 $95,036 $121,577 $5,195 $8,939
ORGANIZATIONAL STRUCTURE
Private 19 1.2 $91,195 $97,500 $83,641 $102,921 $106,800 $108,814 $94,026 $121,726 $5,328 $10,277
Public 6 1.0 $96,002 $95,258 $93,709 $99,343 $105,483 $108,700 $97,647 $112,249 $4,776 $4,705
TYPE OF BUREAU
Membership Based 20 1.2 $91,760 $96,268 $84,821 $102,760 $107,288 $112,210 $93,777 $122,877 $5,994 $9,534
Non-Membership Based 5 1.0 $94,705 $95,481 $92,180 $100,630 $103,267 $108,080 $105,481 $108,814 $2,000 $6,562
TOTAL REVENUE
0 to $499,999 0
$500,000 to $999,999 1
$1,000,000 to $1,999,999 0
$2,000,000 to $3,999,999 0
$4,000,000 to $9,999,999 3
$10 Million or More 21 1.1 $95,348 $97,500 $90,006 $102,209 $110,164 $112,359 $98,353 $121,875 $5,135 $9,681
NUMBER OF EMPLOYEES
Less Than 5 0
5 to 9 0
10 to 19 0
20 to 34 2
35 to 59 9 1.1 $93,435 $95,481 $90,006 $101,314 $106,037 $108,080 $105,057 $118,413 $6,085 $6,516
60 or More 14 1.1 $95,359 $97,776 $90,817 $107,650 $110,602 $112,430 $98,127 $126,346 $4,540 $10,703

Note: A minimum of four responses required to show data.
2014 DMO Compensation & Benefits Study 38 Destination & Travel Foundation
Sales/Promotion Coordinator
Job Description: Provides assistance to sales managers with leads, bid books, presentations, proposals, FAM tours, site visits, trade show promotions, etc. May produce performance reports and convention calendars.
Count
Average Number of FTEs
Reported
Fixed Salary for FY 2014 Total Compensation Variable
Mean Median 75% earn
more than 25% earn
more than Mean Median 75% earn
more than 25% earn
more than
Transaction-based Cash
Comp.
Performance-based Cash
Comp. All Respondents 83 1.9 $42,959 $38,800 $32,792 $44,062 $44,252 $39,458 $32,980 $46,024 $517 $776
ORGANIZATIONAL STRUCTURE
Private 58 2.1 $39,936 $36,264 $31,948 $41,216 $41,389 $38,227 $32,000 $44,075 $585 $867
Public 24 1.5 $50,298 $43,562 $37,847 $47,467 $51,229 $43,562 $38,139 $52,404 $373 $558
TYPE OF BUREAU
Membership Based 48 2.3 $41,611 $38,373 $33,841 $43,010 $43,142 $38,773 $34,000 $44,480 $611 $921
Non-Membership Based 34 1.4 $44,887 $40,351 $30,489 $44,871 $45,860 $40,351 $30,489 $46,498 $400 $574
TOTAL REVENUE
0 to $499,999 5 1.0 $27,096 $28,080 $27,500 $30,009 $27,377 $29,484 $27,500 $30,009 $112 $168
$500,000 to $999,999 6 1.5 $50,979 $34,900 $27,530 $43,950 $52,629 $34,900 $27,530 $49,200 $1,167 $483
$1,000,000 to $1,999,999 7 1.1 $44,924 $44,124 $30,014 $50,400 $44,924 $44,124 $30,014 $50,400 $0 $0
$2,000,000 to $3,999,999 19 1.1 $36,558 $35,020 $31,965 $40,550 $36,999 $35,020 $32,000 $41,431 $74 $368
$4,000,000 to $9,999,999 20 1.8 $42,402 $37,359 $32,876 $41,510 $43,699 $39,285 $34,451 $44,000 $452 $846
$10 Million or More 26 3.1 $48,737 $41,428 $37,934 $46,217 $51,108 $44,272 $38,714 $53,904 $958 $1,414
NUMBER OF EMPLOYEES
Less Than 5 6 1.0 $32,200 $32,005 $28,127 $39,100 $33,367 $32,005 $28,127 $39,100 $1,167 $0
5 to 9 3
10 to 19 25 1.1 $38,800 $35,139 $31,930 $44,000 $39,069 $37,089 $32,000 $44,000 $120 $149
20 to 34 18 1.4 $44,461 $39,439 $33,204 $40,267 $45,762 $39,729 $34,956 $43,089 $277 $1,024
35 to 59 19 3.1 $52,732 $41,255 $36,264 $44,750 $55,233 $44,100 $37,091 $51,960 $1,469 $1,033
60 or More 12 3.2 $43,514 $42,755 $38,536 $48,069 $45,400 $42,755 $38,771 $53,712 $0 $1,887

Note: A minimum of four responses required to show data.
2014 DMO Compensation & Benefits Study 39 Destination & Travel Foundation
Director, Convention Services
Job Description: Develops and implements convention services programs for the DMO. Works closely with industry partners and local stakeholders and key meeting planners.
Count
Average Number of FTEs
Reported
Fixed Salary for FY 2014 Total Compensation Variable
Mean Median 75% earn
more than 25% earn
more than Mean Median 75% earn
more than 25% earn
more than
Transaction-based Cash
Comp.
Performance-based Cash
Comp. All Respondents 62 1.1 $74,908 $72,285 $59,685 $87,641 $80,825 $77,842 $61,675 $98,038 $1,136 $4,781
ORGANIZATIONAL STRUCTURE
Private 46 1.1 $76,655 $72,481 $59,685 $87,641 $83,401 $83,865 $61,675 $99,707 $1,376 $5,370
Public 14 1.0 $74,389 $73,276 $65,895 $86,689 $77,849 $76,301 $66,850 $87,601 $510 $2,950
TYPE OF BUREAU
Membership Based 40 1.1 $79,907 $74,050 $63,655 $91,576 $87,388 $83,990 $66,976 $104,971 $1,761 $5,719
Non-Membership Based 21 1.0 $66,952 $68,289 $49,000 $81,328 $70,021 $72,109 $49,000 $89,453 $0 $3,070
TOTAL REVENUE
0 to $499,999 0
$500,000 to $999,999 3
$1,000,000 to $1,999,999 3
$2,000,000 to $3,999,999 9 1.0 $50,809 $52,000 $40,000 $56,650 $52,059 $52,000 $40,000 $56,650 $662 $588
$4,000,000 to $9,999,999 18 1.0 $70,021 $70,183 $60,300 $76,065 $75,328 $74,877 $61,900 $83,790 $420 $4,887
$10 Million or More 29 1.1 $87,940 $87,393 $72,461 $97,937 $96,247 $97,937 $83,750 $107,525 $1,963 $6,344
NUMBER OF EMPLOYEES
Less Than 5 0
5 to 9 2
10 to 19 5 1.0 $54,064 $52,000 $40,099 $68,289 $56,129 $52,000 $40,099 $72,109 $0 $2,065
20 to 34 17 1.0 $59,366 $56,650 $51,081 $74,442 $63,167 $60,000 $54,081 $75,312 $350 $3,451
35 to 59 20 1.0 $80,749 $78,447 $63,655 $88,156 $87,275 $88,031 $66,865 $98,617 $1,722 $4,804
60 or More 18 1.1 $87,647 $88,469 $71,624 $99,484 $95,715 $98,860 $82,472 $108,313 $1,669 $6,398
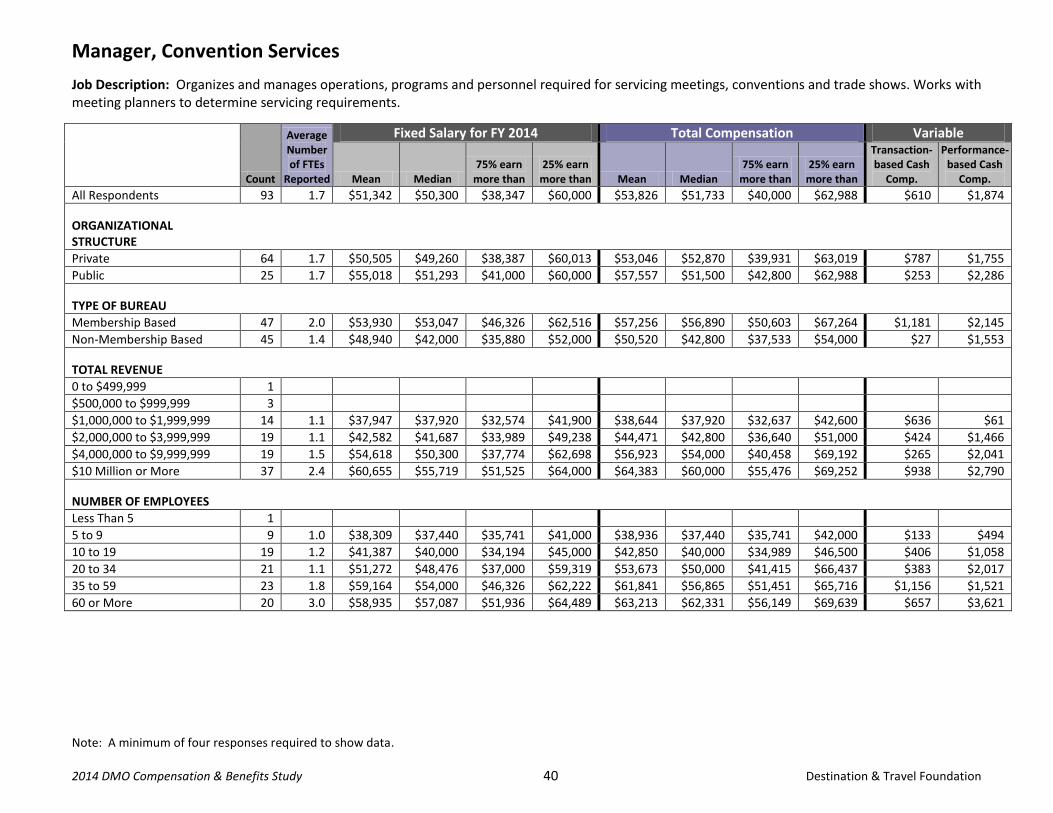
Note: A minimum of four responses required to show data.
2014 DMO Compensation & Benefits Study 40 Destination & Travel Foundation
Manager, Convention Services
Job Description: Organizes and manages operations, programs and personnel required for servicing meetings, conventions and trade shows. Works with meeting planners to determine servicing requirements.
Count
Average Number of FTEs
Reported
Fixed Salary for FY 2014 Total Compensation Variable
Mean Median 75% earn
more than 25% earn
more than Mean Median 75% earn
more than 25% earn
more than
Transaction-based Cash
Comp.
Performance-based Cash
Comp. All Respondents 93 1.7 $51,342 $50,300 $38,347 $60,000 $53,826 $51,733 $40,000 $62,988 $610 $1,874
ORGANIZATIONAL STRUCTURE
Private 64 1.7 $50,505 $49,260 $38,387 $60,013 $53,046 $52,870 $39,931 $63,019 $787 $1,755
Public 25 1.7 $55,018 $51,293 $41,000 $60,000 $57,557 $51,500 $42,800 $62,988 $253 $2,286
TYPE OF BUREAU
Membership Based 47 2.0 $53,930 $53,047 $46,326 $62,516 $57,256 $56,890 $50,603 $67,264 $1,181 $2,145
Non-Membership Based 45 1.4 $48,940 $42,000 $35,880 $52,000 $50,520 $42,800 $37,533 $54,000 $27 $1,553
TOTAL REVENUE
0 to $499,999 1
$500,000 to $999,999 3
$1,000,000 to $1,999,999 14 1.1 $37,947 $37,920 $32,574 $41,900 $38,644 $37,920 $32,637 $42,600 $636 $61
$2,000,000 to $3,999,999 19 1.1 $42,582 $41,687 $33,989 $49,238 $44,471 $42,800 $36,640 $51,000 $424 $1,466
$4,000,000 to $9,999,999 19 1.5 $54,618 $50,300 $37,774 $62,698 $56,923 $54,000 $40,458 $69,192 $265 $2,041
$10 Million or More 37 2.4 $60,655 $55,719 $51,525 $64,000 $64,383 $60,000 $55,476 $69,252 $938 $2,790
NUMBER OF EMPLOYEES
Less Than 5 1
5 to 9 9 1.0 $38,309 $37,440 $35,741 $41,000 $38,936 $37,440 $35,741 $42,000 $133 $494
10 to 19 19 1.2 $41,387 $40,000 $34,194 $45,000 $42,850 $40,000 $34,989 $46,500 $406 $1,058
20 to 34 21 1.1 $51,272 $48,476 $37,000 $59,319 $53,673 $50,000 $41,415 $66,437 $383 $2,017
35 to 59 23 1.8 $59,164 $54,000 $46,326 $62,222 $61,841 $56,865 $51,451 $65,716 $1,156 $1,521
60 or More 20 3.0 $58,935 $57,087 $51,936 $64,489 $63,213 $62,331 $56,149 $69,639 $657 $3,621

Note: A minimum of four responses required to show data.
2014 DMO Compensation & Benefits Study 41 Destination & Travel Foundation
Director, Housing Services
Job Description: Manages the housing operations of the DMO. Manages housing relationships and needs of hotels and planners.
Count
Average Number of FTEs
Reported
Fixed Salary for FY 2014 Total Compensation Variable
Mean Median 75% earn
more than 25% earn
more than Mean Median 75% earn
more than 25% earn
more than
Transaction-based Cash
Comp.
Performance-based Cash
Comp. All Respondents 7 1.4 $57,367 $58,260 $48,347 $68,110 $60,535 $65,000 $53,374 $69,964 $1,007 $2,162
ORGANIZATIONAL STRUCTURE
Private 6 1.5 $57,979 $61,630 $46,815 $69,665 $60,333 $66,854 $50,000 $70,592 $280 $2,075
Public 1
TYPE OF BUREAU
Membership Based 5 1.6 $64,913 $65,000 $58,260 $71,220 $68,614 $68,707 $65,000 $71,220 $1,074 $2,626
Non-Membership Based 2
TOTAL REVENUE
0 to $499,999 0
$500,000 to $999,999 1
$1,000,000 to $1,999,999 0
$2,000,000 to $3,999,999 0
$4,000,000 to $9,999,999 1
$10 Million or More 5 1.6 $64,913 $65,000 $58,260 $71,220 $68,614 $68,707 $65,000 $71,220 $1,074 $2,626
NUMBER OF EMPLOYEES
Less Than 5 0
5 to 9 0
10 to 19 1
20 to 34 1
35 to 59 1
60 or More 4 4 1.8 $66,577 $68,110 $62,174 $72,513 $68,590 $68,110 $64,187 $72,513 $1,342

Note: A minimum of four responses required to show data.
2014 DMO Compensation & Benefits Study 42 Destination & Travel Foundation
Manager, Housing Services
Job Description: Coordinates attendee housing blocks and reservation confirmations. Manages Housing Clerk.
Count
Average Number of FTEs
Reported
Fixed Salary for FY 2014 Total Compensation Variable
Mean Median 75% earn
more than 25% earn
more than Mean Median 75% earn
more than 25% earn
more than
Transaction-based Cash
Comp.
Performance-based Cash
Comp. All Respondents 27 1.2 $49,129 $50,175 $42,218 $54,038 $51,538 $51,000 $45,142 $56,977 $696 $1,713
ORGANIZATIONAL STRUCTURE
Private 22 1.2 $49,018 $50,588 $41,970 $54,300 $51,686 $51,643 $44,160 $57,320 $662 $2,006
Public 5 1.0 $49,615 $49,754 $48,964 $50,695 $50,889 $49,754 $48,964 $50,695 $849 $424
TYPE OF BUREAU
Membership Based 20 1.2 $49,222 $50,588 $41,990 $53,775 $51,853 $51,053 $45,234 $56,819 $940 $1,691
Non-Membership Based 7 1.1 $48,861 $49,000 $46,052 $53,461 $50,637 $50,695 $46,802 $56,779 $0 $1,776
TOTAL REVENUE
0 to $499,999 0
$500,000 to $999,999 2
$1,000,000 to $1,999,999 0
$2,000,000 to $3,999,999 1
$4,000,000 to $9,999,999 3
$10 Million or More 21 1.2 $51,213 $51,000 $47,741 $54,563 $53,450 $51,106 $48,964 $56,662 $895 $1,341
NUMBER OF EMPLOYEES
Less Than 5 0
5 to 9 1
10 to 19 2
20 to 34 2
35 to 59 11 1.2 $53,973 $51,511 $49,570 $58,144 $56,886 $56,228 $50,414 $62,394 $1,137 $1,776
60 or More 11 1.3 $49,707 $50,695 $42,218 $53,606 $51,209 $50,695 $46,401 $54,849 $572 $930

Note: A minimum of four responses required to show data.
2014 DMO Compensation & Benefits Study 43 Destination & Travel Foundation
Housing Clerk
Job Description: Assists Director of Housing. Oversees data entry of reservations and dealing with delegate requests.
Count
Average Number of FTEs
Reported
Fixed Salary for FY 2014 Total Compensation Variable
Mean Median 75% earn
more than 25% earn
more than Mean Median 75% earn
more than 25% earn
more than
Transaction-based Cash
Comp.
Performance-based Cash
Comp. All Respondents 13 1.3 $38,635 $37,627 $35,131 $43,186 $39,405 $37,820 $35,734 $44,266 $27 $743
ORGANIZATIONAL STRUCTURE
Private 9 1.2 $38,731 $37,500 $35,000 $45,000 $39,732 $37,500 $35,131 $45,000 $39 $962
Public 4 1.5 $38,420 $37,724 $37,154 $38,990 $38,670 $38,224 $37,299 $39,595 $0 $250
TYPE OF BUREAU
Membership Based 9 1.2 $38,731 $37,500 $35,000 $45,000 $39,732 $37,500 $35,131 $45,000 $39 $962
Non-Membership Based 4 1.5 $38,420 $37,724 $37,154 $38,990 $38,670 $38,224 $37,299 $39,595 $0 $250
TOTAL REVENUE
0 to $499,999 0
$500,000 to $999,999 0
$1,000,000 to $1,999,999 0
$2,000,000 to $3,999,999 0
$4,000,000 to $9,999,999 1
$10 Million or More 12 1.3 $38,877 $37,724 $35,098 $43,640 $39,711 $38,224 $36,083 $44,450 $29 $805
NUMBER OF EMPLOYEES
Less Than 5 0
5 to 9 0
10 to 19 0
20 to 34 1
35 to 59 5 1.0 $38,501 $37,500 $35,000 $42,500 $39,537 $37,500 $36,400 $42,500 $70 $966
60 or More 7 1.6 $39,145 $37,820 $36,379 $44,093 $39,835 $38,627 $36,476 $44,633 $0 $690
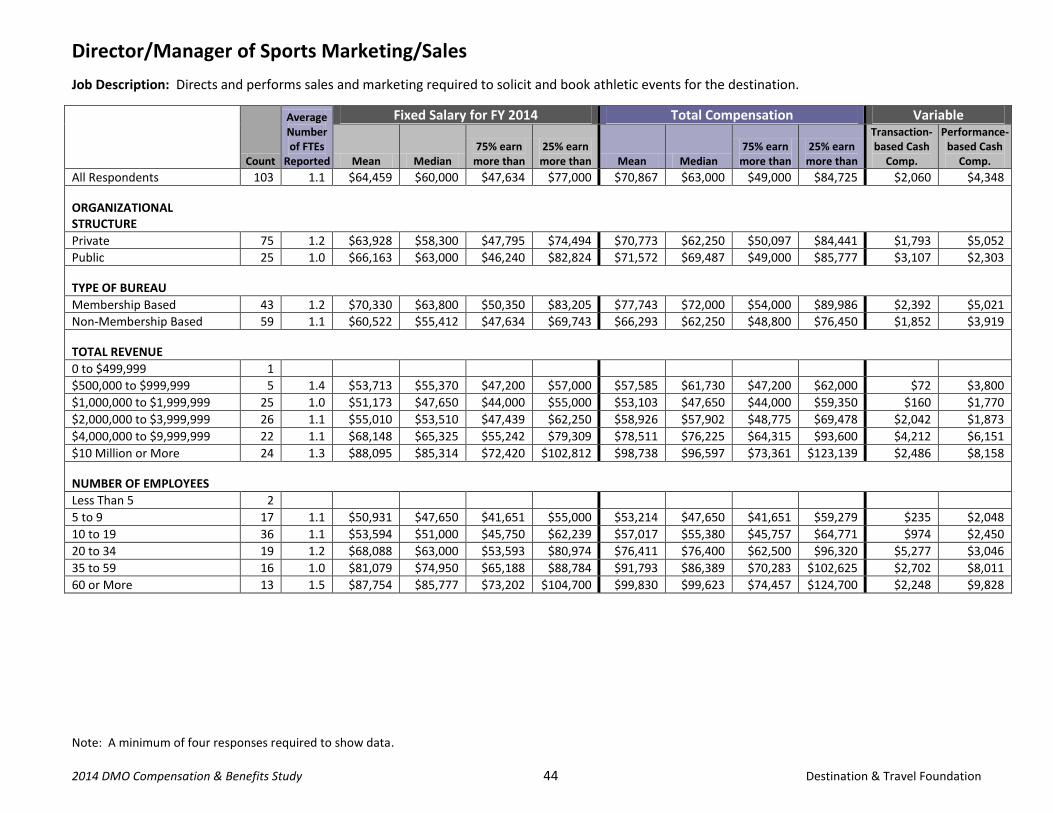
Note: A minimum of four responses required to show data.
2014 DMO Compensation & Benefits Study 44 Destination & Travel Foundation
Director/Manager of Sports Marketing/Sales
Job Description: Directs and performs sales and marketing required to solicit and book athletic events for the destination.
Count
Average Number of FTEs
Reported
Fixed Salary for FY 2014 Total Compensation Variable
Mean Median 75% earn
more than 25% earn
more than Mean Median 75% earn
more than 25% earn
more than
Transaction-based Cash
Comp.
Performance-based Cash
Comp. All Respondents 103 1.1 $64,459 $60,000 $47,634 $77,000 $70,867 $63,000 $49,000 $84,725 $2,060 $4,348
ORGANIZATIONAL STRUCTURE
Private 75 1.2 $63,928 $58,300 $47,795 $74,494 $70,773 $62,250 $50,097 $84,441 $1,793 $5,052
Public 25 1.0 $66,163 $63,000 $46,240 $82,824 $71,572 $69,487 $49,000 $85,777 $3,107 $2,303
TYPE OF BUREAU
Membership Based 43 1.2 $70,330 $63,800 $50,350 $83,205 $77,743 $72,000 $54,000 $89,986 $2,392 $5,021
Non-Membership Based 59 1.1 $60,522 $55,412 $47,634 $69,743 $66,293 $62,250 $48,800 $76,450 $1,852 $3,919
TOTAL REVENUE
0 to $499,999 1
$500,000 to $999,999 5 1.4 $53,713 $55,370 $47,200 $57,000 $57,585 $61,730 $47,200 $62,000 $72 $3,800
$1,000,000 to $1,999,999 25 1.0 $51,173 $47,650 $44,000 $55,000 $53,103 $47,650 $44,000 $59,350 $160 $1,770
$2,000,000 to $3,999,999 26 1.1 $55,010 $53,510 $47,439 $62,250 $58,926 $57,902 $48,775 $69,478 $2,042 $1,873
$4,000,000 to $9,999,999 22 1.1 $68,148 $65,325 $55,242 $79,309 $78,511 $76,225 $64,315 $93,600 $4,212 $6,151
$10 Million or More 24 1.3 $88,095 $85,314 $72,420 $102,812 $98,738 $96,597 $73,361 $123,139 $2,486 $8,158
NUMBER OF EMPLOYEES
Less Than 5 2
5 to 9 17 1.1 $50,931 $47,650 $41,651 $55,000 $53,214 $47,650 $41,651 $59,279 $235 $2,048
10 to 19 36 1.1 $53,594 $51,000 $45,750 $62,239 $57,017 $55,380 $45,757 $64,771 $974 $2,450
20 to 34 19 1.2 $68,088 $63,000 $53,593 $80,974 $76,411 $76,400 $62,500 $96,320 $5,277 $3,046
35 to 59 16 1.0 $81,079 $74,950 $65,188 $88,784 $91,793 $86,389 $70,283 $102,625 $2,702 $8,011
60 or More 13 1.5 $87,754 $85,777 $73,202 $104,700 $99,830 $99,623 $74,457 $124,700 $2,248 $9,828

Note: A minimum of four responses required to show data.
2014 DMO Compensation & Benefits Study 45 Destination & Travel Foundation
Convention Research Analyst
Job Description: Assists in collection of convention industry research and sales opportunity identification.
Count
Average Number of FTEs
Reported
Fixed Salary for FY 2014 Total Compensation Variable
Mean Median 75% earn
more than 25% earn
more than Mean Median 75% earn
more than 25% earn
more than
Transaction-based Cash
Comp.
Performance-based Cash
Comp. All Respondents 26 1.1 $55,172 $57,451 $44,535 $67,297 $57,253 $59,291 $44,535 $70,740 $394 $1,687
ORGANIZATIONAL STRUCTURE
Private 20 1.1 $53,395 $57,451 $42,100 $64,454 $55,572 $57,451 $42,500 $67,279 $257 $1,920
Public 6 1.2 $61,096 $61,061 $49,351 $73,441 $62,855 $64,882 $51,261 $74,045 $849 $910
TYPE OF BUREAU
Membership Based 19 1.1 $54,427 $60,000 $41,400 $66,531 $57,042 $60,000 $42,200 $70,297 $539 $2,076
Non-Membership Based 7 1.1 $57,193 $49,000 $47,630 $68,597 $57,823 $49,000 $47,630 $69,750 $0 $630
TOTAL REVENUE
0 to $499,999 0
$500,000 to $999,999 1
$1,000,000 to $1,999,999 2
$2,000,000 to $3,999,999 0
$4,000,000 to $9,999,999 7 1.1 $43,683 $43,900 $32,000 $55,691 $46,134 $43,900 $37,450 $56,661 $0 $2,451
$10 Million or More 16 1.1 $62,306 $64,636 $53,911 $70,445 $64,615 $67,990 $57,662 $73,487 $640 $1,669
NUMBER OF EMPLOYEES
Less Than 5 0
5 to 9 0
10 to 19 2
20 to 34 5 1.0 $43,856 $43,900 $34,000 $48,821 $46,787 $43,900 $37,500 $48,821 $0 $2,931
35 to 59 6 1.2 $48,539 $50,670 $41,610 $60,975 $49,484 $50,670 $41,610 $62,100 $0 $945
60 or More 13 1.2 $64,012 $68,062 $60,000 $71,182 $66,610 $71,182 $60,000 $75,000 $787 $1,811

Note: A minimum of four responses required to show data.
2014 DMO Compensation & Benefits Study 46 Destination & Travel Foundation
VP/Director, Tourism/Leisure Sales
Job Description: Similar line responsibilities and management duties as VP, Convention Sales but for tourism/travel trade sales. In some cases, supervises Visitor Information/Services operations of DMO.
Count
Average Number of FTEs
Reported
Fixed Salary for FY 2014 Total Compensation Variable
Mean Median 75% earn
more than 25% earn
more than Mean Median 75% earn
more than 25% earn
more than
Transaction-based Cash
Comp.
Performance-based Cash
Comp. All Respondents 60 1.1 $89,329 $86,246 $61,778 $110,022 $96,931 $89,950 $64,928 $125,737 $1,980 $5,623
ORGANIZATIONAL STRUCTURE
Private 39 1.1 $88,712 $89,000 $56,594 $117,960 $97,071 $91,000 $59,094 $128,505 $2,272 $6,087
Public 17 1.0 $92,452 $96,000 $65,470 $104,000 $99,342 $101,453 $65,470 $114,000 $1,774 $5,117
TYPE OF BUREAU
Membership Based 36 1.1 $98,033 $102,381 $68,127 $124,512 $108,217 $104,250 $75,766 $135,956 $2,846 $7,338
Non-Membership Based 23 1.0 $77,937 $78,425 $61,443 $89,571 $81,499 $83,740 $64,385 $95,291 $709 $2,852
TOTAL REVENUE
0 to $499,999 1
$500,000 to $999,999 5 1.0 $56,684 $53,400 $49,520 $54,000 $56,684 $53,400 $49,520 $54,000 $0 $0
$1,000,000 to $1,999,999 7 1.0 $57,492 $55,000 $49,546 $59,975 $58,801 $55,000 $51,629 $62,475 $0 $1,309
$2,000,000 to $3,999,999 6 1.0 $66,421 $66,754 $58,031 $74,000 $67,978 $66,754 $58,031 $80,000 $1,333 $223
$4,000,000 to $9,999,999 10 1.1 $72,303 $77,964 $63,434 $83,786 $76,483 $83,308 $70,137 $87,660 $300 $3,880
$10 Million or More 31 1.1 $111,683 $109,273 $100,232 $128,350 $123,870 $125,664 $104,000 $141,708 $3,273 $8,914
NUMBER OF EMPLOYEES
Less Than 5 1
5 to 9 8 1.0 $49,226 $49,806 $46,250 $53,800 $50,697 $51,629 $48,540 $53,800 $0 $1,471
10 to 19 9 1.0 $70,110 $71,000 $56,650 $88,213 $73,002 $71,000 $61,650 $88,213 $1,034 $1,858
20 to 34 8 1.1 $74,288 $76,252 $58,824 $82,870 $78,026 $83,370 $65,527 $85,491 $1,000 $2,738
35 to 59 15 1.0 $94,620 $96,000 $81,237 $105,000 $100,364 $99,700 $83,234 $112,200 $667 $5,077
60 or More 19 1.1 $119,333 $122,620 $105,363 $135,025 $135,242 $135,000 $124,142 $160,263 $4,814 $11,096

Note: A minimum of four responses required to show data.
2014 DMO Compensation & Benefits Study 47 Destination & Travel Foundation
National/Senior Tourism Sales Manager
Job Description: Similar duties as National/Senior Convention Sales Manager but for tourism/travel trade sales.
Count
Average Number of FTEs
Reported
Fixed Salary for FY 2014 Total Compensation Variable
Mean Median 75% earn
more than 25% earn
more than Mean Median 75% earn
more than 25% earn
more than
Transaction-based Cash
Comp.
Performance-based Cash
Comp. All Respondents 33 1.2 $69,152 $67,080 $58,000 $77,234 $73,761 $70,000 $62,000 $77,641 $2,018 $2,590
ORGANIZATIONAL STRUCTURE
Private 20 1.2 $66,874 $66,500 $56,798 $71,250 $71,951 $69,650 $56,798 $77,084 $3,000 $2,078
Public 11 1.2 $76,497 $69,000 $66,312 $82,754 $81,090 $77,300 $67,452 $85,254 $599 $3,994
TYPE OF BUREAU
Membership Based 22 1.2 $71,292 $68,215 $62,350 $77,539 $77,412 $75,994 $64,750 $86,910 $2,836 $3,284
Non-Membership Based 10 1.3 $67,761 $66,892 $56,743 $69,550 $69,505 $66,892 $63,082 $69,550 $420 $1,324
TOTAL REVENUE
0 to $499,999 0
$500,000 to $999,999 1
$1,000,000 to $1,999,999 2
$2,000,000 to $3,999,999 2
$4,000,000 to $9,999,999 4 1.3 $52,231 $54,563 $47,844 $58,950 $57,346 $57,663 $51,469 $63,540 $4,640 $475
$10 Million or More 24 1.3 $75,708 $69,470 $65,980 $78,627 $80,895 $76,556 $66,986 $90,709 $1,809 $3,379
NUMBER OF EMPLOYEES
Less Than 5 1
5 to 9 1
10 to 19 3
20 to 34 3
35 to 59 10 1.3 $69,285 $66,540 $61,850 $69,550 $72,503 $68,750 $63,270 $75,675 $1,566 $1,652
60 or More 15 1.3 $75,929 $69,939 $66,312 $77,821 $82,701 $77,300 $70,852 $88,595 $2,674 $4,098

Note: A minimum of four responses required to show data.
2014 DMO Compensation & Benefits Study 48 Destination & Travel Foundation
Tourism Sales Manager
Job Description: Similar duties as Convention Sales Manager but for tourism/travel trade sales.
Count
Average Number of FTEs
Reported
Fixed Salary for FY 2014 Total Compensation Variable
Mean Median 75% earn
more than 25% earn
more than Mean Median 75% earn
more than 25% earn
more than
Transaction-based Cash
Comp.
Performance-based Cash
Comp. All Respondents 87 1.2 $50,435 $48,600 $42,596 $56,087 $53,552 $51,000 $44,216 $59,518 $1,073 $2,044
ORGANIZATIONAL STRUCTURE
Private 63 1.2 $49,532 $48,000 $40,750 $54,555 $52,770 $51,000 $43,495 $58,756 $1,254 $1,984
Public 21 1.1 $53,796 $55,000 $43,732 $60,500 $56,704 $56,173 $48,298 $60,500 $683 $2,225
TYPE OF BUREAU
Membership Based 44 1.3 $54,364 $50,777 $43,494 $56,765 $58,727 $53,550 $46,551 $63,494 $1,759 $2,604
Non-Membership Based 43 1.0 $46,416 $47,500 $40,000 $53,780 $48,256 $48,298 $42,075 $55,802 $370 $1,470
TOTAL REVENUE
0 to $499,999 2
$500,000 to $999,999 10 1.0 $41,119 $38,000 $30,539 $53,042 $43,769 $41,000 $32,867 $57,125 $300 $2,350
$1,000,000 to $1,999,999 14 1.0 $44,437 $43,966 $38,000 $48,525 $44,891 $44,462 $40,625 $48,525 $0 $454
$2,000,000 to $3,999,999 14 1.1 $47,830 $45,108 $43,119 $51,958 $49,649 $46,950 $44,835 $53,295 $607 $1,212
$4,000,000 to $9,999,999 16 1.0 $50,490 $51,322 $43,875 $56,125 $54,527 $55,750 $48,971 $60,585 $919 $3,118
$10 Million or More 31 1.5 $57,707 $53,500 $47,523 $57,750 $62,254 $54,109 $50,013 $68,350 $2,088 $2,460
NUMBER OF EMPLOYEES
Less Than 5 8 1.0 $40,820 $41,346 $33,227 $49,724 $42,757 $43,346 $36,602 $49,724 $375 $1,563
5 to 9 13 1.0 $41,948 $40,000 $36,000 $47,150 $42,668 $40,500 $36,000 $47,150 $0 $719
10 to 19 17 1.0 $48,595 $46,013 $43,476 $55,000 $50,965 $48,313 $44,562 $56,000 $759 $1,610
20 to 34 15 1.1 $49,036 $50,000 $44,000 $53,742 $52,878 $52,483 $47,578 $58,083 $533 $3,308
35 to 59 17 1.3 $52,877 $54,109 $50,000 $56,520 $56,490 $56,173 $51,388 $62,400 $2,647 $966
60 or More 17 1.5 $62,084 $53,500 $43,514 $70,000 $67,198 $53,600 $48,944 $80,411 $1,436 $3,678

Note: A minimum of four responses required to show data.
2014 DMO Compensation & Benefits Study 49 Destination & Travel Foundation
International Tourism Sales Manager
Job Description: Similar duties as Convention Sales Manager but for international tourism/travel trade sales.
Count
Average Number of FTEs
Reported
Fixed Salary for FY 2014 Total Compensation Variable
Mean Median 75% earn
more than 25% earn
more than Mean Median 75% earn
more than 25% earn
more than
Transaction-based Cash
Comp.
Performance-based Cash
Comp. All Respondents 21 1.3 $62,508 $60,000 $54,000 $68,857 $66,853 $63,800 $55,200 $75,100 $1,390 $2,955
ORGANIZATIONAL STRUCTURE
Private 14 1.4 $61,682 $58,850 $54,250 $65,984 $65,280 $61,650 $55,400 $68,554 $1,371 $2,227
Public 6 1.3 $61,183 $60,050 $53,500 $68,025 $67,997 $70,550 $57,450 $76,735 $1,667 $5,147
TYPE OF BUREAU
Membership Based 18 1.4 $61,425 $58,850 $54,250 $66,074 $65,939 $63,550 $55,400 $72,708 $1,067 $3,447
Non-Membership Based 3
TOTAL REVENUE
0 to $499,999 0
$500,000 to $999,999 2
$1,000,000 to $1,999,999 0
$2,000,000 to $3,999,999 3
$4,000,000 to $9,999,999 2
$10 Million or More 14 1.4 $64,385 $64,920 $55,675 $68,964 $69,548 $67,835 $58,275 $76,735 $1,630 $3,532
NUMBER OF EMPLOYEES
Less Than 5 0
5 to 9 1
10 to 19 3
20 to 34 1
35 to 59 7 1.3 $66,896 $66,398 $56,650 $78,507 $69,552 $66,398 $56,650 $83,507 $2,339 $317
60 or More 9 1.4 $64,600 $64,740 $57,700 $68,857 $71,273 $69,272 $60,000 $75,100 $1,425 $5,248

Note: A minimum of four responses required to show data.
2014 DMO Compensation & Benefits Study 50 Destination & Travel Foundation
Manager, Visitor Services/Information
Job Description: Responsible for managing all operations and personnel associated with visitor services/information outlet(s).
Count
Average Number of FTEs
Reported
Fixed Salary for FY 2014 Total Compensation Variable
Mean Median 75% earn
more than 25% earn
more than Mean Median 75% earn
more than 25% earn
more than
Transaction-based Cash
Comp.
Performance-based Cash
Comp. All Respondents 114 1.1 $46,192 $45,594 $37,199 $54,966 $47,572 $46,951 $38,128 $56,112 $86 $1,294
ORGANIZATIONAL STRUCTURE
Private 81 1.1 $45,384 $44,149 $37,413 $54,862 $46,829 $45,000 $38,000 $55,968 $39 $1,406
Public 30 1.1 $49,682 $50,000 $40,191 $58,113 $50,970 $50,925 $41,985 $58,113 $219 $1,069
TYPE OF BUREAU
Membership Based 61 1.1 $47,835 $46,350 $39,236 $56,796 $49,408 $49,500 $40,000 $57,025 $144 $1,429
Non-Membership Based 53 1.1 $44,302 $40,764 $32,271 $53,455 $45,459 $41,200 $35,109 $54,000 $19 $1,138
TOTAL REVENUE
0 to $499,999 5 1.0 $33,831 $29,500 $28,000 $31,666 $33,831 $29,500 $28,000 $31,666 $0 $0
$500,000 to $999,999 12 1.0 $33,810 $31,000 $26,500 $35,832 $34,019 $31,000 $26,500 $36,457 $0 $208
$1,000,000 to $1,999,999 14 1.1 $45,829 $43,700 $39,525 $52,338 $46,286 $46,812 $39,525 $52,338 $71 $386
$2,000,000 to $3,999,999 25 1.0 $41,620 $40,000 $35,000 $46,350 $43,238 $40,431 $36,410 $48,000 $124 $1,494
$4,000,000 to $9,999,999 25 1.1 $49,926 $50,000 $41,813 $55,844 $51,657 $51,500 $44,460 $56,400 $0 $1,732
$10 Million or More 33 1.2 $53,358 $51,355 $45,540 $63,036 $55,317 $56,239 $45,540 $63,795 $172 $1,787
NUMBER OF EMPLOYEES
Less Than 5 5 1.0 $30,855 $30,000 $29,500 $31,666 $30,855 $30,000 $29,500 $31,666 $0 $0
5 to 9 20 1.0 $38,349 $38,000 $29,250 $45,079 $38,794 $39,000 $29,250 $49,879 $50 $395
10 to 19 26 1.1 $44,578 $40,816 $36,808 $51,500 $45,841 $44,730 $37,117 $53,088 $77 $1,186
20 to 34 24 1.0 $44,926 $44,990 $37,342 $50,000 $46,455 $45,990 $38,833 $52,727 $46 $1,483
35 to 59 23 1.0 $48,634 $46,350 $41,907 $54,931 $49,976 $48,300 $42,332 $56,320 $0 $1,342
60 or More 16 1.4 $61,804 $62,102 $56,093 $69,554 $64,803 $63,462 $60,180 $71,856 $354 $2,646

Note: A minimum of four responses required to show data.
2014 DMO Compensation & Benefits Study 51 Destination & Travel Foundation
Visitor Services Specialist/Counselor
Job Description: Act as visitor services greeter to all individuals requesting information on destination.
Count
Average Number of FTEs
Reported
Fixed Salary for FY 2014 Total Compensation Variable
Mean Median 75% earn
more than 25% earn
more than Mean Median 75% earn
more than 25% earn
more than
Transaction-based Cash
Comp.
Performance-based Cash
Comp. All Respondents 100 2.4 $34,990 $30,604 $25,247 $37,838 $35,327 $31,350 $25,875 $38,310 $47 $290
ORGANIZATIONAL STRUCTURE
Private 65 2.3 $33,889 $30,576 $25,329 $35,663 $34,269 $31,500 $26,210 $36,000 $18 $361
Public 31 2.4 $37,745 $31,200 $25,000 $42,930 $37,986 $31,624 $25,250 $42,930 $113 $127
TYPE OF BUREAU
Membership Based 47 2.8 $37,986 $32,223 $26,085 $37,589 $38,444 $32,432 $27,026 $38,620 $89 $368
Non-Membership Based 51 2.0 $32,417 $30,000 $24,980 $36,892 $32,604 $30,000 $25,750 $36,892 $10 $176
TOTAL REVENUE
0 to $499,999 5 1.1 $39,751 $41,794 $33,000 $48,000 $40,001 $41,794 $33,000 $48,000 $100 $150
$500,000 to $999,999 6 1.7 $36,686 $31,000 $29,250 $46,546 $36,786 $31,000 $29,250 $46,996 $0 $100
$1,000,000 to $1,999,999 17 1.5 $37,297 $30,000 $23,052 $37,784 $37,415 $30,000 $23,500 $37,784 $0 $118
$2,000,000 to $3,999,999 25 1.6 $32,930 $27,482 $23,000 $32,136 $33,009 $27,482 $23,000 $32,136 $28 $50
$4,000,000 to $9,999,999 19 3.3 $29,445 $27,415 $21,840 $30,816 $29,991 $27,915 $22,165 $32,802 $0 $546
$10 Million or More 28 3.3 $37,977 $34,043 $30,654 $39,516 $38,602 $34,523 $31,593 $41,221 $125 $500
NUMBER OF EMPLOYEES
Less Than 5 4 1.1 $43,449 $44,897 $39,596 $48,750 $43,449 $44,897 $39,596 $48,750 $0 $0
5 to 9 18 1.3 $27,957 $29,500 $23,539 $31,070 $28,176 $29,500 $24,000 $31,070 $0 $219
10 to 19 28 1.5 $41,188 $31,356 $24,545 $41,781 $41,277 $31,356 $25,325 $42,213 $18 $72
20 to 34 20 2.9 $28,383 $26,801 $22,750 $30,301 $28,719 $27,458 $22,750 $32,268 $35 $301
35 to 59 15 3.0 $39,331 $32,457 $30,316 $44,175 $40,073 $33,375 $31,562 $44,975 $0 $742
60 or More 15 4.2 $34,073 $34,000 $28,065 $35,260 $34,698 $34,034 $28,286 $36,459 $233 $392

Note: A minimum of four responses required to show data.
2014 DMO Compensation & Benefits Study 52 Destination & Travel Foundation
Chief Marketing Officer
Job Description: Develops and manages the marketing activities for the DMO that relate to developing trade and consumer visitor markets for the destination. Typically works with DMO’s advertising agency.
Count
Average Number of FTEs
Reported
Fixed Salary for FY 2014 Total Compensation Variable
Mean Median 75% earn
more than 25% earn
more than Mean Median 75% earn
more than 25% earn
more than
Transaction-based Cash
Comp.
Performance-based Cash
Comp. All Respondents 24 1.0 $144,341 $142,000 $94,660 $188,651 $163,430 $148,000 $97,997 $231,475 $0 $19,090
ORGANIZATIONAL STRUCTURE
Private 20 1.0 $149,353 $148,000 $112,964 $188,755 $170,007 $153,991 $123,717 $232,426 $0 $20,654
Public 4 1.0 $119,278 $104,027 $80,533 $142,772 $130,546 $107,277 $80,533 $157,290 $0 $11,269
TYPE OF BUREAU
Membership Based 17 1.0 $160,337 $185,000 $120,000 $193,284 $184,295 $222,768 $132,000 $234,998 $0 $23,958
Non-Membership Based 7 1.0 $105,491 $118,821 $79,085 $131,724 $112,758 $132,572 $79,085 $140,293 $0 $7,267
TOTAL REVENUE
0 to $499,999 1
$500,000 to $999,999 2
$1,000,000 to $1,999,999 0
$2,000,000 to $3,999,999 2
$4,000,000 to $9,999,999 4 1.0 $105,496 $100,991 $79,987 $126,500 $108,496 $106,991 $79,987 $135,500 $0 $3,000
$10 Million or More 15 1.0 $169,593 $185,640 $138,036 $195,439 $197,536 $224,694 $146,293 $236,056 $0 $27,943
NUMBER OF EMPLOYEES
Less Than 5 1
5 to 9 1
10 to 19 1
20 to 34 6 1.0 $97,002 $87,224 $77,636 $113,117 $103,503 $90,424 $77,636 $123,717 $0 $6,501
35 to 59 3
60 or More 12 1.0 $183,240 $190,058 $183,942 $201,080 $216,189 $231,507 $219,960 $237,835 $0 $32,949

Note: A minimum of four responses required to show data.
2014 DMO Compensation & Benefits Study 53 Destination & Travel Foundation
VP, Marketing
Job Description: Develops and manages the marketing activities for the DMO that relate to developing trade and consumer visitor markets for the destination. Typically works with DMO’s advertising agency.
Count
Average Number of FTEs
Reported
Fixed Salary for FY 2014 Total Compensation Variable
Mean Median 75% earn
more than 25% earn
more than Mean Median 75% earn
more than 25% earn
more than
Transaction-based Cash
Comp.
Performance-based Cash
Comp. All Respondents 49 1.0 $105,245 $104,582 $89,604 $122,004 $113,751 $112,961 $94,236 $132,368 $1,050 $7,455
ORGANIZATIONAL STRUCTURE
Private 35 1.0 $106,358 $107,962 $90,424 $123,002 $115,403 $114,440 $97,455 $133,119 $816 $8,230
Public 13 1.0 $100,490 $96,409 $87,400 $119,646 $108,196 $96,409 $87,400 $121,275 $1,762 $5,944
TYPE OF BUREAU
Membership Based 28 1.0 $109,688 $109,821 $98,561 $124,172 $120,640 $121,483 $103,691 $138,517 $1,838 $9,114
Non-Membership Based 21 1.0 $99,322 $94,236 $87,200 $119,777 $104,566 $96,409 $89,604 $121,275 $0 $5,244
TOTAL REVENUE
0 to $499,999 0
$500,000 to $999,999 0
$1,000,000 to $1,999,999 1
$2,000,000 to $3,999,999 10 1.0 $80,343 $87,155 $70,420 $89,053 $84,495 $87,355 $76,035 $94,176 $0 $4,152
$4,000,000 to $9,999,999 16 1.0 $110,688 $108,052 $93,927 $121,381 $118,080 $112,770 $100,358 $128,440 $0 $7,391
$10 Million or More 22 1.0 $115,390 $117,503 $101,457 $125,750 $127,071 $128,250 $113,712 $142,070 $2,339 $9,342
NUMBER OF EMPLOYEES
Less Than 5 0
5 to 9 0
10 to 19 8 1.0 $80,931 $87,355 $70,659 $90,453 $83,936 $87,355 $73,851 $93,453 $0 $3,005
20 to 34 14 1.0 $105,178 $106,272 $88,809 $117,567 $112,569 $106,862 $96,369 $121,191 $0 $7,391
35 to 59 17 1.0 $108,840 $115,360 $93,625 $125,000 $118,239 $127,500 $94,800 $138,432 $66 $9,333
60 or More 10 1.0 $118,680 $117,323 $104,591 $127,922 $131,627 $128,000 $114,632 $148,011 $5,034 $7,913

Note: A minimum of four responses required to show data.
2014 DMO Compensation & Benefits Study 54 Destination & Travel Foundation
Director of Marketing
Job Description: Similar line responsibilities as VP, Marketing. Develops and implements strategic and tactical marketing programs. May manage other Marketing staff.
Count
Average Number of FTEs
Reported
Fixed Salary for FY 2014 Total Compensation Variable
Mean Median 75% earn
more than 25% earn
more than Mean Median 75% earn
more than 25% earn
more than
Transaction-based Cash
Comp.
Performance-based Cash
Comp. All Respondents 110 1.0 $65,447 $65,000 $51,641 $76,000 $68,078 $67,575 $52,133 $79,014 $211 $2,420
ORGANIZATIONAL STRUCTURE
Private 75 1.1 $65,948 $66,950 $52,026 $76,607 $69,098 $69,000 $52,915 $79,784 $203 $2,947
Public 31 1.0 $65,225 $65,000 $53,000 $75,578 $66,910 $66,650 $53,000 $76,724 $258 $1,427
TYPE OF BUREAU
Membership Based 56 1.0 $70,513 $68,500 $56,800 $80,625 $73,888 $71,400 $59,838 $84,075 $324 $3,051
Non-Membership Based 53 1.1 $60,124 $62,000 $42,640 $73,542 $62,000 $62,000 $44,260 $75,000 $95 $1,781
TOTAL REVENUE
0 to $499,999 4 1.0 $55,579 $52,490 $32,834 $75,234 $59,178 $59,000 $32,834 $85,344 $1,260 $2,339
$500,000 to $999,999 17 1.0 $44,679 $42,000 $34,500 $49,650 $45,267 $43,000 $34,500 $49,650 $0 $588
$1,000,000 to $1,999,999 29 1.0 $56,907 $55,600 $45,000 $66,950 $57,734 $57,268 $47,060 $67,000 $21 $806
$2,000,000 to $3,999,999 21 1.0 $66,912 $69,000 $60,000 $71,500 $70,659 $70,040 $61,000 $75,000 $48 $3,699
$4,000,000 to $9,999,999 14 1.0 $78,966 $77,865 $65,567 $90,000 $84,220 $82,828 $69,839 $96,269 $0 $5,255
$10 Million or More 25 1.2 $82,253 $77,450 $72,000 $95,000 $85,803 $79,568 $73,542 $105,000 $663 $2,887
NUMBER OF EMPLOYEES
Less Than 5 5 1.0 $42,980 $33,000 $32,000 $49,650 $43,180 $33,000 $33,000 $49,650 $0 $200
5 to 9 32 1.0 $50,356 $45,250 $41,106 $58,400 $51,678 $47,101 $41,375 $62,050 $19 $1,304
10 to 19 32 1.0 $63,605 $62,656 $55,462 $71,125 $66,222 $64,386 $56,713 $72,558 $189 $2,428
20 to 34 12 1.0 $71,752 $71,000 $65,000 $79,681 $73,915 $73,750 $68,000 $82,375 $0 $2,164
35 to 59 16 1.2 $79,932 $76,495 $73,547 $90,000 $84,422 $79,552 $74,015 $98,388 $108 $4,382
60 or More 13 1.1 $92,122 $88,799 $73,542 $109,617 $97,083 $104,979 $77,293 $109,617 $1,141 $3,821

Note: A minimum of four responses required to show data.
2014 DMO Compensation & Benefits Study 55 Destination & Travel Foundation
Manager of Online Marketing/Digital Marketing/eMarketing
Job Description: Manages DMO website including design and functionality. Develops and manages online marketing and interactive initiatives. Works closely with web and advertising staff/vendors.
Count
Average Number of FTEs
Reported
Fixed Salary for FY 2014 Total Compensation Variable
Mean Median 75% earn
more than 25% earn
more than Mean Median 75% earn
more than 25% earn
more than
Transaction-based Cash
Comp.
Performance-based Cash
Comp. All Respondents 90 1.0 $54,930 $51,447 $40,000 $68,657 $57,114 $52,469 $41,119 $71,564 $218 $1,966
ORGANIZATIONAL STRUCTURE
Private 65 1.0 $55,069 $51,560 $40,000 $67,626 $57,017 $51,560 $40,000 $71,007 $185 $1,763
Public 23 1.0 $54,704 $50,000 $42,359 $72,335 $57,709 $54,600 $42,359 $77,394 $329 $2,676
TYPE OF BUREAU
Membership Based 52 1.0 $58,922 $55,753 $41,500 $70,500 $61,533 $59,057 $43,125 $73,539 $377 $2,235
Non-Membership Based 36 1.0 $49,818 $45,750 $39,316 $60,125 $51,250 $45,750 $39,833 $60,548 $0 $1,431
TOTAL REVENUE
0 to $499,999 0
$500,000 to $999,999 6 0.9 $32,078 $31,000 $30,000 $34,250 $32,328 $31,000 $30,000 $34,250 $0 $250
$1,000,000 to $1,999,999 9 1.0 $39,294 $37,595 $33,500 $40,650 $39,594 $38,762 $33,500 $40,650 $67 $233
$2,000,000 to $3,999,999 21 1.0 $45,756 $43,000 $38,175 $51,000 $47,260 $43,000 $39,330 $53,818 $0 $1,503
$4,000,000 to $9,999,999 23 1.0 $52,369 $50,000 $43,745 $55,295 $53,591 $50,840 $45,245 $56,940 $0 $1,222
$10 Million or More 31 1.1 $72,007 $69,293 $61,800 $82,190 $76,286 $75,882 $63,597 $90,184 $613 $3,666
NUMBER OF EMPLOYEES
Less Than 5 1
5 to 9 10 1.0 $36,082 $35,000 $30,000 $39,886 $37,192 $35,000 $30,000 $40,186 $60 $1,050
10 to 19 24 1.0 $43,012 $41,700 $38,131 $48,250 $44,067 $42,500 $38,615 $49,788 $0 $1,055
20 to 34 19 1.0 $52,096 $51,560 $43,859 $57,883 $53,160 $51,560 $44,750 $59,057 $0 $1,064
35 to 59 19 1.1 $61,844 $61,800 $51,087 $73,941 $64,194 $64,650 $51,087 $73,941 $91 $2,258
60 or More 17 1.1 $79,542 $78,795 $69,000 $86,700 $85,145 $86,700 $72,758 $100,229 $1,015 $4,588

Note: A minimum of four responses required to show data.
2014 DMO Compensation & Benefits Study 56 Destination & Travel Foundation
Content Marketing Manager/Social Media Manager
Job Description: Develops and manages website content and other applications including social media, e-newsletters, etc.
Count
Average Number of FTEs
Reported
Fixed Salary for FY 2014 Total Compensation Variable
Mean Median 75% earn
more than 25% earn
more than Mean Median 75% earn
more than 25% earn
more than
Transaction-based Cash
Comp.
Performance-based Cash
Comp. All Respondents 89 1.1 $43,627 $41,428 $36,000 $48,500 $45,081 $43,547 $36,571 $52,056 $351 $1,102
ORGANIZATIONAL STRUCTURE
Private 67 1.1 $43,404 $40,723 $35,600 $48,750 $45,087 $41,240 $36,032 $51,778 $452 $1,231
Public 19 1.0 $42,940 $44,696 $37,757 $45,920 $43,413 $44,696 $37,757 $46,675 $0 $474
TYPE OF BUREAU
Membership Based 43 1.2 $47,442 $45,500 $38,920 $53,148 $48,913 $47,300 $38,949 $55,641 $130 $1,341
Non-Membership Based 45 1.0 $40,130 $39,576 $33,000 $45,000 $41,576 $40,000 $33,408 $45,490 $549 $897
TOTAL REVENUE
0 to $499,999 4 1.0 $27,165 $25,256 $12,383 $40,038 $33,940 $30,550 $20,628 $43,863 $5,925 $850
$500,000 to $999,999 5 1.0 $36,301 $36,500 $35,364 $37,000 $36,791 $37,250 $36,064 $38,000 $200 $290
$1,000,000 to $1,999,999 12 1.0 $38,018 $36,836 $35,125 $41,012 $38,102 $36,836 $35,125 $41,637 $0 $83
$2,000,000 to $3,999,999 16 1.0 $38,244 $38,345 $30,893 $44,500 $40,169 $41,191 $32,548 $44,500 $63 $1,863
$4,000,000 to $9,999,999 21 1.1 $42,056 $43,743 $36,982 $46,350 $43,278 $44,223 $36,982 $46,505 $0 $1,222
$10 Million or More 31 1.2 $52,948 $51,500 $42,464 $61,964 $54,313 $52,500 $43,062 $63,144 $180 $1,185
NUMBER OF EMPLOYEES
Less Than 5 3
5 to 9 10 1.0 $39,960 $38,288 $36,125 $42,535 $40,235 $38,788 $36,313 $42,910 $100 $175
10 to 19 22 1.0 $37,842 $36,840 $33,250 $43,600 $39,304 $38,221 $33,556 $44,643 $123 $1,339
20 to 34 19 1.0 $42,966 $43,252 $36,341 $47,388 $44,144 $43,252 $36,523 $50,135 $0 $1,178
35 to 59 21 1.2 $49,427 $49,000 $41,428 $58,588 $50,335 $52,200 $43,743 $58,772 $82 $826
60 or More 14 1.4 $53,420 $47,150 $40,583 $60,030 $55,631 $48,013 $41,380 $65,244 $275 $1,936

Note: A minimum of four responses required to show data.
2014 DMO Compensation & Benefits Study 57 Destination & Travel Foundation
Director of Multicultural Tourism
Job Description: Markets and sells the destination as a multicultural destination for leisure and meetings/convention visitors.
Count
Average Number of FTEs
Reported
Fixed Salary for FY 2014 Total Compensation Variable
Mean Median 75% earn
more than 25% earn
more than Mean Median 75% earn
more than 25% earn
more than
Transaction-based Cash
Comp.
Performance-based Cash
Comp. All Respondents 15 1.1 $80,038 $80,000 $69,105 $93,112 $85,582 $90,349 $76,526 $96,916 $1,951 $3,592
ORGANIZATIONAL STRUCTURE
Private 11 1.2 $75,992 $78,000 $60,550 $88,375 $80,906 $82,895 $61,450 $96,916 $566 $4,347
Public 4 1.0 $91,164 $89,261 $80,918 $99,508 $98,441 $92,294 $88,727 $102,008 $5,761 $1,516
TYPE OF BUREAU
Membership Based 10 1.2 $78,881 $79,000 $68,091 $91,115 $84,890 $86,622 $78,689 $98,573 $1,407 $4,602
Non-Membership Based 5 1.0 $82,352 $86,154 $73,000 $92,369 $86,965 $92,218 $74,800 $92,369 $3,040 $1,573
TOTAL REVENUE
0 to $499,999 0
$500,000 to $999,999 0
$1,000,000 to $1,999,999 0
$2,000,000 to $3,999,999 1
$4,000,000 to $9,999,999 2
$10 Million or More 12 1.2 $84,188 $84,524 $73,853 $96,470 $89,235 $91,284 $79,563 $103,860 $2,006 $3,041
NUMBER OF EMPLOYEES
Less Than 5 0
5 to 9 0
10 to 19 1
20 to 34 1
35 to 59 4 1.0 $93,743 $90,525 $75,801 $108,467 $102,705 $102,548 $86,462 $118,790 $2,500 $6,462
60 or More 9 1.2 $78,698 $82,895 $65,210 $92,369 $81,644 $82,895 $78,252 $92,369 $1,564 $1,382

Note: A minimum of four responses required to show data.
2014 DMO Compensation & Benefits Study 58 Destination & Travel Foundation
Director/Manager, Research
Job Description: Responsible for developing and implementing statistical or content research required by DMO, the industry and local stakeholders.
Count
Average Number of FTEs
Reported
Fixed Salary for FY 2014 Total Compensation Variable
Mean Median 75% earn
more than 25% earn
more than Mean Median 75% earn
more than 25% earn
more than
Transaction-based Cash
Comp.
Performance-based Cash
Comp. All Respondents 29 1.1 $70,607 $62,550 $50,000 $85,000 $73,915 $62,550 $52,187 $96,000 $82 $3,226
ORGANIZATIONAL STRUCTURE
Private 24 1.1 $72,025 $62,974 $50,890 $86,250 $75,579 $64,558 $53,603 $96,327 $99 $3,454
Public 5 1.0 $63,797 $57,857 $47,000 $80,677 $65,927 $57,857 $47,000 $80,677 $0 $2,130
TYPE OF BUREAU
Membership Based 21 1.1 $73,040 $63,397 $51,187 $90,000 $76,339 $66,566 $54,075 $96,000 $114 $3,185
Non-Membership Based 8 1.1 $64,219 $58,879 $49,147 $81,758 $67,550 $58,879 $49,147 $85,758 $0 $3,331
TOTAL REVENUE
0 to $499,999 0
$500,000 to $999,999 1
$1,000,000 to $1,999,999 0
$2,000,000 to $3,999,999 3
$4,000,000 to $9,999,999 4 1.0 $56,984 $54,469 $46,890 $64,563 $61,234 $54,969 $47,640 $68,563 $0 $4,250
$10 Million or More 21 1.1 $77,097 $77,975 $54,075 $91,395 $80,813 $80,677 $56,810 $97,308 $114 $3,602
NUMBER OF EMPLOYEES
Less Than 5 0
5 to 9 0
10 to 19 2
20 to 34 4 1.0 $48,205 $44,106 $43,070 $49,240 $48,430 $44,556 $43,745 $49,240 $0 $225
35 to 59 10 1.1 $61,585 $58,879 $52,828 $64,521 $65,421 $58,879 $53,578 $73,795 $0 $3,836
60 or More 13 1.1 $88,851 $90,000 $77,975 $103,883 $93,210 $96,000 $80,677 $114,244 $183 $4,175

Note: A minimum of four responses required to show data.
2014 DMO Compensation & Benefits Study 59 Destination & Travel Foundation
Manager, Product/Special Event Development
Job Description: Develops special marketing projects and activities including merchandising, industry and special event promotions, etc.
Count
Average Number of FTEs
Reported
Fixed Salary for FY 2014 Total Compensation Variable
Mean Median 75% earn
more than 25% earn
more than Mean Median 75% earn
more than 25% earn
more than
Transaction-based Cash
Comp.
Performance-based Cash
Comp. All Respondents 50 1.1 $54,183 $53,410 $42,481 $67,511 $55,832 $53,910 $42,669 $67,511 $0 $1,649
ORGANIZATIONAL STRUCTURE
Private 31 1.1 $53,475 $51,732 $42,545 $62,240 $55,560 $51,732 $42,920 $64,077 $0 $2,086
Public 18 1.1 $56,391 $57,842 $46,857 $69,580 $57,380 $58,842 $52,570 $69,889 $0 $990
TYPE OF BUREAU
Membership Based 25 1.1 $56,049 $56,028 $48,075 $62,500 $58,160 $56,742 $50,000 $65,653 $0 $2,111
Non-Membership Based 25 1.1 $52,317 $52,427 $41,700 $67,571 $53,504 $52,427 $41,700 $67,571 $0 $1,187
TOTAL REVENUE
0 to $499,999 2
$500,000 to $999,999 4 1.0 $43,500 $47,500 $40,250 $50,750 $44,125 $48,750 $42,125 $50,750 $0 $625
$1,000,000 to $1,999,999 3
$2,000,000 to $3,999,999 10 1.0 $46,711 $46,538 $37,334 $57,366 $48,756 $49,424 $38,269 $58,275 $0 $2,045
$4,000,000 to $9,999,999 11 1.0 $52,837 $57,327 $38,200 $68,300 $54,699 $59,327 $38,700 $69,631 $0 $1,862
$10 Million or More 20 1.2 $61,265 $57,549 $49,344 $74,657 $63,180 $62,018 $49,344 $75,452 $0 $1,914
NUMBER OF EMPLOYEES
Less Than 5 3
5 to 9 7 1.0 $45,324 $48,000 $39,195 $53,000 $45,431 $48,000 $39,570 $53,000 $0 $107
10 to 19 8 1.0 $47,762 $48,714 $39,751 $61,608 $50,872 $53,214 $42,863 $61,608 $0 $3,110
20 to 34 11 0.9 $51,236 $50,364 $35,638 $68,925 $52,604 $50,364 $35,638 $69,631 $0 $1,368
35 to 59 12 1.3 $59,472 $56,385 $48,045 $70,178 $60,907 $59,621 $48,045 $70,178 $0 $1,434
60 or More 9 1.1 $66,818 $61,980 $56,414 $73,542 $69,271 $62,055 $58,356 $74,602 $0 $2,453

Note: A minimum of four responses required to show data.
2014 DMO Compensation & Benefits Study 60 Destination & Travel Foundation
VP, Communications
Job Description: Identifies communication opportunities. Directs all communications and PR functions. Acts as DMO spokesperson. Direct reports may include Director/Manager of Communications/Public Relations, Director/ Manager, Publications.
Count
Average Number of FTEs
Reported
Fixed Salary for FY 2014 Total Compensation Variable
Mean Median 75% earn
more than 25% earn
more than Mean Median 75% earn
more than 25% earn
more than
Transaction-based Cash
Comp.
Performance-based Cash
Comp. All Respondents 37 1.0 $106,174 $108,000 $84,885 $124,630 $114,379 $120,000 $84,885 $147,518 $238 $7,966
ORGANIZATIONAL STRUCTURE
Private 24 1.0 $111,221 $112,008 $90,000 $122,658 $119,729 $123,000 $99,344 $142,726 $317 $8,192
Public 11 1.0 $102,512 $89,600 $66,773 $146,788 $110,447 $89,600 $66,773 $158,192 $0 $7,935
TYPE OF BUREAU
Membership Based 26 1.0 $111,579 $116,015 $91,256 $124,908 $121,412 $127,300 $102,500 $149,047 $292 $9,541
Non-Membership Based 11 1.0 $93,400 $86,411 $61,906 $105,462 $97,753 $86,411 $64,660 $105,462 $109 $4,244
TOTAL REVENUE
0 to $499,999 0
$500,000 to $999,999 1
$1,000,000 to $1,999,999 2
$2,000,000 to $3,999,999 6 1.0 $73,570 $73,905 $53,797 $92,334 $78,515 $73,905 $60,377 $98,034 $1,467 $3,478
$4,000,000 to $9,999,999 4 1.0 $96,904 $90,000 $89,900 $97,004 $104,280 $90,000 $89,900 $104,380 $0 $7,376
$10 Million or More 24 1.0 $121,463 $120,462 $106,932 $145,894 $131,645 $131,559 $117,228 $151,225 $0 $10,183
NUMBER OF EMPLOYEES
Less Than 5 1
5 to 9 1
10 to 19 5 1.0 $68,189 $63,546 $50,547 $89,600 $70,603 $63,546 $59,320 $89,600 $240 $2,174
20 to 34 6 1.0 $93,015 $92,512 $85,698 $99,346 $100,865 $96,312 $85,698 $108,746 $1,267 $6,584
35 to 59 9 1.0 $114,801 $118,690 $87,552 $120,924 $122,658 $120,924 $102,459 $138,571 $0 $7,857
60 or More 15 1.0 $126,127 $125,000 $111,008 $149,105 $137,705 $141,128 $127,300 $152,750 $0 $11,578

Note: A minimum of four responses required to show data.
2014 DMO Compensation & Benefits Study 61 Destination & Travel Foundation
Director/Manager of Communications/Public Relations
Job Description: May have similar line responsibilities as VP, Communications. May act as film commissioner and/or publications manager. May manage other Communications/Publications staff.
Count
Average Number of FTEs
Reported
Fixed Salary for FY 2014 Total Compensation Variable
Mean Median 75% earn
more than 25% earn
more than Mean Median 75% earn
more than 25% earn
more than
Transaction-based Cash
Comp.
Performance-based Cash
Comp. All Respondents 137 1.2 $58,899 $56,000 $45,500 $70,000 $60,861 $58,000 $46,660 $72,420 $109 $1,852
ORGANIZATIONAL STRUCTURE
Private 92 1.2 $57,689 $55,707 $44,793 $69,350 $59,867 $58,220 $45,000 $70,922 $151 $2,026
Public 37 1.0 $62,516 $57,053 $48,285 $73,750 $63,956 $59,124 $48,285 $73,750 $0 $1,441
TYPE OF BUREAU
Membership Based 67 1.2 $60,144 $57,000 $46,818 $70,079 $62,651 $59,096 $46,968 $75,128 $200 $2,307
Non-Membership Based 68 1.2 $57,649 $53,616 $44,786 $69,411 $59,118 $54,060 $45,911 $70,922 $22 $1,447
TOTAL REVENUE
0 to $499,999 1
$500,000 to $999,999 9 1.1 $55,963 $52,020 $42,000 $60,000 $56,530 $53,000 $42,000 $60,000 $0 $567
$1,000,000 to $1,999,999 24 1.0 $49,403 $46,800 $42,390 $51,077 $49,453 $46,800 $42,390 $51,077 $0 $50
$2,000,000 to $3,999,999 32 1.0 $51,912 $48,714 $44,998 $56,250 $53,600 $49,810 $45,000 $57,423 $109 $1,578
$4,000,000 to $9,999,999 28 1.0 $61,499 $60,800 $52,649 $70,605 $63,939 $64,247 $55,979 $73,823 $0 $2,440
$10 Million or More 43 1.5 $68,835 $69,844 $56,138 $78,863 $72,093 $69,844 $60,044 $81,087 $266 $2,992
NUMBER OF EMPLOYEES
Less Than 5 6 1.0 $52,468 $49,250 $49,000 $50,857 $53,135 $50,405 $49,125 $52,577 $0 $667
5 to 9 22 1.1 $48,235 $42,625 $41,250 $50,294 $48,326 $43,000 $41,450 $50,294 $0 $91
10 to 19 32 1.0 $53,084 $47,950 $44,776 $59,564 $53,897 $49,115 $44,998 $59,564 $47 $766
20 to 34 26 1.0 $57,230 $56,825 $49,440 $65,175 $59,541 $58,548 $49,480 $69,780 $77 $2,234
35 to 59 30 1.5 $62,943 $63,686 $55,561 $74,479 $66,657 $65,407 $58,872 $78,663 $58 $3,657
60 or More 21 1.3 $77,059 $71,613 $63,788 $87,743 $80,162 $73,059 $63,788 $91,494 $462 $2,642

Note: A minimum of four responses required to show data.
2014 DMO Compensation & Benefits Study 62 Destination & Travel Foundation
Director/Manager, Publications
Job Description: Directs DMO’s publications program including advertising, production, editorial, etc. May manage support personnel.
Count
Average Number of FTEs
Reported
Fixed Salary for FY 2014 Total Compensation Variable
Mean Median 75% earn
more than 25% earn
more than Mean Median 75% earn
more than 25% earn
more than
Transaction-based Cash
Comp.
Performance-based Cash
Comp. All Respondents 33 1.1 $59,226 $54,549 $47,315 $62,742 $61,489 $57,600 $47,315 $67,820 $486 $1,777
ORGANIZATIONAL STRUCTURE
Private 22 1.1 $62,459 $57,190 $48,649 $68,444 $64,626 $59,955 $48,649 $72,573 $490 $1,676
Public 9 1.2 $54,518 $52,367 $48,000 $58,000 $57,294 $57,600 $51,352 $60,222 $582 $2,194
TYPE OF BUREAU
Membership Based 22 1.2 $61,907 $57,190 $47,486 $68,444 $64,285 $59,166 $49,124 $72,573 $238 $2,141
Non-Membership Based 11 1.0 $53,866 $52,650 $47,580 $55,699 $55,895 $52,650 $47,830 $60,371 $980 $1,048
TOTAL REVENUE
0 to $499,999 0
$500,000 to $999,999 0
$1,000,000 to $1,999,999 1
$2,000,000 to $3,999,999 6 1.0 $45,635 $45,512 $43,177 $47,829 $47,569 $46,512 $43,677 $52,741 $0 $1,933
$4,000,000 to $9,999,999 8 1.0 $49,691 $49,860 $45,130 $52,851 $51,414 $49,860 $45,380 $55,187 $1,348 $375
$10 Million or More 18 1.2 $68,760 $61,722 $56,703 $81,885 $71,469 $65,910 $58,028 $88,146 $291 $2,418
NUMBER OF EMPLOYEES
Less Than 5 0
5 to 9 2
10 to 19 4 1.0 $46,488 $47,658 $44,796 $49,350 $51,584 $52,458 $44,796 $59,246 $2,696 $2,400
20 to 34 9 1.0 $49,075 $47,069 $43,241 $52,668 $49,409 $47,069 $44,241 $52,668 $0 $333
35 to 59 9 1.1 $65,307 $61,644 $56,270 $69,659 $67,604 $67,820 $56,270 $72,643 $0 $2,297
60 or More 9 1.3 $72,213 $61,800 $58,110 $90,506 $75,334 $64,000 $60,222 $90,506 $582 $2,539

Note: A minimum of four responses required to show data.
2014 DMO Compensation & Benefits Study 63 Destination & Travel Foundation
Publications/Graphic Designer
Job Description: Develops and manages in-house publications, sales/marketing/promotional materials and graphic designs for DMO publications. Strong expertise in desktop publishing software.
Count
Average Number of FTEs
Reported
Fixed Salary for FY 2014 Total Compensation Variable
Mean Median 75% earn
more than 25% earn
more than Mean Median 75% earn
more than 25% earn
more than
Transaction-based Cash
Comp.
Performance-based Cash
Comp. All Respondents 72 1.0 $48,232 $46,377 $38,980 $57,570 $49,693 $46,821 $39,999 $59,394 $157 $1,303
ORGANIZATIONAL STRUCTURE
Private 51 1.1 $49,941 $47,500 $39,750 $59,030 $51,300 $48,000 $40,161 $61,673 $112 $1,248
Public 20 1.0 $43,838 $42,110 $34,856 $53,500 $45,334 $43,924 $34,856 $55,800 $230 $1,266
TYPE OF BUREAU
Membership Based 43 1.1 $51,475 $52,000 $40,686 $61,190 $53,038 $53,560 $41,440 $63,327 $239 $1,323
Non-Membership Based 29 1.0 $43,424 $40,047 $36,341 $48,000 $44,732 $41,600 $37,822 $48,000 $34 $1,274
TOTAL REVENUE
0 to $499,999 1
$500,000 to $999,999 3
$1,000,000 to $1,999,999 9 1.0 $41,351 $40,047 $37,822 $47,391 $41,488 $40,297 $37,822 $47,391 $0 $137
$2,000,000 to $3,999,999 18 0.9 $41,882 $40,000 $34,210 $42,592 $43,680 $40,698 $35,420 $44,782 $56 $1,742
$4,000,000 to $9,999,999 12 1.1 $53,732 $46,900 $41,396 $55,109 $55,028 $48,088 $41,877 $56,017 $0 $1,295
$10 Million or More 29 1.1 $55,322 $57,289 $47,189 $63,325 $57,215 $58,200 $50,715 $65,545 $355 $1,538
NUMBER OF EMPLOYEES
Less Than 5 2
5 to 9 6 0.9 $37,334 $40,824 $37,012 $42,536 $37,376 $40,949 $37,074 $42,536 $0 $42
10 to 19 14 0.9 $40,295 $39,750 $34,056 $46,456 $41,513 $40,698 $35,775 $46,456 $71 $1,147
20 to 34 15 1.0 $42,641 $40,000 $35,383 $44,750 $43,919 $40,000 $35,412 $47,651 $0 $1,277
35 to 59 15 1.2 $55,002 $48,300 $43,029 $61,390 $57,063 $50,715 $44,251 $63,123 $115 $1,945
60 or More 20 1.1 $58,198 $57,995 $52,883 $63,744 $60,055 $59,433 $54,645 $66,131 $428 $1,429
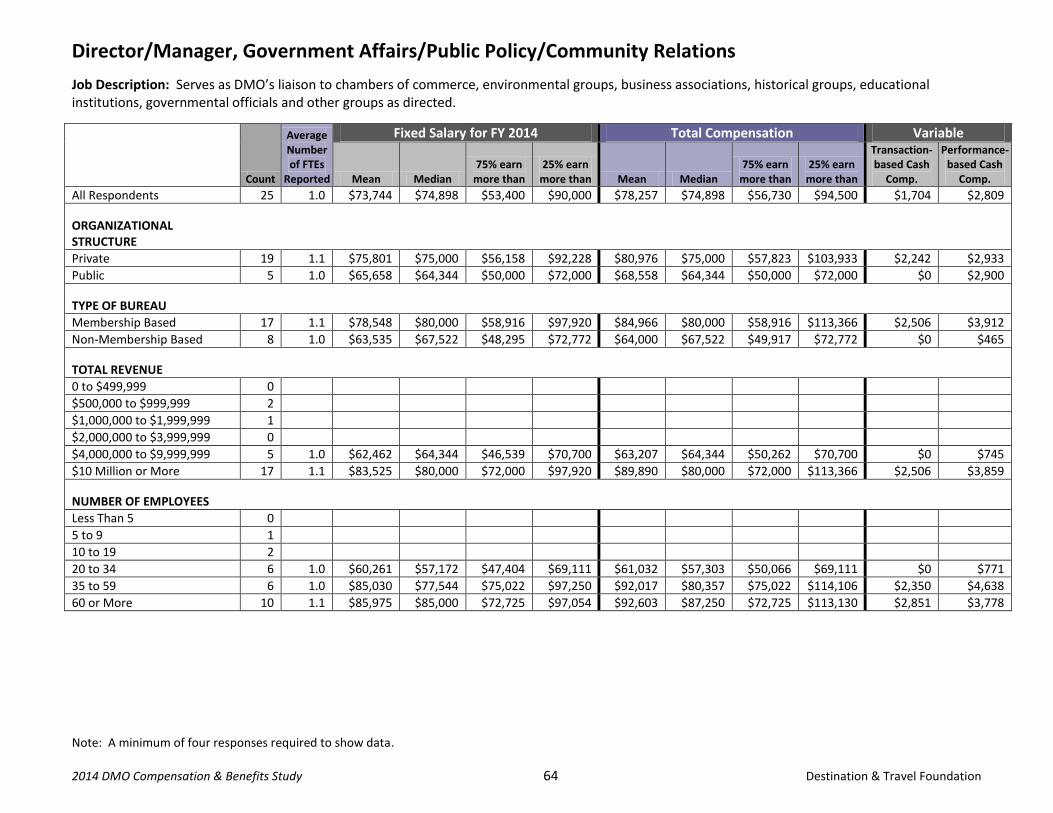
Note: A minimum of four responses required to show data.
2014 DMO Compensation & Benefits Study 64 Destination & Travel Foundation
Director/Manager, Government Affairs/Public Policy/Community Relations
Job Description: Serves as DMO’s liaison to chambers of commerce, environmental groups, business associations, historical groups, educational institutions, governmental officials and other groups as directed.
Count
Average Number of FTEs
Reported
Fixed Salary for FY 2014 Total Compensation Variable
Mean Median 75% earn
more than 25% earn
more than Mean Median 75% earn
more than 25% earn
more than
Transaction-based Cash
Comp.
Performance-based Cash
Comp. All Respondents 25 1.0 $73,744 $74,898 $53,400 $90,000 $78,257 $74,898 $56,730 $94,500 $1,704 $2,809
ORGANIZATIONAL STRUCTURE
Private 19 1.1 $75,801 $75,000 $56,158 $92,228 $80,976 $75,000 $57,823 $103,933 $2,242 $2,933
Public 5 1.0 $65,658 $64,344 $50,000 $72,000 $68,558 $64,344 $50,000 $72,000 $0 $2,900
TYPE OF BUREAU
Membership Based 17 1.1 $78,548 $80,000 $58,916 $97,920 $84,966 $80,000 $58,916 $113,366 $2,506 $3,912
Non-Membership Based 8 1.0 $63,535 $67,522 $48,295 $72,772 $64,000 $67,522 $49,917 $72,772 $0 $465
TOTAL REVENUE
0 to $499,999 0
$500,000 to $999,999 2
$1,000,000 to $1,999,999 1
$2,000,000 to $3,999,999 0
$4,000,000 to $9,999,999 5 1.0 $62,462 $64,344 $46,539 $70,700 $63,207 $64,344 $50,262 $70,700 $0 $745
$10 Million or More 17 1.1 $83,525 $80,000 $72,000 $97,920 $89,890 $80,000 $72,000 $113,366 $2,506 $3,859
NUMBER OF EMPLOYEES
Less Than 5 0
5 to 9 1
10 to 19 2
20 to 34 6 1.0 $60,261 $57,172 $47,404 $69,111 $61,032 $57,303 $50,066 $69,111 $0 $771
35 to 59 6 1.0 $85,030 $77,544 $75,022 $97,250 $92,017 $80,357 $75,022 $114,106 $2,350 $4,638
60 or More 10 1.1 $85,975 $85,000 $72,725 $97,054 $92,603 $87,250 $72,725 $113,130 $2,851 $3,778

Note: A minimum of four responses required to show data.
2014 DMO Compensation & Benefits Study 65 Destination & Travel Foundation
Film Commissioner
Job Description: Responsible for promoting destination as a location for shooting feature films, commercials, and other film/video projects.
Count
Average Number of FTEs
Reported
Fixed Salary for FY 2014 Total Compensation Variable
Mean Median 75% earn
more than 25% earn
more than Mean Median 75% earn
more than 25% earn
more than
Transaction-based Cash
Comp.
Performance-based Cash
Comp. All Respondents 11 1.0 $68,587 $61,200 $46,000 $84,920 $70,409 $61,200 $46,000 $86,113 $1,136 $685
ORGANIZATIONAL STRUCTURE
Private 5 1.0 $71,221 $70,179 $50,923 $79,567 $73,228 $75,329 $53,423 $81,954 $500 $1,507
Public 5 1.0 $61,617 $50,000 $40,764 $61,200 $63,617 $50,000 $40,764 $61,200 $2,000 $0
TYPE OF BUREAU
Membership Based 3
Non-Membership Based 8 1.0 $63,817 $55,600 $41,691 $75,202 $65,711 $55,600 $41,691 $79,065 $1,250 $644
TOTAL REVENUE
0 to $499,999 0
$500,000 to $999,999 0
$1,000,000 to $1,999,999 1
$2,000,000 to $3,999,999 2
$4,000,000 to $9,999,999 2
$10 Million or More 6 1.0 $81,942 $80,226 $55,045 $107,644 $84,467 $82,801 $56,332 $107,644 $1,667 $858
NUMBER OF EMPLOYEES
Less Than 5 0
5 to 9 1
10 to 19 1
20 to 34 2
35 to 59 5 1.0 $81,556 $79,567 $70,179 $90,272 $85,064 $81,954 $75,329 $90,272 $2,000 $1,507
60 or More 2

Note: A minimum of four responses required to show data.
2014 DMO Compensation & Benefits Study 66 Destination & Travel Foundation
Communications/PR Coordinator/Assistant
Job Description: Assists Communications and/or Publications managers with performing support duties such as writing, photo selection, etc.
Count
Average Number of FTEs
Reported
Fixed Salary for FY 2014 Total Compensation Variable
Mean Median 75% earn
more than 25% earn
more than Mean Median 75% earn
more than 25% earn
more than
Transaction-based Cash
Comp.
Performance-based Cash
Comp. All Respondents 102 1.2 $38,777 $37,125 $32,167 $43,510 $40,004 $38,425 $33,070 $44,050 $297 $931
ORGANIZATIONAL STRUCTURE
Private 62 1.3 $37,438 $36,061 $33,000 $40,000 $38,876 $37,325 $33,416 $41,800 $394 $1,044
Public 34 1.2 $40,919 $38,593 $32,001 $44,937 $41,930 $40,175 $33,003 $44,937 $171 $841
TYPE OF BUREAU
Membership Based 54 1.3 $38,335 $37,125 $33,687 $42,000 $39,725 $38,425 $34,036 $43,680 $171 $1,219
Non-Membership Based 46 1.2 $39,410 $37,300 $31,834 $43,843 $40,473 $38,267 $32,001 $44,592 $457 $606
TOTAL REVENUE
0 to $499,999 1
$500,000 to $999,999 8 1.0 $36,813 $33,292 $30,837 $39,250 $36,963 $33,642 $30,837 $39,250 $0 $150
$1,000,000 to $1,999,999 12 1.0 $33,106 $32,502 $28,769 $37,160 $33,485 $33,252 $30,418 $37,160 $0 $379
$2,000,000 to $3,999,999 17 1.0 $37,278 $35,535 $34,000 $43,800 $38,834 $37,400 $35,000 $44,518 $118 $1,438
$4,000,000 to $9,999,999 26 1.4 $40,925 $39,254 $32,992 $43,645 $41,874 $39,891 $33,145 $45,312 $0 $949
$10 Million or More 38 1.4 $41,202 $38,055 $35,409 $45,066 $42,447 $39,129 $36,078 $45,325 $191 $1,054
NUMBER OF EMPLOYEES
Less Than 5 5 1.0 $32,105 $36,213 $32,004 $37,000 $36,305 $36,213 $32,004 $37,000 $4,200 $0
5 to 9 8 1.0 $32,557 $32,058 $29,710 $33,750 $33,063 $32,058 $30,668 $34,875 $0 $506
10 to 19 19 1.1 $37,412 $39,076 $33,406 $43,400 $38,571 $40,000 $33,406 $44,321 $105 $1,054
20 to 34 27 1.2 $38,706 $36,071 $31,323 $42,930 $39,694 $37,400 $32,758 $44,214 $0 $988
35 to 59 24 1.5 $42,177 $38,178 $35,493 $45,646 $43,067 $39,666 $35,884 $46,966 $15 $876
60 or More 19 1.3 $40,322 $39,000 $34,000 $44,753 $41,905 $39,258 $35,334 $44,826 $363 $1,219

Note: A minimum of four responses required to show data.
2014 DMO Compensation & Benefits Study 67 Destination & Travel Foundation
VP, Membership
Job Description: Identifies new member benefits and services opportunities. May develop sales training programs. Can handle top member accounts. Direct reports may include Director/Manager, Membership.
Count
Average Number of FTEs
Reported
Fixed Salary for FY 2014 Total Compensation Variable
Mean Median 75% earn
more than 25% earn
more than Mean Median 75% earn
more than 25% earn
more than
Transaction-based Cash
Comp.
Performance-based Cash
Comp. All Respondents 20 1.0 $97,229 $97,372 $77,874 $114,927 $114,978 $111,275 $91,601 $131,676 $10,970 $6,778
ORGANIZATIONAL STRUCTURE
Private 20 1.0 $97,229 $97,372 $77,874 $114,927 $114,978 $111,275 $91,601 $131,676 $10,970 $6,778
Public 0
TYPE OF BUREAU
Membership Based 18 1.0 $100,104 $99,872 $86,400 $115,580 $119,824 $114,575 $94,532 $136,467 $12,189 $7,532
Non-Membership Based 2
TOTAL REVENUE
0 to $499,999 0
$500,000 to $999,999 2
$1,000,000 to $1,999,999 1
$2,000,000 to $3,999,999 2
$4,000,000 to $9,999,999 3
$10 Million or More 12 1.0 $110,776 $109,575 $99,936 $124,388 $138,359 $123,362 $114,588 $159,342 $18,158 $9,425
NUMBER OF EMPLOYEES
Less Than 5 0
5 to 9 0
10 to 19 3
20 to 34 1
35 to 59 6 1.0 $92,028 $92,588 $86,444 $98,558 $100,056 $94,688 $93,884 $109,663 $250 $7,778
60 or More 10 1.0 $112,502 $115,253 $100,565 $131,663 $142,832 $134,072 $114,700 $161,354 $21,790 $8,540

Note: A minimum of four responses required to show data.
2014 DMO Compensation & Benefits Study 68 Destination & Travel Foundation
Director, Membership
Job Description: May have similar line responsibilities as VP, Membership. Directs and manages membership programs. May manage other Membership staff.
Count
Average Number of FTEs
Reported
Fixed Salary for FY 2014 Total Compensation Variable
Mean Median 75% earn
more than 25% earn
more than Mean Median 75% earn
more than 25% earn
more than
Transaction-based Cash
Comp.
Performance-based Cash
Comp. All Respondents 45 1.0 $63,242 $61,840 $50,000 $71,000 $68,821 $70,090 $51,700 $78,028 $2,694 $2,885
ORGANIZATIONAL STRUCTURE
Private 37 1.0 $62,572 $61,200 $50,000 $71,000 $68,185 $68,337 $50,000 $78,028 $3,104 $2,509
Public 7 1.0 $65,766 $65,000 $59,037 $75,700 $71,773 $73,683 $59,500 $82,900 $915 $5,092
TYPE OF BUREAU
Membership Based 41 1.0 $62,933 $61,200 $50,000 $73,285 $68,655 $68,337 $50,000 $80,614 $2,756 $2,966
Non-Membership Based 3
TOTAL REVENUE
0 to $499,999 0
$500,000 to $999,999 7 1.0 $43,358 $42,250 $38,377 $47,500 $45,001 $46,050 $40,337 $49,390 $1,643 $0
$1,000,000 to $1,999,999 3
$2,000,000 to $3,999,999 12 1.0 $55,014 $55,037 $44,319 $62,413 $62,687 $66,526 $48,525 $72,458 $6,939 $735
$4,000,000 to $9,999,999 4 1.0 $67,350 $66,420 $61,020 $72,750 $70,413 $70,545 $67,208 $73,750 $2,063 $1,000
$10 Million or More 19 1.0 $76,444 $69,525 $64,287 $92,126 $83,429 $75,900 $69,769 $97,520 $907 $6,078
NUMBER OF EMPLOYEES
Less Than 5 0
5 to 9 6 1.0 $42,251 $41,665 $37,026 $44,313 $44,167 $45,525 $38,006 $48,098 $1,917 $0
10 to 19 11 1.0 $52,658 $50,000 $44,246 $58,725 $58,757 $51,700 $45,451 $71,761 $5,161 $938
20 to 34 6 1.0 $60,815 $60,056 $57,953 $64,138 $65,398 $63,276 $59,309 $69,875 $4,583 $0
35 to 59 12 1.0 $70,883 $70,000 $61,680 $78,390 $76,731 $73,550 $69,652 $83,685 $1,360 $4,488
60 or More 10 1.0 $79,767 $79,869 $64,180 $96,026 $87,246 $84,003 $72,627 $105,017 $916 $6,564

Note: A minimum of four responses required to show data.
2014 DMO Compensation & Benefits Study 69 Destination & Travel Foundation
Membership Sales Manager
Job Description: Sells DMO to potential members and develops/maintains relationships with current members.
Count
Average Number of FTEs
Reported
Fixed Salary for FY 2014 Total Compensation Variable
Mean Median 75% earn
more than 25% earn
more than Mean Median 75% earn
more than 25% earn
more than
Transaction-based Cash
Comp.
Performance-based Cash
Comp. All Respondents 54 1.2 $45,194 $45,250 $35,153 $54,191 $56,243 $51,910 $41,595 $63,788 $9,117 $1,932
ORGANIZATIONAL STRUCTURE
Private 47 1.3 $43,572 $43,875 $35,306 $53,027 $55,383 $51,820 $41,616 $60,076 $10,156 $1,655
Public 6 1.2 $61,431 $57,793 $47,170 $66,476 $68,355 $65,790 $47,570 $79,038 $2,500 $4,424
TYPE OF BUREAU
Membership Based 49 1.2 $44,685 $45,500 $35,612 $54,361 $56,482 $52,164 $44,000 $65,000 $9,894 $1,902
Non-Membership Based 4 1.5 $56,725 $45,500 $36,725 $65,500 $61,381 $45,500 $38,731 $68,150 $1,875 $2,781
TOTAL REVENUE
0 to $499,999 0
$500,000 to $999,999 2
$1,000,000 to $1,999,999 5 0.9 $38,858 $42,000 $33,650 $42,642 $41,658 $44,000 $39,650 $48,642 $2,000 $800
$2,000,000 to $3,999,999 10 1.1 $37,940 $37,438 $32,222 $42,500 $39,832 $38,463 $37,167 $45,000 $1,360 $532
$4,000,000 to $9,999,999 8 1.0 $47,634 $46,986 $40,250 $55,316 $55,143 $53,550 $45,650 $65,000 $5,256 $2,253
$10 Million or More 29 1.3 $47,576 $49,680 $39,770 $55,555 $64,771 $57,365 $47,385 $69,065 $14,713 $2,483
NUMBER OF EMPLOYEES
Less Than 5 1
5 to 9 2
10 to 19 11 1.1 $39,278 $35,875 $32,639 $47,000 $41,443 $39,000 $37,333 $47,000 $1,227 $938
20 to 34 7 1.0 $48,015 $43,000 $41,500 $56,952 $52,918 $46,200 $45,050 $60,140 $2,592 $2,311
35 to 59 17 1.5 $45,714 $47,550 $35,612 $53,050 $57,999 $55,000 $44,001 $60,151 $9,764 $2,522
60 or More 16 1.3 $49,158 $53,250 $42,849 $62,108 $69,263 $62,420 $50,969 $70,874 $18,169 $1,936
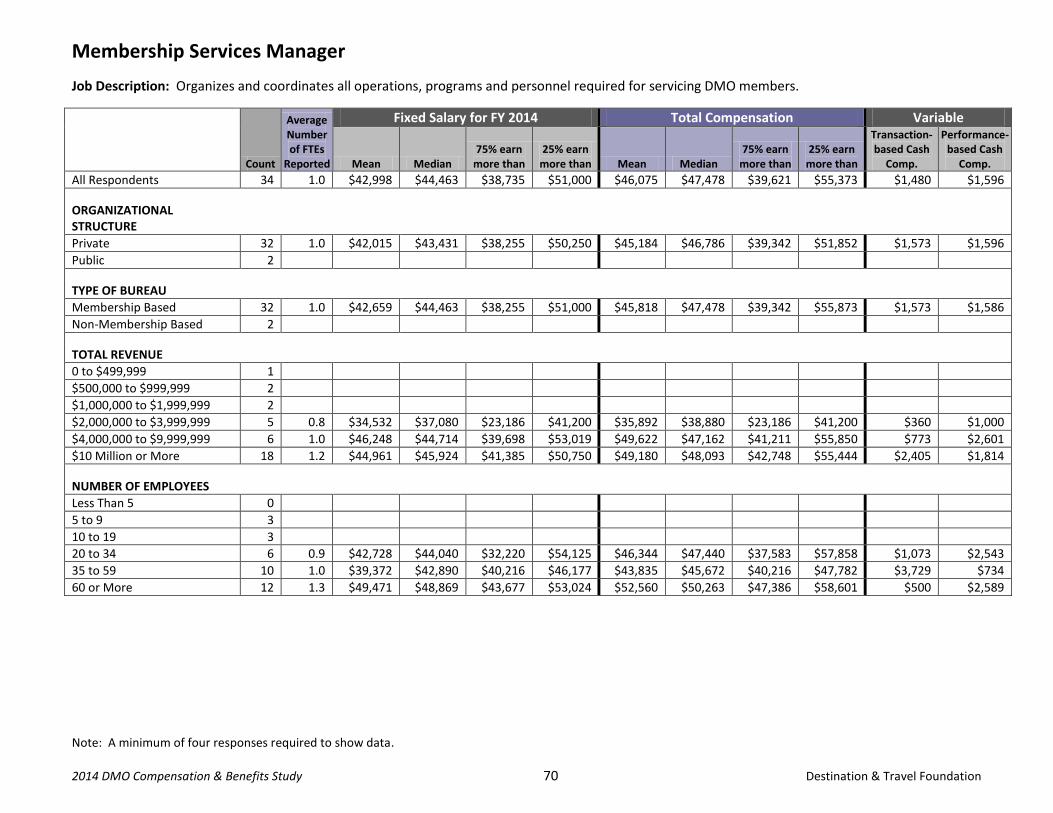
Note: A minimum of four responses required to show data.
2014 DMO Compensation & Benefits Study 70 Destination & Travel Foundation
Membership Services Manager
Job Description: Organizes and coordinates all operations, programs and personnel required for servicing DMO members.
Count
Average Number of FTEs
Reported
Fixed Salary for FY 2014 Total Compensation Variable
Mean Median 75% earn
more than 25% earn
more than Mean Median 75% earn
more than 25% earn
more than
Transaction-based Cash
Comp.
Performance-based Cash
Comp. All Respondents 34 1.0 $42,998 $44,463 $38,735 $51,000 $46,075 $47,478 $39,621 $55,373 $1,480 $1,596
ORGANIZATIONAL STRUCTURE
Private 32 1.0 $42,015 $43,431 $38,255 $50,250 $45,184 $46,786 $39,342 $51,852 $1,573 $1,596
Public 2
TYPE OF BUREAU
Membership Based 32 1.0 $42,659 $44,463 $38,255 $51,000 $45,818 $47,478 $39,342 $55,873 $1,573 $1,586
Non-Membership Based 2
TOTAL REVENUE
0 to $499,999 1
$500,000 to $999,999 2
$1,000,000 to $1,999,999 2
$2,000,000 to $3,999,999 5 0.8 $34,532 $37,080 $23,186 $41,200 $35,892 $38,880 $23,186 $41,200 $360 $1,000
$4,000,000 to $9,999,999 6 1.0 $46,248 $44,714 $39,698 $53,019 $49,622 $47,162 $41,211 $55,850 $773 $2,601
$10 Million or More 18 1.2 $44,961 $45,924 $41,385 $50,750 $49,180 $48,093 $42,748 $55,444 $2,405 $1,814
NUMBER OF EMPLOYEES
Less Than 5 0
5 to 9 3
10 to 19 3
20 to 34 6 0.9 $42,728 $44,040 $32,220 $54,125 $46,344 $47,440 $37,583 $57,858 $1,073 $2,543
35 to 59 10 1.0 $39,372 $42,890 $40,216 $46,177 $43,835 $45,672 $40,216 $47,782 $3,729 $734
60 or More 12 1.3 $49,471 $48,869 $43,677 $53,024 $52,560 $50,263 $47,386 $58,601 $500 $2,589

Note: A minimum of four responses required to show data.
2014 DMO Compensation & Benefits Study 71 Destination & Travel Foundation
Membership Coordinator
Job Description: Updates membership records for the DMO’s database. Handles subscription and/or membership orders.
Count
Average Number of FTEs
Reported
Fixed Salary for FY 2014 Total Compensation Variable
Mean Median 75% earn
more than 25% earn
more than Mean Median 75% earn
more than 25% earn
more than
Transaction-based Cash
Comp.
Performance-based Cash
Comp. All Respondents 47 1.1 $37,292 $38,004 $31,855 $42,000 $38,256 $39,000 $33,016 $43,146 $122 $842
ORGANIZATIONAL STRUCTURE
Private 36 1.0 $35,845 $36,521 $30,900 $39,403 $36,552 $37,104 $32,220 $40,492 $51 $655
Public 10 1.1 $41,998 $43,500 $39,718 $46,207 $43,912 $44,901 $42,000 $48,308 $390 $1,525
TYPE OF BUREAU
Membership Based 41 1.1 $37,450 $38,004 $32,960 $41,630 $38,507 $39,000 $33,322 $42,000 $140 $917
Non-Membership Based 5 1.0 $34,991 $29,993 $28,000 $45,000 $35,241 $29,993 $28,500 $45,000 $0 $250
TOTAL REVENUE
0 to $499,999 0
$500,000 to $999,999 3
$1,000,000 to $1,999,999 3
$2,000,000 to $3,999,999 7 1.0 $37,522 $36,050 $31,480 $43,670 $38,411 $37,550 $31,480 $44,033 $0 $889
$4,000,000 to $9,999,999 9 1.0 $31,715 $30,000 $28,000 $33,756 $32,387 $31,100 $28,500 $35,956 $0 $672
$10 Million or More 25 1.1 $39,649 $38,542 $36,991 $42,000 $40,954 $40,194 $37,065 $44,050 $230 $1,075
NUMBER OF EMPLOYEES
Less Than 5 1
5 to 9 1
10 to 19 9 1.0 $37,596 $36,050 $30,000 $45,000 $38,288 $37,550 $30,000 $45,000 $0 $692
20 to 34 7 0.9 $29,210 $29,952 $24,947 $31,878 $29,989 $29,952 $25,822 $33,528 $0 $779
35 to 59 15 1.0 $36,740 $38,000 $33,293 $39,597 $37,614 $39,000 $34,368 $40,728 $17 $857
60 or More 14 1.2 $40,707 $39,048 $36,625 $44,740 $42,174 $40,450 $37,493 $46,300 $393 $1,074

Note: A minimum of four responses required to show data.
2014 DMO Compensation & Benefits Study 72 Destination & Travel Foundation
Director/Manager, Partnerships/Sponsorships
Job Description: Manage member, partner and sponsor relationships. Fulfill and service all contract obligations and assists in retention and recruitment. Works closely with marketing.
Count
Average Number of FTEs
Reported
Fixed Salary for FY 2014 Total Compensation Variable
Mean Median 75% earn
more than 25% earn
more than Mean Median 75% earn
more than 25% earn
more than
Transaction-based Cash
Comp.
Performance-based Cash
Comp. All Respondents 29 1.0 $62,335 $60,000 $53,118 $68,000 $71,080 $63,000 $59,327 $86,300 $5,064 $3,680
ORGANIZATIONAL STRUCTURE
Private 24 1.0 $65,017 $61,048 $54,530 $75,252 $71,641 $63,515 $60,331 $86,318 $2,786 $3,839
Public 5 1.0 $49,464 $55,589 $44,404 $57,327 $68,384 $59,327 $58,589 $69,600 $16,000 $2,920
TYPE OF BUREAU
Membership Based 21 1.0 $64,849 $60,651 $55,000 $74,162 $75,619 $65,000 $59,824 $96,000 $6,993 $3,777
Non-Membership Based 8 1.0 $55,737 $58,113 $43,303 $62,559 $59,163 $60,985 $43,303 $67,140 $0 $3,426
TOTAL REVENUE
0 to $499,999 0
$500,000 to $999,999 2
$1,000,000 to $1,999,999 3
$2,000,000 to $3,999,999 3
$4,000,000 to $9,999,999 8 1.0 $67,463 $64,373 $60,488 $75,252 $71,714 $70,381 $60,722 $81,245 $0 $4,251
$10 Million or More 13 1.0 $68,728 $61,350 $55,000 $80,000 $83,418 $67,485 $60,500 $100,115 $10,266 $4,424
NUMBER OF EMPLOYEES
Less Than 5 0
5 to 9 2
10 to 19 3
20 to 34 7 1.0 $51,500 $44,404 $41,000 $59,036 $54,736 $50,306 $43,202 $60,036 $1,829 $1,407
35 to 59 9 1.0 $66,988 $65,000 $60,000 $80,000 $75,678 $77,762 $60,651 $96,000 $3,611 $5,079
60 or More 8 1.0 $69,910 $59,595 $55,442 $68,750 $85,580 $66,243 $60,551 $108,500 $12,619 $3,051

Note: A minimum of four responses required to show data.
2014 DMO Compensation & Benefits Study 73 Destination & Travel Foundation
VP/Director of Finance/Administration
Job Description: Manages DMO operations and administration as well as administrative supervisory personnel. May also manage human resources. May serve as chief financial officer and direct financial affairs of organization.
Count
Average Number of FTEs
Reported
Fixed Salary for FY 2014 Total Compensation Variable
Mean Median 75% earn
more than 25% earn
more than Mean Median 75% earn
more than 25% earn
more than
Transaction-based Cash
Comp.
Performance-based Cash
Comp. All Respondents 87 1.0 $115,419 $109,500 $86,600 $135,398 $124,897 $114,710 $88,975 $151,290 $529 $8,948
ORGANIZATIONAL STRUCTURE
Private 61 1.0 $119,687 $112,603 $88,142 $139,307 $130,243 $118,800 $91,789 $158,321 $376 $10,180
Public 23 1.0 $109,104 $103,020 $79,905 $127,968 $116,258 $103,020 $79,905 $138,756 $1,005 $6,149
TYPE OF BUREAU
Membership Based 52 1.0 $128,846 $122,425 $98,518 $156,000 $140,440 $133,486 $104,318 $177,350 $886 $10,708
Non-Membership Based 34 1.0 $96,890 $91,968 $71,056 $114,330 $103,238 $94,850 $79,073 $117,625 $0 $6,348
TOTAL REVENUE
0 to $499,999 1
$500,000 to $999,999 2
$1,000,000 to $1,999,999 7 1.0 $61,765 $62,985 $52,726 $71,250 $63,050 $63,452 $54,200 $71,250 $0 $1,286
$2,000,000 to $3,999,999 12 1.0 $80,319 $77,168 $68,303 $91,826 $85,349 $84,484 $77,041 $91,826 $500 $4,531
$4,000,000 to $9,999,999 27 1.0 $105,055 $101,000 $88,475 $110,555 $114,087 $107,787 $93,350 $121,225 $0 $9,032
$10 Million or More 38 1.0 $146,602 $136,703 $124,850 $175,721 $159,905 $156,814 $131,245 $188,843 $1,054 $12,248
NUMBER OF EMPLOYEES
Less Than 5 0
5 to 9 6 1.0 $58,350 $53,851 $45,563 $62,352 $60,817 $58,018 $47,324 $63,335 $0 $2,467
10 to 19 12 1.0 $74,447 $73,685 $63,350 $84,447 $78,173 $80,049 $64,650 $87,402 $0 $3,725
20 to 34 22 1.0 $95,009 $93,553 $86,942 $106,755 $100,879 $96,212 $90,106 $108,558 $273 $5,597
35 to 59 26 1.0 $123,881 $125,000 $103,125 $137,187 $135,248 $133,908 $112,075 $151,499 $52 $11,314
60 or More 21 1.0 $166,043 $159,105 $135,000 $200,000 $182,250 $182,906 $150,581 $213,952 $1,843 $14,364

Note: A minimum of four responses required to show data.
2014 DMO Compensation & Benefits Study 74 Destination & Travel Foundation
Director/Manager of Accounting/Finance
Job Description: Directs financial management procedures, prepares financial statements/reports and manages accounting personnel.
Count
Average Number of FTEs
Reported
Fixed Salary for FY 2014 Total Compensation Variable
Mean Median 75% earn
more than 25% earn
more than Mean Median 75% earn
more than 25% earn
more than
Transaction-based Cash
Comp.
Performance-based Cash
Comp. All Respondents 97 1.1 $68,535 $64,000 $51,862 $78,572 $70,789 $65,000 $52,509 $79,646 $111 $2,143
ORGANIZATIONAL STRUCTURE
Private 62 1.1 $68,235 $64,500 $52,373 $76,680 $70,695 $65,260 $53,123 $78,981 $64 $2,396
Public 30 1.0 $71,635 $65,449 $54,468 $89,175 $73,810 $67,799 $54,468 $90,482 $227 $1,948
TYPE OF BUREAU
Membership Based 52 1.1 $76,362 $68,107 $60,000 $86,223 $79,780 $71,815 $60,897 $87,887 $208 $3,210
Non-Membership Based 44 1.1 $59,780 $58,106 $48,314 $69,636 $60,690 $60,483 $48,501 $69,636 $0 $910
TOTAL REVENUE
0 to $499,999 1
$500,000 to $999,999 2
$1,000,000 to $1,999,999 15 1.0 $47,300 $48,318 $41,050 $52,879 $47,554 $48,568 $41,725 $53,892 $40 $213
$2,000,000 to $3,999,999 19 1.0 $62,636 $65,000 $53,369 $69,486 $63,437 $66,000 $56,051 $69,658 $0 $801
$4,000,000 to $9,999,999 16 1.1 $62,624 $60,699 $53,981 $70,650 $64,043 $61,749 $56,023 $71,963 $0 $1,419
$10 Million or More 44 1.1 $81,981 $76,453 $62,348 $92,687 $85,956 $79,286 $63,545 $96,420 $232 $3,744
NUMBER OF EMPLOYEES
Less Than 5 0
5 to 9 13 1.0 $46,490 $48,318 $37,000 $54,075 $47,281 $48,568 $37,000 $55,275 $46 $745
10 to 19 21 1.0 $60,349 $61,499 $50,500 $69,557 $60,951 $63,977 $50,500 $69,700 $0 $602
20 to 34 18 1.0 $62,640 $60,160 $51,922 $71,804 $63,476 $61,160 $52,291 $71,804 $0 $836
35 to 59 20 1.2 $70,789 $62,883 $57,747 $68,500 $73,003 $63,803 $60,314 $73,298 $23 $2,190
60 or More 25 1.1 $89,316 $87,134 $76,000 $96,000 $94,772 $90,225 $78,572 $109,440 $390 $5,067
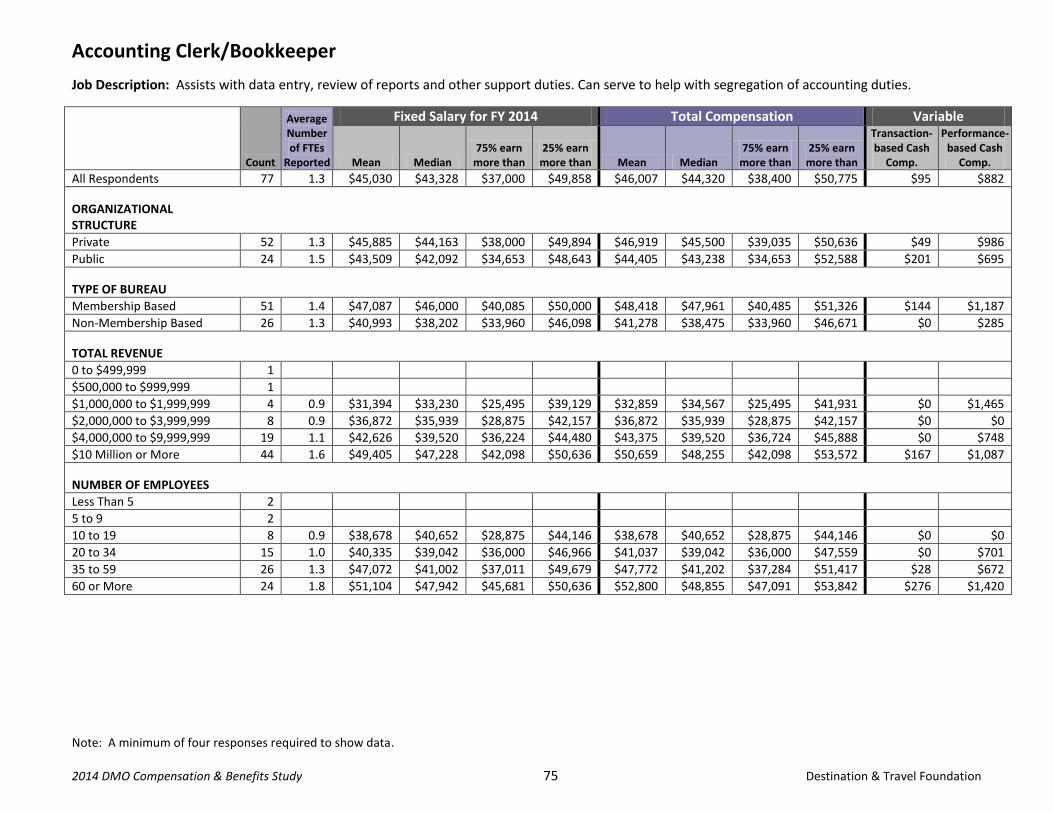
Note: A minimum of four responses required to show data.
2014 DMO Compensation & Benefits Study 75 Destination & Travel Foundation
Accounting Clerk/Bookkeeper
Job Description: Assists with data entry, review of reports and other support duties. Can serve to help with segregation of accounting duties.
Count
Average Number of FTEs
Reported
Fixed Salary for FY 2014 Total Compensation Variable
Mean Median 75% earn
more than 25% earn
more than Mean Median 75% earn
more than 25% earn
more than
Transaction-based Cash
Comp.
Performance-based Cash
Comp. All Respondents 77 1.3 $45,030 $43,328 $37,000 $49,858 $46,007 $44,320 $38,400 $50,775 $95 $882
ORGANIZATIONAL STRUCTURE
Private 52 1.3 $45,885 $44,163 $38,000 $49,894 $46,919 $45,500 $39,035 $50,636 $49 $986
Public 24 1.5 $43,509 $42,092 $34,653 $48,643 $44,405 $43,238 $34,653 $52,588 $201 $695
TYPE OF BUREAU
Membership Based 51 1.4 $47,087 $46,000 $40,085 $50,000 $48,418 $47,961 $40,485 $51,326 $144 $1,187
Non-Membership Based 26 1.3 $40,993 $38,202 $33,960 $46,098 $41,278 $38,475 $33,960 $46,671 $0 $285
TOTAL REVENUE
0 to $499,999 1
$500,000 to $999,999 1
$1,000,000 to $1,999,999 4 0.9 $31,394 $33,230 $25,495 $39,129 $32,859 $34,567 $25,495 $41,931 $0 $1,465
$2,000,000 to $3,999,999 8 0.9 $36,872 $35,939 $28,875 $42,157 $36,872 $35,939 $28,875 $42,157 $0 $0
$4,000,000 to $9,999,999 19 1.1 $42,626 $39,520 $36,224 $44,480 $43,375 $39,520 $36,724 $45,888 $0 $748
$10 Million or More 44 1.6 $49,405 $47,228 $42,098 $50,636 $50,659 $48,255 $42,098 $53,572 $167 $1,087
NUMBER OF EMPLOYEES
Less Than 5 2
5 to 9 2
10 to 19 8 0.9 $38,678 $40,652 $28,875 $44,146 $38,678 $40,652 $28,875 $44,146 $0 $0
20 to 34 15 1.0 $40,335 $39,042 $36,000 $46,966 $41,037 $39,042 $36,000 $47,559 $0 $701
35 to 59 26 1.3 $47,072 $41,002 $37,011 $49,679 $47,772 $41,202 $37,284 $51,417 $28 $672
60 or More 24 1.8 $51,104 $47,942 $45,681 $50,636 $52,800 $48,855 $47,091 $53,842 $276 $1,420

Note: A minimum of four responses required to show data.
2014 DMO Compensation & Benefits Study 76 Destination & Travel Foundation
Director/Manager of Human Resources
Job Description: Directs staff recruitment, training, development, compensation and benefit planning and all compliance programs. Maintains personnel records and human resource information systems.
Count
Average Number of FTEs
Reported
Fixed Salary for FY 2014 Total Compensation Variable
Mean Median 75% earn
more than 25% earn
more than Mean Median 75% earn
more than 25% earn
more than
Transaction-based Cash
Comp.
Performance-based Cash
Comp. All Respondents 52 1.0 $69,232 $66,724 $53,385 $81,762 $73,559 $70,710 $53,385 $87,964 $149 $4,178
ORGANIZATIONAL STRUCTURE
Private 42 1.0 $70,905 $67,884 $57,153 $84,100 $75,291 $71,632 $60,197 $87,999 $184 $4,201
Public 9 1.0 $64,656 $60,000 $51,597 $75,643 $68,162 $62,000 $51,597 $79,643 $0 $3,505
TYPE OF BUREAU
Membership Based 37 1.0 $72,182 $71,600 $61,000 $85,000 $76,636 $72,593 $62,000 $88,284 $209 $4,245
Non-Membership Based 15 1.0 $61,957 $53,040 $45,616 $68,322 $65,969 $53,040 $48,330 $70,322 $0 $4,012
TOTAL REVENUE
0 to $499,999 0
$500,000 to $999,999 3
$1,000,000 to $1,999,999 1
$2,000,000 to $3,999,999 5 1.0 $49,470 $44,800 $40,150 $56,000 $51,425 $49,400 $45,325 $56,000 $0 $1,955
$4,000,000 to $9,999,999 8 1.0 $74,057 $64,910 $59,260 $74,945 $80,911 $66,996 $61,750 $77,695 $0 $6,854
$10 Million or More 35 1.1 $73,409 $72,827 $60,617 $85,319 $77,976 $76,468 $61,011 $89,269 $221 $4,346
NUMBER OF EMPLOYEES
Less Than 5 0
5 to 9 1
10 to 19 4 0.9 $41,927 $42,475 $38,712 $45,690 $44,371 $46,843 $42,593 $48,620 $0 $2,444
20 to 34 10 0.9 $57,435 $58,521 $45,500 $68,945 $59,933 $61,500 $50,225 $70,043 $0 $2,498
35 to 59 15 1.0 $71,694 $61,965 $53,744 $81,128 $77,607 $65,965 $55,000 $87,982 $0 $5,913
60 or More 22 1.1 $78,596 $76,380 $66,612 $87,110 $83,212 $78,380 $71,616 $96,426 $352 $4,264

Note: A minimum of four responses required to show data.
2014 DMO Compensation & Benefits Study 77 Destination & Travel Foundation
Office Manager
Job Description: Oversees general operations of the office on a day-to day basis; may oversee secretarial, printing and mailroom staff.
Count
Average Number of FTEs
Reported
Fixed Salary for FY 2014 Total Compensation Variable
Mean Median 75% earn
more than 25% earn
more than Mean Median 75% earn
more than 25% earn
more than
Transaction-based Cash
Comp.
Performance-based Cash
Comp. All Respondents 74 1.0 $46,862 $43,786 $37,580 $55,767 $47,979 $45,050 $38,009 $57,422 $39 $1,078
ORGANIZATIONAL STRUCTURE
Private 53 1.0 $46,959 $43,571 $38,000 $56,000 $48,461 $45,100 $40,000 $57,495 $54 $1,448
Public 20 1.0 $47,199 $45,675 $37,612 $55,885 $47,349 $45,675 $37,612 $55,885 $0 $150
TYPE OF BUREAU
Membership Based 34 1.0 $49,575 $45,768 $40,025 $58,416 $50,794 $47,837 $41,185 $58,970 $15 $1,204
Non-Membership Based 37 1.0 $45,331 $42,750 $37,440 $54,508 $46,255 $43,056 $38,000 $55,068 $64 $860
TOTAL REVENUE
0 to $499,999 7 0.9 $31,815 $35,513 $22,000 $39,526 $32,617 $35,513 $22,000 $42,334 $267 $535
$500,000 to $999,999 12 1.0 $37,760 $38,363 $34,035 $40,375 $38,718 $40,113 $34,035 $43,143 $42 $917
$1,000,000 to $1,999,999 20 1.0 $45,573 $43,188 $37,338 $53,216 $45,711 $43,188 $37,338 $53,216 $0 $138
$2,000,000 to $3,999,999 13 1.0 $50,022 $50,960 $41,000 $58,066 $51,029 $50,960 $42,895 $58,066 $38 $969
$4,000,000 to $9,999,999 6 1.0 $51,716 $56,282 $43,542 $59,397 $55,926 $56,282 $44,442 $64,272 $0 $4,210
$10 Million or More 16 1.0 $57,497 $55,562 $46,054 $65,449 $59,021 $56,458 $47,174 $68,596 $0 $1,524
NUMBER OF EMPLOYEES
Less Than 5 11 1.0 $33,487 $35,513 $25,720 $38,019 $34,123 $35,513 $25,720 $39,131 $45 $591
5 to 9 20 1.0 $42,484 $40,000 $34,875 $49,367 $42,971 $40,500 $35,285 $49,367 $0 $488
10 to 19 21 1.0 $48,273 $45,000 $41,046 $56,000 $49,439 $47,300 $41,375 $56,000 $113 $1,053
20 to 34 4 1.0 $54,091 $53,534 $49,250 $58,375 $56,416 $56,134 $52,576 $59,974 $0 $2,325
35 to 59 8 1.0 $50,081 $47,981 $43,798 $59,394 $51,329 $48,530 $44,988 $60,539 $0 $1,248
60 or More 10 1.0 $61,903 $59,222 $47,949 $74,281 $64,113 $63,722 $49,603 $77,719 $0 $2,210

Note: A minimum of four responses required to show data.
2014 DMO Compensation & Benefits Study 78 Destination & Travel Foundation
Supervisor, Printing/Mailing/Copying
Job Description: Supervises and performs general mailing/shipping, in-house printing/copying functions for organization.
Count
Average Number of FTEs
Reported
Fixed Salary for FY 2014 Total Compensation Variable
Mean Median 75% earn
more than 25% earn
more than Mean Median 75% earn
more than 25% earn
more than
Transaction-based Cash
Comp.
Performance-based Cash
Comp. All Respondents 24 1.0 $39,638 $39,127 $31,915 $45,450 $41,022 $39,448 $33,971 $47,665 $75 $1,309
ORGANIZATIONAL STRUCTURE
Private 20 1.0 $37,420 $37,665 $30,925 $43,714 $38,640 $38,487 $31,390 $44,364 $90 $1,131
Public 3
TYPE OF BUREAU
Membership Based 20 1.0 $38,059 $38,805 $30,925 $44,815 $39,184 $39,320 $31,390 $47,665 $90 $1,036
Non-Membership Based 4 1.0 $47,536 $43,259 $37,687 $53,108 $50,212 $43,259 $39,062 $54,408 $0 $2,676
TOTAL REVENUE
0 to $499,999 0
$500,000 to $999,999 0
$1,000,000 to $1,999,999 0
$2,000,000 to $3,999,999 0
$4,000,000 to $9,999,999 5 1.0 $27,048 $27,600 $24,960 $30,700 $28,434 $28,428 $24,960 $30,700 $0 $1,386
$10 Million or More 19 1.0 $42,951 $39,509 $37,665 $46,904 $44,335 $41,699 $38,016 $48,600 $95 $1,289
NUMBER OF EMPLOYEES
Less Than 5 0
5 to 9 0
10 to 19 0
20 to 34 0
35 to 59 9 1.0 $33,276 $32,220 $27,600 $39,387 $34,519 $34,755 $28,428 $39,387 $0 $1,243
60 or More 15 1.0 $43,455 $39,509 $37,665 $48,850 $44,924 $41,699 $38,016 $49,750 $120 $1,349

Note: A minimum of four responses required to show data.
2014 DMO Compensation & Benefits Study 79 Destination & Travel Foundation
Executive Assistant
Job Description: Provides principal administrative support to chief executive or other top management personnel. Can serve as liaison with voluntary leadership. Performs clerical duties or other administrative tasks. May manage other support personnel.
Count
Average Number of FTEs
Reported
Fixed Salary for FY 2014 Total Compensation Variable
Mean Median 75% earn
more than 25% earn
more than Mean Median 75% earn
more than 25% earn
more than
Transaction-based Cash
Comp.
Performance-based Cash
Comp. All Respondents 105 1.2 $48,964 $47,133 $39,608 $55,973 $50,337 $48,000 $41,220 $58,538 $50 $1,324
ORGANIZATIONAL STRUCTURE
Private 73 1.2 $49,760 $49,922 $40,377 $58,538 $51,226 $50,600 $41,300 $60,000 $72 $1,395
Public 27 1.3 $47,674 $46,400 $38,783 $52,909 $48,988 $47,133 $41,610 $57,750 $0 $1,313
TYPE OF BUREAU
Membership Based 56 1.2 $52,919 $53,040 $44,716 $59,963 $54,767 $54,350 $46,799 $61,970 $94 $1,755
Non-Membership Based 49 1.2 $44,444 $43,454 $36,000 $50,000 $45,274 $44,600 $37,128 $51,000 $0 $831
TOTAL REVENUE
0 to $499,999 2
$500,000 to $999,999 6 1.2 $45,264 $40,500 $34,875 $48,750 $45,814 $41,400 $35,325 $48,750 $0 $550
$1,000,000 to $1,999,999 7 1.0 $36,709 $34,800 $32,481 $40,000 $36,709 $34,800 $32,481 $40,000 $0 $0
$2,000,000 to $3,999,999 19 1.0 $39,325 $39,608 $34,864 $42,392 $40,764 $40,570 $35,500 $44,980 $111 $1,329
$4,000,000 to $9,999,999 25 1.2 $49,526 $47,000 $43,454 $52,818 $50,875 $47,133 $45,530 $54,422 $0 $1,349
$10 Million or More 46 1.4 $55,891 $55,062 $51,750 $60,253 $57,627 $57,336 $51,750 $62,247 $68 $1,667
NUMBER OF EMPLOYEES
Less Than 5 2
5 to 9 6 1.0 $36,393 $33,841 $33,158 $39,767 $36,726 $33,841 $33,158 $41,267 $0 $333
10 to 19 20 1.0 $43,453 $39,993 $34,950 $46,526 $44,192 $41,189 $35,750 $46,526 $0 $739
20 to 34 22 1.0 $44,488 $43,359 $39,683 $47,783 $45,819 $46,014 $40,753 $47,954 $95 $1,235
35 to 59 30 1.2 $50,627 $52,665 $45,429 $55,423 $51,920 $52,925 $47,109 $57,412 $21 $1,272
60 or More 25 1.6 $59,881 $58,550 $53,000 $65,520 $62,184 $60,851 $53,700 $65,600 $101 $2,202

Note: A minimum of four responses required to show data.
2014 DMO Compensation & Benefits Study 80 Destination & Travel Foundation
Administrative Assistant/Secretary
Job Description: Provides principal secretarial/administrative support to department heads or managers. May provide clerical support to other personnel.
Count
Average Number of FTEs
Reported
Fixed Salary for FY 2014 Total Compensation Variable
Mean Median 75% earn
more than 25% earn
more than Mean Median 75% earn
more than 25% earn
more than
Transaction-based Cash
Comp.
Performance-based Cash
Comp. All Respondents 86 2.2 $36,479 $35,000 $30,408 $40,089 $37,323 $35,643 $32,018 $41,150 $31 $813
ORGANIZATIONAL STRUCTURE
Private 61 2.2 $37,294 $35,000 $31,000 $40,877 $38,151 $35,456 $32,100 $41,000 $44 $813
Public 21 2.0 $34,544 $35,000 $30,000 $37,760 $35,409 $35,734 $30,000 $39,319 $0 $865
TYPE OF BUREAU
Membership Based 49 2.6 $37,699 $36,000 $32,876 $40,877 $38,893 $37,000 $33,014 $42,100 $20 $1,173
Non-Membership Based 37 1.7 $34,862 $33,000 $29,644 $38,188 $35,244 $33,000 $29,644 $38,188 $45 $336
TOTAL REVENUE
0 to $499,999 4 1.0 $31,176 $32,500 $27,500 $36,176 $31,176 $32,500 $27,500 $36,176 $0 $0
$500,000 to $999,999 6 1.0 $25,610 $25,456 $19,825 $31,528 $25,877 $25,756 $20,575 $31,678 $0 $267
$1,000,000 to $1,999,999 8 1.1 $30,812 $31,432 $27,500 $33,946 $30,937 $31,932 $27,500 $33,946 $0 $125
$2,000,000 to $3,999,999 16 1.3 $33,313 $33,300 $30,198 $35,250 $34,033 $33,300 $30,198 $38,047 $63 $658
$4,000,000 to $9,999,999 21 1.9 $40,498 $35,734 $33,014 $41,600 $41,522 $35,734 $33,014 $45,360 $80 $944
$10 Million or More 31 3.4 $39,640 $37,760 $33,725 $42,794 $40,832 $39,319 $35,578 $44,648 $0 $1,192
NUMBER OF EMPLOYEES
Less Than 5 6 1.0 $27,777 $29,000 $22,600 $32,148 $27,777 $29,000 $22,600 $32,148 $0 $0
5 to 9 6 1.0 $29,565 $33,500 $20,188 $37,391 $29,565 $33,500 $20,188 $37,391 $0 $0
10 to 19 16 1.2 $31,441 $32,288 $28,995 $34,706 $32,224 $32,550 $28,995 $34,956 $0 $783
20 to 34 21 1.4 $38,723 $35,734 $31,000 $41,302 $39,581 $35,734 $32,250 $41,400 $128 $730
35 to 59 18 2.8 $39,083 $36,281 $33,222 $43,112 $40,139 $36,827 $33,308 $45,298 $0 $1,057
60 or More 19 4.0 $40,705 $37,760 $35,873 $44,136 $41,917 $39,319 $36,215 $44,716 $0 $1,213

Note: A minimum of four responses required to show data.
2014 DMO Compensation & Benefits Study 81 Destination & Travel Foundation
Receptionist
Job Description: Greets visitors, answers routine questions about DMO. May also include switchboard operation and light clerical duties.
Count
Average Number of FTEs
Reported
Fixed Salary for FY 2014 Total Compensation Variable
Mean Median 75% earn
more than 25% earn
more than Mean Median 75% earn
more than 25% earn
more than
Transaction-based Cash
Comp.
Performance-based Cash
Comp. All Respondents 78 1.1 $31,699 $31,200 $27,804 $35,633 $32,285 $31,398 $27,804 $36,044 $21 $566
ORGANIZATIONAL STRUCTURE
Private 57 1.1 $31,710 $31,200 $27,788 $34,437 $32,294 $31,200 $27,788 $36,029 $28 $556
Public 19 1.0 $31,099 $31,740 $27,966 $35,626 $31,630 $31,740 $27,966 $36,266 $0 $530
TYPE OF BUREAU
Membership Based 44 1.1 $33,038 $31,848 $30,000 $36,034 $33,741 $32,073 $30,329 $36,287 $36 $666
Non-Membership Based 34 1.1 $29,965 $29,185 $24,567 $32,429 $30,402 $29,185 $25,872 $34,027 $0 $437
TOTAL REVENUE
0 to $499,999 4 0.8 $19,801 $19,809 $17,936 $21,673 $19,801 $19,809 $17,936 $21,673 $0 $0
$500,000 to $999,999 4 1.1 $27,484 $27,408 $25,252 $29,640 $27,484 $27,408 $25,252 $29,640 $0 $0
$1,000,000 to $1,999,999 8 1.0 $29,478 $28,625 $27,900 $32,144 $29,775 $28,625 $27,900 $32,144 $0 $297
$2,000,000 to $3,999,999 14 1.1 $28,297 $30,045 $24,890 $31,200 $28,576 $30,308 $26,690 $31,496 $0 $279
$4,000,000 to $9,999,999 13 1.2 $29,814 $29,500 $26,000 $32,395 $30,898 $31,000 $26,000 $36,029 $0 $1,084
$10 Million or More 35 1.0 $36,109 $34,437 $31,470 $37,798 $36,834 $34,532 $31,860 $39,278 $46 $679
NUMBER OF EMPLOYEES
Less Than 5 2
5 to 9 9 1.0 $24,711 $25,696 $21,617 $28,080 $24,976 $25,696 $21,617 $28,080 $0 $264
10 to 19 17 1.1 $29,704 $30,615 $27,600 $31,750 $30,244 $31,200 $27,600 $31,800 $0 $540
20 to 34 7 1.1 $27,176 $28,470 $22,820 $31,198 $27,754 $28,470 $23,203 $31,806 $0 $578
35 to 59 23 1.1 $34,975 $34,532 $30,350 $37,364 $35,630 $34,750 $31,100 $38,339 $15 $640
60 or More 20 1.1 $35,544 $33,348 $30,913 $37,817 $36,299 $33,793 $30,913 $39,857 $63 $692

Note: A minimum of four responses required to show data.
2014 DMO Compensation & Benefits Study 82 Destination & Travel Foundation
Director/Manager, Information Technology
Job Description: Directs all aspects of DMO’s technology systems and services. Identifies, manages and solves technology problems. In some cases, provides technology training to DMO staff. Manages other IS personnel.
Count
Average Number of FTEs
Reported
Fixed Salary for FY 2014 Total Compensation Variable
Mean Median 75% earn
more than 25% earn
more than Mean Median 75% earn
more than 25% earn
more than
Transaction-based Cash
Comp.
Performance-based Cash
Comp. All Respondents 73 1.0 $73,315 $73,160 $58,710 $91,380 $76,681 $75,561 $58,710 $93,090 $98 $3,268
ORGANIZATIONAL STRUCTURE
Private 56 1.0 $75,632 $74,876 $59,293 $92,245 $79,433 $78,775 $63,383 $96,366 $18 $3,783
Public 16 1.0 $66,319 $68,890 $51,404 $82,965 $68,374 $72,400 $52,366 $84,030 $384 $1,672
TYPE OF BUREAU
Membership Based 50 1.0 $76,785 $75,658 $64,008 $92,521 $80,732 $81,765 $64,595 $98,766 $143 $3,804
Non-Membership Based 23 1.0 $65,771 $64,780 $50,762 $84,370 $67,874 $65,000 $50,762 $84,370 $0 $2,103
TOTAL REVENUE
0 to $499,999 0
$500,000 to $999,999 4 0.8 $40,684 $29,057 $25,116 $44,625 $40,821 $29,332 $25,528 $44,625 $0 $138
$1,000,000 to $1,999,999 4 1.0 $55,672 $53,844 $52,250 $57,266 $55,672 $53,844 $52,250 $57,266 $0 $0
$2,000,000 to $3,999,999 6 0.9 $48,675 $46,487 $30,881 $61,868 $48,675 $46,487 $30,881 $61,868 $0 $0
$4,000,000 to $9,999,999 18 1.0 $66,946 $66,125 $53,035 $74,211 $70,198 $69,515 $55,735 $76,868 $0 $3,251
$10 Million or More 41 1.1 $84,621 $87,000 $69,000 $96,000 $89,174 $92,107 $72,100 $101,250 $174 $4,378
NUMBER OF EMPLOYEES
Less Than 5 0
5 to 9 3
10 to 19 8 0.9 $47,022 $51,500 $35,294 $60,500 $48,276 $51,500 $35,294 $65,000 $0 $1,254
20 to 34 13 1.0 $62,779 $64,030 $51,047 $73,160 $63,975 $64,780 $52,647 $77,304 $0 $1,196
35 to 59 25 1.0 $79,871 $78,100 $66,000 $93,571 $83,550 $83,738 $66,000 $97,252 $40 $3,639
60 or More 24 1.0 $85,921 $87,326 $73,889 $97,017 $91,261 $92,041 $78,801 $101,890 $256 $5,085

Note: A minimum of four responses required to show data.
2014 DMO Compensation & Benefits Study 83 Destination & Travel Foundation
Technical Support/Network Administration
Job Description: Responsible for in-house technical support of computer systems, including hardware and software installation and troubleshooting.
Count
Average Number of FTEs
Reported
Fixed Salary for FY 2014 Total Compensation Variable
Mean Median 75% earn
more than 25% earn
more than Mean Median 75% earn
more than 25% earn
more than
Transaction-based Cash
Comp.
Performance-based Cash
Comp. All Respondents 36 1.2 $50,202 $48,000 $41,000 $54,813 $51,739 $50,000 $42,112 $55,632 $13 $1,524
ORGANIZATIONAL STRUCTURE
Private 31 1.2 $47,943 $45,780 $39,350 $50,949 $49,481 $47,615 $40,591 $53,488 $15 $1,523
Public 4 1.5 $65,232 $55,341 $51,228 $69,344 $67,152 $57,661 $51,228 $73,584 $0 $1,920
TYPE OF BUREAU
Membership Based 27 1.2 $47,901 $45,780 $39,350 $52,708 $49,494 $47,615 $40,591 $54,020 $17 $1,575
Non-Membership Based 9 1.2 $57,104 $50,000 $46,870 $60,112 $58,476 $52,681 $46,870 $60,112 $0 $1,372
TOTAL REVENUE
0 to $499,999 0
$500,000 to $999,999 0
$1,000,000 to $1,999,999 0
$2,000,000 to $3,999,999 3
$4,000,000 to $9,999,999 4 1.0 $58,166 $50,833 $49,500 $59,499 $60,494 $53,488 $52,411 $61,570 $0 $2,328
$10 Million or More 29 1.2 $50,308 $48,000 $41,100 $58,000 $51,895 $50,000 $42,583 $58,051 $16 $1,571
NUMBER OF EMPLOYEES
Less Than 5 0
5 to 9 0
10 to 19 2
20 to 34 3
35 to 59 15 1.0 $51,069 $48,000 $44,080 $55,889 $53,104 $50,000 $45,254 $56,664 $31 $2,004
60 or More 16 1.4 $51,723 $49,880 $37,805 $58,013 $52,914 $51,843 $39,737 $58,163 $0 $1,191

2014 DMO Compensation & Benefits Study 84 Destination & Travel Foundation
Benefits Section

Health and Dental Insurance
2014 DMO Compensation & Benefits Study 85 Destination & Travel Foundation
Benefits Section Health and Dental Insurance
Total Revenue
All Respondents $0 to
$499,999 $500,000 to
$999,999 $1,000,000 to
$1,999,999 $2,000,000 to
$3,999,999 $4,000,000 to
$9,999,999 $10 million
or more
Q1. Benefits offered to:
CEO
Count 301 40 53 60 54 39 55
Dental care 78% 28% 75% 75% 93% 95% 95%
Accidental Death & Dismemberment 69% 28% 53% 68% 81% 85% 93%
Vision care 63% 15% 49% 62% 72% 85% 91%
Prescription drug card 57% 25% 38% 52% 72% 74% 80%
Routine physical 57% 30% 47% 50% 57% 67% 85%
Preferred Provider Organization (PPO) 55% 28% 49% 48% 52% 79% 76%
Outpatient physical therapy 52% 18% 42% 43% 52% 67% 84%
Mental illness outpatient 46% 15% 32% 35% 48% 62% 80%
Chiropractic 45% 13% 30% 38% 50% 62% 73%
Well baby care 40% 15% 28% 27% 37% 56% 73%
Accident insurance 39% 20% 32% 35% 37% 56% 51%
Health Flexible Spending Account (FSA) 36% 5% 19% 23% 41% 51% 73%
Wellness program 28% 13% 21% 22% 30% 36% 47%
Long-term care 27% 8% 23% 25% 33% 21% 47%
Smoking cessation 22% 13% 15% 18% 19% 23% 42%
Health Maintenance Organization (HMO) 21% 3% 13% 18% 22% 31% 36%
Health Savings Account (HSA) 21% 13% 19% 13% 19% 26% 36%
Stress management 21% 10% 9% 15% 20% 31% 42%
Fitness program 16% 5% 17% 12% 13% 18% 27%
Weight control 12% 8% 8% 10% 9% 13% 25%
Indemnity Plan 9% 8% 13% 8% 9% 0% 11%
Extended Health Plan (in Canada) 7% 5% 8% 7% 9% 3% 7%
Health Reimbursement Account (HRA) 0% 0% 0% 0% 0% 0% 0%
Other 7% 3% 2% 7% 7% 15% 9%

Health and Dental Insurance
2014 DMO Compensation & Benefits Study 86 Destination & Travel Foundation
Total Revenue
All Respondents $0 to
$499,999 $500,000 to
$999,999 $1,000,000 to
$1,999,999 $2,000,000 to
$3,999,999 $4,000,000 to
$9,999,999 $10 million
or more
Q1. Benefits offered to: (cont.)
Senior/Middle Management
Count 301 40 53 60 54 39 55
Dental care 67% 18% 49% 63% 85% 92% 91%
Accidental Death & Dismemberment 58% 20% 28% 55% 72% 79% 91%
Vision care 56% 13% 32% 53% 65% 82% 87%
Prescription drug card 51% 20% 25% 40% 67% 72% 78%
Routine physical 49% 20% 34% 42% 50% 67% 80%
Preferred Provider Organization (PPO) 48% 15% 32% 43% 48% 74% 75%
Outpatient physical therapy 47% 15% 30% 38% 46% 64% 82%
Mental illness outpatient 42% 15% 25% 32% 43% 59% 78%
Chiropractic 41% 13% 23% 35% 43% 62% 71%
Well baby care 36% 15% 17% 27% 33% 54% 71%
Accident insurance 33% 13% 23% 30% 31% 54% 49%
Health Flexible Spending Account (FSA) 33% 5% 13% 20% 37% 49% 73%
Wellness program 27% 10% 17% 23% 26% 36% 47%
Long-term care 25% 5% 19% 23% 28% 21% 45%
Smoking cessation 20% 13% 11% 17% 17% 23% 40%
Stress management 20% 10% 6% 17% 19% 31% 38%
Health Maintenance Organization (HMO) 19% 0% 8% 17% 20% 31% 36%
High Deductible Health Plan/Health Savings Account (HSA) 19% 8% 11% 12% 17% 28% 36%
Fitness program 13% 5% 11% 12% 13% 10% 25%
Weight control 12% 10% 6% 12% 7% 13% 24%
Health Reimbursement Account (HRA) 8% 0% 4% 8% 2% 10% 24%
Indemnity Plan 7% 8% 11% 5% 7% 0% 11%
Extended Health Plan (in Canada) 6% 3% 8% 7% 9% 3% 5%
Other 6% 0% 0% 5% 6% 18% 7%

Health and Dental Insurance
2014 DMO Compensation & Benefits Study 87 Destination & Travel Foundation
Total Revenue
All Respondents $0 to
$499,999 $500,000 to
$999,999 $1,000,000 to
$1,999,999 $2,000,000 to
$3,999,999 $4,000,000 to
$9,999,999 $10 million
or more
Q1. Benefits offered to: (cont.)
All Others
Count 301 40 53 60 54 39 55
Dental care 74% 25% 66% 68% 93% 95% 91%
Accidental Death & Dismemberment 62% 20% 42% 58% 80% 77% 91%
Vision care 60% 13% 43% 57% 72% 82% 89%
Prescription drug card 55% 18% 38% 48% 72% 72% 78%
Routine physical 53% 20% 51% 43% 57% 67% 76%
Preferred Provider Organization (PPO) 52% 23% 45% 43% 52% 77% 73%
Outpatient physical therapy 51% 18% 45% 38% 52% 67% 82%
Mental illness outpatient 46% 13% 36% 35% 50% 62% 78%
Chiropractic 44% 13% 34% 33% 52% 59% 69%
Well baby care 39% 15% 23% 28% 39% 56% 69%
Health Flexible Spending Account (FSA) 34% 5% 13% 20% 37% 49% 75%
Accident insurance 33% 10% 26% 27% 33% 54% 47%
Wellness program 27% 10% 17% 22% 31% 33% 47%
Long-term care 25% 5% 25% 22% 31% 18% 40%
Smoking cessation 22% 10% 17% 18% 19% 23% 40%
Stress management 21% 10% 9% 17% 20% 31% 40%
High Deductible Health Plan/Health Savings Account (HSA) 21% 10% 17% 12% 19% 28% 38%
Health Maintenance Organization (HMO) 20% 0% 11% 17% 22% 31% 36%
Weight control 13% 13% 8% 12% 9% 13% 24%
Fitness program 13% 5% 11% 12% 13% 10% 24%
Health Reimbursement Account (HRA) 9% 0% 4% 8% 6% 10% 24%
Indemnity Plan 7% 5% 8% 7% 9% 0% 11%
Extended Health Plan (in Canada) 6% 3% 9% 7% 9% 3% 5%
Other 6% 0% 2% 7% 7% 15% 5%

Health and Dental Insurance
2014 DMO Compensation & Benefits Study 88 Destination & Travel Foundation
All
Respondents
Q1. Benefit is paid by: Accident insurance Count 138 Paid by DMO 49% Paid by employee 33% Cost is shared 18% Accidental Death & Dismemberment Count 216 Paid by DMO 81% Paid by employee 7% Cost is shared 12% Indemnity Plan Count 43 Paid by DMO 49% Paid by employee 12% Cost is shared 40% Preferred Provider Organization (PPO) Count 171 Paid by DMO 36% Paid by employee 1% Cost is shared 63% Health Maintence Organization (HMO) Count 74 Paid by DMO 45% Paid by employee 0% Cost is shared 55% Health Savings Account (HSA) Count 68 Paid by DMO 34% Paid by employee 7% Cost is shared 59% Health Reimbursement Account (HRA) Count 33 Paid by DMO 30% Paid by employee 15% Cost is shared 55% Health Flexible Spending Account (FSA) Count 119 Paid by DMO 22% Paid by employee 67% Cost is shared 11%
All
Respondents
Q1. Benefit is paid by: Extended Health Plan (in Canada) Count 21 Paid by DMO 52% Paid by employee 5% Cost is shared 43% Prescription drug card Count 177 Paid by DMO 40% Paid by employee 4% Cost is shared 57% Dental care Count 245 Paid by DMO 51% Paid by employee 9% Cost is shared 40% Vision care Count 195 Paid by DMO 41% Paid by employee 22% Cost is shared 37% Long-term care Count 96 Paid by DMO 48% Paid by employee 29% Cost is shared 23% Chiropractic Count 142 Paid by DMO 39% Paid by employee 2% Cost is shared 59% Mental illness outpatient Count 144 Paid by DMO 34% Paid by employee 3% Cost is shared 63% Outpatient physical therapy Count 161 Paid by DMO 35% Paid by employee 2% Cost is shared 63%
All
Respondents
Q1. Benefit is paid by: Stress management Count 66 Paid by DMO 47% Paid by employee 9% Cost is shared 44% Weight control Count 43 Paid by DMO 30% Paid by employee 9% Cost is shared 60% Well baby care Count 120 Paid by DMO 33% Paid by employee 7% Cost is shared 61% Smoking cessation Count 74 Paid by DMO 38% Paid by employee 7% Cost is shared 55% Wellness program Count 91 Paid by DMO 47% Paid by employee 2% Cost is shared 51% Routine physical Count 181 Paid by DMO 49% Paid by employee 2% Cost is shared 49% Fitness program Count 54 Paid by DMO 37% Paid by employee 19% Cost is shared 44% Other benefits Count 24 Paid by DMO 67% Paid by employee 29% Cost is shared 4%

Health and Dental Insurance
2014 DMO Compensation & Benefits Study 89 Destination & Travel Foundation
Total Revenue
All Respondents $0 to
$499,999 $500,000 to
$999,999 $1,000,000 to
$1,999,999 $2,000,000 to
$3,999,999 $4,000,000 to
$9,999,999 $10 million
or more
Q2. Median percent of total monthly premium that employer contributes to HMO plan for the:
Health
Count 96 10 16 16 17 16 21
Employee only 92% 100% 98% 80% 90% 95% 92%
Count 83 7 10 14 14 16 22
Spouse/domestic partner 13% 0% 0% 0% 47% 2% 75%
Count 79 7 9 13 13 15 22
Child 13% 0% 0% 0% 30% 0% 75%
Count 84 7 10 15 15 15 22
Family 37% 0% 0% 0% 50% 0% 73%
Dental
Count 83 7 14 16 14 12 20
Employee only 95% 0% 100% 95% 98% 70% 95%
Count 71 5 9 13 11 13 20
Employee & spouse/domestic partner 0% 0% 0% 0% 50% 0% 65%
Count 68 5 8 12 10 13 20
Child 0% 0% 0% 0% 25% 0% 66%
Count 72 5 8 14 12 13 20
Family 0% 0% 0% 0% 46% 0% 66%

Health and Dental Insurance
2014 DMO Compensation & Benefits Study 90 Destination & Travel Foundation
Total Revenue
All Respondents $0 to
$499,999 $500,000 to
$999,999 $1,000,000 to
$1,999,999 $2,000,000 to
$3,999,999 $4,000,000 to
$9,999,999 $10 million
or more
Q2. Median percent of total monthly premium that employer contributes to PPO plan for the:
Health
Count 179 14 29 34 32 28 42
Employee only 94% 80% 100% 93% 99% 90% 92%
Count 152 10 19 26 28 27 42
Spouse/domestic partner 42% 0% 0% 8% 0% 50% 72%
Count 151 9 19 26 28 27 42
Child 50% 0% 0% 20% 0% 50% 72%
Count 155 9 21 27 28 27 43
Family 40% 0% 0% 15% 0% 40% 70%
Dental
Count 167 13 25 30 30 28 41
Employee only 100% 20% 100% 100% 100% 100% 100%
Count 141 10 17 22 26 26 40
Spouse/domestic partner 0% 0% 0% 13% 0% 0% 66%
Count 139 9 17 22 26 25 40
Child 0% 0% 0% 33% 0% 0% 66%
Count 145 9 19 24 26 26 41
Family 0% 0% 0% 10% 0% 14% 65%

Health and Dental Insurance
2014 DMO Compensation & Benefits Study 91 Destination & Travel Foundation
Total Revenue
All Respondents $0 to
$499,999 $500,000 to
$999,999 $1,000,000 to
$1,999,999 $2,000,000 to
$3,999,999 $4,000,000 to
$9,999,999 $10 million
or more
Q2. Median percent of total monthly premium that employer contributes to Indemnity plan for the:
Health
Count 33 6 7 5 6 4 5
Employee only 75% 0% 81% 0% 100% 35% 93%
Count 30 6 4 4 6 4 6
Spouse/domestic partner 0% 0% 0% 0% 0% 25% 0%
Count 30 6 4 4 5 4 7
Child 0% 0% 0% 0% 0% 25% 0%
Count 32 6 5 6 5 4 6
Family 0% 0% 0% 0% 0% 25% 0%
Dental
Count 36 5 6 6 7 6 6
Employee only 78% 0% 40% 50% 100% 73% 50%
Count 31 5 4 5 6 5 6
Spouse/domestic partner 0% 0% 0% 0% 0% 0% 0%
Count 31 5 4 5 5 5 7
Child 0% 0% 0% 0% 0% 0% 0%
Count 33 5 5 7 5 5 6
Family 0% 0% 0% 0% 0% 0% 0%

Health and Dental Insurance
2014 DMO Compensation & Benefits Study 92 Destination & Travel Foundation
Total Revenue
All Respondents $0 to
$499,999 $500,000 to
$999,999 $1,000,000 to
$1,999,999 $2,000,000 to
$3,999,999 $4,000,000 to
$9,999,999 $10 million
or more
Q3. Median maximum out-of-pocket expense/deductible for HMO plan:
Health
Count 79 6 13 16 11 15 18
Employee only $1,600 $1,500 $1,000 $2,000 $1,500 $3,000 $1,500
Count 52 1 7 9 9 11 15
Employee & spouse/domestic partner $2,800 * $0 $3,000 $2,000 $6,000 $3,000
Count 46 1 5 8 8 9 15
Employee & child $3,000 * $0 $3,500 $3,300 $6,000 $3,000
Count 62 1 7 14 10 12 18
Employee & family $3,000 * $500 $3,500 $2,800 $5,500 $3,000
Dental
Count 31 1 6 12 4 5 3
Employee only $50 * $25 $50 $413 $50 *
Count 18 0 2 7 3 4 2
Employee & spouse/domestic partner $75 * * $0 * $125 *
Count 17 0 2 6 3 4 2
Employee & child $100 * * $0 * $125 *
Count 24 0 2 11 4 4 3
Employee & family $100 * * $75 $488 $125 *
*A minimum of four responses required to show median data.

Health and Dental Insurance
2014 DMO Compensation & Benefits Study 93 Destination & Travel Foundation
Total Revenue
All Respondents $0 to
$499,999 $500,000 to
$999,999 $1,000,000 to
$1,999,999 $2,000,000 to
$3,999,999 $4,000,000 to
$9,999,999 $10 million
or more
Q3. Median maximum out-of-pocket expense/deductible for PPO plan:
Health
Count 158 9 24 31 29 24 41
Employee only $2,000 $2,500 $1,500 $1,125 $1,500 $3,000 $2,200
Count 115 6 13 20 20 20 36
Employee & spouse/domestic partner $3,000 $2,000 $1,250 $2,000 $3,000 $5,500 $4,000
Count 111 4 13 17 20 21 36
Employee & child $3,000 $2,000 $1,250 $2,000 $3,000 $5,000 $5,000
Count 133 5 16 24 24 23 41
Employee & family $4,000 $1,000 $2,375 $2,875 $3,500 $6,000 $5,000
Dental
Count 90 4 11 17 21 15 22
Employee only $50 $275 $75 $50 $50 $50 $50
Count 73 4 7 11 18 13 20
Employee & spouse/domestic partner $100 $275 $0 $150 $150 $150 $100
Count 70 4 7 9 18 12 20
Employee & child $100 $275 $0 $150 $150 $150 $100
Count 78 4 7 13 20 13 21
Employee & family $150 $275 $100 $150 $150 $150 $150
Q5. DMO offers pre-tax plan for the following items:
Count 301 40 53 60 54 39 55
Health insurance premium contributions 46% 13% 32% 37% 52% 64% 73%
Health care 38% 10% 30% 28% 33% 51% 71%
Dependent care 35% 5% 23% 25% 35% 51% 69%
Other 11% 3% 4% 10% 19% 10% 18%

Health and Dental Insurance
2014 DMO Compensation & Benefits Study 94 Destination & Travel Foundation
Total Revenue
All Respondents $0 to
$499,999 $500,000 to
$999,999 $1,000,000 to
$1,999,999 $2,000,000 to
$3,999,999 $4,000,000 to
$9,999,999 $10 million
or more
Q6. Percent increase in health and dental benefit costs over last year:
Count 226 16 41 47 43 32 47
Health 6% 6% 6% 7% 5% 5% 7%
Count 201 10 36 39 40 32 44
Dental 2% 0% 3% 5% 2% 2% 0%
Q7a. Has your DMO taken any steps within the last year to reduce healthcare costs?
Count 270 26 46 57 50 38 53
Yes 47% 35% 46% 44% 44% 58% 55%
No 53% 65% 54% 56% 56% 42% 45%
Q7b. If "yes," what steps have been taken?
Count 128 9 21 25 22 22 29
Increased deductibles 38% 44% 38% 36% 50% 32% 34%
Changed insurance carriers 31% 11% 24% 28% 36% 36% 38%
Increased out-of-pocket maximum limit 28% 11% 33% 40% 32% 14% 28%
Increased employees' share of co-pays 27% 0% 24% 32% 36% 18% 34%
Change type of plan offered 16% 44% 19% 12% 14% 14% 10%
Co-insurance 12% 11% 0% 20% 18% 9% 10%
Added High Deductible/HSA plan 10% 11% 10% 16% 14% 5% 7%
Raised premium of spouse/domestic partner, child or family 10% 11% 10% 20% 0% 5% 14%
Lowered copay for generic medications 7% 11% 0% 8% 5% 14% 7%
Changed funding arrangement (e.g., from fully insured to self insured) 1% 0% 2% 2% 0% 0% 4%
Eliminated coverage for future retirees 1% 0% 0% 0% 0% 0% 3%
Added HRA plan 1% 0% 0% 0% 0% 0% 3%
Limited coverage for future retirees 0% 0% 0% 0% 0% 0% 0%
Other changes 23% 11% 24% 24% 18% 32% 21%

Health and Dental Insurance
2014 DMO Compensation & Benefits Study 95 Destination & Travel Foundation
Total Revenue
All Respondents $0 to
$499,999 $500,000 to
$999,999 $1,000,000 to
$1,999,999 $2,000,000 to
$3,999,999 $4,000,000 to
$9,999,999 $10 million
or more
Q8a. Has your DMO made changes to your health insurance due to the recent implementation of the Affordable Care Act (ACA)?
Count 267 26 45 56 49 38 53
Yes 20% 19% 24% 16% 18% 26% 17%
No 80% 81% 76% 84% 82% 74% 83%
Q8b. If "yes," what changes have been made?
Count 53 5 11 9 9 10 9
Increased coverage to comply with the ACA 34% 40% 18% 22% 33% 30% 67%
Eliminate health insurance plans and have employees purchase coverage from the Federal or State exchanges 6% 0% 0% 22% 11% 0% 0%
Eliminate or alter family benefits and coverage 13% 0% 18% 11% 11% 20% 11%
Other 45% 60% 55% 44% 44% 50% 22%

Life Insurance
2014 DMO Compensation & Benefits Study 96 Destination & Travel Foundation
Life Insurance
Total Revenue
All Respondents $0 to
$499,999 $500,000 to
$999,999 $1,000,000 to
$1,999,999 $2,000,000 to
$3,999,999 $4,000,000 to
$9,999,999 $10 million
or more
Q1. Types of life insurance offered to:
CEO
Count 301 40 53 60 54 39 55
Accidental death & dismemberment 62% 25% 38% 55% 74% 79% 95%
Term life 60% 20% 49% 57% 70% 74% 84%
Dependent life insurance 24% 8% 11% 17% 28% 28% 51%
Whole/Universal life 19% 8% 21% 15% 28% 26% 15%
Other life insurance 7% 5% 6% 3% 4% 13% 13%
Senior/Middle Management
Count 301 40 53 60 54 39 55
Accidental death & dismemberment 56% 15% 23% 50% 72% 77% 95%
Term life 52% 18% 30% 48% 63% 67% 82%
Dependent life insurance 23% 8% 9% 17% 26% 26% 51%
Whole/Universal life 13% 3% 11% 13% 22% 15% 11%
Other life insurance 6% 3% 4% 3% 4% 10% 13%
All Others
Count 301 40 53 60 54 39 55
Accidental death & dismemberment 59% 20% 32% 52% 76% 77% 93%
Term life 55% 15% 43% 50% 67% 69% 82%
Dependent life insurance 24% 5% 9% 17% 26% 28% 53%
Whole/Universal life 13% 3% 13% 12% 22% 15% 11%
Other life insurance 5% 3% 2% 3% 4% 10% 11%

Life Insurance
2014 DMO Compensation & Benefits Study 97 Destination & Travel Foundation
Total Revenue
All Respondents $0 to
$499,999 $500,000 to
$999,999 $1,000,000 to
$1,999,999 $2,000,000 to
$3,999,999 $4,000,000 to
$9,999,999 $10 million
or more
Q2. Life insurance as a multiple of employees' annual earnings
CEO
Count 231 15 35 45 49 36 51
Equal to annual earnings 21% 20% 11% 27% 18% 25% 24%
1.5 times annual earnings 11% 7% 17% 9% 10% 14% 10%
2 times annual earnings 15% 7% 11% 4% 16% 19% 25%
2.5 times annual earnings 4% 0% 3% 4% 2% 3% 10%
3 times annual earnings 4% 7% 3% 4% 2% 0% 8%
Flat rate 36% 60% 49% 47% 37% 28% 14%
Other 9% 0% 6% 4% 14% 11% 10%
Senior/Middle Management
Count 201 9 25 37 43 35 52
Equal to annual earnings 23% 22% 12% 27% 16% 31% 25%
1.5 times annual earnings 12% 0% 20% 11% 12% 14% 12%
2 times annual earnings 18% 0% 12% 5% 16% 20% 35%
2.5 times annual earnings 2% 0% 0% 3% 2% 3% 4%
3 times annual earnings 3% 11% 0% 5% 0% 0% 6%
Flat rate 32% 67% 44% 43% 40% 26% 12%
Other 8% 0% 12% 5% 14% 6% 8%
All Others
Count 209 9 30 36 47 35 52
Equal to annual earnings 26% 33% 23% 25% 21% 31% 27%
1.5 times annual earnings 11% 11% 17% 8% 11% 11% 12%
2 times annual earnings 15% 0% 3% 6% 17% 17% 27%
2.5 times annual earnings 2% 0% 0% 3% 2% 3% 4%
3 times annual earnings 1% 0% 0% 3% 0% 0% 4%
Flat rate 34% 56% 50% 47% 34% 31% 15%
Other 10% 0% 7% 8% 15% 6% 12%
Q3. Percent of premium DMO pays for life insurance
Count 259 28 43 50 49 37 52
Median percent 100% 73% 100% 100% 100% 100% 100%

Disability Insurance/Paid Leave
2014 DMO Compensation & Benefits Study 98 Destination & Travel Foundation
Disability Insurance/Paid Leave
Total Revenue
All Respondents $0 to
$499,999 $500,000 to
$999,999 $1,000,000 to
$1,999,999 $2,000,000 to
$3,999,999 $4,000,000 to
$9,999,999 $10 million
or more
Q1. Short-term disability offered to:
CEO
Count 254 28 40 48 48 37 53
Offered 56% 29% 45% 56% 60% 51% 79%
Not offered 44% 71% 55% 44% 40% 49% 21%
Senior/Middle Management
Count 231 20 32 44 45 37 53
Offered 55% 20% 41% 48% 62% 51% 79%
Not offered 45% 80% 59% 52% 38% 49% 21%
All Others
Count 247 26 39 45 48 36 53
Offered 54% 27% 41% 49% 60% 56% 75%
Not offered 46% 73% 59% 51% 40% 44% 25%
Q2. Length of waiting period for short-term disability
Count 141 6 18 28 29 20 40
Median (in days) 8 10 12 14 7 8 11
Q3. Percent if calculated as a fixed percent of salary
Count 117 6 13 20 23 19 36
Median percent of salary 60% 66% 60% 60% 60% 60% 60%
Q3. Maximum dollar amount if fixed percent of salary
Count 90 4 7 15 21 18 25
Median amount $1,000 $900 $9,000 $900 $1,000 $1,000 $1,250

Disability Insurance/Paid Leave
2014 DMO Compensation & Benefits Study 99 Destination & Travel Foundation
Total Revenue
All Respondents $0 to
$499,999 $500,000 to
$999,999 $1,000,000 to
$1,999,999 $2,000,000 to
$3,999,999 $4,000,000 to
$9,999,999 $10 million
or more
Q4. Long-term disability offered to:
CEO
Count 246 24 35 48 48 38 53
Offered 74% 21% 69% 65% 83% 82% 94%
Not offered 26% 79% 31% 35% 17% 18% 6%
Senior/Middle Management
Count 222 17 25 43 46 38 53
Offered 76% 18% 72% 63% 87% 82% 94%
Not offered 24% 82% 28% 37% 13% 18% 6%
All Others
Count 236 22 35 43 48 37 51
Offered 72% 18% 60% 60% 83% 81% 94%
Not offered 28% 82% 40% 40% 17% 19% 6%
Q5. Length of waiting period before long-term disability benefits commence for:
CEO
Count 180 8 23 29 38 31 51
30 days 9% 13% 26% 14% 5% 3% 4%
60 days 6% 13% 9% 7% 8% 10% 0%
90 days 57% 13% 39% 52% 58% 58% 75%
180 days 19% 25% 17% 21% 18% 29% 14%
Other 8% 38% 9% 7% 11% 0% 8%

Disability Insurance/Paid Leave
2014 DMO Compensation & Benefits Study 100 Destination & Travel Foundation
Total Revenue
All Respondents $0 to
$499,999 $500,000 to
$999,999 $1,000,000 to
$1,999,999 $2,000,000 to
$3,999,999 $4,000,000 to
$9,999,999 $10 million
or more
Q5. Length of waiting period before long-term disability benefits commence for: (cont.)
Senior/Middle Management
Count 166 5 18 26 35 31 51
30 days 7% 0% 22% 12% 6% 3% 4%
60 days 7% 20% 17% 8% 6% 10% 0%
90 days 57% 0% 28% 50% 60% 58% 75%
180 days 20% 40% 22% 23% 17% 29% 14%
Other 8% 40% 11% 8% 11% 0% 8%
All Others
Count 165 5 19 23 37 31 50
30 days 7% 20% 21% 9% 5% 3% 4%
60 days 7% 20% 16% 9% 8% 10% 0%
90 days 58% 20% 37% 52% 57% 58% 72%
180 days 19% 0% 11% 22% 19% 29% 16%
Other 9% 40% 16% 9% 11% 0% 8%
Q6. Long-term disability benefit formula used for:
CEO
Count 174 6 21 28 39 31 49
Less than 50% of pay 5% 0% 10% 11% 3% 3% 4%
50% of pay 4% 0% 14% 4% 3% 3% 2%
60% of pay 64% 50% 33% 68% 72% 71% 65%
66% of pay 17% 50% 33% 4% 15% 13% 16%
Other 10% 0% 10% 14% 8% 10% 12%

Disability Insurance/Paid Leave
2014 DMO Compensation & Benefits Study 101 Destination & Travel Foundation
Total Revenue
All Respondents $0 to
$499,999 $500,000 to
$999,999 $1,000,000 to
$1,999,999 $2,000,000 to
$3,999,999 $4,000,000 to
$9,999,999 $10 million
or more
Q6. Long-term disability benefit formula used for: (cont.)
Senior/Middle Management
Count 163 4 16 25 38 31 49
Less than 50% of pay 4% 0% 13% 8% 0% 3% 4%
50% of pay 4% 0% 13% 4% 5% 3% 2%
60% of pay 65% 50% 31% 68% 71% 71% 67%
66% of pay 17% 50% 38% 4% 16% 13% 16%
Other 10% 0% 6% 16% 8% 10% 10%
All Others
Count 164 3 20 23 38 30 50
Less than 50% of pay 4% 0% 15% 0% 0% 3% 4%
50% of pay 4% 0% 10% 4% 5% 3% 2%
60% of pay 66% 33% 30% 74% 71% 70% 72%
66% of pay 16% 67% 30% 4% 16% 13% 14%
Other 10% 0% 15% 17% 8% 10% 8%
Q7. Maximum monthly benefit for long-term disability for:
CEO
Count 167 5 20 25 37 30 50
Less than $2,500 5% 0% 15% 16% 3% 0% 2%
$2,500 - $3,999 19% 60% 40% 32% 19% 7% 6%
$4,000 - $4,999 46% 40% 35% 36% 62% 67% 32%
$5,000 - $7,499 30% 0% 10% 16% 16% 27% 60%
$7,500 or more 0% 0% 0% 0% 0% 0% 0%

Disability Insurance/Paid Leave
2014 DMO Compensation & Benefits Study 102 Destination & Travel Foundation
Total Revenue
All Respondents $0 to
$499,999 $500,000 to
$999,999 $1,000,000 to
$1,999,999 $2,000,000 to
$3,999,999 $4,000,000 to
$9,999,999 $10 million
or more
Q7. Maximum monthly benefit for long-term disability for: (cont.)
Senior/Middle Management
Count 158 3 16 23 36 30 50
Less than $2,500 6% 0% 19% 17% 3% 0% 4%
$2,500 - $3,999 17% 100% 31% 30% 22% 7% 4%
$4,000 - $4,999 49% 0% 38% 39% 58% 73% 38%
$5,000 - $7,499 28% 0% 13% 13% 17% 20% 54%
$7,500 or more 0% 0% 0% 0% 0% 0% 0%
All Others
Count 155 1 17 21 37 30 49
Less than $2,500 9% 0% 24% 14% 11% 0% 6%
$2,500 - $3,999 15% 0% 35% 29% 14% 10% 8%
$4,000 - $4,999 51% 100% 35% 48% 59% 73% 37%
$5,000 - $7,499 25% 0% 6% 10% 16% 17% 49%
$7,500 or more 0% 0% 0% 0% 0% 0% 0%
Q8. Percent of short-term disability premiums the DMO pays
Count 162 13 22 28 30 25 44
Median percent 100% 0% 100% 100% 100% 100% 100%
Q8. Percent of long-term disability premiums the DMO pays
Count 193 13 28 32 39 31 50
Median percent 100% 0% 100% 100% 100% 100% 100%
Q9a. Does your DMO have a paid time off (PTO) plan that combines vacation, sick and personal leave?
Count 214 25 37 46 38 30 38
Yes 58% 52% 49% 61% 61% 63% 61%
No 42% 48% 51% 39% 39% 37% 39%
Q9b. If yes, how many days are provided?
Count 90 9 12 20 17 16 16
Median 30 31 17 60 30 27 25

Disability Insurance/Paid Leave
2014 DMO Compensation & Benefits Study 103 Destination & Travel Foundation
Total Revenue
All Respondents $0 to
$499,999 $500,000 to
$999,999 $1,000,000 to
$1,999,999 $2,000,000 to
$3,999,999 $4,000,000 to
$9,999,999 $10 million
or more
Q9c. If yes, does the number of PTO days vary by length of service?
Count 99 13 17 23 14 12 20
Yes 91% 77% 100% 87% 100% 83% 95%
No 9% 23% 0% 13% 0% 17% 5%
Q9d. Days of PTO per year offered by length of service
CEO
Immediately upon employment
Count 75 10 16 15 13 9 12
Median (days) 17 11 15 16 19 23 23
1 to 3 years
Count 73 12 13 15 12 8 13
Median (days) 18 11 16 16 19 20 20
4 to 5 years
Count 71 11 11 16 12 8 13
Median (days) 19 15 15 18 20 23 20
6 to 10 years
Count 73 11 12 16 13 8 13
Median (days) 23 15 20 23 25 25 24
11 to 19 years
Count 71 10 12 15 12 8 14
Median (days) 27 19 23 27 28 30 30
20 or more years
Count 67 8 11 15 11 8 14
Median (days) 28 20 20 28 27 30 30

Disability Insurance/Paid Leave
2014 DMO Compensation & Benefits Study 104 Destination & Travel Foundation
Total Revenue
All Respondents $0 to
$499,999 $500,000 to
$999,999 $1,000,000 to
$1,999,999 $2,000,000 to
$3,999,999 $4,000,000 to
$9,999,999 $10 million
or more
Senior/Middle Management
Immediately upon employment
Count 59 3 11 14 12 9 10
Median (days) 15 * 10 15 16 20 13
1 to 3 years
Count 66 4 10 14 12 9 17
Median (days) 16 14 15 16 19 20 17
4 to 5 years
Count 67 4 11 14 12 9 17
Median (days) 19 15 15 18 20 20 20
6 to 10 years
Count 70 4 11 16 13 9 17
Median (days) 23 18 15 24 25 25 23
11 to 19 years
Count 66 3 11 14 12 9 17
Median (days) 27 * 20 28 27 30 28
20 or more years
Count 65 3 11 14 11 9 17
Median (days) 28 * 20 28 26 30 30
*A minimum of four responses required to show median data.
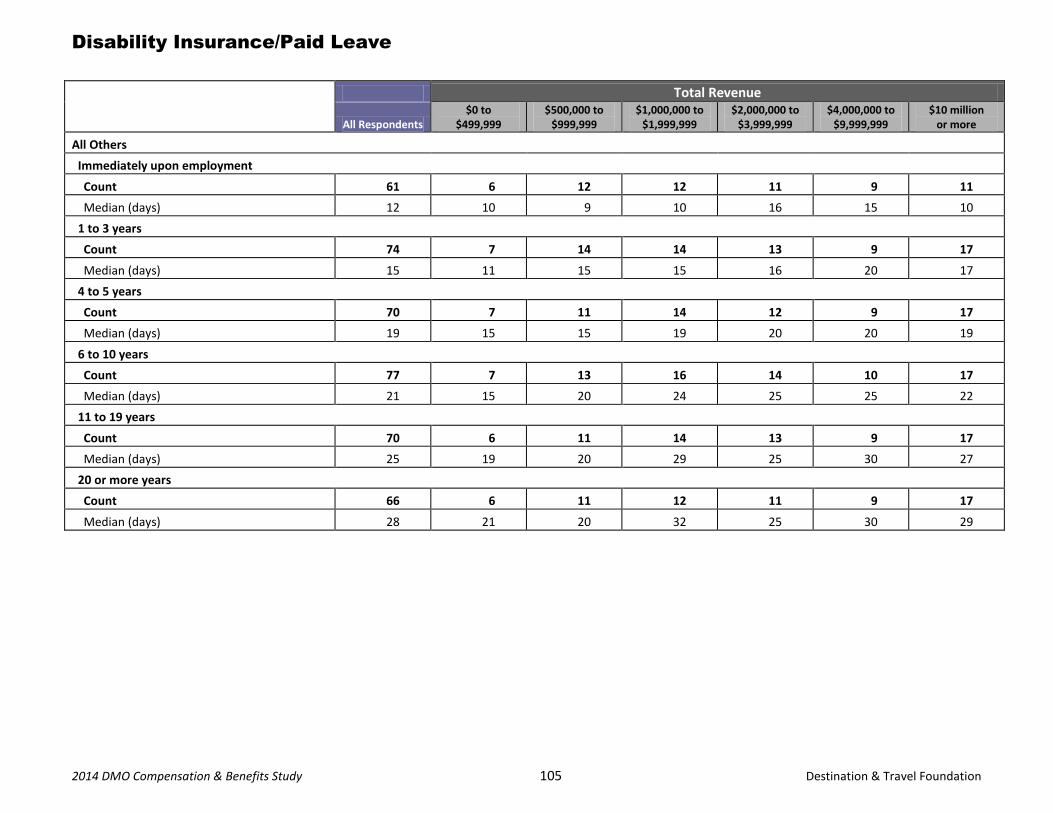
Disability Insurance/Paid Leave
2014 DMO Compensation & Benefits Study 105 Destination & Travel Foundation
Total Revenue
All Respondents $0 to
$499,999 $500,000 to
$999,999 $1,000,000 to
$1,999,999 $2,000,000 to
$3,999,999 $4,000,000 to
$9,999,999 $10 million
or more
All Others
Immediately upon employment
Count 61 6 12 12 11 9 11
Median (days) 12 10 9 10 16 15 10
1 to 3 years
Count 74 7 14 14 13 9 17
Median (days) 15 11 15 15 16 20 17
4 to 5 years
Count 70 7 11 14 12 9 17
Median (days) 19 15 15 19 20 20 19
6 to 10 years
Count 77 7 13 16 14 10 17
Median (days) 21 15 20 24 25 25 22
11 to 19 years
Count 70 6 11 14 13 9 17
Median (days) 25 19 20 29 25 30 27
20 or more years
Count 66 6 11 12 11 9 17
Median (days) 28 21 20 32 25 30 29

Disability Insurance/Paid Leave
2014 DMO Compensation & Benefits Study 106 Destination & Travel Foundation
Total Revenue
All Respondents $0 to
$499,999 $500,000 to
$999,999 $1,000,000 to
$1,999,999 $2,000,000 to
$3,999,999 $4,000,000 to
$9,999,999 $10 million
or more
Q10. Days of leave per year offered
CEO
Sick
Count 168 15 30 34 34 26 29
Median (days) 10 9 10 9 10 10 10
Personal
Count 127 7 23 27 24 20 26
Median (days) 3 3 2 3 3 3 5
Bereavement
Count 147 9 23 29 26 26 34
Median (days) 3 3 3 3 3 3 4
Family leave
Count 55 2 10 8 9 6 20
Median (days) 60 * 30 60 30 72 60
Other unpaid leave
Count 33 2 5 5 6 7 8
Median (days) 30 * 60 30 45 30 30
Compensatory
Count 21 2 4 5 3 3 4
Median (days) 1 * 0 1 * * 0
Statutory holiday
Count 161 10 26 30 30 29 36
Median (days) 10 10 10 10 11 10 10
Maternity
Count 38 2 8 7 6 7 8
Median (days) 30 * 5 18 30 30 40
Paternity
Count 24 1 4 5 6 3 5
Median (days) 10 * 0 10 10 * 12
Other
Count 23 2 4 3 5 4 5
Median (days) 10 * 53 * 8 8 6
*A minimum of four responses required to show median data.

Disability Insurance/Paid Leave
2014 DMO Compensation & Benefits Study 107 Destination & Travel Foundation
Total Revenue
All Respondents $0 to
$499,999 $500,000 to
$999,999 $1,000,000 to
$1,999,999 $2,000,000 to
$3,999,999 $4,000,000 to
$9,999,999 $10 million
or more
Senior/Middle Management
Sick
Count 146 7 23 28 32 26 30
Median (days) 10 8 10 10 10 10 10
Personal
Count 107 2 15 21 23 20 26
Median (days) 3 * 2 3 2 3 5
Bereavement
Count 131 4 19 24 24 26 34
Median (days) 3 3 3 3 3 3 4
Family leave
Count 49 0 8 6 9 6 20
Median (days) 60 * 17 60 30 72 60
Other unpaid leave
Count 28 1 3 3 6 7 8
Median (days) 30 * * * 45 30 30
Compensatory
Count 16 0 2 2 3 4 5
Median (days) 1 * * * * 3 0
Statutory holiday
Count 143 4 21 25 28 29 36
Median (days) 10 10 10 10 11 10 10
Maternity
Count 34 0 7 6 6 7 8
Median (days) 30 * 6 24 30 30 40
Paternity
Count 21 0 3 4 6 3 5
Median (days) 10 * * 35 10 * 12
Other
Count 20 1 3 2 5 4 5
Median (days) 10 * * * 8 6 6
*A minimum of four responses required to show median data.

Disability Insurance/Paid Leave
2014 DMO Compensation & Benefits Study 108 Destination & Travel Foundation
Total Revenue
All Respondents $0 to
$499,999 $500,000 to
$999,999 $1,000,000 to
$1,999,999 $2,000,000 to
$3,999,999 $4,000,000 to
$9,999,999 $10 million
or more
All Others
Sick
Count 159 10 28 33 33 26 29
Median (days) 10 9 9 10 10 10 10
Personal
Count 118 4 20 26 24 19 25
Median (days) 3 4 3 2 2 2 3
Bereavement
Count 144 8 22 28 26 26 34
Median (days) 3 3 3 3 3 3 4
Family leave
Count 53 1 11 7 9 6 19
Median (days) 60 * 30 60 30 72 60
Other unpaid leave
Count 30 1 5 4 6 7 7
Median (days) 30 * 60 60 45 30 30
Compensatory
Count 17 0 3 3 3 4 4
Median (days) 1 * * * * 3 4
Statutory holiday
Count 153 7 24 27 30 29 36
Median (days) 10 10 10 10 11 10 10
Maternity
Count 35 0 8 6 6 7 8
Median (days) 30 * 5 24 30 30 40
Paternity
Count 21 0 4 4 5 3 5
Median (days) 10 * 0 35 10 * 12
Other
Count 22 2 4 2 5 4 5
Median (days) 10 * 53 * 8 6 6
*A minimum of four responses required to show median data.

Disability Insurance/Paid Leave
2014 DMO Compensation & Benefits Study 109 Destination & Travel Foundation
Total Revenue
All Respondents $0 to
$499,999 $500,000 to
$999,999 $1,000,000 to
$1,999,999 $2,000,000 to
$3,999,999 $4,000,000 to
$9,999,999 $10 million
or more
Q11a. Years of service required for the following:
CEO
2 weeks vacation
Count 128 14 19 33 22 20 20
Median (years) 1 1 1 1 1 1 1
3 weeks vacation
Count 148 15 24 39 26 21 23
Median (years) 5 5 5 5 5 5 5
4 weeks vacation
Count 145 9 21 34 31 21 29
Median (years) 10 10 8 10 10 10 10
5 weeks vacation
Count 78 4 15 20 11 9 19
Median (years) 15 15 10 15 15 15 10
6 or more weeks vacation
Count 39 1 5 9 8 5 11
Median (years) 16 * 10 20 16 15 15
*A minimum of four responses required to show median data.

Disability Insurance/Paid Leave
2014 DMO Compensation & Benefits Study 110 Destination & Travel Foundation
Total Revenue
All Respondents $0 to
$499,999 $500,000 to
$999,999 $1,000,000 to
$1,999,999 $2,000,000 to
$3,999,999 $4,000,000 to
$9,999,999 $10 million
or more
Q11a. Years of service required for the following: (cont.)
Senior/Middle Management
2 weeks vacation
Count 137 8 18 31 27 25 28
Median (years) 1 1 1 1 1 1 1
3 weeks vacation
Count 148 5 19 36 31 24 33
Median (years) 5 5 5 5 5 5 5
4 weeks vacation
Count 134 4 15 30 32 21 32
Median (years) 10 10 9 10 10 10 10
5 weeks vacation
Count 67 3 10 19 11 7 17
Median (years) 15 * 13 15 15 15 15
6 or more weeks vacation
Count 34 1 4 9 5 4 11
Median (years) 20 * 15 20 20 18 18
*A minimum of four responses required to show median data.

Disability Insurance/Paid Leave
2014 DMO Compensation & Benefits Study 111 Destination & Travel Foundation
Total Revenue
All Respondents $0 to
$499,999 $500,000 to
$999,999 $1,000,000 to
$1,999,999 $2,000,000 to
$3,999,999 $4,000,000 to
$9,999,999 $10 million
or more
Q11a. Years of service required for the following: (cont.)
All Others
2 weeks vacation
Count 156 12 25 34 29 26 30
Median (years) 1 1 1 1 1 1 1
3 weeks vacation
Count 162 7 26 36 35 25 33
Median (years) 5 5 5 5 5 5 5
4 weeks vacation
Count 136 5 17 30 32 21 31
Median (years) 10 10 10 10 10 10 10
5 weeks vacation
Count 64 3 11 17 10 7 16
Median (years) 15 * 15 15 15 15 15
6 or more weeks vacation
Count 37 2 5 8 6 4 12
Median (years) 20 * 20 20 18 18 19
Q11b. Does your DMO allow vacation leave carry over to the following year?
Count 229 26 41 46 41 33 42
Yes 64% 46% 61% 61% 61% 67% 81%
No 36% 54% 39% 39% 39% 33% 19%
If yes, how many days?
Count 115 8 19 23 21 16 28
Median 10 12 10 10 10 10 11
*A minimum of four responses required to show median data.

Disability Insurance/Paid Leave
2014 DMO Compensation & Benefits Study 112 Destination & Travel Foundation
Total Revenue
All Respondents $0 to
$499,999 $500,000 to
$999,999 $1,000,000 to
$1,999,999 $2,000,000 to
$3,999,999 $4,000,000 to
$9,999,999 $10 million
or more
Q11b. Does your DMO allow sick leave to carry over to the following year?
Count 214 25 37 46 38 30 38
Yes 58% 52% 49% 61% 61% 63% 61%
No 42% 48% 51% 39% 39% 37% 39%
If yes, how many days?
Count 90 9 12 20 17 16 16
Median 30 31 17 60 30 27 25

Retirement
2014 DMO Compensation & Benefits Study 113 Destination & Travel Foundation
Retirement
Total Revenue
All Respondents $0 to
$499,999 $500,000 to
$999,999 $1,000,000 to
$1,999,999 $2,000,000 to
$3,999,999 $4,000,000 to
$9,999,999 $10 million
or more
Q1. Does your organization offer a retirement plan for which all employees can be eligible?
Count 280 35 47 56 51 37 54
Yes 83% 43% 77% 86% 92% 97% 91%
No 18% 57% 23% 14% 8% 3% 9%
Q2. What types of plans are offered?
Count 231 15 36 48 47 36 49
Defined contribution plan 50% 13% 25% 42% 57% 69% 67%
Defined benefit pension plan 17% 7% 17% 23% 6% 17% 24%
Non-qualified plan 13% 0% 3% 10% 6% 19% 27%
Q2. If defined contribution plan is offered, what types?
Count 116 2 9 20 27 25 33
401(k) plan 74% 0% 56% 60% 78% 80% 85%
Thrift/savings plan 31% 0% 0% 0% 26% 52% 48%
Profit-sharing plan 12% 0% 11% 10% 11% 16% 12%
Simple IRA 4% 0% 11% 10% 7% 0% 0%
403(b) plan 3% 0% 11% 0% 0% 4% 3%
RRSP (Canada only) 3% 50% 0% 5% 0% 4% 0%
Simple 401(k) plan 3% 0% 11% 5% 4% 0% 0%
SEP-IRA 1% 0% 0% 5% 0% 0% 0%
DEFINED BENEFIT PENSION PLANS
Q3. What is the basis for your defined benefit pension plan?
Count 41 2 6 10 3 6 14
Average of highest 3 years 29% 0% 33% 20% 67% 17% 36%
Average of last three years 10% 50% 0% 10% 33% 17% 0%
Final average compensation 5% 0% 33% 0% 0% 0% 0%
Career average compensation 5% 0% 0% 10% 0% 17% 0%
Cash balance 2% 0% 0% 10% 0% 0% 0%
Life cycle plans 0% 0% 0% 0% 0% 0% 0%
Other 49% 50% 33% 50% 0% 50% 64%

Retirement
2014 DMO Compensation & Benefits Study 114 Destination & Travel Foundation
Total Revenue
All Respondents $0 to
$499,999 $500,000 to
$999,999 $1,000,000 to
$1,999,999 $2,000,000 to
$3,999,999 $4,000,000 to
$9,999,999 $10 million
or more
Q4. Does your organization use a percentage of salary as part of the calculation of the final benefit?
Count 40 2 6 10 3 6 13
Yes 68% 100% 83% 70% 33% 50% 69%
No 33% 0% 17% 30% 67% 50% 31%
Q4. If yes, what is the percentage?
Count 18 1 3 4 1 2 7
Median percent 5% * * 4 * * 6%
Q5. How does your defined benefit plan integrate with Social Security?
Count 39 1 6 9 3 6 14
Benefits supplement Social Security for salary in excess of Social Security wage base 13% 100% 0% 11% 33% 0% 14%
Benefits are not integrated with Social Security 87% 0% 100% 89% 67% 100% 86%
Q6. Organization's total expense for defined benefit plan as a % of total base wages
Count 22 0 3 5 3 5 6
Median percent 12% * * 13% * 11% 12%
Q7. Initial waiting period before employees are eligible for the defined benefit plan
Count 36 1 5 9 3 6 12
Median (in months) 0 * 1 6 * 3 0
Q8. How many years before employee is 100% vested?
Count 39 1 6 10 3 6 13
Median (in years) 5 * 5 5 * 5 5
*A minimum of four responses required to show median data.

Retirement
2014 DMO Compensation & Benefits Study 115 Destination & Travel Foundation
Total Revenue
All Respondents $0 to
$499,999 $500,000 to
$999,999 $1,000,000 to
$1,999,999 $2,000,000 to
$3,999,999 $4,000,000 to
$9,999,999 $10 million
or more
DEFINED CONTRIBUTION PLANS
Q9. What is the maximum available employer contribution as a % of base salary?
Count 172 12 28 35 38 26 33
Median percent 4% 3% 3% 4% 5% 5% 5%
Q9. Is the maximum based on the employee's years of service?
Count 179 13 28 36 39 28 35
Yes 8% 0% 4% 11% 10% 7% 9%
No 92% 100% 96% 89% 90% 93% 91%
Q10. What is the maximum available employee contribution as a % of base salary?
Count 78 4 15 14 18 10 17
Median percent 15% 14 10% 10% 15% 86% 75%
Q10. Is the maximum based on the employee's years of service?
Count 166 12 26 35 35 24 34
Yes 5% 0% 8% 3% 9% 0% 9%
No 95% 100% 92% 97% 91% 100% 91%
Q11. Initial waiting period before employees are eligible for the defined contribution plan
Count 173 12 28 33 39 27 34
Median (in months) 6 6 3 3 6 6 3
Q12. How many years before employee is 100% vested?
Count 301 40 53 60 54 39 55
Median (in years) 0 0 0 0 0 1 0

Retirement
2014 DMO Compensation & Benefits Study 116 Destination & Travel Foundation
Total Revenue
All Respondents $0 to
$499,999 $500,000 to
$999,999 $1,000,000 to
$1,999,999 $2,000,000 to
$3,999,999 $4,000,000 to
$9,999,999 $10 million
or more
401(K) PLANS
Q13a. Does your DMO match employee contributions?
Count 126 5 10 25 29 23 34
Yes 82% 100% 90% 76% 76% 87% 82%
No 18% 0% 10% 24% 24% 13% 18%
Q13b. If yes, what are the terms for matching?
Count 65 4 4 10 13 13 21
100% match 97% 100% 75% 100% 100% 92% 100%
50% match 3% 0% 25% 0% 0% 8% 0%
Other matching terms 0% 0% 0% 0% 0% 0% 0%
Q13b. Maximum percent of salary matched - 100%
Count 74 3 7 15 15 12 22
Median percent 4% * 4% 4% 4% 4% 4%
Q13b. Maximum percent of salary matched - 50%
Count 29 0 2 4 5 8 10
Median percent 4% * * 6 4% 4% 4%
403(B) PLANS
Q13a. Does your DMO match employee contributions?
Count 14 1 2 2 2 4 3
Yes 29% 100% 50% 0% 0% 50% 0%
No 71% 0% 50% 100% 100% 50% 100%
Q13b. If yes, what are the terms for matching?
Count 22 0 1 1 5 8 7
100% match 100% * 100% 100% 100% 100% 100%
50% match 0% * 0% 0% 0% 0% 0%
Other matching terms 0% * 0% 0% 0% 0% 0%
*A minimum of four responses required to show median data.

Retirement
2014 DMO Compensation & Benefits Study 117 Destination & Travel Foundation
Total Revenue
All Respondents $0 to
$499,999 $500,000 to
$999,999 $1,000,000 to
$1,999,999 $2,000,000 to
$3,999,999 $4,000,000 to
$9,999,999 $10 million
or more
ALL DEFINED CONTRIBUTION PLANS
Q14. Does the plan permit catch-up contributions?
Count 131 6 11 26 29 25 34
Yes 84% 50% 73% 65% 90% 96% 94%
No 16% 50% 27% 35% 10% 4% 6%
Q15. Does the plan take into account the Safe Harbor provisions?
Count 123 5 10 23 27 24 34
Yes 72% 40% 70% 52% 78% 79% 79%
No 28% 60% 30% 48% 22% 21% 21%
Q16. What are your plan's fees and expenses as a percentage of plan assets?
Count 125 4 17 22 27 25 30
Median percent 1.0% 0.5% 0.6% 0.8% 1.0% 1.0% 0.9%
NON-QUALIFIED PLANS
Q2. If non-qualified plan is offered, what types?
Count 29 0 1 5 3 7 13
457(b) plan 100% * 100% 100% 100% 100% 100%
457(f) plan 3% * 0% 0% 0% 14% 0%
Rabbi trust 0% * 0% 0% 0% 0% 0%
*A minimum of four responses required to show median data.

Special Benefits
2014 DMO Compensation & Benefits Study 118 Destination & Travel Foundation
Special Benefits
Total Revenue
All
Respondents $0 to
$499,999 $500,000 to
$999,999 $1,000,000 to
$1,999,999 $2,000,000 to
$3,999,999 $4,000,000 to
$9,999,999 $10 million
or more
Q1a. Does your DMO have a variable cash-compensation plan?
Count 266 36 43 48 50 36 53
Yes 32% 8% 12% 23% 34% 56% 57%
No 68% 92% 88% 77% 66% 44% 43%
Q1b. Types of variable cash compensation offered to:
CEO
Count 122 7 15 24 21 23 32
Transaction-based incentives 17% 14% 7% 8% 24% 13% 28%
Performance-based incentives 61% 29% 33% 39% 71% 74% 81%
Other 1% 0% 0% 0% 0% 0% 3%
Senior/Middle Management
Count 122 7 15 24 21 23 32
Transaction-based incentives 41% 14% 13% 29% 48% 48% 59%
Performance-based incentives 49% 29% 27% 22% 43% 65% 75%
Other 1% 0% 0% 0% 0% 0% 3%
All Others
Count 122 7 15 24 21 23 32
Transaction-based incentives 20% 14% 7% 8% 14% 30% 34%
Performance-based incentives 36% 14% 33% 13% 43% 52% 44%
Other 3% 0% 0% 0% 5% 0% 9%

Special Benefits
2014 DMO Compensation & Benefits Study 119 Destination & Travel Foundation
Total Revenue
All
Respondents $0 to
$499,999 $500,000 to
$999,999 $1,000,000 to
$1,999,999 $2,000,000 to
$3,999,999 $4,000,000 to
$9,999,999 $10 million
or more
Q1c. General criteria for variable cash com-pensation offered by functional area:
CEO
Transaction-based:
Count 121 7 15 23 21 23 32
Room nights 21% 14% 0% 9% 29% 17% 38%
Sales Leads 10% 0% 7% 9% 10% 4% 19%
Bookings 8% 0% 0% 4% 14% 4% 16%
New member dues 5% 0% 0% 0% 10% 4% 9%
Member retention 4% 0% 0% 0% 5% 4% 9%
Number of new members 3% 0% 0% 0% 5% 0% 9%
Website traffic 2% 0% 0% 2% 2% 0% 9%
Ad Sales 1% 0% 0% 0% 2% 0% 2%
Other 3% 0% 0% 4% 0% 0% 9%
Performance-based:
Board set objectives 55% 0% 33% 39% 67% 74% 69%
DMO performance 51% 29% 20% 26% 57% 70% 72%
Personal performance objectives 44% 29% 20% 17% 43% 61% 66%

Special Benefits
2014 DMO Compensation & Benefits Study 120 Destination & Travel Foundation
Total Revenue
All
Respondents $0 to
$499,999 $500,000 to
$999,999 $1,000,000 to
$1,999,999 $2,000,000 to
$3,999,999 $4,000,000 to
$9,999,999 $10 million
or more
Sales-Conventions
Transaction-based:
Count 121 7 15 23 21 23 32
Room nights 48% 29% 13% 30% 43% 65% 72%
Sales Leads 33% 14% 13% 17% 24% 48% 53%
Bookings 31% 14% 13% 17% 19% 48% 47%
Website traffic 0% 0% 2% 0% 0% 0% 0%
Ad Sales 0% 0% 0% 0% 2% 0% 0%
Number of new members 0% 0% 0% 0% 0% 0% 0%
New member dues 0% 0% 0% 0% 0% 0% 0%
Member retention 0% 0% 0% 0% 0% 0% 0%
Other 2% 0% 0% 0% 0% 4% 6%
Performance-based:
Personal performance objectives 31% 29% 7% 13% 33% 30% 53%
DMO performance 16% 0% 7% 13% 14% 22% 22%
Board set objective(s) 11% 14% 7% 9% 14% 13% 9%

Special Benefits
2014 DMO Compensation & Benefits Study 121 Destination & Travel Foundation
Total Revenue
All
Respondents $0 to
$499,999 $500,000 to
$999,999 $1,000,000 to
$1,999,999 $2,000,000 to
$3,999,999 $4,000,000 to
$9,999,999 $10 million
or more
Q1c. General criteria for variable cash com-pensation offered by functional area: (cont.)
Sales-Tourism/Leisure
Transaction-based:
Count 121 7 15 23 21 23 32
Sales Leads 24% 14% 20% 13% 14% 39% 31%
Room nights 22% 14% 7% 17% 19% 30% 31%
Bookings 19% 0% 13% 13% 14% 35% 22%
Website traffic 1% 0% 2% 0% 4% 0% 2%
Ad Sales 1% 0% 0% 0% 2% 3% 2%
Number of new members 0% 0% 0% 0% 0% 0% 0%
New member dues 0% 0% 0% 0% 0% 0% 0%
Member retention 0% 0% 0% 0% 0% 0% 0%
Other 1% 0% 0% 0% 0% 0% 3%
Performance-based:
Personal performance objectives 26% 14% 20% 4% 19% 30% 50%
DMO performance 13% 0% 13% 4% 14% 17% 19%
Board set objective(s) 8% 0% 7% 0% 14% 13% 9%

Special Benefits
2014 DMO Compensation & Benefits Study 122 Destination & Travel Foundation
Total Revenue
All
Respondents $0 to
$499,999 $500,000 to
$999,999 $1,000,000 to
$1,999,999 $2,000,000 to
$3,999,999 $4,000,000 to
$9,999,999 $10 million
or more
Q1c. General criteria for variable cash com-pensation offered by functional area: (cont.)
Sales-Membership
Transaction-based:
Count 121 7 15 23 21 23 32
New member dues 25% 0% 7% 4% 24% 30% 50%
Member retention 22% 0% 13% 4% 24% 26% 41%
Number of new members 19% 0% 7% 4% 14% 22% 41%
Sales Leads 4% 0% 0% 4% 5% 0% 9%
Ad Sales 4% 0% 4% 0% 7% 0% 9%
Room nights 3% 0% 0% 9% 0% 0% 6%
Website traffic 1% 0% 0% 0% 0% 0% 4%
Bookings 1% 0% 0% 4% 0% 0% 0%
Other 6% 0% 0% 0% 5% 0% 19%
Performance-based:
Personal performance objectives 20% 14% 7% 9% 14% 22% 38%
DMO performance 10% 0% 7% 0% 10% 17% 16%
Board set objective(s) 7% 0% 7% 4% 10% 13% 6%

Special Benefits
2014 DMO Compensation & Benefits Study 123 Destination & Travel Foundation
Total Revenue
All
Respondents $0 to
$499,999 $500,000 to
$999,999 $1,000,000 to
$1,999,999 $2,000,000 to
$3,999,999 $4,000,000 to
$9,999,999 $10 million
or more
Q1c. General criteria for variable cash com-pensation offered by functional area: (cont.)
Marketing
Transaction-based:
Count 121 7 15 23 21 23 32
Website traffic 7% 3% 4% 0% 4% 10% 22%
Ad Sales 6% 0% 4% 2% 6% 5% 16%
Room nights 5% 14% 0% 0% 5% 0% 13%
Sales Leads 2% 0% 0% 0% 0% 4% 3%
Bookings 2% 0% 0% 0% 5% 0% 6%
Number of new members 2% 0% 0% 0% 0% 0% 6%
New member dues 2% 0% 0% 4% 0% 0% 3%
Member retention 1% 0% 0% 0% 0% 0% 3%
Other 4% 0% 0% 4% 5% 0% 9%
Performance-based:
Personal performance objectives 34% 14% 20% 9% 43% 39% 53%
DMO performance 17% 0% 20% 9% 14% 26% 19%
Board set objective(s) 9% 0% 7% 9% 14% 13% 6%
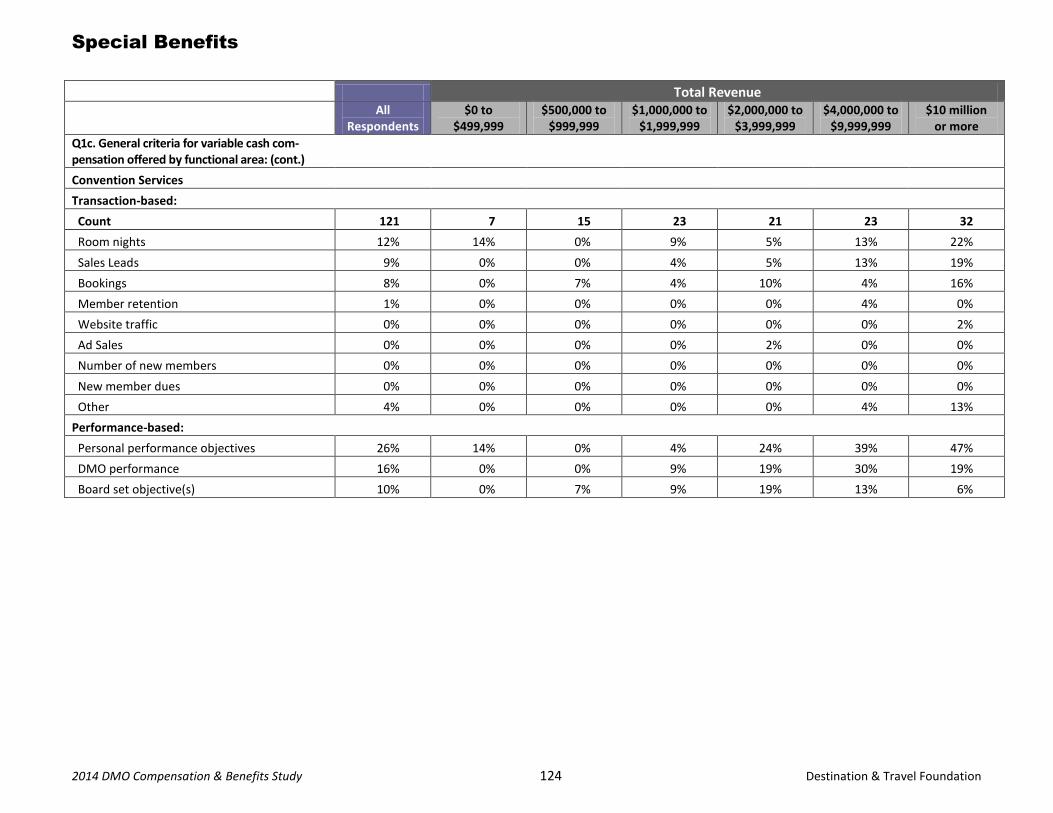
Special Benefits
2014 DMO Compensation & Benefits Study 124 Destination & Travel Foundation
Total Revenue
All
Respondents $0 to
$499,999 $500,000 to
$999,999 $1,000,000 to
$1,999,999 $2,000,000 to
$3,999,999 $4,000,000 to
$9,999,999 $10 million
or more
Q1c. General criteria for variable cash com-pensation offered by functional area: (cont.)
Convention Services
Transaction-based:
Count 121 7 15 23 21 23 32
Room nights 12% 14% 0% 9% 5% 13% 22%
Sales Leads 9% 0% 0% 4% 5% 13% 19%
Bookings 8% 0% 7% 4% 10% 4% 16%
Member retention 1% 0% 0% 0% 0% 4% 0%
Website traffic 0% 0% 0% 0% 0% 0% 2%
Ad Sales 0% 0% 0% 0% 2% 0% 0%
Number of new members 0% 0% 0% 0% 0% 0% 0%
New member dues 0% 0% 0% 0% 0% 0% 0%
Other 4% 0% 0% 0% 0% 4% 13%
Performance-based:
Personal performance objectives 26% 14% 0% 4% 24% 39% 47%
DMO performance 16% 0% 0% 9% 19% 30% 19%
Board set objective(s) 10% 0% 7% 9% 19% 13% 6%

Special Benefits
2014 DMO Compensation & Benefits Study 125 Destination & Travel Foundation
Total Revenue
All
Respondents $0 to
$499,999 $500,000 to
$999,999 $1,000,000 to
$1,999,999 $2,000,000 to
$3,999,999 $4,000,000 to
$9,999,999 $10 million
or more
Q1c. General criteria for variable cash com-pensation offered by functional area: (cont.)
Communications
Transaction-based:
Count 121 7 15 23 21 23 32
Sales Leads 2% 0% 0% 0% 5% 0% 3%
Website traffic 2% 0% 0% 0% 0% 3% 11%
Room nights 2% 0% 0% 0% 0% 0% 9%
Ad Sales 1% 0% 0% 0% 2% 0% 2%
Bookings 0% 0% 0% 0% 0% 0% 0%
Number of new members 0% 0% 0% 0% 0% 0% 0%
New member dues 0% 0% 0% 0% 0% 0% 0%
Member retention 0% 0% 0% 0% 0% 0% 0%
Other 5% 0% 0% 0% 5% 4% 13%
Performance-based:
Personal performance objectives 25% 0% 7% 0% 24% 39% 47%
DMO performance 12% 0% 7% 4% 14% 22% 16%
Board set objective(s) 10% 0% 7% 4% 19% 13% 9%

Special Benefits
2014 DMO Compensation & Benefits Study 126 Destination & Travel Foundation
Total Revenue
All
Respondents $0 to
$499,999 $500,000 to
$999,999 $1,000,000 to
$1,999,999 $2,000,000 to
$3,999,999 $4,000,000 to
$9,999,999 $10 million
or more
Q1c. General criteria for variable cash com-pensation offered by functional area: (cont.)
Finance/Accounting
Transaction-based:
Count 121 7 15 23 21 23 32
Room nights 2% 0% 0% 0% 0% 0% 9%
Sales Leads 1% 0% 0% 0% 0% 0% 3%
Bookings 1% 0% 0% 0% 0% 0% 3%
Number of new members 1% 0% 0% 0% 0% 0% 3%
New member dues 1% 0% 0% 0% 0% 0% 3%
Website traffic 0% 0% 0% 0% 0% 0% 0%
Ad Sales 0% 0% 0% 0% 2% 0% 0%
Member retention 0% 0% 0% 0% 0% 0% 0%
Other 4% 0% 0% 0% 5% 9% 6%
Performance-based:
Personal performance objectives 30% 14% 7% 4% 38% 43% 47%
DMO performance 18% 0% 7% 9% 29% 30% 19%
Board set objective(s) 9% 0% 0% 4% 24% 13% 6%

Special Benefits
2014 DMO Compensation & Benefits Study 127 Destination & Travel Foundation
Total Revenue
All
Respondents $0 to
$499,999 $500,000 to
$999,999 $1,000,000 to
$1,999,999 $2,000,000 to
$3,999,999 $4,000,000 to
$9,999,999 $10 million
or more
Q1c. General criteria for variable cash com-pensation offered by functional area: (cont.)
Visitor Services
Transaction-based:
Count 121 7 15 23 21 23 32
Room nights 4% 14% 0% 0% 5% 4% 6%
Bookings 2% 0% 0% 0% 5% 0% 3%
Sales Leads 1% 0% 0% 0% 0% 4% 0%
Website traffic 1% 0% 0% 0% 4% 0% 0%
Ad Sales 0% 0% 0% 0% 2% 0% 0%
Number of new members 0% 0% 0% 0% 0% 0% 0%
New member dues 0% 0% 0% 0% 0% 0% 0%
Member retention 0% 0% 0% 0% 0% 0% 0%
Other 2% 0% 0% 4% 5% 0% 3%
Performance-based:
Personal performance objectives 23% 14% 7% 4% 19% 39% 38%
DMO performance 11% 0% 7% 9% 10% 17% 13%
Board set objective(s) 8% 0% 7% 4% 14% 13% 6%

Special Benefits
2014 DMO Compensation & Benefits Study 128 Destination & Travel Foundation
Total Revenue
All
Respondents $0 to
$499,999 $500,000 to
$999,999 $1,000,000 to
$1,999,999 $2,000,000 to
$3,999,999 $4,000,000 to
$9,999,999 $10 million
or more
Q1c. General criteria for variable cash com-pensation offered by functional area: (cont.)
Technology
Transaction-based:
Count 121 7 15 23 21 23 32
Room nights 2% 0% 0% 0% 0% 0% 6%
Bookings 1% 0% 0% 0% 0% 0% 3%
Number of new members 1% 0% 0% 0% 0% 0% 3%
Sales Leads 0% 0% 0% 0% 0% 0% 0%
Website traffic 0% 0% 0% 0% 0% 0% 0%
Ad Sales 0% 0% 0% 0% 2% 0% 0%
New member dues 0% 0% 0% 0% 0% 0% 0%
Member retention 0% 0% 0% 0% 0% 0% 0%
Other 0% 0% 0% 0% 0% 0% 0%
Performance-based:
Personal performance objectives 18% 0% 7% 0% 19% 26% 34%
DMO performance 10% 0% 7% 0% 14% 17% 13%
Board set objective(s) 6% 0% 0% 0% 14% 9% 6%

Special Benefits
2014 DMO Compensation & Benefits Study 129 Destination & Travel Foundation
Total Revenue
All
Respondents $0 to
$499,999 $500,000 to
$999,999 $1,000,000 to
$1,999,999 $2,000,000 to
$3,999,999 $4,000,000 to
$9,999,999 $10 million
or more
Q1d. Basis and calculation of variable cash compensation
Percent Using Percent of Salary
Count 121 7 15 23 21 23 32
CEO 46% 14% 27% 26% 38% 61% 72%
Sales-conventions 40% 14% 13% 17% 24% 61% 69%
Marketing 31% 14% 20% 9% 29% 43% 50%
Sales-Tourism/Leisure 29% 14% 13% 4% 19% 43% 53%
Finance/accounting 29% 14% 0% 9% 29% 48% 47%
Convention services 26% 14% 0% 4% 19% 43% 47%
Communications 23% 0% 0% 4% 19% 35% 47%
Sales-membership 21% 0% 13% 4% 10% 30% 44%
Visitor services 19% 14% 0% 0% 19% 26% 38%
Technology 17% 0% 0% 0% 5% 22% 47%
Other 6% 0% 0% 9% 0% 13% 6%
Q1d. If percent of salary, what is the range?
CEO
Low (median) 0 * * 1 1 0 0
High (median) 25 * * 15 16 25 30
Sales-conventions
Low (median) 0 * * * * 0 0
High (median) 20 * * * 10 20 25
Sales-travel trade
Low (median) 0 * * * * 0 0
High (median) 15 * * * 10 15 18
Sales-membership
Low (median) 1 * * * * 0 2
High (median) 10 * * * * 15 10
*A minimum of four responses required to show median data.

Special Benefits
2014 DMO Compensation & Benefits Study 130 Destination & Travel Foundation
Total Revenue
All
Respondents $0 to
$499,999 $500,000 to
$999,999 $1,000,000 to
$1,999,999 $2,000,000 to
$3,999,999 $4,000,000 to
$9,999,999 $10 million
or more
Q1d. If percent of salary, what is the range? (cont.)
CEO (cont.)
Marketing
Low (median) 0 * * * 0 0 1
High (median) 13 * * * 10 8 15
Convention services
Low (median) 0 * * * * 0 0
High (median) 11 * * * 10 11 12
Communications/PR
Low (median) 0 * * * * 0 1
High (median) 14 * * * * 10 15
Finance/Accounting
Low (median) 0 * * * * 0 1
High (median) 15 * * * 12 15 15
Visitor services
Low (median) 0 * * * * 0 0
High (median) 6 * * * * 5 6
Technology
Low (median) 0 * * * * * 0
High (median) 10 * * * * 13 10
Other
Low (median) 0 * * * * * *
High (median) 13 * * * * 10 *
*A minimum of four responses required to show median data.

Special Benefits
2014 DMO Compensation & Benefits Study 131 Destination & Travel Foundation
Total Revenue
All
Respondents $0 to
$499,999 $500,000 to
$999,999 $1,000,000 to
$1,999,999 $2,000,000 to
$3,999,999 $4,000,000 to
$9,999,999 $10 million
or more
Percent Using Fixed Dollar Amount
Count 121 7 15 23 21 23 32
Sales-conventions 17% 14% 0% 17% 29% 22% 13%
CEO 13% 0% 7% 13% 29% 17% 6%
Sales-travel trade 11% 0% 7% 9% 19% 13% 9%
Marketing 11% 0% 7% 4% 38% 4% 6%
Sales-membership 8% 0% 0% 9% 24% 0% 9%
Convention services 8% 0% 7% 0% 14% 9% 13%
Finance/accounting 8% 0% 13% 0% 24% 0% 9%
Visitor services 7% 0% 13% 0% 19% 9% 3%
Communications/PR 7% 0% 7% 0% 19% 4% 6%
Technology 4% 0% 7% 0% 10% 0% 6%
Other 5% 14% 0% 4% 10% 9% 0%
Q1d. Bonus based on:
CEO
Count 64 1 5 8 11 16 23
Individual 17% 0% 0% 38% 9% 25% 13%
Team 9% 0% 0% 25% 9% 13% 4%
Both 73% 100% 100% 38% 82% 63% 83%
Sales-conventions
Count 65 2 3 7 10 17 26
Individual 31% 50% 33% 43% 70% 12% 23%
Team 2% 0% 0% 14% 0% 0% 0%
Both 68% 50% 67% 43% 30% 88% 77%

Special Benefits
2014 DMO Compensation & Benefits Study 132 Destination & Travel Foundation
Total Revenue
All
Respondents $0 to
$499,999 $500,000 to
$999,999 $1,000,000 to
$1,999,999 $2,000,000 to
$3,999,999 $4,000,000 to
$9,999,999 $10 million
or more
Q1d. Bonus based on: (cont.)
Sales-travel trade
Count 49 1 4 3 7 13 21
Individual 37% 0% 0% 67% 57% 31% 38%
Team 0% 0% 0% 0% 0% 0% 0%
Both 63% 100% 100% 33% 43% 69% 62%
Sales-membership
Count 40 0 2 2 7 9 20
Individual 45% * 100% 100% 71% 33% 30%
Team 5% * 0% 0% 0% 0% 10%
Both 50% * 0% 0% 29% 67% 60%
Marketing
Count 53 1 3 3 13 12 21
Individual 32% 0% 0% 67% 38% 42% 24%
Team 8% 0% 0% 33% 0% 8% 10%
Both 60% 100% 100% 0% 62% 50% 67%
Convention services
Count 44 1 1 1 7 13 21
Individual 25% 0% 0% 0% 71% 8% 24%
Team 14% 0% 0% 100% 0% 15% 14%
Both 61% 100% 100% 0% 29% 77% 62%
Communications/PR
Count 38 0 1 1 7 10 19
Individual 32% * 0% 0% 57% 40% 21%
Team 11% * 0% 100% 0% 10% 11%
Both 58% * 100% 0% 43% 50% 68%
*A minimum of four responses required to show median data.
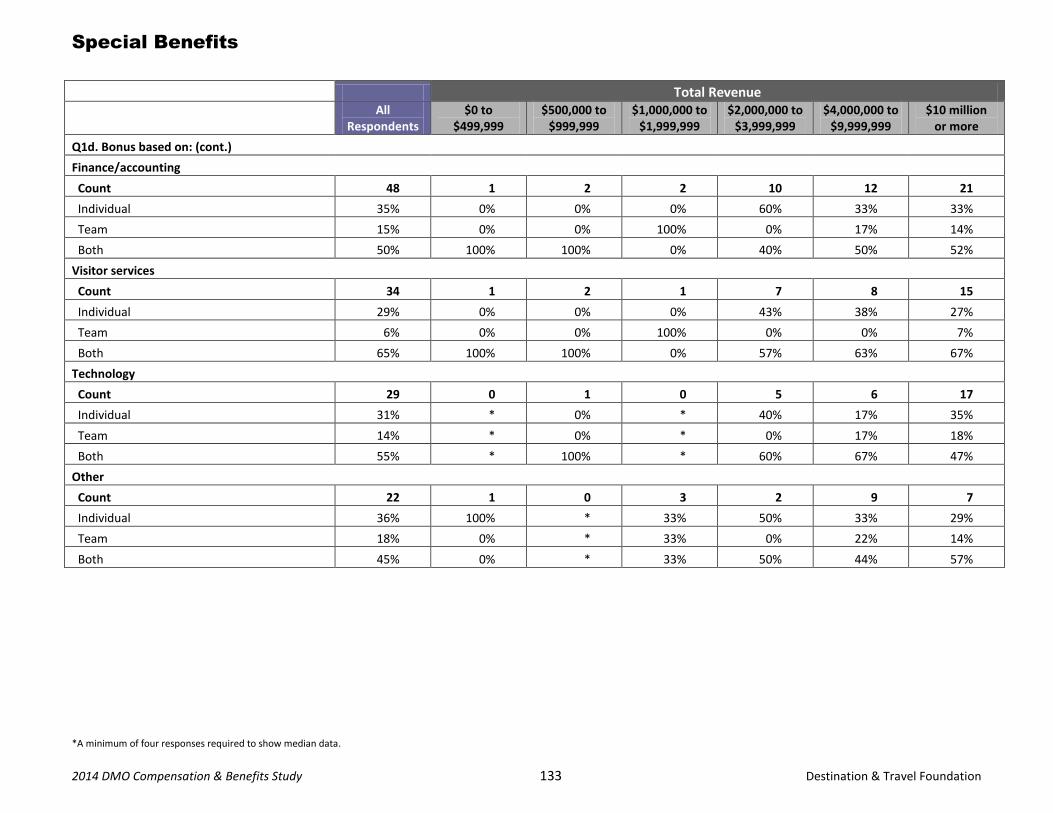
Special Benefits
2014 DMO Compensation & Benefits Study 133 Destination & Travel Foundation
Total Revenue
All
Respondents $0 to
$499,999 $500,000 to
$999,999 $1,000,000 to
$1,999,999 $2,000,000 to
$3,999,999 $4,000,000 to
$9,999,999 $10 million
or more
Q1d. Bonus based on: (cont.)
Finance/accounting
Count 48 1 2 2 10 12 21
Individual 35% 0% 0% 0% 60% 33% 33%
Team 15% 0% 0% 100% 0% 17% 14%
Both 50% 100% 100% 0% 40% 50% 52%
Visitor services
Count 34 1 2 1 7 8 15
Individual 29% 0% 0% 0% 43% 38% 27%
Team 6% 0% 0% 100% 0% 0% 7%
Both 65% 100% 100% 0% 57% 63% 67%
Technology
Count 29 0 1 0 5 6 17
Individual 31% * 0% * 40% 17% 35%
Team 14% * 0% * 0% 17% 18%
Both 55% * 100% * 60% 67% 47%
Other
Count 22 1 0 3 2 9 7
Individual 36% 100% * 33% 50% 33% 29%
Team 18% 0% * 33% 0% 22% 14%
Both 45% 0% * 33% 50% 44% 57%
*A minimum of four responses required to show median data.

Special Benefits
2014 DMO Compensation & Benefits Study 134 Destination & Travel Foundation
Total Revenue
All
Respondents $0 to
$499,999 $500,000 to
$999,999 $1,000,000 to
$1,999,999 $2,000,000 to
$3,999,999 $4,000,000 to
$9,999,999 $10 million
or more
Q2. Percent of DMOs that reimburse for the following expenses:
CEO
Count 301 40 53 60 54 39 55
Fees for meetings/conferences 85% 73% 74% 87% 93% 85% 98%
Education programs and/or seminars 78% 63% 66% 80% 81% 87% 87%
Association membership dues 76% 55% 62% 77% 81% 90% 91%
Industry certification courses 68% 53% 58% 72% 69% 79% 76%
Mobile data package 67% 58% 55% 75% 69% 77% 69%
Smart phone 67% 48% 57% 67% 74% 82% 75%
Mileage reimbursement 54% 55% 47% 65% 44% 54% 56%
Paid parking 50% 28% 42% 50% 46% 67% 64%
Transportation allowance 29% 13% 21% 25% 43% 38% 35%
Relocation expenses 27% 0% 15% 18% 28% 51% 47%
College continuing education programs 25% 10% 15% 25% 24% 23% 45%
Automobile provided 24% 13% 11% 27% 22% 36% 35%
Severance package 24% 0% 15% 17% 28% 28% 49%
City club membership 12% 5% 4% 12% 6% 21% 25%
Health club membership 11% 3% 13% 3% 9% 15% 20%
Internet access at home 10% 0% 8% 15% 9% 5% 18%
Country club membership 7% 0% 2% 3% 6% 15% 16%
Spouse/parnter travel 7% 0% 2% 2% 4% 13% 20%

Special Benefits
2014 DMO Compensation & Benefits Study 135 Destination & Travel Foundation
Total Revenue
All
Respondents $0 to
$499,999 $500,000 to
$999,999 $1,000,000 to
$1,999,999 $2,000,000 to
$3,999,999 $4,000,000 to
$9,999,999 $10 million
or more
Q2. Percent of DMOs that reimburse for the following expenses: (cont.)
Senior/Middle Management
Count 301 40 53 60 54 39 55
Fees for meetings/conferences 71% 28% 53% 73% 83% 85% 98%
Education programs and/or seminars 68% 25% 47% 68% 78% 87% 95%
Association membership dues 63% 18% 36% 58% 81% 87% 91%
Mileage reimbursement 61% 25% 42% 72% 61% 82% 78%
Industry certification courses 60% 25% 43% 58% 65% 79% 84%
Smart phone 53% 18% 36% 53% 59% 79% 71%
Mobile data package 52% 15% 36% 53% 65% 69% 67%
Paid parking 42% 8% 30% 43% 41% 64% 60%
College continuing education programs 22% 5% 11% 20% 20% 26% 45%
Severance package 14% 0% 6% 10% 7% 18% 38%
Relocation expenses 13% 0% 4% 3% 13% 38% 25%
Transportation allowance 13% 5% 11% 8% 9% 15% 25%
Internet at home 9% 0% 8% 8% 9% 3% 20%
Health club membership 5% 3% 6% 3% 6% 8% 7%
Automobile provided 4% 0% 2% 3% 4% 8% 7%
City club membership 3% 0% 2% 7% 2% 3% 4%
Country club membership 1% 0% 0% 2% 2% 0% 2%
Spouse/parnter travel 1% 0% 2% 2% 0% 0% 0%

Special Benefits
2014 DMO Compensation & Benefits Study 136 Destination & Travel Foundation
Total Revenue
All
Respondents $0 to
$499,999 $500,000 to
$999,999 $1,000,000 to
$1,999,999 $2,000,000 to
$3,999,999 $4,000,000 to
$9,999,999 $10 million
or more
Q2. Percent of DMOs that reimburse for the following expenses: (cont.)
All Others
Count 301 40 53 60 54 39 55
Fees for meetings/conferences 70% 35% 57% 75% 81% 82% 84%
Mileage reimbursement 66% 40% 45% 75% 72% 82% 80%
Education programs and/or seminars 66% 28% 51% 65% 76% 82% 91%
Industry certification courses 52% 23% 38% 53% 57% 64% 71%
Association membership dues 51% 20% 36% 53% 63% 62% 64%
Paid parking 36% 10% 28% 43% 41% 59% 35%
Mobile data package 26% 13% 21% 28% 26% 28% 35%
Smart phone 22% 8% 17% 27% 22% 28% 25%
College continuing education programs 21% 3% 6% 23% 20% 23% 45%
Severance package 8% 0% 4% 7% 4% 13% 22%
Transportation allowance 7% 8% 9% 3% 6% 5% 9%
Health club membership 6% 3% 8% 3% 6% 8% 7%
Internet access at home 4% 0% 4% 8% 7% 0% 4%
Relocation expenses 3% 0% 0% 2% 2% 10% 7%
Automobile provided 3% 5% 0% 5% 4% 3% 0%
City club membership 2% 0% 0% 7% 0% 3% 2%
Spouse/parnter travel 2% 0% 4% 3% 2% 0% 0%
Country club membership 1% 0% 0% 3% 0% 0% 2%
Q3. Who gets the points/miles accumulated by employees who take part in travel/loyalty programs?
Count 257 27 43 51 48 36 52
DMO 32% 19% 30% 37% 38% 31% 31%
Employee 68% 81% 70% 63% 63% 69% 69%

Contracts and Performance Evaluation
(CEOs only)
2014 DMO Compensation & Benefits Study 137 Destination & Travel Foundation
Contracts and Performance Evaluation (for CEOs only)
Total Revenue
All Respondents $0 to
$499,999 $500,000 to
$999,999 $1,000,000 to
$1,999,999 $2,000,000 to
$3,999,999 $4,000,000 to
$9,999,999 $10 million
or more
Q1. Type of arrangement for retaining CEO
Count 278 34 46 56 51 37 54
Formal contract 40% 21% 26% 23% 47% 65% 57%
Letter of agreement 13% 9% 9% 18% 14% 16% 11%
Verbal arrangement only 11% 21% 17% 16% 10% 0% 2%
Retained by resolution of the board 10% 15% 15% 11% 14% 0% 4%
Other 3% 0% 4% 4% 0% 5% 2%
No contract 24% 35% 28% 29% 16% 14% 24%
Q2. Duration of contract
Count 112 8 11 13 23 25 32
Median (years) 3 2 3 3 3 3 3
Q3a. Clause allowing the DMO to terminate before specified number of years
Count 142 9 16 21 27 30 39
Yes 77% 67% 69% 62% 78% 83% 85%
No 23% 33% 31% 38% 22% 17% 15%
Q3b. If yes, how much notice must be given before termination?
Count 104 6 11 13 21 21 32
Median (months) 2 2 1 1 2 2 1
Q4a. Clause allowing the provision of severance pay
Count 139 9 15 20 28 30 37
Yes 64% 22% 53% 45% 71% 77% 73%
No 36% 78% 47% 55% 29% 23% 27%

Contracts and Performance Evaluation
(CEOs only)
2014 DMO Compensation & Benefits Study 138 Destination & Travel Foundation
Total Revenue
All Respondents $0 to
$499,999 $500,000 to
$999,999 $1,000,000 to
$1,999,999 $2,000,000 to
$3,999,999 $4,000,000 to
$9,999,999 $10 million
or more
Q4b. If yes, what is the basis for severance pay?
Count 82 1 8 8 18 22 25
Salary paid for a set period 72% 100% 50% 88% 61% 82% 72%
Lump sum 2% 0% 0% 0% 6% 5% 0%
Proportion of salary based on length of employment 12% 0% 38% 0% 6% 9% 16%
Other 13% 0% 13% 13% 28% 5% 12%
Q4b. If salary paid for a set period, how long?
Count 65 1 4 8 14 19 19
Median (months) 6 * 5 6 6 6 12
Q5a. Clause specifying benefits provided after retirement
Count 136 9 14 18 28 30 37
Yes 9% 0% 7% 6% 4% 7% 19%
No 91% 100% 93% 94% 96% 93% 81%
Q5b. If yes, benefits provided under the clause
Count 13 0 1 1 2 2 7
Medical insurance 85% * 100% 100% 100% 100% 71%
Dental insurance 64% * 100% 100% 100% 50% 50%
Life insurance 54% * 100% 100% 100% 0% 43%
V ision insurance 50% * 0% 100% 100% 50% 38%
Other 8% * 0% 0% 0% 0% 14%
Q6a. Clause specifying annual vacation granted to the CEO?
Count 138 8 14 20 27 30 39
Yes 77% 63% 93% 65% 85% 67% 82%
No 23% 38% 7% 35% 15% 33% 18%
*A minimum of four responses required to show median data.

Contracts and Performance Evaluation
(CEOs only)
2014 DMO Compensation & Benefits Study 139 Destination & Travel Foundation
Total Revenue
All Respondents $0 to
$499,999 $500,000 to
$999,999 $1,000,000 to
$1,999,999 $2,000,000 to
$3,999,999 $4,000,000 to
$9,999,999 $10 million
or more
Q6b. If yes, how many days?
Count 99 5 12 12 21 19 30
Median (days) 20 16 20 21 20 20 20
Q7. Who reviews the performance of the CEO?
Count 267 31 44 54 50 37 51
Executive committee 49% 48% 55% 52% 58% 49% 33%
Board of Directors 23% 35% 23% 24% 24% 19% 18%
Performance review committee 10% 3% 7% 7% 8% 14% 18%
Government official 5% 0% 7% 7% 0% 3% 12%
Chamber of Commerce President 3% 3% 2% 6% 4% 3% 0%
Q8. What is used as the basis for evaluating the CEO?
Count 265 31 43 55 49 36 51
Predetermined objectives 76% 52% 74% 60% 80% 97% 90%
Job description 61% 81% 65% 82% 53% 47% 39%
Other 8% 13% 9% 7% 6% 6% 6%
Q8b. If the CEO is evaluated by objectives, who sets the objectives?
Count 197 16 31 33 39 35 43
Executive committee 43% 44% 35% 55% 41% 43% 42%
Board of Directors 26% 25% 23% 24% 33% 31% 19%
Combination of above 11% 6% 26% 6% 15% 9% 5%
Performance review committee 7% 6% 6% 3% 3% 9% 12%
Government official 3% 0% 0% 3% 0% 3% 7%

Contracts and Performance Evaluation
(CEOs only)
2014 DMO Compensation & Benefits Study 140 Destination & Travel Foundation
Total Revenue
All Respondents $0 to
$499,999 $500,000 to
$999,999 $1,000,000 to
$1,999,999 $2,000,000 to
$3,999,999 $4,000,000 to
$9,999,999 $10 million
or more
Q9. What is the average annual amount paid by the DMO, on behalf of the CEO, for the following expenses?
Automobile provided
Count 83 4 11 18 14 17 19
Median amount $6,000 $3,300 $4,800 $4,900 $6,000 $7,469 $9,000
Country club membership
Count 11 0 0 0 2 5 4
Median amount $5,400 * * * * $6,000 $5,700
City club membership
Count 30 1 3 5 7 5 9
Median amount $1,225 * * $600 $1,000 $1,200 $3,000
Health club membership
Count 25 1 4 2 2 6 10
Median amount $600 * $552 * * $600 $1,050
Smart phone
Count 210 22 39 49 36 32 32
Median amount $1,120 $1,006 $1,164 $1,000 $1,200 $1,100 $1,200
Spouse/partner travel
Count 68 4 15 15 11 9 14
Median amount $0 $0 $0 $0 $0 $0 $75
Transportation allowance
Count 71 4 6 12 21 14 14
Median amount $6,000 $2,000 $4,900 $4,038 $6,000 $7,200 $8,700
Q10. Median deferred compensation paid to CEO for most recently completed fiscal year:
Count 27 1 2 5 4 5 10
Median amount $17,000 * * $10,500 $21,250 $16,500 $20,000
*A minimum of four responses required to show median data.
2014 DMO Compensation & Benefits Study 141 Destination & Travel Foundation
Appendix

2014 DMO Compensation & Benefits Study 142 Destination & Travel Foundation
Appendix
Job Descriptions
EXECUTIVE
President/CEO/Executive Director: Directs and leads DMO. Works directly with/for Board or governing body on policy making and strategy for organization. Primary spokesperson for organization. Direct reports typically are department heads of Convention Sales, Travel Trade Sales, Membership, Finance/Administration, Marketing and Communications.
Deputy Director/COO: In larger DMOs, assists CEO in managing DMO operations and implementing policies and procedures. May provide staff support to Board, committees and outside organizations and can represent DMO as spokesperson.
SALES AND MARKETING
EVP, Sales & Marketing: Leads sales and marketing departments. Identifies market opportunities and develops short- and long-term marketing. Direct reports can include top positions in Convention and Travel Trade Sales, Marketing and Communications.
VP, Convention Sales: Manages convention sales and occasionally services. Identifies opportunities, formulates sales strategies and develops sales training programs. May handle top/priority accounts. Direct reports include senior sales managers and Director of Convention Services.
Director, Convention Sales: May have similar line responsibilities as VP, Convention Sales. Typically handles full sales account load.
National/Senior Sales Manager: Senior sales position, generally without management responsibilities (with exception of administrative support). Handles major accounts.
Convention Sales Manager: Experienced sales manager handling mid-size/priority accounts. Typically, no management responsibilities.
Convention Sales/Account Executive: Entry level position. Handles smaller meetings and, in some cases, telemarketing responsibilities.
Satellite Office Manager: Similar experience and duties as National/Senior Sales Manager. Usually responsible for management of support staff, activities for and budget of satellite office.
Sales/Promotion Coordinator: Provides assistance to sales managers with leads, bid books, presentations, proposals, FAM tours, site visits, trade show promotions, etc. May produce performance reports and convention calendars
Director/Manager, Convention Services: Organizes, coordinates and directs all operations, programs and personnel required for servicing meetings, conventions and trade shows. Works with meeting planners to determine servicing requirements.
Director/Manager, Housing Services: Coordinates attendee housing blocks and reservation confirmations. Manages housing relationships and needs of hotel and planners/attendees.
Housing Clerk: Assists Director of Housing. Oversees data entry of reservations and dealing with delegate requests.
VP/Director, Tourism/Leisure Sales: Similar line responsibilities and management duties as VP, Convention Sales but for tourism/travel trade sales. In some cases, supervises Visitor Information/Services operations of DMO.
National/Senior Tourism Sales Manager: Similar duties as National/Senior Convention Sales Manager but for tourism/travel trade sales.
Tourism Sales Manager: Similar duties as Convention Sales Manager but for tourism/travel trade sales.
Manager, Visitor Services/Information: Responsible for managing all operations and personnel associated with visitor services/information outlet(s).
Visitor Services Specialist: Act as visitor services greeter to all individuals requesting information on destination.
Chief Marketing Officer/VP, Marketing: Develops and manages the marketing activities for the DMO that relate to developing trade and consumer visitor markets for the destination. Typically works with DMO’s advertising agency.
Director of Marketing: Similar line responsibilities as VP, Marketing. Develops and implements strategic and tactical marketing programs. May manage other Marketing staff.
Manager of Online Marketing/eMarketing: Manages DMO website including design and functionality . Develops and manages online marketing and interactive initiatives. Works closely with web and advertising staff/vendors.
Director/Manager of Multicultural Tourism: Markets and sells the destination as a multicultural destination for leisure and meetings/convention visitors.
Director/Manager of Sports Marketing/Sales: Directs and performs sales and marketing required to solicit and book athletic events for the destination.
Manager, Product/Special Event Development: Develops special marketing projects and activities including merchandising, industry and special event promotions, etc.
Director/Manager, Research: Responsible for developing and implementing statistical or content research required by DMO to reach its goals/mission.
Content Marketing Manager/Social Media Specialist: Develops and manages website content and other applications including social media, e-newsletters, etc.

2014 DMO Compensation & Benefits Study 143 Destination & Travel Foundation
COMMUNICATIONS
VP, Communications: Identifies communication opportunities. Directs all PR and communications functions. Acts as DMO spokesperson. Direct reports may include Director/Manager of Communications/Public Relations, Director/ Manager, Publications.
Director/Manager of Communications/Public Relations: May have similar line responsibilities as VP, Communications. May act as film commissioner and/or publications manager. May manage other Communications/Publications staff.
Director/Manager, Publications: Directs DMO’s publications program including advertising, production, editorial, etc. May manage support personnel.
Publications/Graphic Designer: Develops and manages in-house publications, sales/ marketing/promotional materials and graphic designs for DMO publications. Strong expertise in desktop publishing software.
Director/Manager, Community Relations: Serves as DMO’s liaison to chambers of commerce, environmental groups, business associations, historical groups, educational institutions, governmental officials and other groups as directed.
Film Commissioner: Responsible for promoting destination as a location for shooting feature films, commercials, and other film/video projects.
Communications/PR Coordinator/Assistant: Assists Communications and/or Publications managers with performing support duties such as writing, photo selection, etc.
MEMBERSHIP/BUSINESS DEVELOPMENT/PARTNERSHIP DEVELOPMENT
VP, Membership: Identifies new member benefits and services opportunities. May develop sales training programs. Can handle top member accounts. Direct reports may include Director/Manager, Membership.
Director, Membership: May have similar line responsibilities as VP, Membership. Directs and manages membership programs. May manage other Membership staff.
Membership Sales Manager: Sells DMO to potential members and develops/maintains relationships with current members.
Membership Services Manager: Organizes and coordinates all operations, programs and personnel required for servicing DMO members.
Membership Coordinator: Updates membership records for the DMO’s database. Handles subscription and/or membership orders.
Director/Manager Partnerships/Sponsorships: Manage member, partner and sponsor relationships. Fulfill and service all contract obligations and assists in retention and recruitment. Works closely with marketing.
FINANCE/OPERATIONS/ADMINISTRATION
VP/Director of Finance/Administration: Manages DMO operations and administration as well as administrative supervisory personnel. May also manage human resources. May serve as chief financial officer and direct financial affairs of organization.
Director/Manager of Accounting/Finance: Directs financial management procedures, prepares financial statements/reports and manages accounting personnel.
Accounting Clerk/Bookkeeper: Assists with data entry, review of reports and other support duties. Can help with segregation of accounting duties.
Director/Manager of Human Resources: Directs staff recruitment, training, development, compensation and benefit planning and all compliance programs. Maintains personnel records and human resource information systems.
Office Manager: Oversees general operations of the office on a day-to day basis; may oversee secretarial, printing and mailroom staff.
Supervisor, Printing/Mailing/Copying: Supervises and performs general mailing/shipping, in-house printing/copying functions for organization.
Executive Assistant: Provides principal administrative support to chief executive or other top management personnel. Can serve as liaison with voluntary leadership. Performs clerical duties or other administrative tasks. May manage other support personnel.
Administrative Assistant/Secretary: Provides principal secretarial/administrative support to department heads or managers. May provide clerical support to other personnel.
Receptionist: Greets visitors, answers routine questions about DMO. May also include switchboard operation and light clerical duties.
TECHNOLOGY
Director/Manager Information Services/Systems: Directs all aspects of DMO’s technology systems and services. Identifies, manages and solves technology problems. In some cases, provides technology training to DMO staff. Manages other IS personnel.
Technical Support/LAN Administration: Responsible for in-house technical support of computer systems, including hardware and software installation and trouble-shooting.

2014 DMO Compensation & Benefits Study 144 Destination & Travel Foundation
Survey Questionnaire

2014 DMO Compensation & Benefits Study 145 Destination & Travel Foundation

2014 DMO Compensation & Benefits Study 146 Destination & Travel Foundation

2014 DMO Compensation & Benefits Study 147 Destination & Travel Foundation

2014 DMO Compensation & Benefits Study 148 Destination & Travel Foundation

2014 DMO Compensation & Benefits Study 149 Destination & Travel Foundation